
ABSTRACT
The New Zealand Active Faults Database (NZAFD) is a national geospatial database of active faults – including their locations, names and degrees of activity – that have deformed the ground surface of New Zealand within the last 125,000 years. The NZAFD is used for geological research, hazard modelling and infrastructure planning and is an underlying dataset for other nationally significant hazard applications such as the National Seismic Hazard Model. Recent refinements to the data structure have improved the accuracy of active fault locations and characteristics. A subset of active fault information from the NZAFD, generalised for portrayal and use at a scale of 1:250,000 (and referred to as NZAFD250), is freely available online and can be downloaded in several different formats to suit the needs of a range of users including scientists, governmental authorities and the general public. To achieve a uniform spatial scale of 1:250,000 a simplification of detailed fault locational data was required in some areas, while in other areas new mapping was necessary to provide a consistent level of coverage. Future improvements to the NZAFD will include the incorporation of data on active folds and offshore active faults.
Introduction
Active faults pose a natural hazard to our communities and infrastructure. They are the cause and manifestation of ground surface deformation that accompanies energy release during significant earthquakes. Understanding the locations and characteristics of New Zealand's active faults is important for defining associated hazards and risks and identifying measures for risk mitigation. Active faults are critical components of hazard models which in turn inform building codes, guidelines and standards.
In New Zealand, an active fault is defined as a fault that shows evidence of surface rupture or ground deformation within the last 125,000 years. This definition was selected because late Quaternary deposits and surfaces formed during this time period are widespread throughout New Zealand and have been used on many published maps of New Zealand geology (e.g. Officers of the Geological Survey Citation1983; Forsyth et al. Citation2008). The North Island's Taupo Volcanic Zone is an exception where the definition of activity has been restricted to faults with evidence of rupture during the last 25,000 years. This is a special case because: (1) tectonically, the region appears to have evolved rapidly towards a narrow zone of faulting known as the Taupo Rift (Villamor & Berryman Citation2001); (2) active faults in the Taupo Rift are commonly expressed by fault scarps that cut pyroclastic and fluvial deposits that are c. 25,000 yr in age or younger, particularly marked by the Oruanui eruption sequence or its reworked products (Manville & Wilson Citation2004; Leonard et al. Citation2010; Vandergoes et al. Citation2013); and (3) due to the nature of extension and subsidence within the rift, Oruanui and post-Oruanui pyroclastics largely obscure most older deposits and former land surfaces.
GNS Science maintains the New Zealand Active Faults Database (NZAFD), a national database of information on active faults that have deformed onshore New Zealand during the Late Pleistocene and Holocene (). The NZAFD is an important (and arguably nationally significant) database and is used for hazard modelling, geological research, infrastructure planning and provision of information to the general public. The database consists of line feature geometry using Geographic Information Systems (GIS) software that represents the location of past surface fault rupture and geological information about each active fault (attributes). The data in the NZAFD vary in locational accuracy and quality because of the variety of methods used in data capture (e.g. aerial photo interpretation, theodolite surveying, differential GPS), the scale of capture and the reasons for which the data were recorded. A recent review of the NZAFD highlighted a need to address inconsistencies with the location (stored GIS geometry) and accuracy and consistency of some of the attributes (Langridge et al. Citation2014a). This applies in particular to legacy data with limited source information, as well as some geometrical variance with active fault data from the recently completed 1:250,000 Geological Map of New Zealand (QMAP) series (Rattenbury Citation2012; Rattenbury & Isaac Citation2012; Heron Citation2014). Accordingly, a peer review and update was made of the NZAFD, focusing on a ‘view’ of active fault features suitable for portrayal at 1:250,000 scale. This view of the database is identified as the NZAFD250 and is available for display and download at http://data.gns.cri.nz/af ().
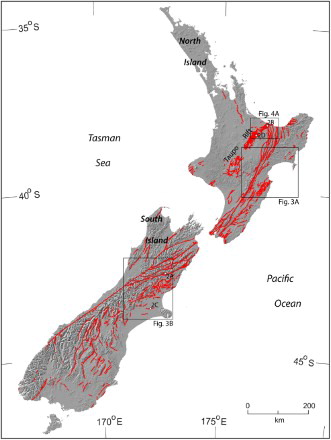
Figure 1. Map of New Zealand highlighting the active faults presented in the NZAFD250 view (red). Locations of photo images in are identified with white stars. The map highlights three areas that are discussed in more detail in and .
The main purpose of the NZAFD250 dataset is to provide active fault data in a freely available, homogeneous and quality-controlled fashion at a consistent scale for a broad end-user audience. This update transitions towards a future comprehensive update based on higher-resolution aspects of the NZAFD that have specific utility for more detailed land use planning and hazard mitigation. This paper documents the development of the NZAFD250 dataset, describes the methods for reconciling conflicting data, describes the geological attributes of the NZAFD250, explains the limitations of these data for use at 1:250,000 scale, places the NZAFD into context with other national and international databases and outlines the future direction for the NZAFD. We expect the NZAFD250 to be of broad use to scientific researchers, students, consultants, statutory councils, corporate entities and the general public.
Background
Improving our understanding of onshore active faults through mapping and characterisation has been a core task of GNS Science and its geological survey predecessors since active faults were first recognised as generators of large earthquakes in New Zealand (e.g. Lyell Citation1868; McKay Citation1890). The first systematic regional active fault compilation in New Zealand was undertaken by Wellman (Citation1953) for the South Island. Maps specifically focused on active faults have been published at a range of scales including 1:50,000, 1:63,360 (e.g. Lensen Citation1969; Kieckhefer Citation1979; Ota et al. Citation1981) and 1:2,000,000 (Lensen & Blick Citation1977; Officers of the Geological Survey Citation1983). These maps partly incorporated the style of active fault data attribution in table form that was developed by Wellman (Nathan Citation2005). Beanland (Citation1995) provided one of the first efforts in New Zealand to compile a computer-based digital format of active fault linework and point (site) attributes, in this case for faults of the eastern North Island. With the widespread uptake of Geographic Information System (GIS) technology, maps of active faults were recast into a digital format resulting in a national coverage of active faults as part of a single GIS-based dataset. In the early 2000s a digital relational database (the NZAFD) was built to store and manage the range of observation scales and feature complexities of active faults (Jongens & Dellow Citation2003; Litchfield & Jongens Citation2006). Beginning in the mid-1990s, a 1:250,000-scale geological mapping programme (QMAP) generated a nationwide set of geological maps (Rattenbury Citation2012) that were published from 1996 to 2012 and include active faults as one component (Rattenbury & Isaac Citation2012; Heron Citation2014). The QMAP active fault data were compiled from information available at the time of publication sourced from the NZAFD, new field observations, interpretations drawn from remote sensing data and other published material. After the publication of each QMAP sheet, updated information on active fault locations was incorporated back into the NZAFD.
Another advance regarding active fault mapping came in the early 2000s with the development of the Ministry for the Environment Guidelines concerning active faults (MfE Guidelines, Kerr et al. Citation2003; see also Van Dissen et al. Citation2006). The MfE Guidelines recommend that, for the purpose of mitigating surface fault rupture hazard, active faults should be mapped in detail, the recurrence interval (i.e. the average time interval between surface ruptures of a fault) should be determined and fault complexity should be taken into account. Subsequent implementation by regional and territorial councils together with the availability of detailed Digital Elevation Models (DEMs) (e.g. derived from LiDAR) has enabled fault mapping at scales better than 1:15,000 for some parts of the country. As a consequence, the data contained within the NZAFD vary in locational accuracy depending on the source of the data, the collection method and the original purpose of the specific investigation that generated it. There are also varying degrees of commercial sensitivity relating to the data, including open-file data obtained from government research funding and confidential data collected under contract to private-sector clients.
Development of the NZAFD250
The two main phases for development of the NZAFD250 dataset were: (1) design and assembly of the attribute fields and table; and (2) incorporation of the fault trace locational and attribute data. The co-authors worked closely together, comparing datasets and resolving conflicting data, to produce fault trace location and attributes. The attributes selected for the NZAFD250 dataset are relevant for the intended use at a scale of 1:250,000. Brief definitions of these fields are provided in and are expanded upon in Langridge et al. (Citation2014a).
Table 1. Summary of GIS attributes developed for the NZAFD250; refer to Langridge et al. (Citation2014a) for detailed definitions. The five fault parameter attributes displayed in the online version are shaded.
The basic mapping unit of the NZAFD is the fault trace, which is a line of any length that has been mapped to define the ground surface projection and expression of a fault. A fault comprises one to many fault traces. A trace is defined as one individual GIS arc/polyline with a discrete ACCURACY attribute (for definitions see ). Fault scarps are steps in the land surface that coincide with the locations of faults. In practice, an individual trace (i.e. accurate or approximate) will equate to a continuous curvilinear expression of faulting that can be observed on an aerial photograph, DEM or in the field. Commonly along its length, an active fault crosses terrain where no scarp is preserved; this could be due for example to the effects of erosion or the presence of a very young landform (e.g. active river bed). In these instances, geological interpretation combined with interpolation or extrapolation from preserved scarps alongstrike is used to infer a fault's location (as uncertain). For some long faults, fault SECTIONS are defined as an aggregation of one to many fault traces that end at some distinct geographical or structural change in the character of a fault. Often sections are used to respect usage in historical nomenclature, for example where a section of fault has been described for the purposes of an individual study.
For portrayal at a less detailed scale, for example 1:250,000, much of the detailed and site-specific information contained in the NZAFD is generalised and grouped to provide a more representative overview of fault character. For example, the DIP of a fault in outcrop may have been measured at a single location, but this measurement is not necessarily representative of the fault as a whole. Generalised attribute information may in fact be more accurate than a single measurement or observation that has only local relevance. The NZAFD250 view utilises several new fields developed in the NZAFD that generalise numerical ranges with more broadly defined text. For example, rather than presenting values the SLIP_RATE field has been grouped into five text categories: very low (≤0.2 mm a–1); low (0.2 to ≤1 mm a–1); moderate (1 to ≤5 mm a–1); high (5 to ≤10 mm a–1); and very high (≥10 mm a–1).
The NZAFD250 view is constructed using GIS data from: (1) the NZAFD; (2) QMAP; (3) recent active fault mapping reports at a local to regional scale (e.g. Van Dissen & Heron Citation2003; Villamor et al. Citation2005, Citation2010; Villamor & Wilson Citation2007; Langridge et al. Citation2011; Barrell & Townsend Citation2012); and (4) new GIS data compiled during the review process. Before digitisation and data capture, all sources of active fault data were displayed and reviewed in a GIS where they could be compared to a range of reference data including satellite orthophotography, DEMs, georeferenced aerial photographs and geological and topographic maps. For each fault trace, decisions were made about the spatial accuracy of the mapping of each fault trace and how it could best be depicted at 1:250,000. As many traces as possible that were thought to be important for identifying the extent of surface fault rupture hazard were included and their attributes were also developed simultaneously. The final process was a review at 1:250,000 scale of the location and attribution of each trace.
The NZAFD250 online
The NZAFD web map application (http://data.gns.cri.nz/af/) has been updated to provide a more streamlined view and facilitate the download of data as ESRI ArcGIS shapefile, Google Earth .kml and .txt files. A download represents a snapshot of the NZAFD250 at that time. Periodic updates are envisioned in the future. A statement of the limitations of use for the NZAFD250 is also provided, particularly in regard to scale (see disclaimer in Langridge et al. Citation2014a). Despite the limitations of scale and accuracy, the online zoom capability has been loosened so that a fault trace can be viewed at a local scale. For example, faults can be searched for by NAME (e.g. Wairarapa Fault). Once a fault is selected from a drop-down list, the attributes for that fault can be viewed. It is possible to view a table of the key active fault parameters drawn from the attribute fields (DOM_SLIPTYPE, SLIP_RATE, DISPLACEMENT, REC_INTERVAL, LAST_EVENT) (see ). These five parameters characterise the general activity and can help to inform the seismic hazard posed by a fault. Many named, active faults are accompanied by a series of oblique aerial photographs showing active fault topographic features (), and a reference list of relevant published information.
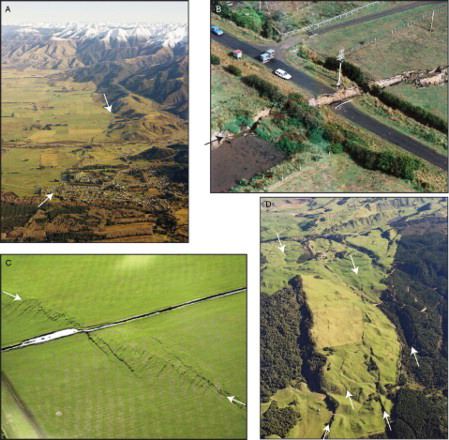
Figure 2. Oblique aerial photograph examples of active faults in New Zealand; traces highlighted by arrows. A, The Hanmer Fault in north Canterbury at the foot of the Hanmer Range. B, The 1987 surface rupture trace of the Edgecumbe Fault, Bay of Plenty. C, The 2010 surface rupture trace of the Greendale Fault, Canterbury. D, Closely spaced normal faults in the northern part of the Taupo Rift (Photographs: A, B, D: DL Homer, GNS Science; C: R Jongens, GNS Science).
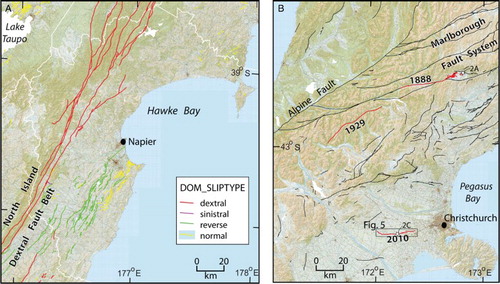
Both online and within a GIS, the NZAFD250 view can be portrayed in many different ways to optimise its utility. shows two examples: in one case faults in the Hawke's Bay have been selected by the DOM_SLIPTYPE field (i.e. sense of movement; A), while in B faults of the central South Island that have ruptured since AD 1840 (i.e. LAST_EVENT = historical) have been selected from all active faults in that area.
Figure 3. Examples of how to view the NZAFD250 data using a GIS or online. A, Selection of faults by style (DOM_SLIPTYPE) in the Hawke's Bay region (within white line). B, Selection of faults that have produced surface rupture (LAST_EVENT) in the historical period (red) among active faults of the central South Island (black). Locations of photo images in are identified with white stars.
Discussion
NZAFD250 and other databases
The NZAFD250 view is a digital representation of active faults in onshore New Zealand () that differs slightly from the active fault component of QMAP. Faults shown in QMAP represent generalised boundaries between geological units; the faults are improved in the NZAFD250 through additional interpretation of remote imagery to include all features of the active surface trace (expressed across youthful landscapes). In some areas, there are many closely spaced parallel and branching faults (e.g. Taupo Rift) that may not be clearly visible when displayed at 1:250,000 (). While this means that the NZAFD250 is technically not optimised for a single scale, it was thought that the benefits of including these traces (i.e. for informing faulting hazard) outweighed the need for pictorial clarity at 1:250,000 scale. The NZAFD250 will continue to provide information for future updates of QMAP, and similarly any updates to QMAP fault data will be included in updates to the NZAFD.
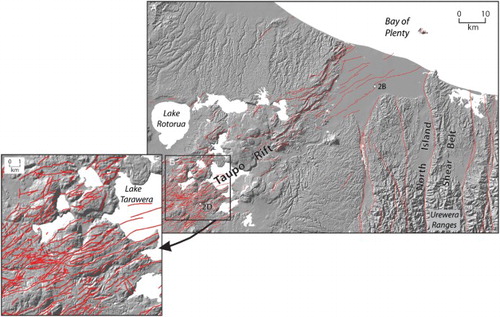
Figure 4. Examples of mapping closely spaced faults in the Bay of Plenty region in the NZAFD250. A, Faults in the North Island Shear Belt are broadly spaced compared to the Taupo Rift. B, Faults to the southwest of Lake Tarawera (inset) are very closely spaced but were able to be mapped at a detail that is consistent with a scale of 1:250,000. Locations of photo images in are identified by white stars.
The NZAFD contains essential source data for several nationally significant applications including the Active Fault Model of New Zealand (AFM; Litchfield et al. Citation2014) and the National Seismic Hazard Model (NSHM; Stirling et al. Citation2012). NZAFD data have also been incorporated in the Global Earthquake Model Faulted Earth (GFE; Litchfield et al. Citation2013a; Christophersen et al. Citation2015). As all of these ‘downstream’ applications utilise spatial simplifications of faults for kinematic and hazard modelling purposes that are well served by 1:250,000 scale data, the NZAFD250 has been structured so that attributes and fault locations can be easily integrated into future updates of these models. Outlined below is a summary of these models and how the NZAFD data are used within them.
The Active Fault Model of New Zealand (AFM) is a kinematic model of active faulting in New Zealand, including both onshore and offshore active fault data (Litchfield et al. Citation2013b, Citation2014). The main purpose of the AFM is to provide an understanding of the crustal deformation across the plate boundary of New Zealand using active fault data. The AFM uses fault attributes (dip, dip-direction, sense of movement, rake and slip rate) to assess the kinematics of active deformation across 15 tectonic domains in New Zealand. The breadth of fault data allows the AFM to provide a useful comparison with permanent deformation calculated from GPS velocities (Litchfield et al. Citation2014). The AFM includes significantly simplified locations of NZAFD traces (referred to as fault zones). The location of faults in the AFM therefore cannot be used to provide locations with better accuracy than the NZAFD.
highlights the differences in the spatial representation of a fault at various scales (e.g. 1:5000 versus 1:250,000) and how each portrayal appears across several datasets within GNS Science. The Greendale Fault, which only appeared as an active fault in 2010, is shown as mapped from field observations and LiDAR (A). The high level of detail from the NZAFD has been simplified for QMAP and the NZAFD250 view (B) and further simplified for use with the AFM and NSHM (C). The NZAFD provides the most applicable view for engineering and planning usage (Villamor et al. Citation2012).
Figure 5. Using the Greendale Fault, Canterbury to highlight different views of active fault data sources. A, A view from field observations and LiDAR mapping at a scale of c. 1:5000. B, A simplified view for use at 1:250,000. C, A further simplified view for modelling purposes.
One of the foundational components of the current NSHM (Stirling et al. Citation2012) is the active fault earthquake source model which was developed from active fault data in the NZAFD. The NSHM also uses very simplified fault representations (often only two to three vertices per fault source) to define three-dimensional (surface extent extrapolated to depth) earthquake fault sources with estimated potential earthquake magnitudes and recurrence intervals. During the conversion to earthquake fault sources, many active faults were extended to define longer fault sources based on the geomorphology of mountain fronts and other characteristics such as potential fault section boundaries along major strike-slip faults. Many of the lines denoting earthquake fault sources in the NSHM are the same as the fault zones in the AFM and do not have the intrinsic accuracy with respect to fault location compared to the NZAFD. As for the AFM, the NSHM includes both offshore and onshore fault sources including subduction zone sources.
The GFE neotectonic fault database (Christophersen et al. Citation2015), part of the Global Earthquake Model (GEM), was developed following a review of national databases including those from the United States (Haller et al. Citation1993; Machette et al. Citation2004; Koehler et al. Citation2012), Japan (Yoshioka et al. Citation2005), Italy (Basili et al. Citation2008; Haller & Basili Citation2011), Australia (Clark et al. Citation2012) and New Zealand. The GFE was developed to provide earthquake sources for quantifying seismic hazard at global scale. A few countries, New Zealand being one of them, have relatively comprehensive active fault databases. For these countries, the geological agencies have developed online active fault databases that suit the regional geology and tectonics of that country (i.e. the definition of what is an active fault can vary from country to country, and consequently from database to database). For example, active faults in the Japan database are also defined as those active within the last 125,000 years (Yoshioka et al. Citation2005), but the USA database contains faults active during the Quaternary (defined as the last 1.6 million years; Haller et al. Citation1993; Machette et al. Citation2004) and the Australian database contains faults with evidence of activity within the last 5 million years (Clark et al. Citation2012). As a result, the GFE database retains as many features in common with other databases but, because of its global nature, there are some fundamental and unavoidable differences from country to country. Where a new NZAFD250 field is identical to a GFE field (in terms of scope and content), we use the GFE field names.
The NZAFD250 and surface-rupture hazard
In addition to earthquake shaking, another hazard associated with active faults is ground-surface rupture or deformation, i.e. where the fault movement breaks the ground surface causing relative displacement across the fault. One use of an active fault database is to provide locational information about surface-rupture hazard so that the hazard can be addressed through avoidance and/or engineering solutions. As explained in the MfE Guidelines, surface fault rupture is only a significant hazard in a relatively narrow corridor defined by the width of the zone of surface rupture deformation (typically only metres to tens of metres wide, but can be up to hundreds of metres wide in certain instances). The hazard can therefore be avoided if precise fault mapping is available. The NZAFD250 view can be used to inform the general location of a potential surface rupture hazard but, due to its 1:250,000 scale, cannot be used for detailed planning or hazard avoidance purposes. Rather, the NZAFD250 view dataset provides a means to highlight areas where there is potential for surface rupture and where more detailed assessment is desirable. Barrell et al. (Citation2015) conducted a review of fault rupture hazard for the Canterbury region and outlined recommendations of the use of 1:250,000 scale active fault mapping data. A key recommendation is to develop Fault Awareness Areas (FAA) as a means of delineating areas where fault surface rupture may pose a hazard but location data may currently be insufficient to define Fault Avoidance Zones (FAZ) applicable to the MfE Guidelines for detailed (prescriptive) land use planning purposes.
Future directions
A major emphasis of future active fault mapping will include the use of high-quality DEMs (e.g. those derived from LiDAR) that can be used to map active faults in unprecedented detail and improve precision. LiDAR DEMs are becoming more readily available at both regional and local scales, and can be used for both scientific (e.g. Begg & Mouslopoulou Citation2010; Langridge et al. Citation2014b) and increasingly for planning purposes (e.g. Villamor et al. Citation2010, Citation2012).
The NZAFD250 documents mainly on-land fault traces and at present the database contains only a few offshore active faults (e.g. the Akatore and Green Island faults near Dunedin). Offshore faults have primarily been mapped by marine geologists at the National Institute of Water and Atmosphere (NIWA; e.g. Lamarche et al. Citation2005; Pondard & Barnes Citation2010). Active faults are also known to occur beneath lakes (e.g. Rotoroa, Taupo) and harbours (e.g. Port Nicholson). Active fault data from seismic sections and bathymetry will be used to define faults that offset late Quaternary strata or indeed the seabed. Offshore active fault data are shared between NIWA and GNS Science and have been used to develop seismic sources for the NSHM and AFM and also identify regionalal to local tsunamigenic sources around New Zealand (Berryman Citation2005; Power Citation2013).
Active folds have been mapped on QMAP and active fault maps (e.g. Officers of the Geological Survey Citation1983; Cox and Barrell Citation2007; Forsyth et al. Citation2008) and are relevant features of active deformation, especially where related to reverse and/or blind faults. However, at this time only a few active folds (e.g. Brunner Anticline in Westland and Elsthorpe Anticline in Hawke's Bay) have been included in the NZAFD250. Following the 2010–2011 Canterbury earthquake sequence, the critical importance of considering blind faults near urban centres has become obvious (Dorn et al. Citation2010; Canterbury Earthquakes Royal Commission Citation2012). Blind faults are difficult to represent in active fault databases, and surface folds may often be their only form of geomorphic expression (see Hull Citation1990). Despite these challenges, active folds are intended to be included in future refinements of the NZAFD.
There are undoubtedly other as-yet unrecognised active tectonic structures throughout New Zealand that are not currently within the NZAFD. For example, considerable effort has been put into estimating the seismic hazard posed by potentially active faults within the Southern Alps east of the Main Divide (Cox et al. Citation2012). Faults in that area have been modelled as potential earthquake sources for inclusion in the NHSM and as kinematically viable structures in the AFM as they are inferred to accommodate a portion of the geologic strain budget across the central South Island (Wallace et al. Citation2007). However, at present these faults cannot be included in the NZAFD because there is no preserved physical evidence of their having offset late Quaternary deposits or landforms that categorically prove their activity, due to the high rate of landscape modification within the central Southern Alps. Fault trace and attribute data will be updated by the Earthquake Geology team at GNS Science as new information becomes available.
Summary
The NZAFD250 is a new view of the New Zealand Active Faults Database, containing freely available, quality-checked/controlled active fault trace and attribute data at a scale of 1:250,000. These data have primarily been compiled from a range of pre-existing data sources, including QMAP. To achieve a scale of 1:250,000 has required a simplification of detailed data in some areas while in other areas new mapping to provide a complete coverage was necessary. Data in the NZAFD250 are available for download from, or can be viewed on, the GNS website (http://data.gns.cri.nz/af/). Fault trace and attribute data will be updated by the GNS Earthquake Geology team as new data become available and users should consider refreshing their NZAFD download on an annual basis. Future plans include the incorporation of active folds and offshore faults, as well as maintaining and updating high-resolution active fault data (NZAFD) in house at GNS Science that can be used for planning purposes and site specific studies. The NZAFD has proven to be an essential national asset for seismic hazard and risk reduction as exemplified by the variety of significant resources that utilise it (e.g. the NSHM and its use in the New Standard for Structural Design Actions – Earthquakes (the New Zealand Building Code), the MfE Guidelines and their use by planners to assist in the mitigation of surface fault rupture hazard). The NZAFD has improved the scientific understanding of how New Zealand is deforming tectonically over the late Quaternary. We encourage users to download and utilise the database.
Acknowledgements
We thank Richard Thomas and David Hewitt for their help developing the IT components of the updated New Zealand Active Faults Database. This paper was reviewed by two anonymous reviewers and we thank them for their comments that improved the clarity of our message.
Guest Editor: Dr Ian Hamling.
Disclosure statement
No potential conflict of interest was reported by the authors.
Additional information
Funding
References
- Barrell DJA, Gadsby M, Jack H. 2015. Canterbury Region: guidelines for using active fault information. GNS Science Consultancy Report 2014/211. Lower Hutt: GNS Science.
- Barrell DJA, Townsend DB. 2012. General distribution and characteristics of active faults and folds in the Hurunui District, North Canterbury. GNS Science Consultancy Report 2012/113. Lower Hutt: GNS Science.
- Basili R, Valensise G, Vannoli P, Burrato P, Fracassi U, Mariano S, Tiberti MM, Boschi E. 2008. The Database of Individual Seismogenic Sources (DISS), version 3: summarizing 20 years of research on Italy's earthquake geology. Tectonophysics. 453:20–43. doi: 10.1016/j.tecto.2007.04.014
- Beanland S. 1995. The North Island Dextral Fault Belt, Hikurangi subduction margin, New Zealand [Unpublished PhD thesis]. Wellington: Victoria University of Wellington.
- Begg JG, Mouslopoulou V. 2010. Analysis of late Holocene faulting within an active rift using lidar, Taupo Rift, New Zealand. J Volcanol Geoth Res. 190:152–167. doi: 10.1016/j.jvolgeores.2009.06.001
- Berryman KR, complier. 2005. Review of tsunami hazard and risk in New Zealand. GNS Science Consultancy Report 2005/104. Lower Hutt: GNS Science.
- Canterbury Earthquake Royal Commission. 2012. The Canterbury Earthquakes Royal Commission: final report. Volume 1. Summary and recommendations in volumes 1–3, seismicity, soils and the seismic design of buildings. Christchurch : CERC . Available from: http://canterbury.royalcommission.govt.nz/
- Christophersen A, Litchfield N, Berryman K, Thomas R, Basili R, Wallace L, Ries W, Hayes G, Haller K, Toshikazu Y, et al. 2015. Development of the Global Earthquake Model's neotectonic fault database. Nat Hazards. doi:10.1007/s11069-015-1831-6.
- Clark D, McPherson A, Van Dissen R. 2012. Long-term behaviour of Australian stable continental region (SCR) faults. Tectonophysics. 566–567:1–30. doi: 10.1016/j.tecto.2012.07.004
- Cox SC, Barrell DB, compilers. 2007. Geology of the Aoraki area. Institute of Geological and Nuclear Sciences 1: 250,000 Geological Map 15. Lower Hutt: Institute of Geological and Nuclear Sciences.
- Cox SC, Stirling MW, Herman F, Gerstenberger M, Ristau J. 2012. Potentially active faults in the rapidly eroding landscape adjacent to the Alpine Fault, central Southern Alps, New Zealand. Tectonics. 31. doi:10.1029/2011TC003038.
- Dorn C, Green AG, Jongens R, Carpentier S, Kaiser AE, Campbell F, Horstmeyer H, Campbell J, Finnemore M, Pettinga J. 2010. High-resolution seismic images of potentially seismogenic structures beneath the northwest Canterbury Plains, New Zealand. J Geophys Res. 115:B11303. doi:10.1029/2010JB007459.
- Forsyth PJ, Barrell DJA, Jongens R, compilers. 2008. Geology of the Christchurch area. Institute of Geological and Nuclear Sciences 1: 250,000 Geological Map 16. Lower Hutt: Institute of Geological and Nuclear Sciences.
- Haller KM, Basili R. 2011. Developing seismogenic source models based on geologic fault data. Seismol Res Lett. 82:519–525. doi: 10.1785/gssrl.82.4.519
- Haller KM, Machette MN, Dart RL. 1993. Maps of major active faults, Western Hemisphere International Lithosphere Program (ILP) Project II-2: guidelines for U.S. database and map, June 1993. USGS Open-File Report 93–338. Denver, CO: US Department of the Interior, US Geological Survey; [cited 2016 Feb 8]. Available from: http://pubs.usgs.gov/of/1993/0338/report.pdf
- Heron DW (custodian). 2014. Geological map of New Zealand 1: 250,000. GNS Science Geological Map 1. Lower Hutt: GNS Science.
- Hull AG. 1990. Tectonics of the 1931 Hawke's Bay earthquake. New Zeal J Geol Geophys. 33:309–320. doi: 10.1080/00288306.1990.10425689
- Jongens R, Dellow G. 2003. The Active Faults Database of NZ: data dictionary. Institute of Geological and Nuclear Sciences Science Report 2003/17. Lower Hutt: Institute of Geological and Nuclear Sciences.
- Kerr J, Nathan S, Van Dissen R, Webb P, Brunsdon D, King A. 2003. Planning for development of land on or close to active faults: a guideline to assist resource management planners in New Zealand. Institute of Geological and Nuclear Sciences Client Report 2002/124. Lower Hutt: Institute of Geological and Nuclear Sciences.
- Kieckhefer RM. 1979. Sheets M31D, N31A, N31C, and parts of M32A and M32B Leader Dale. 1st ed. Sheets N31B and N31D Dillon. Late Quaternary Tectonic map of New Zealand 1:50 000. Wellington: Department of Scientific and Industrial Research.
- Koehler RD, Farrell R-E, Burns PAC, Combellick RA. 2012. Quaternary faults and folds in Alaska: a digital database. Alaska Division of Geological & Geophysical Surveys Miscellaneous Publication 141. Fairbanks, AK: Alaska Department of Natural Resources, Division of Geological & Geophysical Surveys (DGGS).
- Lamarche G, Proust J-N, Nodder SD. 2005. Long-term slip rates and fault interactions under low contractional strain, Wanganui Basin, New Zealand. Tectonics. 24:1–30. doi: 10.1029/2004TC001699
- Langridge RM, Ries WF, Farrier T, Barth NC, Khajavi N, De Pascale GP. 2014b. Developing sub 5-m LiDAR DEMs for forested sections of the Alpine and Hope faults, South Island, New Zealand: implications for structural interpretations. J Struct Geol. 64:53–66. doi:10.1016/j.jsg.2013.11.007.
- Langridge RM, Ries WF, Litchfield NJ, Van Dissen RJ, Villamor P. 2014a. The 1:250,000 Active Faults Database of New Zealand: database description and data dictionary. GNS Science Report 2014/11. Lower Hutt: GNS Science.
- Langridge RM, Trayes M, Ries W. 2011. Designing and implementing a Fault Avoidance Zone strategy for the Alpine Fault in the West Coast region. In: Building an earthquake-resilient society. Proceedings of the Ninth Pacific Conference of Earthquake Engineering, 14–16 April, 2011, Auckland, New Zealand. Wellington: New Zealand Society for Earthquake Engineering Inc.; paper 202; [cited 2016 Feb 8]. Available from: http://www.nzsee.org.nz/db/2011/202.pdf
- Lensen GJ. 1969. Sheet N153 Eketahuna. Late Quaternary tectonic map of New Zealand, 1:63,360. Wellington: Department of Scientific and Industrial Research.
- Lensen GJ, Blick GH. 1977. Late Quaternary tectonic map of New Zealand. Scale 1:2,000,000. 1st ed. NZ Geological Survey Miscellaneous Series Map 12. Wellington: Department of Scientific and Industrial Research.
- Leonard GS, Begg JG, Wilson CJN, compilers. 2010. Geology of the Rotorua area. Institute of Geological and Nuclear Sciences 1:250,000 Geological Map 5. Lower Hutt: GNS Science.
- Litchfield N, Jongens R. 2006. Active Faults Database of New Zealand. In: Earthquakes and urban development. Proceedings of the New Zealand Geotechnical Society Symposium, Nelson, 2006. Wellington: The New Zealand Geotechnical Society; p. 327–340.
- Litchfield N, Wyss B, Christophersen A, Thomas R, Berryman K, Henshaw P, Villamor P. 2013a. Guidelines for compilation of neotectonic faults, folds and fault sources: report produced in the context of the GEM Faulted Earth. GNS Science Miscellaneous Series 57. Lower Hutt: GNS Science.
- Litchfield NJ, Van Dissen R, Sutherland R, Barnes PM, Cox SC, Norris R, Beavan RJ, Langridge R, Villamor P, Berryman K, et al. 2013b. A model of active faulting in New Zealand: fault zone parameter descriptions. GNS Science Report 2012/19. Lower Hutt: GNS Science.
- Litchfield NJ, Van Dissen, RJ, Sutherland R, Barnes PM, Cox SC, Norris R, Beavan RJ, Langridge RM, Villamor P, Berryman KR, et al. 2014. A model of active faulting in New Zealand. New Zeal J Geol Geophys. 57:32–56. doi:10.1080/00288306.2013.854256.
- Lyell C. 1868. Principles of physical geology. 10th ed. London: John Murray.
- Machette M, Haller K, Wald L. 2004. Quaternary Fault and Fold Database for the nation. United States Geological Survey Fact Sheet 2004–3033. Denver, CO: Earthquake Hazards Program, US Department of the Interior, US Geological Survey; [cited 2016 Feb 8]. Available from: http://pubs.usgs.gov/fs/2004/3033/FS2004-3033.pdf
- Manville V, Wilson CJN. 2004. The 26.5 ka Oruanui eruption, New Zealand: a review of the roles of volcanism and climate in the post-eruptive sedimentary response. New Zeal J Geol Geophys. 47:525–547. doi: 10.1080/00288306.2004.9515074
- McKay A. 1890. On the earthquakes of September 1888, in the Amuri and Marlborough Districts of the South Island. New Zeal Geol Surv Report Geol Explor. 20:1–16.
- Nathan S. 2005. Harold Wellman: a man who moved New Zealand. Wellington: Victoria University Press.
- Officers of the New Zealand Geological Survey. 1983. Late Quaternary Tectonic map of New Zealand 1:2,000,000. 2nd ed. New Zealand Geological Survey Miscellaneous Series Map 12. Wellington: Department of Scientific and Industrial Research.
- Ota Y, Williams DN, Berryman KR. 1981. Part sheets Q27, R27 and R28 – Wellington. Late Quaternary Tectonic map of New Zealand 1:50,000. Wellington: Department of Science and Industrial Research.
- Pondard N, Barnes PM. 2010. Structure and paleoearthquake records of active submarine faults, Cook Strait, New Zealand: implications for fault interactions, stress loading, and seismic hazard. J Geophys Res. 115:B12320. doi:10.1029/2010JB007781.
- Power WL, compiler. 2013. Review of tsunami hazard in New Zealand (2013 update). GNS Science Consultancy Report 2013/131. Lower Hutt: GNS Science.
- Rattenbury MS. 2012. Completion of a new national geological map series: the QMAP project. New Zeal Sci Rev. 62:41–46.
- Rattenbury MS, Isaac MJ. 2012. The QMAP 1:250 000 Geological Map of New Zealand project. New Zeal J Geol Geophys. 55:393–405. doi:10.1080/00288306.2012.725417.
- Stirling MW, McVerry GH, Gerstenberger MC, Litchfield NJ, Van Dissen RJ, Berryman KR, Barnes P, Wallace LM, Villamor P, Langridge RM, et al. 2012. National seismic hazard model for New Zealand: 2010 update. B Seismol Soc Am. 102:1514–1542. doi:10.1785/0120110170.
- Van Dissen R, Heron D. 2003. Earthquake fault trace survey, Kapiti Coast District. Institute of Geological and Nuclear Sciences Client Report 2003/77. Lower Hutt: Institute of Geological and Nuclear Sciences.
- Van Dissen R, Heron D, Becker J, King A, Kerr J. 2006. Mitigating active fault surface rupture hazard in New Zealand: development of national guidelines, and assessment of their implementation. In: Proceedings of the 8th U.S. National Conference on Earthquake Engineering, San Francisco, California, 18–22 April, 2006. Oakland, CA: EERI; paper 633.
- Vandergoes MJ, Hogg AG, Lowe DJ, Newnham RM, Denton GH, Southon J, Barrell DJA, Wilson CJN, McGlone MS, Allan ASR, et al. 2013. A revised age for the Kawakawa/Oruanui tephra, a key marker for the Last Glacial Maximum in New Zealand. Quaternary Sci Rev. 74:195–201. doi:10.1016/j.quascirev.2012.11.006.
- Villamor P, Berryman K. 2001. A late Quaternary extension rate in the Taupo Volcanic Zone, New Zealand, derived from fault slip data. New Zeal J Geol Geophys. 44:243–269. doi: 10.1080/00288306.2001.9514937
- Villamor P, Litchfield N, Barrell D, Van Dissen R, Hornblow S, Quigley M, Levick S, Ries W, Duffy B, Begg J, et al. 2012. Map of the 2010 Greendale Fault surface rupture, Canterbury, New Zealand: application to land use planning. New Zeal J Geol Geophys. 55:223–230. doi:10.1080/00288306.2012.680473.
- Villamor P, Lukovic B, Gonzalez, A. 2005 Active fault mapping in the Te Mihi area. Institute of Geological and Nuclear Sciences Client Report 2005/180. Lower Hutt: Institute of Geological and Nuclear Sciences.
- Villamor P, Ries W, Zajac A. 2010. Rotorua District Council hazard studies; active fault hazards. GNS Science Consultancy Report 2010/182. Lower Hutt: GNS Science.
- Villamor P, Wilson KJ. 2007. Active fault mapping at Mapara Valley, Taupo District. GNS Science Letter Report 2007/289LR. Lower Hutt: GNS Science.
- Wallace LM, Beavan RJ, McCaffrey R, Berryman KR, Denys P. 2007. Balancing the plate motion budget in the South Island, New Zealand using GPS, geological and seismological data. Geophys J Int. 168:332–352. doi:10.1111/j.1365-246X.2006.03183.x.
- Wellman HW. 1953. Data for the study of Recent and late Pleistocene faulting in the South Island of New Zealand. New Zeal J Sci Technol. B34:270–288.
- Yoshioka T, Awata Y, Shimokawa Y, Fusejima Y. 2005. Explanatory text of the rupture probability map of major active faults in Japan. Tectonic Map Series 14. Japan: Geological Survey of Japan (GSJ), AIST.