
ABSTRACT
An intertidal rocky platform tucked in behind a rocky headland on open-ocean Gibson Beach, near Raglan, supports an agglomeration of cobble- to large-boulder-sized clasts of Cenozoic sandstone and limestone. Rather than exhibiting just point contacts, many larger clasts are tightly interlocked and fitted with their neighbours and/or the underlying platform bedrock. Clast interface geometry relates to the strength contrast between adjacent rock types, linked to their calcite (cement) content. The end-product is an armoured, highly stable framework of boulder clasts resembling a giant three-dimensional jigsaw puzzle. While the direct impact of breaking waves likely plays a role in in situ jostling of boulders, we speculate that mechanical abrasion and fitting between larger clasts may also be promoted and maintained by in situ microvibration of the boulders as a consequence of wave-induced microseismic shaking within the cliff-backed rocky platform and headland, especially during major storm wave assault from the southwest.
Introduction
Coarse-grained beach deposits of cobble- to boulder-sized material are common around the world (Nott Citation2003; Paris et al. Citation2011); however, our general understanding of them lags behind that of sand beaches because of their long morphological response times and the difficulty of fully characterising large clasts (e.g. McKenna Citation2005; Chen et al. Citation2011; Orford & Anthony Citation2011). Our current understanding of boulder dynamics during storm events is limited and to date there is no published work tracking boulder movements during contemporary storm events (e.g. Goto et al. Citation2007; Stephenson & Naylor Citation2011).
Here we record an isolated example of clast-supported boulder deposits covering the wave ramp of the modern intertidal rocky shore platform just beyond the northern end of Gibson Beach proper on the west coast of central North Island, New Zealand (A, B). The occurrence, noted during a detailed geological study of the middle Tertiary sedimentary rocks exposed in the coastal cliffs (Hood & Nelson Citation2012), is unusual because many of the larger coarse cobble- to boulder-sized clasts on the platform exhibit mutually interpenetrating surfaces with their neighbours to form a three-dimensional tightly interlocked mosaic of clasts.
Figure 1. A, Simplified map of New Zealand showing location of Gibson Beach (GB) enlarged in B to show some other place names and location of the offshore site for wind and wave data provided by Dr Richard Gorman (NIWA, Hamilton). C, Plan view of castle-like coastal promontory at the northern end of Gibson Beach proper and the series of small-rock-buttressed alcoves (A1–5) floored by rock platforms and benches of sandstone or limestone. Black dots represent boulder accumulations and bold arrow represents prevailing southwesterly wind and swell wave directions. F, fault.
Seemingly, the only documentation in the global coastal literature about such a ‘fitted fabric’ phenomenon comes from some other New Zealand and Australian examples described several decades ago in short Nature and Geology articles by Shelley (Citation1968), Hills (Citation1970) and Bishop and Hughes (Citation1989). Shelley (Citation1968) documented often intricate contact features between large (up to 3 m across) moraine boulders and with the underlying bedrock on some coastal and lake rocky shorelines in South Island, New Zealand. Hills (Citation1970) suggested that fitted boulders were not uncommon on the Victorian coast of Australia and used the terms ‘fretting’ or ‘imprisoned’ boulders to describe the development of common interfaces between adjacent boulders, the term ‘imprisoned’ having previously been coined by Baker (Citation1959). Bishop and Hughes (Citation1989) studied fitted boulder examples along a portion of the New South Wales coastline and suggested that they formed soon after the peak of the post-glacial marine transgression about 5 ka and had remained stable since then. While these studies alerted the coastal scientific community to the existence of fitted boulder deposits, they provided few details about clast character, fitting types or possible controls, matters we address and speculate upon here for the fitted boulder occurrences at Gibson Beach.
Physical setting
Geomorphology
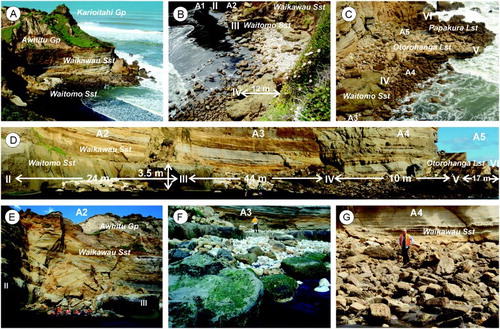
Gibson Beach (latitude 37.4°S) is a remote, sometimes cliff-backed, variably rocky to sandy stretch of shoreline on the west coast of central North Island, New Zealand (A, B). According to Beavan and Litchfield (Citation2012), the long-term (<125 ka) vertical rate of tectonic movement on this coastline is close to zero. The studied boulder-rich section, c. 150 m long, is immediately north of a 20–80 m high rock promontory of limestone and sandstone at the far northern end of Gibson Beach proper (C, ), but for convenience we retain the name Gibson Beach for the study site throughout the text. This section is inaccessible near either side of high tide. It is backed by a near-vertical 20+ m high cliff of sandstone and comprises several small rock-buttressed alcoves (labelled A1–5), each 10–45 m across and with northerly to westerly facing aspect. The alcoves can be floored by a veneer of titanomagnetite-rich sand variably covering the intertidal rocky platform (A, B), Some are locally backed by a slightly higher (by up to c. 3 m in the north to c. 1 m in the south), stratigraphically controlled dipping bench composed of one or other of the local sedimentary rock units that protrude, because of their greater resistance to erosion (B–F). The alcoves host significant numbers of both loose and fitted boulders (>256 mm) of medium (0.5–1 m), coarse (1–2 m) and very coarse (2–4 m) size (size scheme of Blair & McPherson Citation1999), with less abundant cobble-sized (64–256 mm) clasts (B–G). The clasts lack any obvious imbrication fabrics and have mainly accumulated within the fair-weather intertidal setting, but locally also on the protruding rocky benches (). Using the typology scheme of Paris et al. (Citation2011), the morphological occurrence of the boulder accumulations at Gibson Beach can be classified as ‘platform boulders’; none are cliff-top boulder deposits (e.g. Hall et al. Citation2006).
Figure 2. A, View south across the study section towards the castle-like promontory at the northern end of Gibson Beach. B, C, Vertical views down onto alcoves A1–5 (see C) from the bounding cliff tops. Roman labels II to IV denote buttresses of Waitomo Sandstone separating alcoves A1, A2, A3, and A4, while labels V and VI are buttresses underlain by Waitomo Sandstone with a variable thin cover of Otorohanga Limestone and/or Papakura Limestone that define alcoves A4 and A5. D, Beach view of alcoves A2–5 with some distance measurements shown. E, Mass failure in 2008/2009 of coastal cliffs backing alcove A2 supplied large fresh angular blocks up to 5 m across of Waikawau Sandstone to the shore platform. F, Large sandstone boulders proximal to the shoreline in alcove A3 trap smaller clasts of predominantly Otorohanga Limestone between them and the Waitomo Sandstone bench seen in the background. G, Area of the main boulder field within alcove A4 showing an agglomeration of clasts of varying character and the backing cliff of Waikawau Sandstone.
Geology
The stratigraphic succession for the wider Gibson Beach area has been discussed by Kear (Citation1966), Hayward and Brook (Citation1984) and Hood and Nelson (Citation2012), and is schematically summarised in along with some petrographic information for the rock units. In a series of fault blocks, the cliff outcrops in the vicinity of the study site expose a succession of unconformity-bound late Oligocene and early Miocene shelf limestones (Otorohanga Limestone, Papakura Limestone) and sandstones (Waitomo Sandstone, Waikawau Sandstone) of the upper Te Kuiti and basal Waitemata Groups. At sea level, the study section itself is underpinned by gently southwestwards-dipping (4°SW) Waitomo Sandstone (A–F, ), while the overlying flaggy Otorohanga Limestone, present in the cliffs immediately to the north and at the southern headland, is mainly absent due to strongly differential pre-Waitemata Group erosion (D; Hood & Nelson Citation2012). Patchily preserved conglomeratic Papakura Limestone overlies the Otorohanga Limestone, followed by well-bedded, orange weathered, variably fossiliferous Waikawau Sandstone that forms the near-vertical cliffs backing the main boulder beach deposits (A–D). This sandstone infills the paleotopography created by the pre-Waitemata Group erosion of the Otorohanga Limestone, and onlaps and overtops the Otorohanga Limestone preserved in the fault block at the southwestern end of the section (C, D). Overlying the middle Tertiary sediments at the study site are late Pliocene–Pleistocene, rusty brown, aeolian and coastal sandstones of the Awhitu and Karioitahi Groups (A).
Figure 3. Stratigraphic succession and thicknesses in the Gibson Beach coastal area, based on Kear (Citation1963, Citation1966), Hayward and Brook (Citation1984) and Edbrooke (Citation2001, Citation2005), along with some petrographic information for the rock units. Italicised units are not present at the study section. New Zealand Stages and ages are after Hollis et al. (Citation2010). Wavy lines are unconformities. Note that the Otorohanga Limestone is entirely missing from parts of the section (e.g. behind alcoves A2–4) due to pre-Waitemata Group strongly differential erosion (e.g. see Hood & Nelson Citation2012).
Oceanography
The remoteness (no vehicle access), ruggedness and high-energy open-ocean aspect of the boulder beach location precludes any field measurements of coastal hydrodynamic data for the site. However, offshore to the southwest Kibblewhite et al. (Citation1982) provided much detailed oceanographic information (waves, tides, circulation, and physical and chemical properties) as background data for development of the drilling platform for the Maui oil and gas field off Cape Egmont (A). Measured over a 5 year period, the important wave statistics were: highest wave 19.5 m; greatest and average significant wave heights 10.5 m and 2–3 m, respectively; wave heights <2 m for only about 36% of the time and >4 m for over 10% of the time; and average wave period 6–7 s, although a persistent swell from the southwest with a period of 12 s occurred much of the time. A significant aspect of the Kibblewhite et al. (Citation1982) report, to which we return later, was the excellent correlation they recorded between the offshore surface wave activity and onshore coastal microseism activity, the latter always being about twice the frequency of the sea waves.
To support the Kibblewhite et al. (Citation1982) wave data, Dr Richard Gorman at NIWA, Hamilton has summarised for us the results of a 45 year (1957–2002) wave hindcast analysis, centred about 16 km offshore from Gibson Beach in 55 m water depth at longitude 174.63°E and latitude 37.69°S (B). Prevailing wind directions from the southwesterly quarter out of the Southern Ocean (and Tasman Sea) occur for almost 50% of the time, with wind strengths averaging 5.3 m s–1 and up to 18 m s–1. Wave train directions are dominantly from the southwest, coincident with the prevailing wind direction (C). The offshore waves have mean and maximum significant heights of c. 2 m and 7.3 m, respectively, while analysis of storm peak significant wave heights gives estimates for the 25 and 100 year return wave heights of some 16 and 20 m, respectively. Mean wave periods average 7 s and peak wave periods 12–13 s.
Tidal range data from Raglan Harbour, 15 km south of Gibson Beach (B), show a MHWS level of 3.3 m and a MLWS of 0.1 m (giving a mean spring range of 3.2 m), and a MHWN of 2.6 m and a MLWN of 0.9 m (or a mean neap range of 1.7 m) (LINZ Citation2013).
Methods
In situ strength testing of 15 boulders and exposed rock outcrops was conducted in the field using a calibrated (at Geomechanics Lab, University of Waikato) L-type (low strength) Schmidt hammer to obtain rebound or R values, a measure of rock hardness (Selby Citation1993; Knight & Burningham Citation2011), following standard procedures (Day & Goudie Citation1977; Brown Citation1981; Aydin & Basu Citation2005). Fresh smooth rock surfaces were tested, but to account for any natural rock heterogeneity 20 readings were taken on each clast and rock outcrop locality (Table S1) and, following convention, the lowest 10 (i.e. 50%) values were discarded (Brown Citation1981). Impact strength index (ISI) was calculated using the relationship in Sharma et al. (Citation2011), where ISI = 0.4388R + 69.916. Unconfined uniaxial compressive strength (UCS) values were determined after Selby (Citation1993) by assuming rock unit weights of c. 26 and c. 23 kN m–3 for limestone and sandstone, respectively. Strength descriptions follow the terminology of Deere and Miller (Citation1966).
Carbonate percentages were determined for 27 representative samples of ring-mill powdered boulder and outcrop lithologies following acid digestion in 1 M HCl (Table S2).
Uncovered and polished thin-sections representative of the main boulder lithologies were examined petrographically under both standard plane-polarised light (PPL) and cathodoluminesent light (CL) to ascertain their textural and compositional make-up and to identify the nature, quantity and pervasiveness of the main cementing agent ().
Results
Fitted fabrics
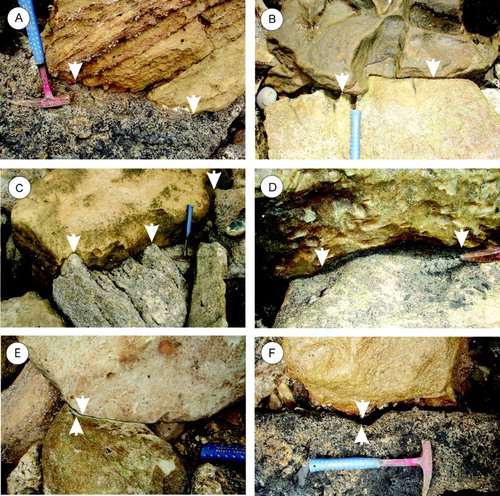
Cursory inspection of the Gibson Beach boulder field suggests little untoward about the boulder packing. However, more focused attention on the clast-to-clast contacts reveals that many neighbouring clasts exhibit mutually interpenetrating contacts with one another (). Some fitted contacts are subtle and weakly developed, occurring simply between only two adjacent boulders or a single boulder upon bedrock (A–C). Others are much more complex and involve an agglomeration of clasts of varying sizes and lithologies that tightly interdigitate and interlock with little or no intervening void spaces, forming a giant three-dimensional jigsaw-like rock mosaic (D, E).
Figure 4. A, Sandstone boulder with its base fitted onto and about the edges of limestone clasts. Note impression on sandstone (upper left) revealed by cobble displacement. B, Pair of fitted medium-sized sandstone boulders on the shoreface. C, Medium boulder-sized sandstone clast tightly and intricately fitting onto jointed Otorohanga Limestone bedrock. D, Tight three-dimensional jigsaw-like fitting of a mosaic of limestone cobbles and small boulders about a heavily eroded central sandstone clast. Sst, sandstone. E, Deeply interpenetrating fitted fabric between two Waikawau Sandstone boulders. F, Trapped small-boulder-sized ‘matrix’ clasts fitting about the margins of a larger very-coarse-sized boulder. In all images, some of the fitted boulder interfaces are delineated by white arrow heads.
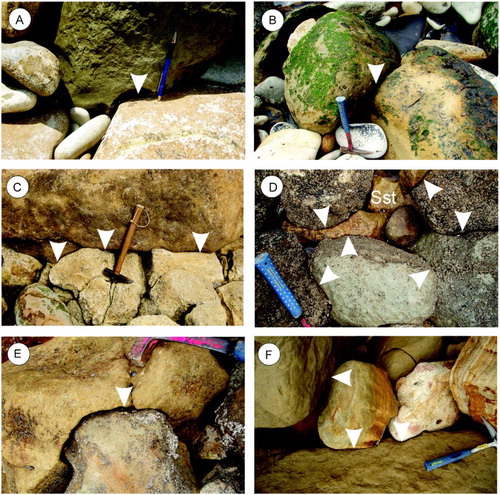
Coarse boulder-sized fitted clast pairs are not uncommon, especially on the shore platform and protruding rock benches, while some medium- to coarse-sized boulders can be founded upon a number of mutual contacts with several underlying boulders or upon limestone bedrock (C). Collections of smaller cobble-sized clasts, sometimes clearly mobile but often also fitted, can fill the voids between larger framework boulders, acting as ‘matrix’ clasts (F).
Clast lithologies
Boulders litter the coastal section throughout alcoves A2–5, and especially within alcoves A3 and A4 that host the main boulder field as well as smaller satellite clusters, pairs or individuals (C, F, G). The lithologies represented come mainly from Waitomo Sandstone, Otorohanga Limestone, Papakura Limestone and Waikawau Sandstone (), although their contributions vary within the individual alcoves.
Well-rounded, oblate, cobble to small boulder size (up to 30 cm) Otorohanga Limestone clasts are especially concentrated in alcoves A2 and A3 (C, B, F). Their size allows a relatively high degree of mobility and so fitted fabrics are absent. The absence of limestone in the backing cliffs supports their derivation via longshore traction from slightly further north, where undercutting of the underlying softer Waitomo Sandstone results in mass failure of overhanging blocks of Otorohanga Limestone onto the coastline. Rare blocks of medium boulder size (0.5–1 m) in alcoves A2 and A3 preserve the flaggy nature of the Otorohanga Limestone in outcrop.
Medium boulder size (0.5–1 m) clasts of the conglomeratic Papakura Limestone are prominent in alcoves A4 and A5 (C, G), and especially upon the rock bench above mean high water level at these localities (C). They have been generated by rip up along the contact with the Otorohanga Limestone in the southwestern part of the section.
The largest and most abundant clasts on the coastline comprise medium (0.5–1 m), coarse (1–2 m) and occasionally very coarse (2–2.5 m) boulders of Waitomo Sandstone and Waikawau Sandstone, the latter dominating in number by far. The Waitomo Sandstone is fine-grained, massive and slightly to moderately glauconitic () and, apart from the glauconite component, superficially resembles the more massive facies of the Waikawau Sandstone. Fossiliferous facies of the Waikawau Sandstone are distinctive due to their bedded nature, finely comminuted shell material and conspicuous trace fossil markings.
Waitomo Sandstone clasts were derived from joint blocks of the immediate coastal outcrop eroding to form typically large well-rounded boulders up to 2.5 m across (F). Smaller cobble-sized clasts can be trapped between larger clasts, becoming immobile due to fitting (e.g. F). Waikawau Sandstone clasts have been sourced from episodic mass failure of surficial joint blocks out of the coastal cliffs immediately backing the shore platform (e.g. Moon & Healy Citation1994). Consequently, the shore platform can be supplied with much allochthonous debris not generated by local wave erosion as such (e.g. Hills Citation1970). The latest failure, occurring between May 2008 and April 2009 in alcove A2, left a talus debris pile that contains fresh, very large angular blocks of Waikawau Sandstone up to several metres across (C, E). The most recent clasts tend to have a tabular morphology likely controlled by conjugate joint sets within the rock mass, while the earlier, now reworked, material on the shore platform exhibits more rounded and weathered forms that can still reach >2 m across. Many Waikawau Sandstone clasts rest with fitted contact upon the Waitomo Sandstone protruding rock bench close to source, while others tend to dominate a more seawards position on the shore platform in alcoves A3 and A4 (C, F).
The soft, dark brown titanomagnetite-rich sandstones of the Karioitahi Group (Pleistocene) are the least represented lithology. Rare tabular to subrounded clasts of coarse boulder size (up to 1 m across) occur within alcoves A4 and A5 on the protruding rock benches (C).
Interface morphology
The morphology of the clast interfaces is highly variable (). Some are simple planar features (A), others are stepped (B) or complex drape-like features tightly fitting around the margins of clasts (C), while some may be slightly concavo-convex (D). Combinations may occur depending on the length of rock contact, which may range from only a few centimetres and involve only one other clast, to much longer contacts of tens of centimetres, where large boulders are fitted onto underlying bedrock or a cluster of underlying clasts. Relief may vary by as much as c. 5 cm about a medial contact line.
Figure 5. A, Planar interface between bedded Waikawau Sandstone clast (upper) and bio-encrusted limestone clast (lower). B, Stepped interface between two sandstone clasts. C, Waikawau Sandstone (upper) clast draped and tightly fitting over an accumulation of underlying clasts of various lithologies. D, Slightly concavo-convex and tightly fitting contact between sandstone and limestone clasts. E, Recently tight, perfectly fitting contact that has opened slightly due to small horizontal displacement of the boulders. F, Opened contact with barnacle growth in the resulting aperture. In all images, fitted boulder interfaces are delineated by white arrow heads.
In rare instances, formerly tight, perfectly fitting contacts have been opened due to slight horizontal displacement of the adjacent interlocking boulders. Spacings are often only millimetres wide, but can be up to a centimetre or more (E) and then encrusted by marine epifauna, such as barnacles (F).
Field observation suggests that the better-fitted fabrics occur between adjacent boulders having the greatest rock strength contrast, with the apparently softer and less resistant sandstone clasts preferentially eroding to fit into the more competent limestone clasts or bedrock (e.g. D). The end-product is a natural ‘self-mortared’ fabric of limestone clasts locked in place by a sandstone ‘matrix’. However, adjacent clasts of similar lithology, and therefore competency (e.g. sandstone), can also display fitted fabrics (e.g. B).
Carbonate content
All carbonate contents are recorded in Table S2 and summarised for the different lithologies in and A. Values for Otorohanga Limestone range from 78% in the more siliciclastic basal facies to 91% in the more typical limestone facies, averaging 84% overall. Conglomeratic limestone clasts from within Papakura Limestone have carbonate contents of 78–88% with an average of 83%, an expected result given that they were derived from cannibalisation of the underlying Otorohanga Limestone (Hood & Nelson Citation2012).
Table 1. Age (see ), calcium carbonate content (wt%), Schmidt hammer rebound number (R), calculated UCS, strength description and impact strength index (ISI) data for the main rock units represented within fitted boulders at Gibson Beach.
The sandstone lithologies are typically only slightly calcareous. The Waitomo Sandstone has carbonate contents of 1–7%, although values as high as 27% occur in occasional concretionary horizons. An overall average value of 12% is used for subsequent comparative purposes (). Similar values are obtained for the younger Waikawau Sandstone with carbonate contents ranging from as low as 1–2% in the non-fossiliferous facies to 36% in those samples containing clearly visible comminuted skeletal debris. An overall average value of 13% is assigned to the Waikawau Sandstone (). A single sample of the Pleistocene Karioitahi Group sandstone yielded a carbonate content of 3%.
Rock strength
Schmidt hammer values
Schmidt hammer rebound R values (a measure of rock surface hardness; Selby Citation1993) for the various clast types and parent outcrops measured in the field are recorded in Table S1 and summarised in and schematically in B. The strongest lithologies are clearly the two limestone units, the Otorohanga Limestone and limestone clasts in the Papakura Limestone, with average R values of 52 (range 37–62) and 49 (range 41–59), respectively. The matrix about the limestone clasts in the Papakura Limestone, variable in nature from skeletal-rich to siliciclastic-rich (), shows a broad range of R values of 20–50 (average 32), so is often weaker than the limestone clasts which it supports.
Figure 6. A, Histograms of calcium carbonate contents of the main boulder lithologies. B, Histograms of Schmidt hammer R values for the main boulder lithologies. See text for discussion. C, Generalised relationship between average R values and average carbonate contents for the five main rock types represented within the fitted boulder field at Gibson Beach. The average data are given in and the full data in Tables S1 and S2. The white bars in A and B are single or average values for the different lithologies. Note that the relatively high value for one of each of the Waikawau Sandstone and Waitomo Sandstone samples comes from fossiliferous and/or concretionary material.
The two main sandstone lithologies of Waitomo Sandstone and Waikawau Sandstone have very similar strengths with R numbers averaging 17 and 18, respectively (). However, the Waikawau Sandstone shows much greater variability in strength (range 10–30) compared to the massive Waitomo Sandstone (range 12–21) due to its bedded and more heterogeneous nature. The Karioitahi Sandstone yielded an average R value of 10, at the lower limit of the Schmidt hammer capability, and is likely a maximum value ().
The relative rock strengths (R) for the different lithologies appear to broadly relate to the carbonate content of samples, the higher the carbonate content the higher their strength (C).
Unconfined uniaxial compressive strength (UCS) values
Unconfined uniaxial compressive strength (UCS) values have been derived from the R values to assign the various intact lithologies to the standard strength classification of Deere and Miller (Citation1966) (). The approach is possible because R values are a relative measure of surface hardness or strength (Selby Citation1993).
The Otorohanga and Papakura limestone clasts yield calculated UCS values averaging about 160 and 150 MPa, respectively, or high strength. Using the range of average R values would broaden their classification to incorporate medium to very high strength. The Papakura matrix has an average UCS equivalent of about 56 MPa, equivalent to low to medium strength, while the range of averages would broaden this from low to high strength.
The Waitomo and Waikawau Sandstones average R values equate to UCS values of about 24 and 25 MPa, respectively, equivalent to very low strength. This broadens to include also low strength using the range of R values. The Karioitahi Sandstone has very low strength.
Impact strength index (ISI)
The impact strength index or ISI was calculated from the measured R values using the equation of Sharma et al. (Citation2011), where ISI = 0.4388R + 69.916, in order to assess the relative resistance to impact-related abrasion as might occur between clasts on a shore platform during wave-induced movement. Results are summarised in . Clearly the higher R values provide the higher impact strength indices. The weaker sandstone lithologies therefore have a significantly lower ISI than the limestones and would be far more susceptible to impact-related mechanical abrasion.
Petrography
Some petrographic information for the different rock types is summarised in . In particular, we wanted to assess whether the carbonate contents were (partly) linked to the calcite cement content and the extent to which grains are cement-coated, especially in the siliciclastic (sandstone) rock units, and therefore whether the cement character might be an indirect measure for strength. In all cases the cements are typically dull to orange luminescent (ferroan) low-Mg calcite (micro)sparite which range from negligible to moderate amounts and from rather sporadic grain coatings in the sandstones to more ubiquitous coatings about the skeletal grains in the tightly pressure-dissolved limestones.
Discussion
Fitted contact types
From the broad spectrum of fitted fabrics observed at Gibson Beach we have defined two simplified fitted clast (boulder) contact types (). Type 1 corresponds to boulder(s) fitted onto in situ bedrock sitting within or near above the intertidal zone, including upon any of the protruding benches developed within Waitomo Sandstone, Otorohanga Limestone or Papakura Limestone (C). Typically the clast(s) involved occur(s) as a single medium- to coarse-boulder-sized clast or less commonly as a pair of fitted medium- to coarse-boulder-sized clasts fitted onto the underlying bedrock (A). Overall, Type 1 is limited in occurrence and involves clast sizes at the larger end of the spectrum. Importantly, Type 1 involves the fitting of clasts of contrasting strength, usually a low strength sandstone clast (e.g. Waikawau Sandstone) fitted onto high-strength underlying limestone bedrock.
Figure 7. Fitted boulder contact types and subtypes defined at Gibson Beach. A, Type 1: boulder(s) fitted onto in situ bedrock. Often involves single coarse-boulder-sized clasts, but sometimes fitted pairs. B, C, Type 2: boulder(s) fitted with adjacent boulder(s), within main boulder field agglomeration or smaller satellite boulder fields (B), or resting on or embedded within the sandy shoreface (C). D, Subtype H: horizontal fitting of boulder(s) on boulder(s) or bedrock. E, Subtype V: vertical fitting of boulder(s) on boulder(s), bedrock or sand. F, Subtype M: mirror three-dimensional fitting within boulder groupings sitting on bedrock or sand. G, Subtype J: jigsaw or extreme three-dimensional fitting within boulder field.
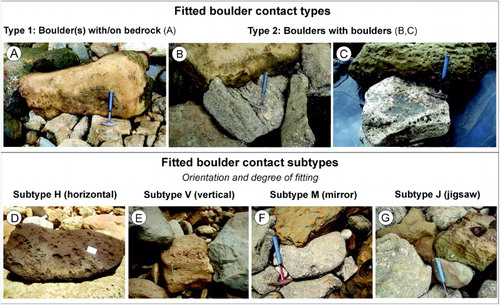
Type 2 involves clasts fitting with adjacent clasts. Type 2 fitting occurs within the main boulder field agglomeration in alcoves A3 and A4, chiefly within the intertidal zone, but also within smaller satellite clusters away from these alcoves or simply in clast pairs (B, C). Type 2 is the dominant fitting type at Gibson Beach and involves cobbles through to coarse-boulder-sized clasts. Clast lithologies may be the same (e.g. sandstone with sandstone) but are most commonly different (e.g. sandstone with limestone).
Additionally, we recognise four key subtypes of fitted fabrics on the basis of overall orientation of the interfaces, namely horizontal (H) or vertical (V) end-members, and their morphological character, namely mirror (M) or jigsaw (J) fitting. Subtype H or horizontal fitting is most typically associated with large clasts fitting directly onto in situ bedrock of the protruding rock benches (D). Subtype V or vertical fitting occurs between clasts positioned on sand, other clasts or bedrock (E). Subtype M or mirror fitting results where a softer clast lithology fits snugly without aperture about the margins of a stronger clast, so mirroring its outline (F). It is the most common contact morphology at the study site. Subtype J or jigsaw fitting occurs where fitting is extreme and there is significant interpenetration of predominantly softer and smaller ‘matrix clasts’ which have undergone extensive attrition to become intricately fitted (or self-mortared) about harder and larger ‘framework clasts’ (G). The gross fabric resembles a giant rock jigsaw puzzle that presents a highly stable interlocked surface. This type of fitting is most common within the main boulder accumulation areas in alcoves A3 and A4 (C).
Fitted boulder positions
We estimate that at least 75% of the boulder field with fitted boulder fabrics occurs within the intertidal range of MHWS. However, a few occurrences are situated near above the MHWS level by up to as much as 1–3 m vertically upon the gently dipping structural bench marking the contact between the top of the massive Waitomo Sandstone and the base of the bedded Waikawau Sandstone (C, ). Moreover, the same bench supports some local concentrations of well-rounded Otorohanga Limestone cobbles and small boulders that have been tossed up and left stranded following transport southwards in the littoral zone from eroding cliffs in this formation near to the north. These observations, together with no audible evidence of knocking or rocking of clasts during any visit, even during moderately rough seas, indicate that both the base of cliff limestone boulder accumulations and the fitted boulder occurrences required generally different wave conditions to those observed during fair-weather periods to account for their formation. We conclude that the production of fitted boulder fabrics is most probably associated with rather higher-energy conditions, inferred to be associated with large storm wave events.
Possible external drivers of the fitting process
The processes involved in boulder fitting remain uncertain. Shelley (Citation1968) proposed a weathering mechanism due to salt (or ice) crystallisation at the point contacts between boulders. However, this was queried by Hills (Citation1970) and Bishop and Hughes (Citation1989), the two other published studies on fitted boulders, who favoured formation during long-term repetitive jostling of clasts against each other or against the base on which they rest, induced by direct storm wave action at the coastline. Such macromotions were envisioned to affect point contacts prior to initiation of a degree of fitting and eventual interlocking, after which time only tiny-amplitude microvibrational movements would have been possible, of the order of micrometres to a few nanometres (e.g. Conca & Cubba Citation1986). Comparable kinds of clast vibration have been reported by Schumm and Stevens (Citation1973) in fluvial systems where high-energy flows can result in bed shear stresses that are insufficient to entrain large clasts, but may cause momentary ‘lifting’ and jostling among them to produce in situ rounding without any lateral movement; they even suggested that a degree of fitting and not rounding could develop between the larger fluvial clasts.
While the direct impacting of large clasts by breaking storm waves at the coastline could well be a contributing factor to their rocking or jostling to initiate the fitting process, we here float the possibility that the microvibrations ultimately responsible for the development of expanses of fitted clasts could perhaps be more an indirect consequence of microseismic impulses throughout the entire coastal zone, resulting from offshore to onshore surface wave activity (e.g. Brominski & Duennebier Citation2002) and especially from the high dynamic pressure of storm waves impacting a rocky cliffed coastline. Of particular relevance to the Gibson Beach site, Kibblewhite (Citation1982) has clearly shown that a close relationship exists between the offshore sea state and microseismic ground motion in onshore locations along the Cape Egmont coast to the south (A). It is now acknowledged that gravity-wave-induced noise can be responsible for the cyclical flexing of sea cliffs by a few to several micrometres that could ultimately promote rock fatigue and cliff retreat (Adams et al. Citation2002, Citation2005), with implications for the development of near-horizontal rocky shore platforms (Dickson & Pentney Citation2012). Significantly, Lim et al. (Citation2011) found that in a coastal sea cliff situation any microseismic energy tends to be concentrated at the base of the cliff within the mean intertidal zone, which corresponds to the main site of fitted boulder fabric formation at Gibson Beach and elsewhere. Moreover, such microseismic vibrations could also readily account for those isolated large fitted boulder occurrences up to as much as 3 m above MHWS upon the backing Waitomo Sandstone bench at Gibson Beach (B, C). From the above types of evidence, we propose that microseismic activity affecting the rocky cliffs and platform at the Gibson Beach site may be an important mechanism for instigating and maintaining the fitted boulder fabrics we see in the rocky alcoves, rather than simply implicating direct wave contact and jostling of boulders as suggested in previous studies.
Some possible specific controls
The rarity of reported occurrences of fitted boulder fabrics in the coastal literature may or may not reflect how common the fabric actually is on gravelly coastlines worldwide. However, we would have anticipated more frequent documentation of the phenomenon if it were indeed widespread. We note for example that in the 2011 Marine Geology special issue on ‘Boulders as a signature of storms on rock coasts’ (Paris et al. Citation2011), none of the ten articles mention any occurrence of fitted or fretted boulders and there is no specific article on the topic in the comprehensive Encyclopedia of Coastal Science (Schwartz Citation2005). Cursory examination of some other coastal boulder deposits away from, but nearby, the Gibson study site does not appear to include examples of fitted boulder fabrics either. This suggests to us that some particular combination of specific local coastal conditions is required to foster the formation of the fitted boulder fabric. Based on the Gibson Beach example, we offer five possibilities in this regard and, where possible, compare these factors with the other published examples of fitted boulders.
Wave climate
Gibson Beach, like the entire west coast of central North Island, directly faces and experiences an especially high-energy wind and wave regime from a predominantly southwesterly quarter out of the Southern Ocean (C). Offshore mean and maximum significant wave heights of c. 2 m and 7.3 m, respectively, are typical, increasing to calculated storm peak values of 16 and 20 m high for 25 and 100 year return periods. The highest wave recorded off Cape Egmont during the 1977–81 Maui platform development study was 19.5 m (Kibblewhite Citation1982). At the coastline, breaking waves up to a few metres high are commonplace, as for example near the Raglan Harbour entrance to the south of Gibson Beach (B) which is world famous for its surfing quality (e.g. Hutt Citation1997). Such a very-high-energy offshore wave regime is also typical of the west coast South Island fitted boulder occurrences noted by Shelley (Citation1968), as well as those on the southeastern Australian coastline described by Hills (Citation1970) and Bishop and Hughes (Citation1989) where occasional boulder imbrication is supportive of strong unidirectional swell conditions. However, a high-energy wave climate by itself cannot be the sole cause of fitting since most high-energy gravel beaches show few if any signs of fitted boulders, presumably because of a high degree of clast mobility.
Coastline morphology
The fitted boulder study site at Gibson Beach comprises a series of small hard rock platforms, variably sand and gravel veneered, backed by vertical hard to soft rock cliffs and bounded to the south by a fault-controlled, prominent hard rock headland (, 2). On its seawards side the headland wall receives the full brunt of wave energy from the persistent swell and storm waves from the southwest, but it tends to protect the fitted boulder site that is tucked in on the lee (northeastern) side of the promontory (C). This headland protection affords an ‘accumulation sink or trap’ area for boulders supplied by local backing-cliff failure or littoral transport from the north, effectively precluding any further longshore southwards movement of large clasts. Such a localised, hard rocky coastal pocket trap contrasts with the typically straight to gently arcuate, continuous sand and mixed sand-gravel foreshore, beach and dune settings, variably backed by low to high bluffs, that otherwise occupy long stretches of the central North Island west coast (e.g. The University of Auckland Citation1974, p. 28–48), and where wave energy tends to be more widely dissipated rather than concentrated. Despite Shelley (Citation1968), Hills (Citation1970) and Bishop and Hughes (Citation1989) intimating that fitted boulder occurrences are common in coastal South Island and southeastern Australia, several of the examples they actually describe are also associated with rocky headlands, capes, cliffs or rugged platforms, as at Gibson Beach, which impart a diversified foreshore (micro)topography that may influence the local shoreline wave and current regime in different ways (cf. Lim et al. Citation2011). For example, at Cape Paterson in Victoria, Hills (Citation1970) noted that fitted boulder occurrences are restricted to the leeward end of the rock platform and wave ramp at the site, highlighting a degree of morphological control.
Variety of rock types and strengths
The diversity of the immediate coastline geology at the Gibson Beach study site () ensures that the platform is characterised by delivery of large clasts (cobbles and boulders) of varying lithology and strength, including very soft, soft, and hard sandstones and two types of hard limestones. At least six different lithologies are involved over just a few tens of metres of coastline, a property not possible for most long stretches of the central North Island west coast that are dominated by sandy beaches and/or dunes that may be backed by only one or two rock types and then often soft, readily erodible mudstone or muddy sandstone (e.g. Hume & Nelson Citation1986; King et al. Citation1993).
The lithologies involved in the other New Zealand (Shelley Citation1968) and Australian (Hills Citation1970; Bishop & Hughes Citation1989) examples of fitted boulders range across a variety of hard igneous, metamorphic and sedimentary rock types, but at any one site typically only one lithology is involved. This contrasts with the situation at Gibson Beach where a mix of different boulder types and strengths occurs, the latter in our case being broadly related to carbonate (cement) content (). Evidently the more cement about exposed grains (), and/or the more homogenous the rock (e.g. limestone wholly calcitic), the more difficult it becomes to erode individual grains from the rock. While fitting can form between boulders of the same lithology, it is best developed at Gibson Beach where the difference in relative strength and abrasion susceptibility is greatest (, ). Softer, weaker lithologies erode and preferentially become fitted about the harder stronger lithologies, a process we have called self-mortaring.
Microseisms
In a previous section (‘Possible external drivers of the fitting process’) we have already alluded to the possible important role that wave-induced microseismic vibrations within the coastal rocky platform and cliff substrates may play in the generation of the base-of-cliff and intertidal fitted boulder fabrics at the study location. Such microseismic activity has been directly measured onshore to the south about Cape Egmont (Kibblewhite Citation1982), and there can be no question that it also occurs at Gibson Beach given the identical kind of wave activity that influences the two areas. For the Gibson site however, we postulate that the microseismic response may be focused and amplified within the pocket-like, predominantly rocky substrates by the direct impact of storm waves upon the protruding hard rock headland and coastal cliffs (C), promoting fitted fabric development within the ‘semi-protected’ platform boulder deposits. Wave-induced microseismic vibrations have not been suggested in previous studies as a possible mechanism for developing fitted boulder fabrics.
Time
Time must be an important factor determining the progression of the degree of fit from immature to supermature contact types (), but is difficult to assess precisely. Bishop and Hughes (Citation1989) suggested that fitted fabrics may form quite rapidly, certainly in less than 75 years, and that they have added considerable stability and persistence to their studied Australian coastal boulder deposits that may resist storms with a return period of about 5 kyr. Our own work suggests that fitting could be initiated in much shorter time periods, possibly within years. For example, following a coastal landslide event at the Gibson locality in alcove A2 (C, E) between May 2008 and April 2009 that provided very-low- to low-strength Waikawau Sandstone debris to the shore platform (see Figure S1A, B), moderately developed long fitted contacts between several of the sandstone clasts were evident in 2011, only 2–3 years later (see Figure S1C, D). Such a rapid process for at least the initial phases of boulder fitting is consistent with Hill’s (Citation1970) observation of fitting seen in newly dumped boulders at the base of a Victorian coastal cliff following road construction.
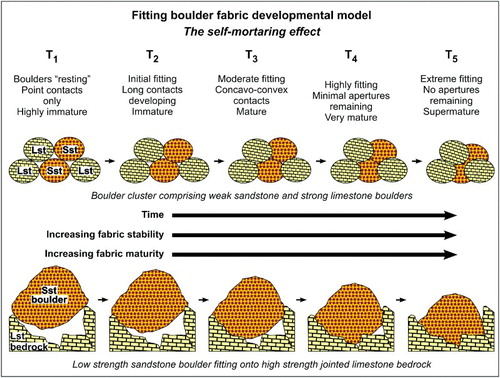
Figure 8. Schematic model of a theoretical sequence of developmental stages of clast interfacial fitting – the self-mortaring effect – from immature point-to-point contacts through to supermature extremely fitted contacts (T1–T5). Two scenarios are presented: the upper shows a boulder cluster comprising weak sandstone and strong limestone boulders; the lower a low-strength sandstone boulder fitting onto high-strength jointed limestone bedrock.
Stability of fitted boulder fabric
Photographic monitoring of prominent boulder positions and their contacts with adjacent boulder(s) or bedrock at our study site over the 9 year period during 2003–2011 shows that the majority of the boulder field, where significant fitting occurs, has remained extremely stable with very little or no movement, despite the passage of seasonal storm events (e.g. Figures S2A, B). Clearly the self-mortaring process leading to the fitted boulder fabrics between rock materials having contrasting strength characteristics can form an armoured, highly stable, immobile and very resistant rock mass, which could have relevance in the construction of coastal rip-rap protection structures. The considerable stability afforded boulder deposits exhibiting fitted fabrics has also been emphasised by previous studies (Shelley Citation1968; Hills Citation1970; Bishop & Hughes Citation1989).
In rare instances at Gibson Beach examples occur of formerly fitted boulders that have escaped their imprisonment but preserve impressions resulting from the earlier fitting development (Figure S2C). Occasional examples of lateral displacement of a fitted boulder pair are also seen, exposing the normally hidden eroded contact surface which may become striated during movement, resembling slickensides (Figure S2D). The origin of such a ‘breakdown’ of the fitted boulder fabric is unknown, but could be linked to some especially catastrophic event impacting the site, such as an earthquake or tsunami.
Model for fitted boulder development
The spectrum of interface contacts seen at the Gibson locality () is a basis for formulating a simplified staged sequence model of clast interfacial development (). Clasts in point-to-point contact are in the initial developmental, highly immature stage (T1). Others may exhibit long contacts (T2) which develop into concavo-convex contacts (T3) with some void space or aperture remaining along some portions of the contact(s). The clasts remain imperfectly fitted, but are relatively mature in terms of developmental stage. At the other end of the spectrum, those contacts where few or no apertures are observed and the clasts are perfectly fitted or tightly interlocked into each other (T4–5) represent very mature to supermature development.
Fitted clast fabrics mimic pressure-dissolution fabrics
In the rock record, the development of interpenetrating stylolite-like fabrics between clasts in coarse-grained sedimentary rocks is usually linked to pressure-dissolution phenomena between grains accompanying deep burial of the sediment (e.g. Audley-Charles Citation1967; Wanless Citation1983), typically under many hundreds of metres of overburden. Hood and Nelson (Citation2012) describe just such a burial situation to account for the fitted fabric texture between many of the prominent cobble- to boulder-sized limestone clasts within some of the early Miocene conglomeratic Papakura Limestone exposures at the Gibson Beach site (e.g. their E, F). However, the occurrence of tightly fitted concavo-convex and interpenetrating jigsaw-like contacts between the sandstone and/or limestone boulders on the modern Gibson Beach platform highlights that, under the right combination of geological and oceanographic conditions, a fitted fabric gravel/conglomerate may develop directly in the surficial sedimentary environment without the necessity for any burial-related pressure-dissolution mechanism.
Conclusions
The rocky promontory coastal morphology of the Gibson Beach study section is greatly influenced by a local highly varied geology of sandstone and limestone formations and a high-energy wave climate, which together have culminated in the production of a rocky platform boulder field including some fine examples of fitted boulder fabrics, otherwise rarely reported in the coastal literature. Relative clast strength is a key control on the development of these fitted fabrics. In our case, clast hardness or strength is largely controlled by their carbonate (cement) content in which higher values result in increased resistance to abrasion. While fitting can occur between the same rock types, it is best developed between clasts of contrasting lithology and strength where the weaker clasts (typically sandstone) abrade preferentially against the harder clasts (typically limestone) to produce, over time, the most advanced fitted fabric types through self-mortaring of the larger and more resistant framework clasts by the softer ones. The spectrum of resulting fitted fabrics ranges from immature straight to concavo-convex contact types through mature mirror contacts to supermature jigsaw-like contacts, by which time they provide a tightly interlocked, extremely stable and resistant armoured boulder field in the coastal zone. Our observations indicate that a degree of moderate fitting may form within a time period as short as a few years. The origin of the fitted fabric is uncertain, but must involve in situ abrasion. While previous studies elsewhere favour direct wave impacts and boulder jostling, we speculatively suggest that microvibrations of the rocky platform boulder framework, as a consequence of the passage of storm-wave-generated microseisms through the hard rock headland and cliffs that partly bound and protect the site from the dominant southwesterly swell waves, may be important. We suspect that closer inspection of rock headland impounded boulder beach deposits could identify rather more examples of fitted boulder fabrics than have so far been reported in the literature and, likewise, ancient examples should exist despite none being reported to date. The occurrence also demonstrates it is possible for a tightly fitted gravel/conglomeratic fabric to develop directly in the surficial coastal environment without the necessity for invoking some deep burial-related pressure-dissolution mechanism.
Supplementary data
Table S1. Schmidt hammer rebound (R) values for 20 tests on individual boulder lithologies.
Table S2. Calcium carbonate content (wt%) of boulder lithologies.
Figure S1. Fitting of boulders following 2008/2009 mass failure event. A, Alcove A2 in May 2008 prior to mass failure of backing coastal cliffs. B, The same location in Nov 2011 with an apron of Waikawau Sandstone debris from a 2008/09 mass failure event. Dashed boxes in A and B show the same boulder. Solid box in B is position of image C showing a pair of fitted Waikawau Sandstone boulders from the landslide. D, Solid box in C enlarged to show significant fitted fabric development in only 2–3 years.
Figure S2. Images showing long-term stability of fitted contact, but also rare evidence of post-fitting movement. A and B, The same boulder contact in 2004 (A) and in 2010 (B) between sandstone clast (Wk) and limestone bedrock (Ot) showing no evidence of displacement during that time despite annual storm wave activity. Arrow is same point in each image. C, Sandstone boulder that has become mobile shows ovoid impressions due to former fitting with adjacent clasts. D, Displaced (arrows) and striated interface between two boulder clasts.
Figure S2.
Download TIFF Image (23 MB)Figure S1. Fitting of boulders following 2008/2009 mass failure event.
Download TIFF Image (20 MB)Table S2. Calcium carbonate content (wt%) of boulder lithologies.
Download MS Word (12.7 KB)Table S1. Schmidt hammer rebound (R) values for 20 tests on individual boulder lithologies.
Download MS Word (14.2 KB)Acknowledgements
We acknowledge useful discussions and comments from John Mylroie (Mississippi State University, USA), Noel James (Queens University, Canada) and Vicki Moon, Willem de Lange and Karin Bryan (University of Waikato). For field assistance we thank Rod McAdam (Hamilton). Renat Radosinsky (University of Waikato) is thanked for assistance with thin-section preparation and Deborah Davey (University of Waikato) for undertaking carbonate percentage determinations. Richard Gorman (NIWA, Hamilton) is sincerely thanked for providing wave hindcast information. The comments of two anonymous reviewers and of Associate Editor Kari Bassett helped improve the paper, and we thank publishing coordinator Marie Hodgkinson at the Royal Society of New Zealand for assistance with the online submission and formatting of figure files. We are grateful to the local landowners at Gibson Beach, and especially Graeme Kettle for his hospitality and land access.
Associate Editor: Dr Kari Bassett.
Disclosure statement
No potential conflict of interest was reported by the authors.
Related Research Data
References
- Adams PN, Anderson RS, Revenaugh J. 2002. Microseismic measurement of wave-energy delivery to a rocky coast. Geology. 30:895–898. doi: 10.1130/0091-7613(2002)030<0895:MMOWED>2.0.CO;2
- Adams PN, Storlazzi CD, Anderson RS. 2005. Nearshore wave-induced cyclical flexing of sea cliffs. J Geophy Res. 110:F02002. doi:10.1029/2004JF000217
- Audley-Charles MG. 1967. Petrology of a lower Miocene polymict intracalcirudite from Timor. Sediment Geol. 1:247–257. doi: 10.1016/0037-0738(67)90063-2
- Aydin A, Basu A. 2005. The Schmidt hammer in rock material characterization. Eng Geol. 81:1–14. doi: 10.1016/j.enggeo.2005.06.006
- Baker AA. 1959. Imprisoned rocks: a process of rock abrasion. Vict Nat. 76:206–207.
- Beavan RJ, Litchfield NJ. 2012. Vertical land movement around the New Zealand coastline: implications for sea level rise. GNS Science Report 2012/29. Lower Hutt: GNS Science.
- Bishop P, Hughes M. 1989. Imbricate and fitted fabrics in coastal boulder deposits on the Australian east coast. Geology. 17:544–547. doi: 10.1130/0091-7613(1989)017<0544:IAFFIC>2.3.CO;2
- Blair TC, McPherson JG. 1999. Grain-size and textural classification of coarse sedimentary particles. J Sediment Res. 69:6–19. doi: 10.2110/jsr.69.6
- Brominski PD, Duennebier FK. 2002. The near-coastal microseism spectrum: spatial and temporal wave climate relationships. J Geophys Res. 107:2166. doi:10.1029/2001JB000265
- Brown ET, editor. 1981. Rock characterisation testing and monitoring. ISRM suggested methods. Oxford: Permagon Press.
- Chen B, Chen Z, Stephenson W, Finlayson B. 2011. Morphodynamics of a boulder beach, Putuo Island, SE China coast: The role of storms and typhoon. Mar Geol. 283:106–115. doi: 10.1016/j.margeo.2010.10.004
- Conca JL, Cubba R. 1986. Abrasion resistance hardness testing of rock materials. Int J Rock Mech Min Sci and Geomechanics Abstracts. 23:141–149. doi: 10.1016/0148-9062(86)90340-2
- Day MJ, Goudie AS. 1977. Field assessment of rock hardness using the Schmidt test hammer. British Geomorphic Research Group Technical Bulletin. 18:19–29.
- Deere DU, Miller RP. 1966. Engineering classification and index properties for intact rock. Technical Report No. AFWL-TR-65-116. Kirkland, New Mexico: Research and Technology Division, Air Force Weapons Laboratory.
- Dickson ME, Pentney R. 2012. Micro-seismic measurements of cliff motion under wave impact and implications for the development of near-horizontal shore platforms. Geomorphology. 151–152:27–38. doi: 10.1016/j.geomorph.2012.01.006
- Edbrooke SW, compiler. 2001. Geology of the Auckland area. Institute of geological and nuclear sciences 1:250 000 geological map 3. Lower Hutt: Institute of Geological and Nuclear Sciences Limited.
- Edbrooke SW, (compiler). 2005. Geology of the Waikato area. Institute of geological and nuclear sciences 1:250 000 geological map 4. Lower Hutt: Institute of Geological and Nuclear Sciences Limited.
- Goto K, Chavanich SA, Imamura F, Kunthasap P, Matsui T, Minoura K, Sugawara D, Yanagisawa H. 2007. Distribution, origin and transport process of boulders deposited by the 2004 Indian Ocean tsunami at Pakarang Cape, Thailand. Sediment Geol. 202:821–837. doi: 10.1016/j.sedgeo.2007.09.004
- Hall AM, Hansom JD, Williams DM, Jarvis J. 2006. Distribution, geomorphology and lithofacies of cliff-top storm deposits: Examples from the high-energy coasts of Scotland and Ireland. Mar Geol. 232:131–155. doi: 10.1016/j.margeo.2006.06.008
- Hayward BW, Brook FJ. 1984. Lithostratigraphy of the basal Waitemata Group, Kawau Subgroup (new), Auckland, New Zealand. New Zeal J Geol Geop. 27:101–123. doi: 10.1080/00288306.1984.10422521
- Hills ES. 1970. Fitting, fretting, and imprisoned boulders. Nature. 226:345–347. doi: 10.1038/226345b0
- Hollis CJ, Beu AG, Crampton JS, Crundwell MP, Morgans HEG, Raine JI, Boyes AF. 2010. Calibration of the New Zealand Cretaceous-Cenozoic timescale to GTS2004. GNS Science Report 2010/43. Lower Hutt: GNS Science.
- Hood SD, Nelson CS. 2012. Temperate carbonate debrites and short-lived earliest Miocene yo-yo tectonics, eastern Taranaki Basin margin, New Zealand. Sediment Geol. 247-248:58–70. doi: 10.1016/j.sedgeo.2011.12.013
- Hume TM, Nelson CS. 1986. Distribution and origin of clay minerals in surficial shelf sediments, western North Island, New Zealand. Mar Geol. 69:289–308. doi: 10.1016/0025-3227(86)90044-7
- Hutt JA. 1997. Bathymetry and wave parameters defining the surfing quality of five adjacent reefs [Unpublished MSc thesis]. Hamilton: University of Waikato.
- Kear D. 1963. Geology of the Te Akau District, West Auckland, New Zealand, and its regional implications [Unpublished PhD thesis]. London: University of London.
- Kear D. 1966. Sheet N55—Te Akau. Geological map of New Zealand 1:63 360. Wellington: Department of Scientific and Industrial Research.
- Kibblewhite AC. 1982. 2—Ocean wave properties. In: Kibblewhite AC, Bergquist PR, Foster BA, Gregory MR, Miller MC, editor. Maui development environmental study: report on phase two, 1977–1981. Prepared at the University of Auckland for Shell BP and Todd Oil Services Limited. Auckland: University of Auckland; p. 25–48.
- Kibblewhite AC, Bergquist PR, Foster BA, Gregory MR, Miller MC. 1982. Maui development environmental study: report on phase two, 1977–1981. Prepared at the University of Auckland for Shell BP and Todd Oil Services Limited. Auckland: University of Auckland.
- King PR, Scott GH, Robinson PH. 1993. Description, correlation and depositional history of Miocene sediments outcropping along North Taranaki coast. Institute of Geological and Nuclear Sciences Monograph 5. Lower Hutt: Institute of Geological and Nuclear Sciences Ltd.
- Knight J, Burningham H. 2011. Boulder dynamics on an Atlantic-facing rock coastline, northwest Ireland. Mar Geol. 283:56–65. doi: 10.1016/j.margeo.2010.07.008
- Land Information New Zealand (LINZ). 2013. New Zealand hydrographic authority tide predications - raglan. Wellington: LINZ; [cited 2012 Apr 17]. Available from: http://www.linz.govt.nz/hydro/tidal-info/
- Lim M, Rosser NJ, Petley DN, Keen M. 2011. Quantifying the controls and influence of tide and wave impacts on coastal rock cliff erosion. J Coastal Res. 27:46–56. doi: 10.2112/JCOASTRES-D-09-00061.1
- McKenna J. 2005. Boulder beaches. In: Schwartz M, editor. Encyclopedia of coastal science. Dordrecht: Springer; p. 206–208.
- Moon VG, Healy TR. 1994. Mechanisms of coastal cliff retreat and hazard zone delineation in soft flysch deposits. J Coastal Res. 10:663–680.
- Nott J. 2003. Waves, coastal boulder deposits and the importance of the pre-transport setting. Earth Planet Sci Lett. 210:269–276. doi: 10.1016/S0012-821X(03)00104-3
- Orford JD, Anthony EJ. 2011. Extreme events and the morphodynamics of gravel-dominated coastal barriers: Strengthening uncertain ground. Mar Geol. 290:41–45. doi: 10.1016/j.margeo.2011.10.005
- Paris R, Naylor LA, Stephenson WJ. 2011. Boulders as a signature of storms on rock coasts. Mar Geol. 283:1–11. doi: 10.1016/j.margeo.2011.03.016
- Schumm SA, Stevens MA. 1973. Abrasion in place: a mechanism for rounding and size reduction of coarse sediments in rivers. Geology. 1:37–40. doi: 10.1130/0091-7613(1973)1<37:AIPAMF>2.0.CO;2
- Schwartz M, editor. 2005. Encyclopedia of coastal science. Dordrecht: Springer; 1211 p.
- Selby MJ. 1993. Hillslope materials and processes. 2nd ed. Oxford: Oxford University Press.
- Sharma PK, Khandelwal M, Singh TN. 2011. A correlation between Schmidt hammer rebound numbers with impact strength index, slake durability index and P-wave velocity. Int J Earth Sci. 100:189–195. doi: 10.1007/s00531-009-0506-5
- Shelley D. 1968. Fitting boulders: The result of an important shore process. Nature. 220:1020–1021. doi: 10.1038/2201020a0
- Stephenson WJ, Naylor LA. 2011. Geological controls on boulder production in a rock coast setting: Insights from South Wales, UK. Mar Geol. 283:12–24. doi: 10.1016/j.margeo.2010.07.001
- The University of Auckland. 1974. Maui development environmental study: report on phase one, 1974. Report prepared by the University of Auckland for Shell BP and Todd Oil Services Limited. Auckland: University of Auckland.
- Wanless HR. 1983. Burial diagenesis in limestones. In: Parker A, Sellwood BW, editors. Sediment diagenesis. Dordrecht: D. Reidel Publishing Company; p. 379–417.