
ABSTRACT
At the eastern boundary of the south Taupo Rift, the NE-striking, rift-bounding Rangipo and the ENE-striking Wahianoa active normal faults intersect. We investigate their intersection at the Upper Waikato Stream to understand the kinematics of a rift termination in an active volcanic area. The Upper Waikato Stream Fault is a previously unrecognised seismogenic source also at the eastern boundary, capable of producing a MW6.5 and up to MW7.1 earthquake if it ruptures in conjunction with the Rangipo or Wahianoa faults. We found a minimum of 12 surface-rupturing earthquakes in the last 45.16 ka on the Upper Waikato Stream Fault (mean slip-rate c. 0.5 mm/yr), and a minimum of nine surface-rupturing earthquakes in the last 133 ka on the Wahianoa Fault (mean slip-rate c. 0.2 mm/yr). Periods of highest slip-rate on these faults may coincide in time with Taupo, Ruapehu or Tongariro eruptions, but, despite their intersection, movement was not coincident across all faults. The Upper Waikato Stream Fault responded to a major Taupo Volcano eruption, the Wahianoa to a major eruptive sequence from Mt Tongariro and the Rangipo to major explosive events from Mt Ruapehu.
Introduction
At the southern end of the Taupo Rift (and Taupo Volcanic Zone) in the Central Plateau of the North Island of New Zealand, local reorientation of the stress tensor axes is responsible for a complex tectonic structure, marking the abrupt closure of the rift (Villamor & Berryman Citation2006a; Villamor et al. Citation2007). Three sets of active normal faults occur in this area, which are highly oblique to each other ().
Figure 1. A, Tectonic setting of New Zealand. Green rectangle marks location of B. B, Location of the Taupo Rift (active faults in red from Langridge et al. Citation2016). Yellow rectangle marks location of C. C, Location map of the Mt Ruapehu Graben, Upper Waikato Stream (UWS), Wahianoa and Rangipo faults in the southern part of the Tongariro Volcanic Complex, in southern Taupo Rift. Potential intersection area marked with a purple rectangle (UWS).
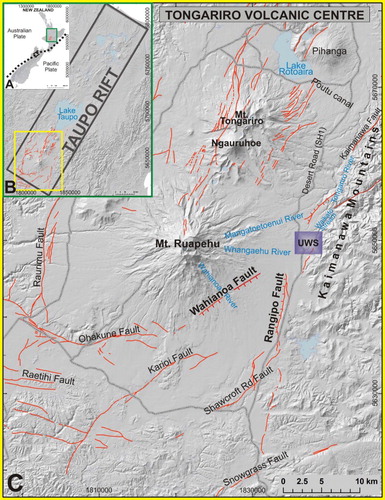
NE-striking faults delineate the Taupo Rift margins and axis, whereas E–W- and ENE-striking faults delineate the southern termination. At the southernmost part, mapping of active fault scarps has shown E–W- and ENE-striking faults hard linked with NE-striking faults. For example, the NE-striking Raurimu Fault intersects the E–W-striking Ohakune Fault in the southwest, and the NE-striking Rangipo Fault intersects the ENE-striking Shawcroft Road Fault in the southeast (Villamor & Berryman 2006) (). Along the eastern boundary and north of the intersection between the Rangipo and Shawcroft Road faults, prior studies have identified the Rangipo and Kaimanawa faults as rift-bounding faults between volcanic sediments and the greywacke Kaimanawa Mountains; although only the Rangipo Fault is currently mapped as active (Langridge et al. Citation2016). Here, the ENE-striking Wahianoa Fault trends towards the rift boundary but there is no geomorphic expression of intersection with the Rangipo Fault, due to cover by young, undisturbed recent sediments. However, active faults do traverse the banks of the Upper Waikato Stream, suggesting that it is very likely that the Rangipo and/or the Wahianoa faults extend northeast, beyond their intersection ().
Understanding the geometry, kinematics and paleoearthquake history of this fault intersection and rift termination may have important implications for seismic hazard assessment in the Tongariro Volcanic Centre (TgVC). In particular, confirming the prolongation of the Rangipo and Wahianoa faults into the Upper Waikato Stream area would increase their potential rupture lengths and thus the associated earthquake magnitudes.
This study characterises the geometry, kinematics and faulting history of the Upper Waikato Stream and Wahianoa faults. Subsequently, we compare their faulting histories with that of the Rangipo Fault (Villamor et al. Citation2007). The comparison allows us to assess whether these faults rupture simultaneously or interdependently, and whether their activity is temporally associated with major eruptions from the nearby volcanic centres ().
Geological and structural setting
The Taupo Volcanic Zone (TVZ) is a NNE-trending Quaternary volcanic arc associated with subduction of the Pacific Plate below the Australian Plate offshore of the North Island of New Zealand along the Hikurangi margin (Wallace et al. Citation2004). The volcanic arc is known for its 25 caldera-forming eruptions in the last 1.6 Ma, active andesitic stratovolcanoes, parasitic vents, such as scoria cones, geothermal and hydrothermal activity within an active fault belt with horst and graben structures (Wilson et al. Citation2009; Leonard et al. Citation2010; Pardo et al. Citation2014) (). Faults within the volcanic arc (Rowland & Sibson Citation2001) define an intra-arc rift, the Taupo Rift (Acocella et al. Citation2003). Extension is created by fore-arc clockwise rotation (Wallace et al. Citation2004) and slab rollback (Seebeck et al. Citation2014). Extension across the rift is associated with a combination of dike intrusion and normal faulting (Rowland et al. Citation2010; Villamor et al. Citation2011).
Volcanic history and stratigraphy
The TgVC is the southern part of the TVZ. It is a 13 km long and 5 km wide basaltic–andesite to dacitic volcano–vent corridor complex (Hackett & Houghton Citation1989) within the Mt Ruapehu Graben (Villamor & Berryman 2006). The TgVC includes two major stratovolcano systems, and a number of minor vents. Ruapehu is the southernmost and largest volcano and is one of the most active volcanoes in New Zealand. It is a complex andesitic stratovolcano with a crater lake over its active vent, and is one of the world’s most regular producers of lahars (Cronin et al. Citation1997a; Procter et al. Citation2010). The eastern flanks of Ruapehu (Whangaehu River, Mangatoetoenui Stream and Wahianoa River) have been a major pathway for lahars overflowing towards the Desert Road since prehistoric times (Lecointre et al. Citation2004). The eastern extent of the Whangaehu River drains into the Upper Waikato Stream and eventually the Tongariro River ().
Detailed studies of the volcanic stratigraphy in this region have provided excellent constraints on the timing of active faulting. Many volcanic deposits provide diachronic chronological markers as they are displaced by different amounts due to repeated fault movement (Villamor et al. Citation2007). For this reason, we present here a summary of the chronostratigraphic framework used to assess the paleoearthquake history of the Upper Waikato Stream and Wahianoa faults.
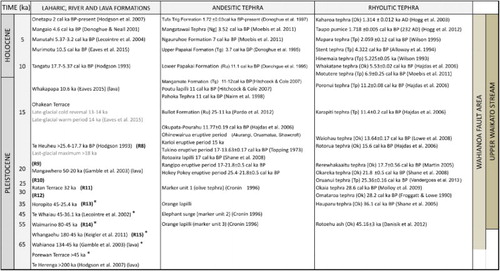
In the Upper Waikato Stream area, 33 andesitic tephras comprise a comprehensive chronostratigraphic framework (Topping Citation1973; Donoghue et al. Citation1995; Cronin et al. Citation1996a, Citation1996b; Donoghue & Neall Citation2001; Pardo et al. Citation2012). These are interbedded with lahar deposits from c. 18 separate events (Cronin & Neall Citation1997; Cronin et al. Citation1997a; Donoghue & Neall Citation2001) and the distal fall deposits of 19 rhyolitic eruptions from Taupo and Okataina volcanic centres (Froggatt & Lowe Citation1990; Wilson et al. Citation1995; Cronin et al. Citation1996b; Lowe et al. Citation2013) ().
Figure 2. Chronological stratigraphic summary of the laharic and lava formations and andesitic tephras from the Tongariro Volcanic Centre interbedded with distal rhyolitic tephras from the Taupo Volcanic Zone calderas. Notice the general stratigraphic record for the Upper Waikato Stream and Wahianoa Fault areas at the right. *The oldest laharic formations’ ages are based on the Rotoehu ash age (45.16 cal ka BP; Danišík et al. Citation2012). Ru, Ruapehu; Tg, Tongariro; Ng, Ngāuruhoe; Tp, Taupo; Ok, Okataina, R# corresponds to the lahar episodes as described by Cronin & Neall (Citation1997).Citation Citation Citation Citation Citation Citation Citation Citation Citation Citation
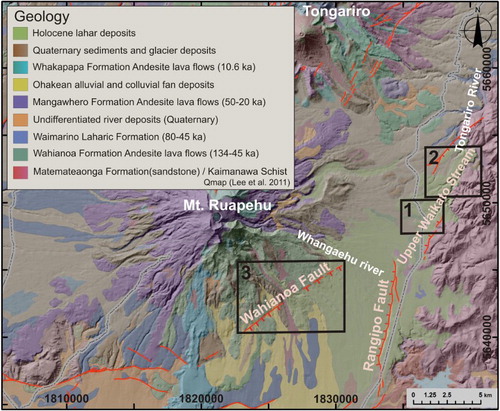
The largest of the TgVC volcanoes, Mt Ruapehu, has a near-continuous eruptive history from > 250 ka to the present (Hackett & Houghton Citation1989; Tost et al. Citation2015). The most complete tephra records of Mt Ruapehu occur east of the volcano, along the Desert Road. The Upper Waikato Stream includes some of the oldest and deepest outcrops with a continuous record of regional volcanic activity over the past > 50 ka (Cronin et al. Citation1996a; Cronin & Neall Citation1997), making it an ideal site for our study (). Lahars have been channelled down the Upper Waikato Stream and the Tongariro River several times (Cronin et al. Citation1997b), but since c. 25 ka they stopped flowing this way, due to the formation of a moraine in the upper Whangaehu River during the last glaciation (Cronin et al. Citation1997a) ().
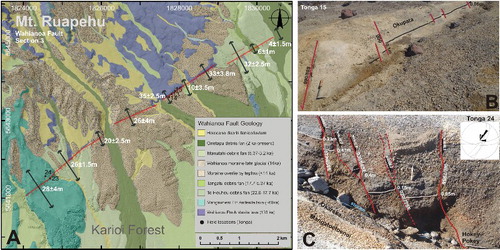
Figure 3. Geological map and general stratigraphy of the SE Mt Ruapehu area (after Townsend et al. Citation2008; Lee et al. Citation2011), showing the location of the study sites (sections 1–3) and active surface fault traces (Langridge et al. Citation2016). See for detailed stratigraphic record.
Most of the rhyolitic tephras are radiocarbon dated (Topping Citation1973; Froggatt & Lowe Citation1990; Lowe et al. Citation2013), combined with isotopic dating methods such as 238U/230Th isotopes and (U–Th)/He dating of zircon (Danišík et al. Citation2012). Identification of the tephra is normally carried out by glass and mineral chemistry using electron microprobe analysis (Cronin et al. Citation1996a; Moebis et al. Citation2011). Isotopic K/Ar and 40Ar/39Ar dating have been used for lava flows (Gamble et al. Citation2003; Conway et al. Citation2015). Cosmogenic nuclide dating is also used for glacial sediments (Eaves et al. Citation2015).
Active faulting: the Rangipo and Wahianoa faults
At the southern termination of the TVZ and the Taupo Rift, radial extension (strain) and local reorientation of the stress axes are responsible for a complex fault pattern around Mt Ruapehu (Rowland & Sibson Citation2001; Villamor & Berryman 2006; Villamor et al. Citation2007). Three major active fault sets form the southern termination of the rift: (1) the NNE-trending Mt Ruapehu Graben; (2) the ENE-trending Karioi fault set; and (3) the E–W Raetihi fault set (Villamor & Beryman 2006). Immediately northwards, at the latitude of Tongariro and Ngāuruhoe volcanoes, normal fault displacements together with extensional fissures and dike intrusions accommodate extension along a NNE trend (Rowland & Sibson Citation2001). Volcanic vents are also NNE aligned, along the axis of the Mt Ruapehu Graben (Nairn et al. Citation1998; Acocella et al. Citation2003; Villamor & Berryman 2006).
Rangipo Fault is located at the eastern margin of the Mt Ruapehu Graben (Villamor & Berryman 2006). It is an active, NNE-striking, normal fault downthrown to the west (). The fault is at least 32 km long with a clear fault scarp ranging from a few metres to tens of metres in height. To the south, the Rangipo Fault is bounded by the Snowgrass Fault, but its northern extent remains uncertain due to erosion of the scarp by the Whangaehu River and/or by burial with recent lahar deposits. Prior to this study, the fault was mapped only as far north as the intersection with the Wahianoa Fault (Villamor et al. Citation2007). Donoghue et al. (Citation1991) estimated a displacement rate of 3 mm/yr, but Villamor et al. (Citation2007) calculated from paleoseismic trenches and geomorphic analyses a displacement rate of 1.4 ± 1 mm/yr from 17.7–27 cal ka BP to the present day, and of 0.2 mm/yr from 13.8 cal ka BP to the present day. These data imply an average long-term slip-rate of 1.5 mm/yr for the last c. 65–230 kyr and a period between 17.7–25.4 cal ka BP and 13.64 cal ka BP, where slip-rate could have been up to 9 mm/yr. Past earthquakes on the Rangipo Fault had estimated magnitudes of between 5.9 and 7.1 with recurrence intervals from 3.4 ka to > 14 ka, depending on whether rupture was segmented or not (Villamor et al. Citation2007).
The Wahianoa Fault is an ENE-striking normal fault downthrown to the SE, and is the main fault of the Karioi fault set. It has a prominent geomorphic expression for at least 10 km across the SE flanks of Mt Ruapehu, but the northeastern side of the fault is obscured by younger deposits of lahars and tephras from the TgVC. Preliminary slip-rates were assessed for this fault by Villamor and Berryman (Citation2006a) at 0.3 ± 0.2 mm/yr. It is not certain whether the Wahianoa Fault extends beyond the current mapped trace and it might be buried under young lahar deposits. Based on the current National Seismic Hazard Model, this fault is capable of producing MW6.7 earthquakes based on a 27 km fault length (Stirling et al. Citation2012; Litchfield et al. Citation2014). Earthquake magnitude could be considerably more if the fault is, in fact, longer.
Methods
To assess the possible connection between the Rangipo and Wahianoa faults in the Upper Waikato Stream area, we initially reviewed the current active fault mapping (Langridge et al. Citation2016) in the area of intersection, before analysing fault offsets of known stratigraphic units in outcrops, and determining offsets of geomorphic surfaces of known age. The data were used to reconstruct the timing of fault rupture and estimate fault slip-rates, earthquake magnitudes and recurrence intervals for the main structures in this area.
Fault mapping
Fault mapping in the southeastern TVZ was based on aerial photography interpretation from stereoscopic pairs from the 1940s and 1960s, at 1:50,000 and 1:16,000 scales (NZ Aerial Mapping, runs 1727, 1738, 2436, 2564 and 2572) along with Google Earth images. Grid references on maps are in NZTM2000.
A 2 m resolution photogrammetry-based digital surface model (DSM) was used as a base map for mapping and to calculate surface displacements. The DSM of the entire study area, within the boundary of the Tongariro National Park, was developed from two different aerial surveys conducted in November 2010 and November 2012, respectively, by New Zealand Aerial Mapping Ltd as part of their contract to provide regional aerial coverage to Horizons and Waikato regional councils. The 2010 and 2012 aerial surveys were flown in N–S and E–W orientations, respectively, and captured imagery using VEXCEL UltraCam Xp and UltraCamX large-format digital frame cameras (Microsoft) from a flight height of c. 7200 m a.s.l., which resulted in a ground sampling distance of 40 and 50 cm, respectively. The aerial blocks, consisting of 343 and 68 frames for 2010 and 2012 surveys, respectively, were triangulated using an iterative least-square bundle block adjustment in ERDAS Photogrammetry software.
The extraction of the DSM was conducted using the enhanced Automatic Terrain Extraction (eATE) module of ERDAS Photogrammetry. The algorithm used in eATE applied certain steps to achieve 3D generation from stereo-pairs. The steps encompassed hierarchical image matching, including reverse matching, by the mean of normalised cross correlation and followed by the refinement of matching results using least squares fitting. The eATE method generated a 3D coordinate for every pixel within the overlapped area of each stereo-pair and used maximum three images for simultaneous matching thus generated dense point-cloud data in laser format. These point cloud data from both survey blocks were further processed in LP360 software using an inverse distance weighted surface algorithm to achieve 2 m resolution DSM. The ground control points used to triangulate the 2010 aerial block contained ellipsoidal heights in NZGD2000 (NZ Geographic Datum 2000) that returned DSM vertical heights different from the 2012 aerial block, which was triangulated using normal-orthometric heights in NZVD2009 (NZ Vertical Datum 2009). The NZ Geoid2009 height model was subtracted from the 2010 DSM that attained its vertical heights compatible with the 2012 DSM. The DSM and a hillshade map were analysed with ArcMap 10.2.1 software (Esri).
Existing fault and geological mapping information were taken from: the GNS Active Fault Database (Langridge et al. Citation2016); the 1:250,000 Hawke’s Bay geological map (Lee et al. Citation2011), as well as mapping soon to be completed as part of a new geological map of Tongariro National Park (Leonard et al. Citation2014).
Fault geometry and displacements
We measured fault geometry (strike and dip), movement sense and fault displacements (mainly throw but occasionally also net slip) using terrestrial laser scanning (TLS) and geomorphic analysis of the DSM. Fault strike and dip were measured in the field using a geological compass. Dip–slip offsets were measured with a tape measure. The tape measure error is 0.1 m plus 8.4% of the measurement (equivalent to the highest percentage error using TLS).
TLS is a ground-based technique used to measure the position and dimension of objects with a rotating laser beam in which thousands of individual points are acquired (x, y, z). In the Upper Waikato Stream, we used a Leica Nova MS50 MultiStation TLS to acquire panorama pictures of the river exposures in conjunction with 3D geo-referenced points, with varying spacing between 2 and 4 cm at c. 30 m distance, which give a 0.03 m resolution on the rasterised data. We used eight scanning locations; each surveyed by a real-time kinematic GPS, which was used as a back-sight point during laser scanning (). The data were processed with Cyclone 8.1 (Leica) and ArcGIS 10.2.1 (Esri) software packages. The merged point cloud data were meshed using the 3DReshaper Application 2014 (Technodigit) to obtain a digital outcrop model of the Upper Waikato Stream in order to measure fault displacements. The reported values () are the average of multiple measurements of the offsets in the digital outcrop model.
Table 1. Net-slip, single-event displacements, progressive displacements and timing of rupture of the Upper Waikato Stream Fault, at section 1.
Displacement measurements for the Wahianoa Fault (section 3) were taken from 10 locations along the fault where a clear scarp displaces geomorphic surfaces of various age. For this, the 2 m resolution DSM was used, leading to an uncertainty of 1 m, plus 10% of the scarp height, due to the irregularity of the ground surface. For error propagation, we used the theory of errors (Taylor Citation1982), as described in Villamor and Berryman (Citation2006a).
Stereonet 9.2 software (RW Allmendinger) was used for plotting the fault planes on the stereographic projection and azimuth frequency with rose diagrams. The net displacements measured in the field were converted into vertical offsets; vertical displacements obtained by the TLS were transformed into dip–slip offset using a fault dip range between 50° and 70°, as suggested by other studied faults within the Taupo Rift (Villamor & Berryman Citation2001; Nicol et al. Citation2006; Mouslopoulou et al. Citation2008). The Plane Vector Convention was used to report the dips (Dip/Dip Dir).
Earthquake history and single-event displacement
Paleoseismological investigations provide direct evidence from stratigraphic data to reconstruct the rupture history of the main faults in the Upper Waikato Stream and Wahianoa faults. Earthquake history was assessed by analysing progressive displacement on tephra layers of increasing age. Most faults have produced multiple earthquakes, as evidenced by the increase in fault displacement with increasing age of the tephras. Event horizons were used in association with differential displacements to identify new faulting events (McCalpin Citation1996).
Subtraction of consecutive total displacement values results in an estimate of co-seismic displacement or single-event displacement. This value may correspond to multiple events (progressive displacement) if several fault ruptures have occurred between depositions of horizons of known age.
Slip-rate, earthquake magnitude and recurrence interval
Knowing the fault displacement accrued over a specific period allows calculation of the fault slip-rate. Variations in fault slip-rates over time are used to compare the faulting history of the Upper Waikato Stream Fault with that of the Rangipo and Wahianoa faults, and with periods of enhanced volcanism in the Taupo Rift.
Earthquake moment magnitudes (MW) are calculated using the fault scaling relationship developed for the TVZ (equation 1) (Villamor et al. Citation2007; Stirling et al. Citation2012), based mainly on the surface-rupture length. Fault lengths are based on the findings of our study. The single-event displacement was calculated with subsurface length and event moment magnitude (MW).(1)
Single-event displacements and fault area are used to assess the different fault length scenarios. Also, in conjunction with fault slip-rate, single-event displacements are used to estimate fault rupture recurrence intervals when possible. For fault width, we assume a 15 km thick seismogenic crust, as suggested by previous seismic studies (Hurst & McGinty Citation1999; Hayes et al. Citation2004; Stirling et al. Citation2012).
Results of paleoseismic analysis
Upper Waikato Stream Fault (sections 1 and 2)
The Upper Waikato Stream Fault is located 15.3 km east of Mt Ruapehu’s active crater lake ( and ). It is a low-relief alluvial fan area, representing an important catchment for regional volcanic tephras and Ruapehu-sourced lahars from the last 50 ka to the Late Glacial warm period (Cronin et al. Citation1996a, Citation1997b; Lee et al. Citation2011; and ).
Section 1
Section 1 of the Upper Waikato Stream Fault is located immediately adjacent to the Desert Road (State Highway 1) ( and ) and extends for 0.4 km along the Upper Waikato Stream. Here, five exposures were surveyed with a TLS (– and S1). Wall ‘a’ is a NE–SW-striking outcrop, 65 m long and 27 m high; walls ‘b’ and ‘c’ are parallel, NNW-striking outcrops 155 m long and 22 m high; and walls ‘d’ and ‘e’ are parallel, NNE-striking outcrops 62 m long and > 13 m high ( and S2). Seven main faults and extensional fractures were analysed in this section (Figure S1).
Figure 4. Terrestrial laser scanning survey. A, Upper Waikato Stream (UWS) 3D point cloud data. B, Oblique view of the digital outcrop model of the wall ‘a’ in the Upper Waikato Stream Fault built with 3DReshaper Application. C, Satellite image (using Google Earth images, 2015) showing the scanning locations and river exposures (walls) for the terrestrial laser scanning survey in the Upper Waikato Stream, section 1 (see location on ).
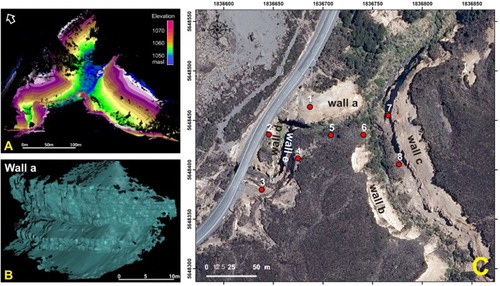
Figure 5. Location of the main faults in the Upper Waikato Stream area. A, Hillshade map of the Upper Waikato Stream based on 2 m DSM showing the studied faults in sections 1 (green rectangle) and 2 (blue dots, blue rectangle). Fault exposures (dots) and fault traces (continuous lines) are differentiated from the inferred faults (discontinuous lines). Faults downthrown to the NW are marked with red lines; faults downthrown to the SE are marked with yellow–brown lines. The fault planes are plotted in stereographic (lower hemisphere) projection and superimposed rose diagrams of fault strike frequency (right-hand rule). B, Section 1 of the Upper Waikato Stream (green rectangle in A) showing the seven main fault traces (purple dots), as well as an extensional fracture and two transects t1 and t2 (white lines) used to sum and calculate total offset for the Upper Waikato Stream Fault.
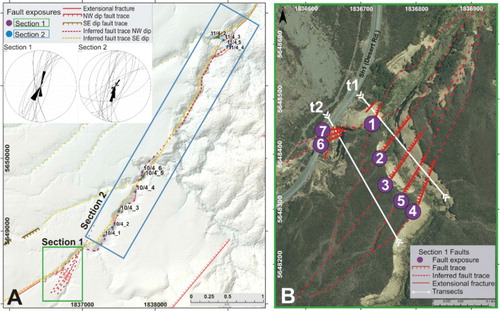
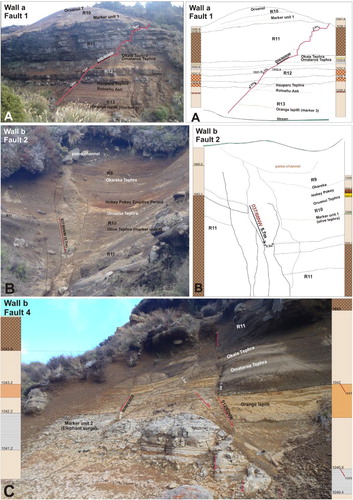
Figure 6. Faults in section 1 in the Upper Waikato Stream. A, Wall ‘a’ main fault exposure, showing fault 1 displacing volcanic deposits older than c. 28 ka (left, field photo; right, interpretation with stratigraphic column). B, Wall ‘b’ showing the location of fault 2 with a 0.3 m ‘fissure fill’ (left, field photo; right, interpretation with stratigraphic column). C, Detailed exposure of fault 4 on wall ‘b’ displacing tephras older than R11 lahars. The numbers show the elevation in m a.s.l. See for further information about stratigraphic units.
Several fault traces have been observed () that we interpret as merging into a single fault plane at depth given their close across-strike proximity (e.g. < 100 m). We also interpreted how these faults splay and merge as we linked them from outcrop to outcrop. The dip direction of the faults was used to assess their continuity from outcrop to outcrop along strike. Based on this interpretation, we infer that the active faulting in the Upper Waikato Stream represents a single fault structure, which we refer to as the Upper Waikato Stream Fault ().
All of the faults studied in section 1 are NE-striking normal faults, dipping to the NW; except for fault 5, which is an antithetic fault and is downthrown to the SE ( and ). Based on our interpretation that these faults coalesce into a single fault at deeper levels, the data were analysed across two transects, which incorporate most deformation accommodated by the Upper Waikato Stream Fault. Transect 1 includes faults 1–5 and transect 2 includes faults 2–7 (). We refer to each individual fault as a strand or splay and the sum of fault strand displacement values represents the total fault displacement. For transect 1, fault 5 is antithetic, so its motion was subtracted from the offset sum of faults 1–4.
Based on progressive displacement increments of individual strands, transect 1 shows evidence for at least nine surface-rupture events between 36.1 ka BP (Hauparu Tephra) and 21.9 ka BP (Okareka Tephra) (). In , we display the measured net displacement values together with the analysis of progressive displacement for each individual fault, as well as summed values for faults within the same transect. We use net displacements on the R11 lahar deposits (c. 27 ka; ; Cronin & Neall, Citation1997) as our best reference to estimate fault slip-rate and to assess distribution of deformation across the transect (across fault strands), because this marker appears in all outcrops. The total displacement across transect 1 (f1 + f2 + f3 + f4 – f5) on R11 lahars is 6.72 ± 0.62 m (net-slip), and at transect 2 (f6 + f7; note that offsets for f2–5 are missing), the offset is 5.43 ± 0.72 m (). The difference likely reflects the missing f2–f5 measurements on transect 2 (not exposed). Thus transect 1, which strikes perpendicular to the fault strike, is the best representation of the total deformation across the Upper Waikato Stream Fault, whereas along the riverbank to the north, exposures are sub-parallel to the faults and faulting information is probably missing because displacement on some makers could not be measured for all faults. The lack of events on some fault strands is related to two possible causes: (1) the Upper Waikato Stream Fault is comprised of several parallel fault strands at a single location and thus it is possible that not all strands ruptured at once (see e.g. Paeroa Fault, North Taupo Rift, Berryman et al. Citation2008) and not all strands are exposed at each location; (2) not all recognisable horizons were exposed at each of the fault exposures, or they were obscured by vegetation.
The progressive displacement analysis of marker R11 lahar deposits may also help us to assess the amount of deformation that might be missing on other chronological markers. It seems that all fault splays in the Upper Waikato Stream Fault could have ruptured at the same time across transect 1 for some individual surface ruptures because progressive displacement is associated with all strands. Assuming that the summed progressive displacement for R11 lahars in transect 1 is the best representation of the Upper Waikato Stream Fault movement, we can assess the percentage of deformation that is accommodated by each individual fault strand, namely 10%, 58%, 12%, 26% and −6% (antithetic fault), for faults 1, 2 3, 4 and 5, respectively. These percentages can be applied to other chronological markers for faults without information in order to assess total deformation at different times. When we use these percentages for other tephra layers, it suggests that we may miss between 30% and almost 100% of the total progressive displacement on those other markers. With this exercise, we are assuming that all faults always rupture during individual earthquakes. This is a conservative (maximum) approach because it has been observed on normal faults that splay into several fault strands at the surface, that surface rupture can occur on different fault splays for different events in a random way (see, e.g. Berryman et al. Citation2008). However, this approach allows a conservative estimate for displacement increments that can be compared with the sum values obtained using only the information that we have measured on the outcrops (minimum).
Extensional fractures
In section 1, on the NE side of wall ‘a’, there is a > 12 m long narrow fissure, dipping 030/68NW () that cuts through tephra and debris flows which are older than 18–16 ka BP. The fissure is 0.05–0.19 m wide and filled with the Taupo-sourced rhyolitic Ōruanui ignimbrite and associated tephra fall (25.4 cal ka BP; Wilson et al. Citation2006; Vandergoes et al. Citation2013). At some levels, the reworked Ōruanui Tephra shows finer grain-size banding and cross-bedding stratified layers, suggesting that water was involved in the transport–depositional process.
Figure 7. Extensional fractures located on wall ‘a’ in the Upper Waikato Stream. A, The 12 m long fissure filled with Ōruanui Tephra (white arrow; > 25.4 cal ka BP; photo taken by S. Donoghue), cutting older tephras and lahar deposits. B, Other fissures were measured on the same wall, cutting R11 lahars. C, These fissures do not show any vertical displacement, but record extension. D, The R11 lahar deposits are abruptly truncated at the fissure margins, with no mixed material along fissure sides. The reworked Ōruanui tephra shows cross-bedding stratified layers. E, All the fissures reflect orthogonal extension and are consistent with the NNE-trending Mt Ruapehu Graben. Rose diagrams for the measured fissures and faults in the Tongariro Volcanic Centre (TgVC), where strike directions (right-hand rule) are plotted.
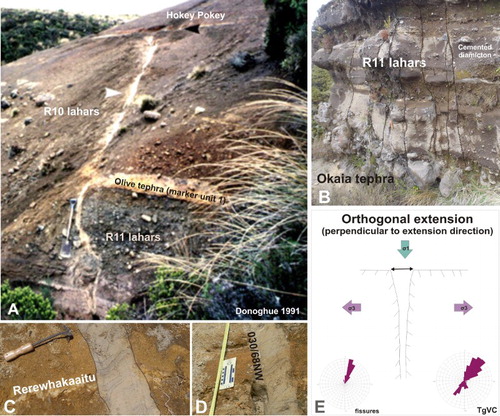
Just below this fissure, on the same wall, there are > 10 other fissures cutting R11 lahar deposits (27 ka), some also filled with reworked Ōruanui Tephra. They vary slightly in orientation from 350° to 035°, generally matching the preferred direction of the main faults in southern TVZ (027°), downthrown to the NNW with steep dips (80°–90°) (Rowland & Sibson Citation2001), and similar to the orientations of the faults described here for the Upper Waikato Stream Fault. There is also a normal 170/78W fault that vertically displaces the R11 lahars by 0.18 ± 0.14 m (0.21 ± 0.14 m of net displacement) ().
The main Upper Waikato Stream fissure was noted earlier by Donoghue and Neall (Citation2001), while Topping (Citation1973) described two similar structures in the Poutu canal () and another section nearby (60H 5678969.46 m S, 385626.35 m E). The sites described by Topping (Citation1973) are no longer exposed, but the fissures were described as relating to the Ōruanui eruption, and are up to 0.52 m wide and striking at 356, cutting through lapilli and tuff deposits older than Ōruanui ignimbrite.
Section 2
Section 2 of the Upper Waikato Stream Fault starts 0.5 km downstream (NE) from section 1, and continues for 5 km downstream of the Tongariro River from there ( and ). Measurements on these faults were made using conventional field techniques, but only the lower few metres of the riverbanks could be reached, the remainder is bush covered or inaccessible. Eleven fault planes were described along this section, which helped assess fault continuity and kinematics, when we combined results with those of section 1 ( and S3).
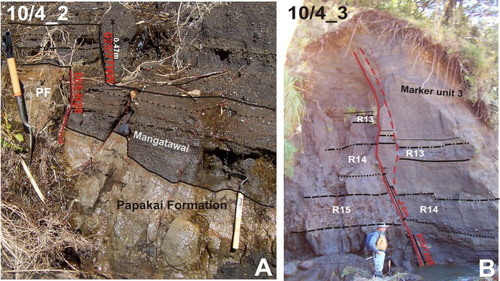
Figure 8. Main outcrops of the Upper Waikato Stream Fault in section 2. A, 10/4_2: Normal fault displacing the Papakai Formation. B, 10/4_3: Exposure of fault displacing deposits including R13 and older lahars.
Earthquake history
A summary of the fault strike and dip, net-slip offsets and progressive displacement analysis is shown in . Faults 11/4_1, 11/4_2 and 11/4_3 are not included in because the stratigraphic position of the deposits that they display is uncertain. These data confirm that our summed values (see below) are minimum offsets because we might be missing some faults. Fault 11/4_1 crops out at the Tongariro River and is a 075/60S normal fault that cuts the Mesozoic greywacke sequence in the Kaimanawa Mountains (Lee et al. Citation2011). Fault 11/4_2 includes two normal faults: 042/64SE with > 6 ± 0.3 m of vertical displacement (> 6.9 ± 0.96 m of net-slip); and 035/72SE with 0.5 ± 0.2 m of vertical displacement (0.58 ± 0.22 m of net-slip). Fault 11/4_3 is a small normal fault 060-striking and dipping 76° NW with 0.4 ± 0.2 m of vertical offset (0.46 ± 0.21 m of net-slip). Three faults in section 2 (10/4_3, 10/4_5, 11/4_2; ) are dipping to the SE (antithetic).
Table 2. Net-slip, single event displacement and timing of fault rupture of the Upper Waikato Stream Fault, at section 2.
Based on the analysis of progressive displacement of individual fault strands, we distinguish a minimum of two events in section 2 from 133 to 1.72 cal ka BP. The first event took place between 55 and 11.77 cal ka BP, possibly approximately < 25 ka, and the second event < 11 cal ka BP; this latter event is additional to those found in section 1. A total of 12 events can be extracted for the information analysed in sections 1 and 2. Our data show a gap of seismic activity between 21.9 and 13.64 cal ka BP for the Upper Waikato Stream Fault (, , and S1).
Wahianoa Fault (section 3)
The Wahianoa Fault clearly displaces lava flows, moraines, tephras and lahar deposits for 10 km along the southeast flanks of Mt Ruapehu (, and S4). We traced 10 topographic profiles across the fault on geomorphic surfaces of known age in order to assess the fault’s earthquake history in section 3. We also analysed three outcrops within the Karioi Forest that expose the Wahianoa Fault ().
Figure 9. Wahianoa Fault profiles and outcrops. A, Geological map (Leonard et al. Citation2014) showing the location of the studied field sites along the Wahianoa Fault in section 3; and the 10 topographic profiles (39)pehu. ld photo; B the TgVC (e) traced with their corresponding vertical offset values in metres. The geological map overlies a hillshade created with a 2 m-resolution Digital Surface Model from the SE flank of Mt Ruapehu. B–C, The two main outcrops of the Wahianoa Fault in section 3 showing displaced tephra (field locations shown on A). The fault planes are plotted in stereographic (lower hemisphere) projection and superimposed rose diagrams of fault strike frequency (right-hand rule). Most of the tephra belongs to the Bullot Formation from Mt Ruapehu (Donoghue & Neall Citation2001; Pardo et al. Citation2012). See for more information about the stratigraphy and for location of section 3.
Earthquake history
All the Wahianoa Fault planes exposed in the outcrops in section 3 are NE-striking, SE-dipping normal faults. At the ‘Tonga 23’ field site, the faults exposed are antithetic to the main fault ( and S4). Unfortunately, we could only analyse progressive displacement on exposed fault planes for the antithetic faults (), which helps us assign timing to some individual rupture events, but not to assess single-event displacements for the main fault. That fault shows that two ruptures occurred between 23 and 11.77 cal ka BP.
Table 3. Net-slip, single-event displacements, progressive displacements and timing of rupture of the Wahianoa Fault, at section 3.
Displacements on geomorphic surfaces show different offsets for different ages (). Some measurements give a minimum offset, because the downthrown block is buried by younger deposits. We can account for seven progressive displacement increments for the geomorphic displacements measured along the fault (profiles in ), suggesting that at least seven events occurred. If we combine the outcrop data with the geomorphic data, we add two more ruptures (). However, values of progressive displacement increments for geomorphic data are too large (2–12 m), suggesting that those values are related to several ruptures (see more on single event displacements below) and that the nine events analysed are a minimum for the last c. 130 kyr.
Discussion
Based on an analysis of the variation in slip-rate on each fault () and their paleoseismic histories, we are able to suggest the role of each fault in the kinematics of the Taupo Rift, the implications for seismic hazard and their possible association with volcanism.
Is the Upper Waikato Stream Fault part of the Rangipo Fault or part of the Wahianoa Fault?
The location of our study area is at the putative intersection between the Rangipo and the Wahianoa faults, hence we tried to assess whether the Upper Waikato Stream Fault ( and ) can be associated with one fault or the other. This has been evaluated by a comparison of fault geometry, event history and fault slip-rate.
Based on the fault geometry, we interpret the extension of the Upper Waikato Stream and suggest that it may have a physical linkage with the Rangipo and the Wahianoa faults (see potential fault linkage models in ). First, we look at the outcrops of sections 1 and 2 within the Upper Waikato Stream. Faults 10/4_2, 10/4_4, 10/4_6, 11/4_3, 11/4_4 and 11/4_5 in section 2 are the same fault, and equivalent to the Upper Waikato Stream Fault of section 1, because they have similar strike and throw sense (NW–W) () and are in close proximity, and thus we interpret that the Upper Waikato Stream Fault extends at least from section 1 to point 11/4_5 (). This suggests that the Upper Waikato Stream Fault is at least 15 km long if it is an independent fault (A).
Second, and with respect to the linkage with the Rangipo Fault, the Stereonet diagrams in show that section 1 of the Upper Waikato Stream Fault, close to the Rangipo Fault, has a strike that varies from 000 to 030°, similar to the Rangipo Fault. Some of the fault strike measurements from section 2 are also similar to those of the Rangipo Fault and thus we consider that Rangipo Fault might extend northwards into section 2 of the Upper Waikato Stream Fault, and perhaps beyond into the Kaimanawa Fault (see further discussion below). This is represented as a fault linkage model in C.
Finally, we look at the possible linkage of the Upper Waikato Stream Fault with the Wahianoa Fault. Faults 10/4_3, 10/4_5, 11/4_1 and 11/4_2 are downthrown to the S–SE. These may be antithetic faults to the Upper Waikato Stream, but also might be part of, or to some extent controlled by, the Wahianoa Fault ( and ). This might suggest that the Wahianoa Fault extends to point 11/4_2 in , and thus a model in which the faults intersect or merge has been developed (B). Section 2 has a greater strike range (000 to 070°E) that can be attributed to the influence of the Wahianoa Fault at that latitude (). If we consider them as part of the Wahianoa Fault, they can confirm events 3 and 9 of section 3 (see ).
Table 4. Comparison of fault rupture number and timing of the Upper Waikato Stream, Wahianoa and Rangipo faults.
Based on earthquake history and timing of events, we observe that the Upper Waikato Stream Fault might have ruptured in conjunction with the Rangipo and Wahianoa faults (). Comparisons of the rupture history of the Upper Waikato Stream Fault with the Rangipo and Wahianoa faults for the last 11 kyr show that there were two events on the Rangipo (events 4 and 6) and Upper Waikato Stream (events 11 and 12) faults that might overlap in time; one c. 11 cal ka BP and another c. 3.5 cal ka BP. Possibly one event at c. 11 cal ka BP on the Wahianoa Fault (event 8 or 9) also overlaps with the Rangipo and Upper Waikato Stream faults rupture.
Based on a comparison of slip-rate variations in time (), the Upper Waikato Stream Fault has a contrasting pattern to that of the Rangipo and Wahianoa faults. Assuming that the summed progressive displacement for R11 lahars represents all of the Upper Waikato Stream Fault movement, the mean maximum slip-rate over the last 45 ka is 0.63 ± 0.06 mm/yr. With only observed data, the minimum slip-rate is 0.3 ± 0.06 mm/yr (). From past to present on the Upper Waikato Stream Fault, the slip-rate has changed from 0.45 mm/yr to 1.5 mm/yr and to 0.26 mm/yr for the periods c. 45–36.1, c. 36.1–23.65 and 23.65 cal ka BP to the present, respectively ().
Figure 10. Fault slip-rate variation from > 45 ka to present day for the Rangipo Fault (![]()
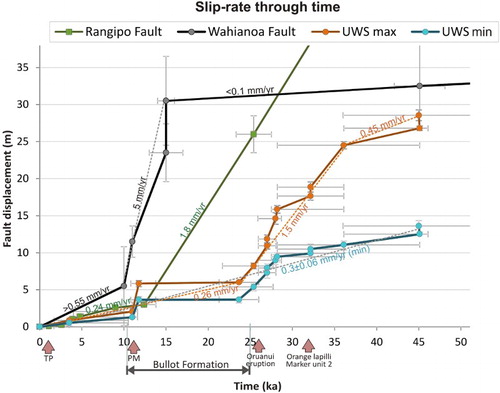
The slip-rate on the Wahianoa Fault varied over time: from 45 to 15 cal ka BP it was < 0.1 mm/yr; from 15 to 10 cal ka BP it increased to 5 mm/yr; and from 10 cal ka BP to the present day it decreased to > 0.55 mm/yr (note that the most recent observed data are for 10 cal ka BP, and thus the age of the change in slip-rate and the slip-rate are minimum values). The slip-rate on the Rangipo Fault varied in a different fashion: from > 25.4 to 13.6 cal ka BP it was 1.8 mm/yr and from 13.6 cal ka BP to the present day it decreased to 0.24 mm/yr ().
All faults seem to have a period of higher slip-rate, followed by a period of lower slip-rate into the present. However, these periods of higher slip-rate do not coincide with each other: the Rangipo Fault accelerates at 13.6 cal ka BP; the Upper Waikato Stream Fault at 23.65 cal ka BP, although there is a small increase at 11 ka; and the Wahianoa Fault at 10 cal ka BP (or earlier).
From 11 cal ka BP to the present day, all the faults have apparently experienced lower slip-rates, between 0.24 and 0.55 mm/yr, and during this period it was more likely that the Upper Waikato Stream Fault might have ruptured together with either the Rangipo Fault or the Wahianoa Fault. From 11 to 25 ka, the Rangipo Fault had an accelerated period that is not reflected on the Upper Waikato Stream Fault, suggesting that they might have moved independently ().
In summary, the Upper Waikato Stream Fault is a newly discovered and potentially independent seismogenic source in the southern termination of the Taupo Rift, but a fault that could also rupture together with the Rangipo or the Wahianoa faults.
The role of the Wahianoa, Upper Waikato Stream and Rangipo faults in the kinematics and evolution of the Taupo Rift
Since rifting and extensive volcanism started in this area approximately > 340 ka ago (Gamble et al. Citation2003; Villamor & Berryman 2006), the Wahianoa and Rangipo faults formed, contemporaneously and oblique to each other, playing an important role in the kinematics and evolution of the southern termination of the Taupo Rift.
The orientation of the Upper Waikato Stream and Wahianoa faults were probably inherited from basement faults such as the Oligocene–Miocene Kaimanawa Fault (; Kear Citation1993) seen in the Kaimanawa Mountains, east of the Mt Ruapehu Graben. In several NE- to ENE-striking lineaments, sub-parallel to the Kaimanawa, Wahianoa and Upper Waikato Stream faults can be observed in the exposed basement in the Kaimanawa Mountains. The strike of the Rangipo Fault does not seem to be represented in the basement lineaments in the Kaimanawa Mountains, but it is possible that the dominant NNE trend of the faults, just north of this area in the Tongariro domain, is forcing the NNE-strike into the Mt Ruapehu Graben area (Villamor & Berryman Citation2006b).
Villamor and Berryman (Citation2006a) suggest that the co-existence of active normal faults with very oblique fault trends in the wider southern Taupo Rift region is likely to be explained by a stress tensor with vertical│σ1│>│σ2│≈│σ3│ that will cause radial extension (radial strain) and where, theoretically, any normal fault direction is possible. Townend et al. (Citation2012) also found several orientations of the azimuth of the maximum horizontal compressive stress (SHmax) in their analysis of the shallow focal mechanism in the region of southern Taupo Rift. If radial stresses are affecting the crust in the Mt Ruapehu area and any fault direction is possible, but still we see a preferred NE orientation, it is possible that the NE and ENE fault trends that dominate in our study area are controlled by pre-existing weaknesses in the basement.
Our study shows that in the short term (few thousands of years), the Wahianoa, Rangipo and Upper Waikato Stream faults have been accommodating extension at the same time, but have taken dominant roles during different periods. The Upper Waikato Stream Fault was dominant from 36.1 to 23.65 cal ka BP (higher slip-rate period), whereas the Rangipo Fault was dominant from > 25 to < 15 cal ka BP, and the Wahianoa Fault was dominant from 15 to 10 cal ka BP (). These changes in slip-rate over time might represent short periods (c. 5–10 ka) when one extension direction may predominate over others, whereas in the long term (e.g. since the inception of rifting at > 340 ka) the deformation pattern shows extension in different directions. It is also possible that slip variability is simply related to fault interactions (stress transfer among closely spaced faults) as observed globally for other extensional tectonic regimes (Weldon et al. Citation2004; Nicol et al. Citation2006; Mouslopoulou et al. Citation2009; Ferry et al. Citation2011; Cowie et al. Citation2012; Benedetti et al. Citation2013), or that slip-rate variability is a combination of both processes, fault interactions and short-term changes in the extension direction.
The prominent decrease in slip-rate of the Upper Waikato Stream Fault since c. 24 ka could be used as a sign of rift evolution at this latitude. The Upper Waikato Stream and Rangipo faults represent the east margin of the Taupo Rift, at or very near the major lithological boundary between volcanic rocks and basement greywacke. It is known from the volcanic/greywacke contact that the rift narrows to the north of this area (Villamor & Berryman 2006). The decrease in the slip-rate of the Upper Waikato Stream Fault, and the lack of geomorphic expression that suggests low current activity, might be a consequence of the Mt Ruapehu Graben margin shifting closer to the axis at the Tongariro Graben. However, it is possible that the decrease in slip-rate of the Upper Waikato Stream Fault is a consequence of fault interactions and transfer of motion onto other faults. If so, a rift narrowing at this latitude is not necessary.
Seismic hazard from the Upper Waikato Stream and Wahianoa faults
In this section, we evaluate the seismic hazard for the studied faults estimating single-event displacements, earthquake magnitudes and recurrence times for segments of different surface lengths.
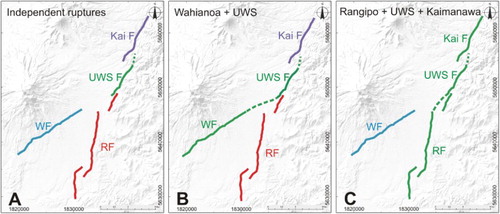
Average single-event displacements are derived from fault length using fault-rupture scaling relations (see Methods section) and can be used to assess whether the progressive displacements calculated above represent one or multiple single-event displacements. Fault rupture length is also used to assess future earthquake magnitudes. Several scenarios were considered for rupture of the Upper Waikato Stream Fault (). The Upper Waikato Stream Fault was mapped for only 5.5 km given the lack of geomorphic expression but we expect that, as an individual seismogenic source, it may be at least as long as the thickness of the seismogenic crust, that is c. 15 km (A). We calculate that a combined rupture of the Wahianoa and Upper Waikato Stream faults will produce c. 27 km of rupture (B). Rupture of the Upper Waikato Stream and Rangipo faults was suggested as a possibility by Villamor et al. (Citation2007). They suggested the potential rupture of the entire Rangipo Fault, including the section between the mapped traces and the Kaimanawa Fault, a section that includes the newly defined Upper Waikato Stream Fault (C). Our observations support a potential fault rupture of up to 43 km.
Figure 11. Potential physical intersections and rupture models of the Upper Waikato Stream Fault with Rangipo and Wahianoa faults. A, Independent ruptures. B, Potential rupture of the Wahianoa (WF) and Upper Waikato Stream (UWS F) faults (27 km). C, Potential rupture of the Rangipo (RF), Upper Waikato Stream and Kaimanawa (Kai F) faults (43 km).
For a 27 km long surface rupture (Upper Waikato Stream Fault along with Wahianoa Fault) we obtain a MW6.8 earthquake with an average single-event displacement of 1.26 m (). For a 43 km long surface rupture (Upper Waikato Stream Fault along with Rangipo Fault), we obtain a MW7.1 earthquake and a single-event displacement of 2.4 m. These single-event displacement values represent a total-fault rupture. Lower single-event displacement values (< 1 m) suggest a segmented fault rupture.
Table 5. Moment magnitude and single-event displacement for different fault lengths.
Based on the estimated average displacements, the maximum progressive displacements for events 1, 3, 4, 5, 9 and 11 on the Upper Waikato Stream Fault could represent a whole-fault rupture, whereas minimum progressive displacements for all the events represent segmented ruptures. Greater values (e.g. 2.73 m on event 8) represent multiple rather than single-event displacements ( and ).
Based on the combined findings, we estimate the minimum recurrence interval for various periods (). For the Wahianoa Fault, the recurrence interval is 2.4 ka between 25.4 and 11.2 cal ka BP, and 13.6 ka between 133 and 11 cal ka BP (based on sections 2 and 3). For the Upper Waikato Stream Fault, the recurrence interval is 1.6 ka between 36.1 and 21.9 cal ka BP (section 1) and 3.5 ka between 45 and 3.52 cal ka BP (sections 1 and 2).
Earlier studies on the Wahianoa Fault (Villamor & Berryman 2006) estimated mean slip-rates of 0.3 mm/yr. Our data show that the Wahianoa Fault could have a minimum slip-rate of 0.55 mm/yr from 10 ka to the present day, changing the current seismic hazard potential. Consequently, our study provides an update to the National Seismic Hazard Model for New Zealand (Stirling et al. Citation2012; Litchfield et al. Citation2014). Our data reinforce the segment surface lengths given to the Rangipo (up to 43 km; Villamor et al. Citation2007) and Wahianoa (27 km; Stirling et al. Citation2012) faults.
Potential association of volcanism with periods of accelerated seismic activity
Fault slip-rate variations appear to be associated with times of enhanced volcanism in the TgVC (Villamor et al. Citation2007). Higher slip-rate periods in the Upper Waikato Stream Fault seem to be coincident with the very large Ōruanui eruption from the Taupo caldera immediately to the north (25.4 ± 0.2 cal ka BP; vent located 50 km from the fault) at the same time that large extension fissures formed in close proximity to the Upper Waikato Stream Fault (). This eruption was one of the largest known over the last c. 40 ka, producing 530 km3 of erupted magma (Wilson Citation2001). An acceleration of the Upper Waikato Stream Fault movement may also coincide with the eruption of the Orange lapilli (Mt Ruapehu; vent located 15 km from the fault) and marker unit 2 (probably Mt Tongariro) at c. 32 ka, as well as with the major Pahoka–Mangamate eruption sequence at c. 11 cal ka BP (vent located 18 km from the fault), an eruptive process during regional extension in the TgVC (Topping Citation1973; Nairn et al. Citation1998). In the Rangipo Fault, a higher slip-rate period coincides with the eruptions of the Bullot Formation, a period of frequent major plinian eruptions of Mt Ruapehu from 25 to 11 cal ka BP (Donoghue et al. Citation1991; Pardo et al. Citation2012) (vent located 13 km from the Rangipo Fault). In the Wahianoa Fault, a higher slip-rate period coincides with the Pahoka–Mangamate eruption sequence at c. 11 cal ka BP (vent located 18 km from the Wahianoa Fault) ().
During these periods of large and explosive volcanic eruptions, the extension across this portion of the rift may be mainly accommodated by dike intrusion, and crustal stresses created by the volcanic intrusions could be influencing the slip-rate changes for some of the faults. The temporal association of Bullot Formation (Mt Ruapehu) and Pahoka–Mangamate (Ngāuruhoe, Tongariro) eruptions with periods of increased activity on the southern faults (Rangipo and Wahianoa) implies a connection between volcanic and tectonic activity, but the faults did not react in the same way. The Rangipo Fault may have been more connected to the Bullot Formation eruptions from Ruapehu Volcano and the Wahianoa Fault to the Pahoka–Mangamate eruptions from Tongariro and Ngāuruhoe volcanoes ().
The distance and magnitude of volcanism (e.g. dike opening), together with fault orientations, determine whether the fault will be affected by dike intrusion. The Upper Waikato Stream Fault was strongly affected by the Ōruanui eruption, presenting a higher slip-rate period and extensional fissures. This suggests that Ōruanui eruption was significant enough to alter the crustal stress at distances of > 55 km from the caldera, and perhaps change the kinematics of the rift by allowing the activity to shift from the margin of the rift towards the axis.
Conclusions
This study provides an updated understanding of the eastern boundary of the Taupo Rift close to its termination, extending the mapping of active faults in this area and adding more information on fault characterisation for hazard assessment and suggesting potential volcano–tectonic interactions. The NE-striking Upper Waikato Stream Fault is a newly discovered and potential independent seismogenic earthquake source at the eastern boundary of the rift just north of the NNE-striking Rangipo Fault. Geological evidence suggests that the Upper Waikato Stream Fault might be an independent fault, but might also rupture in conjunction with the Wahianoa and/or Rangipo Fault. The EWE-striking Wahianoa, a known active fault, might be potentially linked with the Upper Waikato Stream Fault, forming a fault intersection pattern similar to those described farther south in the rift.
Paleoseismic and geomorphic analyses demonstrate the occurrence of at least 12 surface-rupturing earthquakes in the last 45 ka on the Upper Waikato Stream Fault, which has a mean slip-rate of 0.3 ± 0.06 to 0.63 ± 0.06 mm/yr. New data on the Wahianoa Fault suggest at least nine surface-rupturing earthquakes in the last 133 ka, and we calculate a long-term mean slip-rate of 0.15 ± 0.31 mm/yr for this fault.
Our study provides new data to update the National Seismic Hazard Model (Stirling et al. Citation2012; Litchfield et al. Citation2014) for this region. The new seismic source been defined here, the Upper Waikato Stream Fault (MW6.5), can be added to the National Seismic Hazard Model. Also, the Wahianoa Fault has a slip-rate of > 0.55 mm/yr from 10 cal ka BP to the present day, faster than in the current National Seismic Hazard Model. The rupture lengths for the Wahianoa and Rangipo faults were confirmed, the Wahianoa Fault might rupture together with the Upper Waikato Stream Fault (27 km), and the Rangipo Fault might rupture together with the Upper Waikato Stream and Kaimanawa faults, giving a total surface-rupture length of 43 km.
The Rangipo Fault might have ruptured at the same time as the Upper Waikato Stream Fault at c. 11 and 3.52 cal ka BP (), posing a greater potential seismic hazard. For a 27 km long rupture of the Wahianoa Fault together with the Upper Waikato Stream Fault, the expected earthquake would be MW6.8; and for a 43 km long rupture, involving the Rangipo Fault with the Upper Waikato Stream and the Kaimanawa faults, we would expect a MW7.1 earthquake.
The slip-rate variability of the Upper Waikato Stream and Wahianoa faults estimated here has been compared with existing data on the Rangipo Fault. Tentative explanations of the slip-rate changes on these three faults are: (1) stress transfer interactions among closely space faults, similar to other observations for the Taupo Rift farther north; (2) short-term (few thousands of years) changes in extension direction, with the Wahianoa, Rangipo and Upper Waikato Stream faults taking dominant roles in different periods; (3) higher slip-rate periods coinciding with periods of major explosive volcanism (e.g. the Ōruanui eruption from Taupo caldera at 25.4 ± 0.2 cal ka BP coinciding with higher slip-rates on the Upper Waikato Stream Fault, the Bullot Formation from Mt Ruapehu at 25–11 ka with the Rangipo Fault, and the Pahoka–Mangamate eruptions from Tongariro at 11 cal ka BP with the Wahianoa Fault); (4) rift evolution with slip-rate decrease at the rift boundary suggesting shifting of active faulting closer to the rift axis (as has been described farther north); and (5) a combination of all or some of the process above.
Table S2.
Download MS Word (21.2 KB)Table S1.
Download MS Word (24.3 KB)Figure S4. Wahianoa Fault outcrops.
Download JPEG Image (1.6 MB)
Figure S3. Faults in section 2, Upper Waikato Stream.
Download JPEG Image (1.9 MB)
Figure S2. Faults in section 1, Upper Waikato Stream.
Download JPEG Image (1.4 MB)
Figure S1. Panorama pictures of the main walls in the Upper Waikato Stream Fault, section 1.
Download JPEG Image (2.2 MB)
Acknowledgements
We wish to thank Kate Arentsen, Anja Moebis and the Volcanic Risk Solutions group in Massey University for their support. We acknowledge the Department of Conservation staff of Tongariro National Park. We also thank the Waiouru Military Camp for providing access to the restricted zones. We thank the reviewers (Dr Vasso Mouslopoulou and Associate Professor Julie Rowland) and editor of the NZJGG (Dr Nick Mortimer) for their comments that greatly improved the presentation of our data.
Associate Editor: Dr Nick Mortimer.
Disclosure statement
No potential conflict of interest was reported by the authors.
ORCiD
SJ Cronin http://orcid.org/0000-0001-7499-603X
G Kereszturi http://orcid.org/0000-0003-4336-2012
Additional information
Funding
Related Research Data
References
- Acocella V, Spinks K, Cole J, Nicol A. 2003. Oblique back arc rifting of Taupo Volcanic zone, New Zealand. Tectonics. 22(4):1045. doi:10.1029/2002TC001447
- Alloway B, Lowe DJ, Chan RPK, Eden D, Froggatt P. 1994. Stratigraphy and chronology of the Stent tephra, a c. 4000 year old distal silicic tephra from Taupo Volcanic Centre, New Zealand. New Zeal J Geol Geop. 37(1):37–47. doi: 10.1080/00288306.1994.9514599
- Benedetti L, Manighetti I, Gaudemer Y, Finkel R, Malavieille J, Pou K, Arnold M, Aumaître G, Bourlès D, Keddadouche K. 2013. Earthquake synchrony and clustering on Fucino faults (Central Italy) as revealed from in situ 36Cl exposure dating. J Geophy Res Solid Earth. 118(9):4948–4974. doi: 10.1002/jgrb.50299
- Berryman K, Villamor P, Nairn I, Van Dissen R, Begg J, Lee J. 2008. Late Pleistocene surface rupture history of the Paeroa fault, Taupo rift, New Zealand. New Zeal J Geol Geop. 51(2):135–158.
- Conway CE, Townsend DB, Leonard GS, Wilson CJN, Calvert AT, Gamble JA. 2015. Lava-ice interaction on a large composite volcano: a case study from Ruapehu, New Zealand. B Volcanol. 77(3):1–18. doi: 10.1007/s00445-015-0906-2
- Cowie PA, Roberts GP, Bull JM, Visini F. 2012. Relationships between fault geometry, slip rate variability and earthquake recurrence in extensional settings. Geophy J Int. 189(1):143–160. doi: 10.1111/j.1365-246X.2012.05378.x
- Cronin SJ, Hodgson KA, Neall VE, Pamer AS, Lecointre JA. 1997a. 1995 Ruapehu lahars in relation to the late Holocene lahars of Whangaehu River, New Zealand. New Zeal J Geol Geop. 40:507–520. doi: 10.1080/00288306.1997.9514780
- Cronin SJ, Neall VE. 1997. A late Quaternary stratigraphic framework for the northeastern Ruapehu and eastern Tongariro ring plains, New Zealand. New Zeal J Geol Geop. 40(2):185–197. doi: 10.1080/00288306.1997.9514752
- Cronin SJ, Neall VE, Palmer AS. 1996a. Geological history of the north-eastern ring plain of Ruapehu volcano, New Zealand. Quatern Int. 34-36:21–28. doi: 10.1016/1040-6182(95)00066-6
- Cronin SJ, Neall VE, Palmer AS. 1997b. Lahar history and hazard of the Tongariro River, northeastern Tongariro Volcanic Centre, New Zealand. New Zeal J Geol Geop. 40(3):383–393. doi: 10.1080/00288306.1997.9514769
- Cronin SJ, Neall VE, Stewart RB, Palmer AS. 1996b. A multiple parameter approach to andesitic tephra correlation, Ruapehu volcano, New Zealand. J Volcanol Geoth Re. 72:199–215. doi: 10.1016/0377-0273(96)00008-X
- Danišík M, Shane P, Schmitt AK, Hogg A, Santos GM, Storm S, Evans NJ, Keith FL, Lindsay JM. 2012. Re-anchoring the late Pleistocene tephrochronology of New Zealand based on concordant radiocarbon ages and combined 238 U/230 Th disequilibrium and (U–Th)/He zircon ages. Earth Planet Sci Lett. 349-350:240–250. doi: 10.1016/j.epsl.2012.06.041
- Donoghue SL, Neall VE. 2001. Late Quaternary constructional history of the southeastern Ruapehu ring plain, New Zealand. New Zeal J Geol Geop. 44(3):439–466. doi: 10.1080/00288306.2001.9514949
- Donoghue SL, Neall VE, Palmer AS. 1995. Stratigraphy and chronology of late Quaternary andesitic tephra deposits, Tongariro Volcanic Centre, New Zealand. J R Soc New Zeal. 25(2):115–206. doi: 10.1080/03014223.1995.9517487
- Donoghue SL, Stewart RB, Palmer AS. 1991. Morphology and chemistry of olivine phenocrysts of Mangamate tephra, Tongariro Volcanic Centre, New Zealand. J R Soc New Zeal. 21(3):225–236. doi: 10.1080/03036758.1991.10418180
- Eaves SR, Winckler G, Schaefer JM, Vandergoes MJ, Alloway BV, Mackintosh AN, Townsend DB, Ryan MT, Li X. 2015. A test of the cosmogenic 3He production rate in the south-west Pacific (39°S). J Quatern Sci. 30(1):79–87. doi: 10.1002/jqs.2760
- Ferry M, Meghraoui M, Karaki NA, Al-Taj M, Khalil L. 2011. Episodic behavior of the Jordan Valley section of the Dead Sea fault inferred from a 14-ka-long integrated catalog of large earthquakes. Bull Seismol Soc Am. 101(1):39–67. doi: 10.1785/0120100097
- Froggatt PC, Lowe DJ. 1990. A review of late Quaternary silicic and some other tephra formations from New Zealand: their stratigraphy, nomenclature, distribution, volume, and age. New Zeal J Geol Geop. 33(1):89–109. doi: 10.1080/00288306.1990.10427576
- Gamble JA, Price RC, Smith IE, McIntosh WC, Dunbar NW. 2003. 40Ar/39Ar geochronology of magmatic activity, magma flux and hazards at Ruapehu volcano, Taupo Volcanic Zone, New Zealand. J Volcan Geoth Res. 120(3):271–287. doi: 10.1016/S0377-0273(02)00407-9
- Hackett WR, Houghton BF. 1989. A facies model for a Quaternary andesitic composite volcano: Ruapehu, New Zealand. Bulletin Volcan. 51(1):51–68. doi: 10.1007/BF01086761
- Hajdas I, Lowe DJ, Newnham RM, Bonani G. 2006. Timing of the late-glacial climate reversal in the Southern Hemisphere using high resolution radiocarbon chronology for Kaipo bog, New Zealand. Quatern Res. 65:340–345. doi: 10.1016/j.yqres.2005.08.028
- Hayes G, Reyners M, Stuart G. 2004. The Waiouru, New Zealand, earthquake swarm: persistent mid crustal activity near an active volcano. Geophy Res Lett. 31(19):L19613. doi:10.1029/2004GL020709
- Hitchcock DW, Cole JW. 2007. Potential impacts of a widespread subplinian andesitic eruption from Tongariro volcano, based on a study of the Poutu Lapilli. New Zeal J Geol Geop. 50(2):53–66. doi: 10.1080/00288300709509821
- Hodgson KA. 1993. Late quaternary lahars from Mount Ruapehu in the Whangaehu River, North Island, New Zealand: a thesis presented in partial fulfilment of the requirements for the degree of Doctor of Philosophy in Soil Science at Massey University.
- Hodgson KA, Lecointre JA, Neall VE. 2007. Onetapu formation: the last 2000 yr of laharic activity at Ruapehu volcano, New Zealand. New Zeal J Geol Geop. 50(2):81–99. doi: 10.1080/00288300709509823
- Hogg AG, Lowe DJ, Palmer JG, Boswijk G, Bronk Ramsey CJ. 2012. Revised calendar date for the Taupo eruption derived by 14C wiggle-matching using a New Zealand kauri 14C calibration data set. Holocene. 22:439–449. doi: 10.1177/0959683611425551
- Hurst AW, McGinty PJ. 1999. Earthquake swarms to the west of Mt Ruapehu preceding its 1995 eruption. J Volcanol Geoth Re. 90(1):19–28. doi: 10.1016/S0377-0273(99)00019-0
- Kear D. 1993. Reflections on major North Island basement rock assemblages and on megafaults. J R Soc New Zeal. 23(1):29–41. doi: 10.1080/03036758.1993.10721215
- Keigler R, Thouret JC, Hodgson KA, Neall VE, Lecointre JA, Procter JN, Cronin SJ. 2011. The Whangaehu Formation: Debris-avalanche and lahar deposits from ancestral Ruapehu volcano, New Zealand. Geomorphology. 133(1):57–79. doi: 10.1016/j.geomorph.2011.06.019
- Langridgea RM, Riesa WF, Litchfielda NJ, Villamora P, Van Dissena RJ, Barrellb DJA, Rattenburya MS, Herona DW, Haubrocka S, Townsenda DB, et al. 2016. The New Zealand active faults database: NZAFD250. Acc New Zeal J Geol Geop. 59(1):86–96. doi: 10.1080/00288306.2015.1112818
- Lecointre J, Hodgson K, Neall V, Cronin S. 2004. Lahar-triggering mechanisms and hazard at Ruapehu volcano, New Zealand. Nat Hazards. 31(1):85–109. doi: 10.1023/B:NHAZ.0000020256.16645.eb
- Lecointre JA, Neall VE, Wallace CR, Prebble WM. 2002. The 55-to 60-ka Te Whaiau Formation: a catastrophic, avalanche-induced, cohesive debris-flow deposit from Proto-Tongariro Volcano, New Zealand. Bull Volcanol. 63(8):509–525. doi: 10.1007/s004450100167
- Lee JM, Bland K, Townsend DB, Kamp PJJ. 2011. Geology of the Hawke’s Bay area: scale 1: 250,000. Lower Hutt: Institute of Geological & Nuclear Sciences Limited. Institute of Geological & Nuclear Sciences. 1(250,000).
- Leonard GS, Begg JG, Wilson CJN. 2010. Geology of the Rotorua Area, QMAP 1: 250000 Geological Map. Lower Hutt, New Zealand: GNS Science, 102.
- Leonard GS, Townsend DM, Wilson CJN, Gravley DM, Calvert AT, Begg JG, Downs DT, Deering CD, Rosenberg MD. 2014. Forensic analysis of caldera volcanism: Integrating geomorphology, geochemistry, physical volcanology and geochronology to map and refine the history of Taupo Volcanic Zone. International Course & Workshop on Collapse Calderas. December 2014. Taupo, New Zealand. Abstract 41:68.
- Litchfield NJ, Van Dissen R, Sutherland R, Barnes PM, Cox SC, Norris R, Beavan RJ, Langridge R, Villamor P, Berryman K, et al. 2014. A model of active faulting in New Zealand. New Zeal J Geol Geop. 57(1):32–56. doi: 10.1080/00288306.2013.854256
- Lowe DJ, Blaauw M, Hogg AG, Newnham RM. 2013. Ages of 24 widespread tephras erupted since 30,000 years ago in New Zealand, with re-evaluation of the timing and palaeoclimatic implications of the Lateglacial cool episode recorded at Kaipo bog. Quaternary Sci Rev. 74:170–194. doi: 10.1016/j.quascirev.2012.11.022
- Lowe DJ, Shane PA, Alloway BV, Newnham RM. 2008. Fingerprints and age models for widespread New Zealand tephra marker beds erupted since 30,000 years ago: a framework for NZ-INTIMATE. Quaternary Sci Rev. 27(1):95–126. doi: 10.1016/j.quascirev.2007.01.013
- Martin SB. 2005. Magmas of the 17,700 yr Rerewhakaaitu eruptive episode of Tarawera volcanic complex. Unpublished BSc (Hons) dissertation, University of Auckland, pp. 65.
- McCalpin J. 1996. Paleoseismology. Vol. 62. Estes Park, CO: Academic Press.
- Moebis A, Cronin SJ, Neall VE, Smith IE. 2011. Unravelling a complex volcanic history from fine-grained, intricate Holocene ash sequences at the Tongariro Volcanic Centre, New Zealand. Quatern Int. 246(1):352–363. doi: 10.1016/j.quaint.2011.05.035
- Molloy C, Shane P, Augustinus P. 2009. Eruption recurrence rates in a basaltic volcanic field based on tephra layers in maar sediments: implications for hazards in the Auckland volcanic field. Geolog Soc Am Bull. 121:1666–1677. doi: 10.1130/B26447.1
- Mouslopoulou V, Nicol A, Walsh JJ, Beetham D, Stagpoole V. 2008. Quaternary temporal stability of a regional strike-slip and rift fault intersection. J Struct Geol. 30(4):451–463. doi: 10.1016/j.jsg.2007.12.005
- Mouslopoulou V, Walsh JJ, Nicol A. 2009. Fault displacement rates on a range of timescales. Earth Planet Sci Lett. 278(3):186–197. doi: 10.1016/j.epsl.2008.11.031
- Nairn IA, Kobayashi T, Nakagawa M. 1998. The∼ 10 ka multiple vent pyroclastic eruption sequence at Tongariro Volcanic Centre, Taupo Volcanic Zone, New Zealand: Part 1. Eruptive processes during regional extension. J Volcanol Geoth Re. 86(1):19–44. doi: 10.1016/S0377-0273(98)00085-7
- Nicol A, Walsh J, Berryman K, Villamor P. 2006. Interdependence of fault displacement rates and paleoearthquakes in an active rift. Geology. 34(10):865–868. doi: 10.1130/G22335.1
- Pardo N, Cronin SJ, Németh K, Brenna M, Schipper CI, Breard E, White JDL, Procter J, Stewart B, Agustín-Flores J, et al. 2014. Perils in distinguishing phreatic from phreatomagmatic ash; insights into the eruption mechanisms of the 6 August 2012 Mt Tongariro eruption, New Zealand. J Volcanol Geoth Re. 286:397–414. doi: 10.1016/j.jvolgeores.2014.05.001
- Pardo N, Cronin SJ, Palmer AS, Németh K. 2012. Reconstructing the largest explosive eruptions of Mt Ruapehu, New Zealand: lithostratigraphic tools to understand subplinian–plinian eruptions at andesitic volcanoes. Bull Volcanol. 74(3):617–640. doi: 10.1007/s00445-011-0555-z
- Procter JN, Cronin SJ, Fuller IC, Sheridan M, Neall VE, Keys H. 2010. Lahar hazard assessment using Titan2D for an alluvial fan with rapidly changing geomorphology: Whangaehu River, Mt Ruapehu. Geomorphology. 116(1):162–174. doi: 10.1016/j.geomorph.2009.10.016
- Rowland JV, Sibson RH. 2001. Extensional fault kinematics within the Taupo Volcanic Zone, New Zealand: soft-linked segmentation of a continental rift system. New Zeal J Geol Geop. 44(2):271–283. doi: 10.1080/00288306.2001.9514938
- Rowland JV, Wilson CJ, Gravley DM. 2010. Spatial and temporal variations in magma-assisted rifting, Taupo Volcanic Zone, New Zealand. J Volcanol Geoth Re. 190(1):89–108. doi: 10.1016/j.jvolgeores.2009.05.004
- Seebeck H, Nicol A, Giba M, Pettinga J, Walsh J. 2014. Geometry of the subducting Pacific plate since 20 Ma, Hikurangi margin, New Zealand. J Geolog Soc. 171(1):131–143. doi: 10.1144/jgs2012-145
- Shane P, Nairn IA, Smith VC, Darragh M, Beggs K, Cole JW. 2008. Silicic recharge of multiple rhyolite magmas by basaltic intrusion during the 22.6 ka Okareka Eruption Episode, New Zealand. Lithos. 103:527–549. doi: 10.1016/j.lithos.2007.11.002
- Shane P, Smith VC, Nairn IA. 2005. High temperature rhyodacites of the 36 ka Hauparu pyroclastic eruption, Okataina Volcanic Centre, New Zealand: change in a silicic magmatic system following caldera collapse. J Volcanol Geoth Re. 147:357–376. doi: 10.1016/j.jvolgeores.2005.04.015
- Stirling M, McVerry G, Gerstenberger M, Litchfield N, Van Dissen R, Berryman K, Barnes P, Wallace L, Villamor P, Langridge R, et al. 2012. National seismic hazard model for New Zealand: 2010 update. Bull Seismol Soc Am. 102(4):1514–1542. doi: 10.1785/0120110170
- Taylor JR. 1982. An introduction to error analysis: the study of uncertainties in physical measurement. Oxford: Oxford University Press/Mill Valley, University Science Books.
- Topping WW. 1973. Tephrostratigraphy and chronology of late Quaternary eruptives from the Tongariro Volcanic Centre, New Zealand. New Zeal J Geol Geop. 16(3):397–423. doi: 10.1080/00288306.1973.10431368
- Tost M, Cronin SJ, Procter JN, Smith IEM, Neall VE, Price RC. 2015. Impacts of catastrophic volcanic collapse on the erosion and morphology of a distal fluvial landscape: Hautapu River, Mount Ruapehu, New Zealand. Geolog Soc Am Bull. 127(1–2):266–280. doi: 10.1130/B31010.1
- Townend J, Sherburn S, Arnold R, Boese C, Woods L. 2012. Three-dimensional variations in present-day tectonic stress along the Australia–Pacific plate boundary in New Zealand. Earth Planet Sci Lett. 353-354:47–59. doi: 10.1016/j.epsl.2012.08.003
- Townsend D, Vonk A, Kamp PJJ. 2008. Geology of the Taranaki area 1:250 000 geological map, sheet + 77p. Lower Hutt, New Zealand: Institute of Geological and Nuclear Sciences.
- Vandergoes MJ, Hogg AG, Lowe DJ, Newnham RM, Denton GH, Southon J, Barrell DJA, Wilson CJN, McGlone MS, Allan ASR, et al. 2013. A revised age for the Kawakawa/Oruanui tephra, a key marker for the last glacial maximum in New Zealand. Quaternary Sci Rev. 74:195–201. doi: 10.1016/j.quascirev.2012.11.006
- Villamor P, Berryman K. 2001. A late Quaternary extension rate in the Taupo volcanic zone, New Zealand, derived from fault slip data. New Zeal J Geol Geop. 44(2):243–269. doi: 10.1080/00288306.2001.9514937
- Villamor P, Berryman K. 2006a. Late quaternary geometry and kinematics of faults at the southern termination of the Taupo volcanic zone, New Zealand. New Zeal J Geol Geop. 49(1):1–21. doi: 10.1080/00288306.2006.9515144
- Villamor P, Berryman KR. 2006b. Evolution of the southern termination of the Taupo Rift, New Zealand. New Zeal J Geol Geop. 49(1):23–37. doi: 10.1080/00288306.2006.9515145
- Villamor P, Berryman K, Nairn IA, Wilson K, Litchfield N, Ries W. 2011. Associations between volcanic eruptions from Okataina volcanic center and surface rupture of nearby active faults, Taupo rift, New Zealand: insights into the nature of volcano-tectonic interactions. Geol Soc Am Bull. 123(7–8):1383–1405. doi: 10.1130/B30184.1
- Villamor P, Van Dissen R, Alloway BV, Palmer AS, Litchfield N. 2007. The Rangipo fault, Taupo rift, New Zealand: an example of temporal slip-rate and single-event displacement variability in a volcanic environment. Geol Soc Am Bull. 119(5–6):529–547. doi: 10.1130/B26000.1
- Wallace LM, Beavan J, McCaffrey R, Darby D. 2004. Subduction zone coupling and tectonic block rotations in the North Island, New Zealand. J Geophy Res Solid Earth. 109(B12):B12406. doi:10.1029/2004JB003241
- Weldon R, Scharer K, Fumal T, Biasi G. 2004. Wrightwood and the earthquake cycle: what a long recurrence record tells us about how faults work. GSA today. (14).
- Wilson CJN. 2001. The 26.5 ka Oruanui eruption, New Zealand: an introduction and overview. J Volcanol Geoth Re. 112(1):133–174. doi: 10.1016/S0377-0273(01)00239-6
- Wilson CJN, Blake S, Charlier BLA, Sutton AN. 2006. The 26.5 ka Oruanui eruption, Taupo volcano, New Zealand: development, characteristics and evacuation of a large rhyolitic magma body. J Petrol. 47(1):35–69. doi: 10.1093/petrology/egi066
- Wilson CJN, Gravley DM, Leonard GS, Rowland JV. 2009. Volcanism in the central Taupo volcanic zone, New Zealand: tempo, styles and controls. Stud Volcanol Legacy Georg Walker. 2:225–247.
- Wilson CJN, Houghton BF, McWilliams MO, Lanphere MA, Weaver SD, Briggs RM. 1995. Volcanic and structural evolution of Taupo Volcanic Zone, New Zealand: a review. J Volcanol Geoth Re. 68(1):1–28. doi: 10.1016/0377-0273(95)00006-G