
ABSTRACT
Interpretation of high-resolution aeromagnetic data for the area bounded approximately by 37°00′S and 37°33′S latitude and 174°31′E to 175°10′E longitude is discussed. The flying height was 60 m, line spacing 200 m and magnetometer accuracy 0.1 nT. Geological inferences and quantitative geophysical modelling based on the data are presented in relation to: (a) Waikato River palaeo-bed; (b) northeast-trending fault set; (c) the Junction Magnetic Anomaly causative body (JMB); (d) South Auckland Volcanic Field; (e) arcuate anomalies near Waiau Pa; (f) ironsand deposits in Awhitu Peninsula, (g) a linear chain of buried igneous plugs trending 305° between Waipipi and Onewhero; (h) magnetically enhanced Mesozoic sedimentary layers in the limbs of the Kaimango Syncline; (i) a non-magnetic extension of the East Scenic Drive Fault, passing north–northwest (326°) through Mauku, 174°49′E, 37°12′S; and (j) a magnetic lineament passing north–northeast (336°) through Elbow Hill (174°50.5′E, 37°17.0′S).
Introduction
High-resolution aeromagnetic data acquired in 2007 by Sinosteel Australia covering a large area of the western North Island of New Zealand have become available (Meyers Citation2009). In practice, this information is only accessible to organisations possessing substantial computing power coupled with proprietary software. Additionally, quantitative modelling is required for the depth dimension to be resolved. In the Franklin area, the aeromagnetic data, duly reprocessed and interpreted, reveal a very interesting picture of the subsurface structures. The purpose of this article is to present this information, and to discuss a number of hitherto unreported geological features of diverse ages and types that are evident in it.
Base information has been derived from maps using a variety of map grids, using different geoids, origins and projections. For consistency, and to facilitate cross reference to Edbrooke (Citation2001), we have adopted the NZ Map Grid (NZMG) in both the text and the figures throughout this article. Grid references of key localities discussed in the text are summarised in Appendix.
Geological outline
The regional geology of the Franklin district (Schofield Citation1967; Edbrooke Citation2001) is summarised in . An inferred crystalline Paleozoic basement, such as the Western Province of Bradshaw (Citation1993), which outcrops c. 100 km to the west of the study area ((b)), is overlain by Mesozoic sandstones and mudstones (referred to subsequently in this article as ‘greywacke’) which are subdivided into the Murihiku Supergroup in the west, and the Waipapa Group in the east. A mafic unit is inferred to separate the Murihiku Supergroup and the Waipapa Group rocks, and is associated with the linear Junction Magnetic Anomaly (JMA) (Hatherton Citation1967, Citation1969; Hunt Citation1978). This anomaly can be traced continuously to Franklin from Nelson where it approximately coincides with the ophiolitic Dun Mountain–Maitai Terrane of Rattenbury et al. (Citation1998) and Turnbull and Allibone (Citation2003). The Dun Mountain Ultramafics (Rattenbury et al. Citation1998) have a Permian age of 275–285 Ma (Kimbrough et al. Citation1992) and are therefore older than the adjacent formations. The Mesozoic greywackes have been deformed by folding about generally north–south axes to form, for example, the north–northwest-trending Kaimango Syncline, near Port Waikato. The overall stratigraphic thickness of the Waipapa Group metasediments was estimated by Mayer (Citation1968) to be at least 2500 m, they are characterised by pervasive imbrication and thrust faults, which implies an even greater overall thickness (Spörli et al. Citation1989). These rocks have been metamorphosed to prehnite–pumpellyite grade (i.e. 230–280 °C and 3.5–5.0 kbar; Hawke Citation1978) and have been eroded to form a generally horizontal peneplain surface, evidenced by summit height accordance in the eastern Hunua Ranges. The greywackes are overlain by the Eocene–Oligocene Te Kuiti Group (of siltstone, sandstone, limestone and coal), the Miocene Waitemata Group (of limestone, mudstone, siltstone and sandstone), and Quaternary alluvial and lacustrine deposits. The Quaternary deposits include a prominent sand-bar forming the Awhitu Peninsula. Behind this barrier, the Manukau Harbour constitutes a large lagoon, across which the palaeo-Waikato River may have meandered (Cussen Citation1888).
Figure 1. (a) Geological formations of geophysical relevance, simplified from Edbrooke (Citation2001). The outline of and is indicated by a thick dashed line. Graticule: NZMG, grid interval 10 km. (b) Locality diagram for this study, also showing the location of the Junction Magnetic Anomaly causative body (JMB), Median Tectonic Zone (MTZ) and Hikurangi–Tonga–Kermadec Trench. Compiled from Hunt (Citation1978) and Bradshaw (Citation1993).
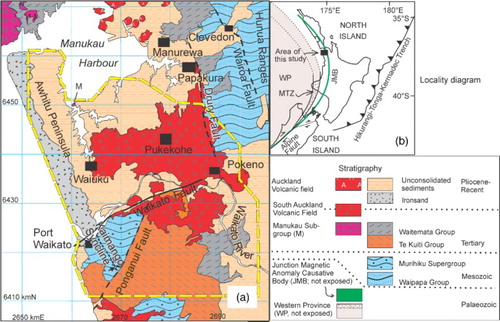
Large scale east–northeast and north–northwest trending faults, including the Wairoa, Drury and Waikato faults (), with throws in the order of 100–400 m, divide the region into blocks. These are generally downthrown to the west, and this pattern extends beneath both the Recent sediments and the Manukau Harbour in (Berry Citation1986; Kenny et al. Citation2011). Andesitic volcanic activity occurred in Miocene time, forming the high-standing Waitakere Ranges in the extreme northwest corner of (Hayward Citation1976). Basaltic volcanic activity has occurred in the Franklin area in Plio-Pleistocene time forming the South Auckland Volcanic Field (Schofield Citation1958; Schofield Citation1967; Rafferty Citation1977; Rafferty & Heming Citation1979), and in Recent time forming the Auckland Volcanic Field (Kermode Citation1992).
Aeromagnetic survey
The aeromagnetic survey was conducted in 2007 by UTS Geophysics for Sinosteel Australia Pty. Ltd, who were exploring for mineral deposits, particularly ironsand. GPS navigation (Novatel 3951R together with Omnilite 312) was used to achieve a horizontal positional accuracy of ± 2 m and vertical positional accuracy of ± 5 m. Additionally, a Bendix King KRA–10 radar altimeter was used to log the flight height and a terrain map was obtained by subtracting the radar height from the aircraft altitude. A Cresco 08–600 aircraft was used, fitted with a tail ‘stinger’ carrying a Scintrex caesium vapour CS–2 magnetometer with ± 0.001 nT resolution and 0.1 s sampling interval. The flying height was 60 m. The average surveying airspeed was 72 m/s, corresponding to a sampling interval of 7.2 m along the track. Monitoring of the diurnal magnetic variation was carried out using a Scintrex Envimag proton precession magnetometer with a resolution of ± 0.1 nT and sampling interval of 5 s. A three-component Delveco fluxgate magnetometer was carried on the aircraft, having a resolution of ± 0.1 nT and 0.1 s sampling interval, primarily to facilitate corrections to the main data set for heading, roll, pitch and yaw of the aircraft.
Aeromagnetic map
The total magnetic intensity aeromagnetic anomaly measured relative to IGRF–2005 (incorporating correction for latitude, longitude and flying height) in the Franklin area is displayed using ER Mapper software ( and ). Note that the larger scale features can be seen by gradations in the colour contours and finer features are perceptible in the sun-shading, which is superimposed. A consistent grid is provided to facilitate detailed cross reference with other figures and Edbrooke (Citation2001). A variety of geological features are located as indicated on , including:
Waikato River palaeo-bed,
northeast-trending fault network in Pokeno–Pukekohe area,
the north–northwest-trending JMA,
South Auckland Volcanic Field,
arcuate anomalies near Waiau Pa,
ironsand deposits in Awhitu Peninsula,
linear chain of buried igneous plugs between Waipipi and Onewhero,
magnetically enhanced horizons in the limbs of the Kaimango Syncline at Port Waikato,
a probable fault passing through Mauku (‘the Mauku Line’),
a magnetic lineament (the ‘Elbow Hill anomaly’) lying close to the Mauku Line,
a linear magnetic anomaly on the eastern side of the Awhitu Peninsula and
the Ponganui Fault.
Figure 2. Aeromagnetic anomaly map. Colour, total magnetic intensity (TMI) anomaly, ‘Sun-shading’ from northeast. Annotations ‘a’ to ‘l’ are discussed in the text. Graticule: NZMG, grid interval 10 km.
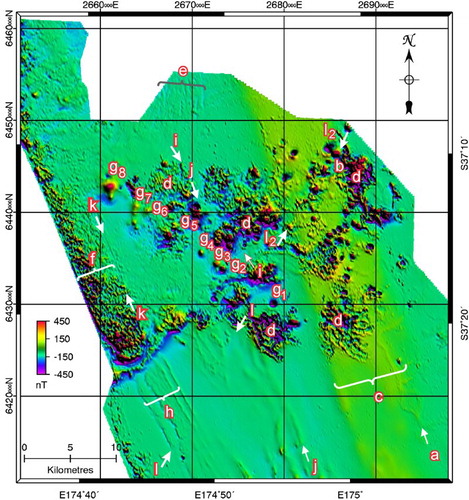
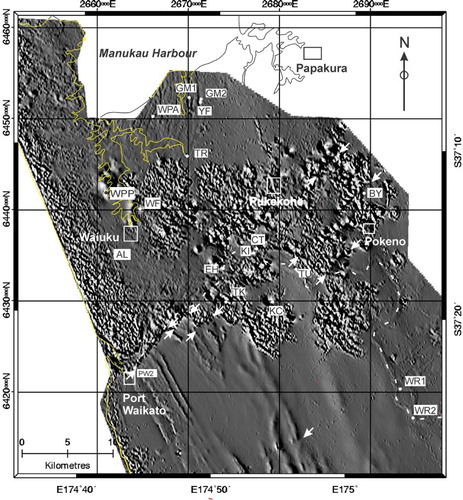
Figure 3. Total magnetic intensity (TMI) anomaly as grey-scale illuminated from 250° with a ‘sun elevation’ of 15°. The path of the Waikato River is indicated by a thin dashed white line traced from . Some northeast fault traces are indicated by pairs of white arrows.
In the following paragraphs these features will be discussed in turn. Of these, (a), (b), (e), (g), (h), (i), (j) and (k) are previously unreported geological features.
Waikato River palaeo-bed (feature ‘a’ on Figure 2)
The course of the Waikato River is delineated with variable clarity in the aeromagnetic image (‘a’ on , and more clearly defined in ). We attribute the observed anomaly to titano-magnetite grains (whether as discrete grains or incorporated within other mineral grains or clasts) in the bottom sediment load, derived from sources in the central volcanic region, some 150 km to the south–southwest. Between points WR1 and WR2 on (near Rangiriri) the bed of the Waikato River so delineated is bifurcated. There, the eastern-most trace lies in flat, low-lying ground and is inferred to indicate a recent palaeo-channel of the Waikato River, essentially following the line of the canalised Ngariohe Stream.
Another, more ambiguous, bifurcation is noted between Tuakau (TU in ), where it is suggested that a palaeo-channel of the Waikato River follows the northern edge of swampy ground bounded in the north by higher-standing lava flows and tuff of the South Auckland Volcanics.
Northeast-trending fault array (feature ‘b’ on Figure 2)
In , many northeast-trending lineations are discernible and some of these are highlighted by arrows. In (a), the same arrows are superimposed on the terrain map of Columbus et al. (Citation2011). It can be seen that many of the northeast-trending aeromagnetic lineations coincide with topographic features such as escarpments. In (b), the arrows are superimposed on the tectonic data from the geological map of Edbrooke (Citation2001). The dashed lines of Edbrooke (Citation2001) only approximately represent faults and the position and structure of these faults have, in many cases, been greatly refined by the aeromagnetic information, and traced through overlying deposits. In particular, the Waikato–Pokeno Fault () shown by Edbrooke (Citation2001) as a concealed fault of inconsistent direction, appears in as a side-step fault system, up-thrown on the south near Port Waikato and on the north near Pokeno, which is consistent with the conclusions of Hochstein and Nunns (Citation1976).
Figure 4. (a) Digital terrain map on which are superimposed the same arrows as shown in . (b) The same set of arrows superimposed on fault traces from Edbrooke (Citation2001). Concealed faults, dotted lines; approximate faults, dashed lines. Graticule: NZMG, grid interval 10 km.
We infer that this group of magnetic and topographical lineaments represents a fault array with a strike of c. 045°. The apparently up-thrown sides are sometimes on the north and sometimes on the south, and a small amount of possible dextral strike-slip is suggested by small offsets of the adjacent volcanic rock at BY (), and in the right-stepping fault sequence near Port Waikato (PW2).
This array of northeast-trending faults appears to merge with the northeast-trending block faults defining the horst and graben structure conspicuously displacing the Mesozoic greywacke blocks (see geological outline above) by hundreds of metres vertically. Indeed, given the high rate of erosion in the prevailing high-rainfall warm-temperate climate, the steep slope of the escarpments suggests that dip-slip on these faults is on-going, perhaps in response to regional isostatic disequilibrium (see also Kenny et al. Citation2011, Citation2012). We note that drainage in the nearby Hunua Ranges, immediately to the east of the survey area (LINZ, NZTopo50, Sheet BB33, Hunua), is predominantly northeast–southwest (and north–south), and stream incisions can be traced from one catchment to another on a bearing of 055°. This pattern may be controlled by faulting sub-parallel to the fault array shown in . We further note that this general direction (amongst others) of fracture-controlled drainage is subtly pervasive throughout New Zealand Mesozoic terranes, and is sub-parallel to the strike of the Alpine Fault, which at Haast is 052°.
The Junction Magnetic Anomaly (feature ‘c’ in Figure 2)
Hunt (Citation1978) describes a magnetic anomaly system ((b)) sweeping through the length of continental New Zealand. Hatherton (Citation1967, Citation1969) re-defined the eastern belt of this system as the ‘Junction Magnetic Anomaly’ (JMA) on the grounds that it lies at a junction of two distinguishable metasedimentary rock types; in the Franklin area these are the upper Jurassic Murihiku Supergroup to the west and the Triassic–Jurassic Waipapa Group to the east (Edbrooke Citation2001).
Hatherton (Citation1967) and others, including Spörli et al. (Citation2015), postulate that the Dun Mountain Ultramafics of the Nelson Mineral Belt could be surface exposures of the rocks that give rise to the JMA, notwithstanding a 16–24 km offset, which Hatherton suggested might be attributable to a thrust. Eccles et al. (Citation2005) plausibly adopted this postulate with regard to a study area to the north of the Franklin area. However, we have no need to exclude other possible interpretations and simply refer to the (idealised) rock body giving rise to the JMA as the ‘JMA causative body’, abbreviated to ‘Junction Magnetic Body’ (JMB).
The JMB is not exposed in the Franklin area but the JMA can clearly be seen on (essentially as documented by Hunt and Syms Citation1977 and Hunt Citation1978), as the long wavelength, north–northwest-trending, subdued magnetic anomaly marked ‘c–c’. In this area, the JMA is a positive linear anomaly with an amplitude of c. 150 nT (at 60 m flight height) and a width of c. 10 km. The JMA is not parallel to the folding axes of either the Murihiku Supergroup or the Waipapa Group (; Edbrooke Citation2001), and is older than both of them. The structural relationship of the JMB to its adjoining rock bodies is thus enigmatic and the dips of the sides of the JMB are unknown. (a) shows the total field magnetic anomaly along an east–west aeromagnetic flight line, together with a very simple first-order ‘starting point’ model of the causative magnetic body (JMB), namely a vertical-sided slab of indefinite length along a strike direction of 340°. This model addresses only the location, magnetisation and overburden of the JMB. More complex modelling of its geometry and stratigraphy at depth is beyond the scope of this article. In this model, we assume that the JMB is magnetised in the direction of the time-averaged (geocentric axial dipole) geomagnetic field, 000° declination and −60° inclination. Short-wavelength, high-amplitude spikes due to the South Auckland Volcanics are superimposed on the record of (a), and can be ignored in fitting the curve by eye. The edges of the JMB, as identified by the model ((a)) are shown in (b) as small white dots, which lie on the flight-line chosen for the profile ((a)). This simple model is adequate to establish that: (i) the width of the slab is c. 8 km (essentially the distance between the steepest parts of the curve); (ii) the thickness of overburden (which controls the maximum gradient of the anomaly) is c. 800–900 m, consistent with borehole data for depth to the Murihiku Supergroup at Karaka (Kenny et al. Citation2011); (iii) the JMB magnetisation has intensity in the order of 0.5 A/m and a ‘normal’ polarity (in this context, magnetisation is the vector sum of induced and remanent magnetisation); and (iv) the depth to the bottom of the JMB is not well determined. A magnetisation of 0.5 A/m would be an unsurprising total magnetisation for a mafic rock. If it were induced by the Earth’s magnetic field, it would require a magnetic susceptibility of c. 10−2 SI, which is typical of igneous rocks (Telford et al. Citation1990; Hatherton, Citation1967).
Figure 5. (a) Aeromagnetic total magnetic intensity (TMI) anomaly profile for survey flight line 6448.5 km north , NZMG, running east-west. The parameters of the model are: overburden, 900 m; width of dyke, 8000 m; vertical extent of dyke, 10 km; magnetisation, 0. 5 A/m; declination of magnetisation, 000°; inclination of magnetisation –60°; strike of JMB, 338°; dip of JMB, 90°; local ambient field strength, 54.368 µT; ambient magnetic field declination, 20°; ambient magnetic field inclination, –63°; regional geomagnetic field intensity gradient, 0.0 nT/km. (b) Edges of JMB (thick light-grey bars) inferred from steepest gradient in TMI anomaly, using Ford filter, compared with points (white circles) identified as edges in Figure 5(b). The thickness of the light-grey bars, represents the uncertainty. Wavy ornament: Mesozoic greywacke. “S” and “A” ornament: South Auckland and Auckland Volcanics respectively. (c) Base model (i), as for Figure 5(a), perturbed, one parameter at a time, by: (ii) decreasing overburden to 400 m, (iii) decreasing dip of prism to 60°E, (iv) increasing declination of magnetisation to 20°E, and (v) decreasing vertical extent to 3 km.
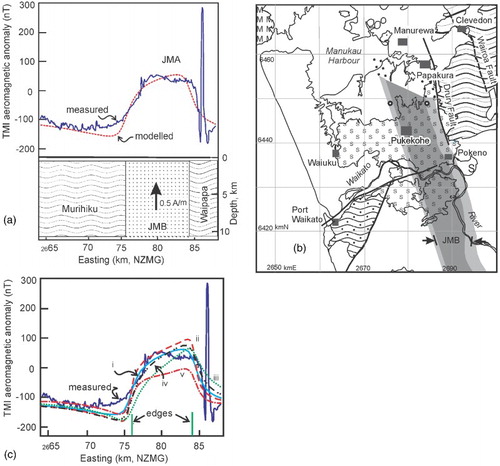
By extrapolating the edges determined in (a) along the JMA magnetic anomaly contours of , with the help of a Ford Filter (Ford et al. Citation1983; see supplemental material), we obtain (b), indicating the location of the edges of the JMB. The large uncertainty of ± 2 km is estimated from the effect of reworking the starting model in various ways ((c)) to incorporate uncertainty in the geometry of the JMB and its magnetisation. We speculate that the course of the Waikato River, the Drury Fault, the shoreline of the Manukau Harbour, topography (LINZ, NZTopo50 1:50,000 sheet BB32 Papatoetoe) and the distribution of Auckland Volcanics (; Edbrooke Citation2001) all may be correlated with the buried JMB. We further note that the JMB has a remarkably straight western edge, implying a planar contact with the Murihiku Group rocks, and an irregular eastern edge, implying that the contact with rock to the east (i.e. the Waipapa Group) is more complex.
Incidentally, although the array of northeast-trending faults discussed in the previous section does not appear to cut the JMB, it would be entirely possible for it to deform the JMB in a continuous and linear way in accordance with the hypothesis of Hunt (Citation1978), who suggested that such deformation could give rise to the sigmoid shape of the JMA.
South Auckland Volcanic Field (feature ‘d’ in Figure 2)
Intrusions and flows of the South Auckland Volcanic Field (Edbrooke Citation2001), incorporating the Franklin Basalts and the Bombay Basalts of Schofield (Citation1967) are expressed on the total magnetic intensity anomaly map () as areas of numerous large amplitude, short-wavelength (‘bumpy’) magnetic anomalies. Prominent circular magnetic anomalies on this image indicate igneous plugs. With reference to (in which the dipolar character of these anomalies is evident), most, but by no means all, of these plugs have magnetisation in approximately the direction of the present geomagnetic field. This is consistent with the paleomagnetic results of Robertson (Citation1976) for a number of outcrops distributed over in the South Auckland Volcanic Field.
The analytical signal, which is the square root of the sum of the squares of the gradients in north, east and vertical directions of the total magnetic field (Macleod et al. Citation1993), has the useful property of indicating the location of tops and edges of shallow magnetic rock bodies, without a systematic offset arising from inclination of the geomagnetic field. Moreover, the dipolar character of the magnetic anomalies is eliminated. This is illustrated in , in which there is a high degree of congruence between the analytical signal (shown in sun-shaded greyscale) and the boundaries of the South Auckland Volcanics (red colour, in the map of Edbrooke Citation2001). The exceptions to this congruence are easily explained in terms of the slightly greater depth of penetration of the analytical signal information relative to the information used for field mapping. In particular: (a) the Onewhero tuff ring, KC (), is mapped as Quaternary sediment by Edbrooke (Citation2001) but the magnetic data shows that there is a magnetic plug beneath it; (b) the area from Te Kohanga, TK, to Port Waikato, lying between the Waikato River and the Port Waikato Fault, is characterised by a vigorous analytical signal which may represent an extension of the (contiguous) South Auckland Volcanics at shallow depth beneath the Recent fluvial sediments, and/or an extension of the ironsand deposits of the Awhitu Peninsula; and (c) a number of intrusive bodies that do not break the surface and are discussed below (‘Waipipi Chain’ of buried igneous plugs).
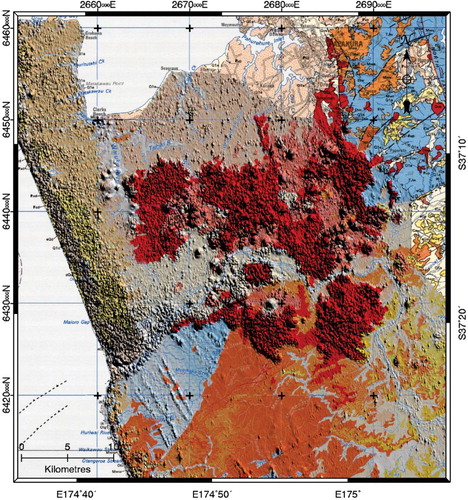
Figure 6. Geology from map of Edbrooke (Citation2001) with South Auckland Volcanic Field in red draped on analytical signal from the magnetic data as a sun-shaded relief image with northeast ‘sun illumination’. Graticule: NZMG, grid interval 10 km. Base map: Copyright Reserved, GNS Science.
Arcuate anomalies near Waiau Pa (feature ‘e’ in Figure 2)
In the vicinity of Waiau Pa (WPA) on , a suite of subtle arcuate magnetic anomalies, concave to the northwest, is discernible, (labelled ‘e’ on and in in the vicinity of Waiau Pa). They have a wavelength in the order of 500 m and stop abruptly against an east–northeast line in the south, at c. 6450 km N, which is interpreted as a fault downthrown to the south, corresponding to the Glenbrook Fault of Kenny et al. (Citation2011).
A ground magnetic survey profile was carried out along an east–west line from GM1 to GM2 on . This was designed to cut the magnetic anomaly pattern at right angles to its strike. A Geometrics proton precession magnetometer having a resolution of 0.1 nT was used and diurnal magnetic variation was monitored at a control station in the middle of the profile. The ground magnetic anomaly is shown on in comparison with the aeromagnetic data at a flying height of 60 m over the same survey line.
Figure 7. Comparison of aeromagnetic total magnetic intensity (TMI) anomaly (solid) with ground based TMI anomaly (stars), modelled aeromagnetic anomaly (dashed) and ground magnetic anomaly (dot-dash), for profiles cutting the arcuate anomalies. The aeromagnetic survey line is on 6451852 mN (NZMG) and the ground magnetic survey line lies between 6452193 and 6452141 mN (NZMG). The ground magnetic anomaly curve has been transposed downwards by c. 120 nT for visual clarity.
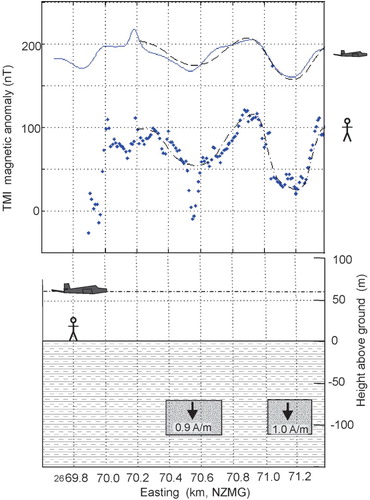
The spikes in magnetic intensity on the ground magnetic profile, which also propagate into the aeromagnetic survey, correspond to a power line and a reinforced concrete driveway. shows the result of modelling two of the anomalies by a pair of negatively magnetised, indefinitely long rectangular prisms with the following parameters: thickness of overburden, 70 m; width, 350 and 280 m; vertical extent, 40 m; relative magnetisation, −1.0 A/m; strike of the prisms 0°; dip of the prisms, 90°; declination of magnetisation, 0°; inclination of magnetisation, −60° (i.e. upwards); bearing of profile, 090°; ambient magnetic field strength, 53,942 nT; and ambient magnetic field declination, 20°. It is noted that changes to the modelled dip of the prisms in the order of ± 20° make very little difference to the shape of the modelled anomaly and also that similar results are obtained provided that the product of magnetisation and width of the prism is constant. There is thus insufficient data to determine the cross-sectional shape of the causative magnetic bodies and the rectangular prism model serves only to gauge approximately the parameters of cross-sectional area, magnetisation and overburden thickness. For example, an exactly equivalent result would be obtained if the magnetised blocks in were non-magnetic and the spaces between them normally magnetised, or if there were a row of blocks alternatively normally and reversely magnetised. It should be noted that if the magnetised bodies lens in and out in an east–west direction then the artificial assumption that the bodies are rectangular in cross section would lead to an over-estimate of the depth to their upper surface. In any event, depths to the bases of the magnetised blocks are poorly determined.
A comprehensive summary and correlation of borehole data for the Franklin Plain is provided by Viljevac et al. (Citation2002). In the vicinity of the arcuate magnetic anomalies, the stratigraphy (p. 33 of Viljevac et al. Citation2002) comprises 0–20 m Pleistocene sand, 20–40 m Kaawa Sandstone and 40–300 m (limit of drilling) Miocene Waitemata Sandstone. This is consistent with the driller’s log for a water borehole on Yates’ farm (J. Yates, Heritage Farm, Karaka, pers. comm. 2012), YF on , which records: 0–5 m brown clay, 5–7 m red silts, 7–11 m fine brown sands, 11–75 m silty mudstone with small bands of sandstone and 75–240 m firm grey sandstone.
N. Hudson (University of Auckland, pers. comm. 2014) and K.B. Spörli (University of Auckland, pers. comm. 2014) have each suggested that the arcuate anomalies may be caused by buried fossil ironsand dunes in the Manukau Harbour, predating the development of the Awhitu Peninsula barrier. The magnetic data are consistent with this hypothesis, but it is noted that if the dunes underlie the Pliocene Kaawa Sandstone (Nelson et al. Citation1989) then, since the Plio-Pleistocene boundary in New Zealand is attributed an age of 2.59 Ma (IGNS Citation2015), they would predate the present source of ironsand on the west coast (Stokes & Nelson Citation1991) at this latitude, namely the volcanics of the Taranaki area, of which the oldest terrestrial outcrops are dated at 1.74 Ma (Neall Citation1979).
Lawton and Hochstein (Citation1993) infer that ironsands outcropping on the North Island west coast, including those mined at Waikato North Head ((a); 2663 km east, 6425 km north), typically contain 18% by weight titanomagnetite, which would give rise to a magnetisation of 6.7 A/m. If the causative bodies for the arcuate anomalies have a similar composition, then they only need to be c. 10 m thick to replicate the anomalies shown in .
The form of the arcuate magnetic anomalies could also represent the aeromagnetic signature of the flanks (possibly distal flanks) of a composite volcano, incorporating variously magnetised ash and/or lava layers that have been eroded to a peneplain, possibly after gentle up-doming. In this connection, it is noted that the Miocene Manukau Subgroup volcanics outcrop c. 10 km to the west–southwest ((a), 2660 km east, 6450 km north). Volcanic rock has not explicitly been recorded in the boreholes in the area where the arcuate magnetic anomalies occur (Viljevac et al. Citation2002), and moreover, as the example three paragraphs above demonstrate, there is sufficient latitude for interpreting drillers’ logs in terms of stratigraphy that weathered ash could possibly be overlooked in the boreholes.
We therefore conclude that the arcuate magnetic anomalies in the vicinity of Waiau Pa may be due to either buried ironsand dunes or a buried, up-domed and eroded sequence of distal (Miocene) volcanic lava and/or ash layers.
‘Waipipi Chain’ of buried igneous plugs (feature ‘g’ on Figure 2)
shows a remarkably linear set of igneous plug-type magnetic anomalies, marked as g1 to g8, stretching from Onewhero, KC on to Waipipi, WPP. Of these, the Onewhero tuff ring (g1), included within the South Auckland Volcanics, intrudes the Eocene–Oligocene Glen Massey Formation (Edbrooke Citation2001). Several of the igneous plugs (g2, g3) coincide with craters cutting Quaternary sediments. Another, g4, is associated with exposed basalt of the South Auckland Volcanics at Waitangi Falls (WF on ). The intrusive plug at the northwestern extremity of the chain, on the eastern side of the Awhitu Peninsula at Waipipi, WPP, has no surface expression and has hitherto not been mapped. The source body therefore underlies Quaternary sand in this locality.
The magnetisation directions, which can be inferred from the polarity and orientation of the dipolar anomalies, are variable. The plug beneath the Onewhero tuff ring (g1) in the southeast is magnetised vertically downwards, whereas two bodies (g6 and g7) near the Glenbrook steel mill are magnetised vertically upwards. The anomalies have peaks (as opposed to flat maxima), their width at half-height is c. 0.5 km, and vestiges of outline shapes attributable to the originating bodies are discernible. By visual comparison with similar images for three-dimensional models of rectangular blocks buried at various depths, this suggests that the upper surfaces of the originating bodies are at a depth of c. 500 m.
The trend of the chain of plugs is 305°. This bearing is exactly the same as the trend noted by Black et al. (Citation1992) for the alignment of the Ruru–Maungakawa–Te Tapui group of volcanoes, near Matamata (dated from 6.23 to 5.58 Ma) in the Kiwitahi Volcanics. It is also close to the trend of c. 300° noted by Briggs et al. (Citation1989) in the Alexandra Volcanics, near Raglan (dated between 3.7 and 1.9 Ma), and similar to the alignment of 312° that Lindsay (1995, .1) has noted for the dacites of Mercury Island, Little Barrier Island and the Young Northland Dacites (dated 4 to 1.2 Ma). Both Lindsay (Citation1995) and Black et al. (Citation1992) note that these alignments are perpendicular to the Tonga–Kermadec Ridge ((b)). From this it is inferred that the Waipipi Chain of igneous plugs likewise exploits a fault perpendicular to the Tonga–Kermadec subduction system and is likely to have an age within the range of 6.2 to 1.2 Ma. The trend of the Onewhero–Waipipi anomalies is also not far removed from the direction of a pre-Miocene fault set described by Spörli (Citation1982) in this area.
Kaimango Syncline, Port Waikato (feature ‘h’ on Figure 2)
Four linear magnetic anomaly stripes (, feature ‘h’), trending north–northwest, parallel with the axis of the Kaimango Syncline (), are associated with the Murikiku Supergroup near Port Waikato. The region of high analytical signal for this area is shown in , superimposed on the geological map of Edbrooke (Citation2001). As discussed above, the analytical signal (AS) is closely associated with edges, and hence tops, of shallow magnetic lithologies and does not suffer from offsets due to the inclination of the geomagnetic field (Roest et al. Citation1992). The AS maxima are strongly aligned with the strike of the Murihiku beds and are associated with corresponding horizons on each limb of the Kaimango Syncline, specifically the base of the Huriwai Group (IJh) and the middle of the Apotu Group (IJa) which is associated with a fault that is parallel to strike on the eastern limb. Purser (Citation1961) refers to the latter group as ‘Puaroan zone B’. On the NZ Geological Timescale (IGNS Citation2015), Puaroan is attributed an uppermost Jurassic age, viz. c. 150–145 Ma. Purser (Citation1961) emphasises the presence of volcanic rock:
That the provenance of Mesozoic sediments was largely volcanic is evident not only from the abundance of volcanic rock fragments in the greywackes but also from the dominance of intermediate and acid volcanic pebbles in the conglomerates both at Kawhia and Port Waikato. The presence of smaller amounts of plutonic, hypabyssal and sedimentary rocks suggests that the parental mass intruded these rock types. The abundance of basic minerals and heavy mineral concentrates also suggests a volcanic landmass, and the presence of zircon, apatite and rare garnet may indicate limited areas of plutonic and metamorphic rock.
Figure 8. Zones of high analytical signal (dot pattern) superimposed on the geological map of the Port Waikato area taken from Edbrooke (Citation2001). Ijh, Huriwai Group; IJa, Apotu Group; Jk, Kirikiri Group; mJr, Rengarenga Group; Jn, Newcastle Group. Graticule: NZMG. Grid interval 10 km.
The Murihiku rocks display low P/T metamorphism, c. 1000 bar and 150 °C (Black et al. Citation1993).
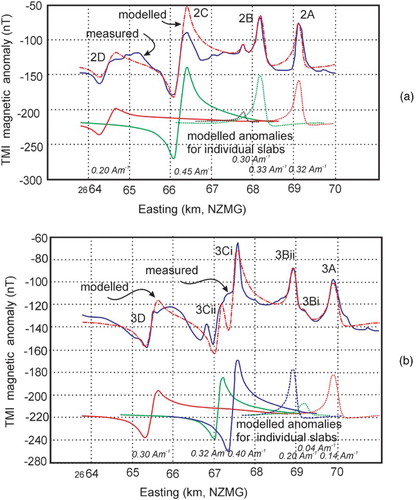
Detailed modelling has been carried out on data for two of the flight lines crossing the Murikiku Supergroup. The anomalously magnetic bodies are assumed to be indefinitely long parallel-sided slabs concordant with bedding and uniformly magnetised in the direction of the present geomagnetic field (i.e. declination: 20°; inclination: −63°). The two anomalies () on the east of the Kaimango Syncline (2A, 2B and 3A, 3B) correspond to a pair of magnetised slabs dipping steeply to the west, giving monopolar anomalies, and re-emerging at a more shallow dip angle on the western limb, giving rise to two further anomalies (2C, 2D, 3C, 3D) with dipolar swings. In our model, all of the slabs are given a strike of 155/335°, parallel with the axis of the Kaimango Syncline, and, on the basis of , dips of 50°W for slabs A and B, 40°E for slab C and 25°E for slab D were adopted, representing regional trends. The model fits, carried out iteratively by eye, are not sensitive to the magnetisation direction and the dip of the slab, for which ± 20° changes (on the sphere) make little difference to the modelled curves, whereas the centres of the slabs are accurately located, with an uncertainty of about ± 100 m. The accuracy with which the positions of the edges of the slabs can be determined is somewhat less, in the order of ± 200 m, because the shape of the modelled magnetic anomaly curves is more sensitive to the product of magnetisation and slab width than to either of these parameters alone. It should also be remembered that the uniform parallel-sided slabs are an idealisation and in practice departures from the ideal will inevitably be caused by irregularities and inhomogeneity.
Figure 9. (a), (b) Extracts from aeromagnetic survey lines PW2 and PW3, respectively, and models applied to them. Magnetisation magnitudes modelled for the magnetised prisms are indicated in italics. Upper curves; measured total magnetic intensity (TMI) anomaly, relative to international geomagnetic reference field, IGRF, (solid blue) and composite model (dashed red). Lower curves: models for individual prisms. Arbitrary base level shifts have been applied to the models for clarity.
The purpose of the models is to estimate the magnetisation and location of the slabs, so that they may subsequently be identified at outcrop. Slab edges thus determined are marked (as round white dots) on the aerial photo (). In some cases, particularly 2A and 3D (), the slab edges correspond with surface expression recognisable in the aerial photo such as lineations corresponding to low escarpments. This is a form of ‘ground truthing’.
Figure 10. Surface expression of magnetically enriched horizons modelled near Port Waikato. The edges of modelled magnetised prisms are shown as white dots, in the planes of the flight lines, superimposed on the aerial photograph. Thin white lines indicate likely edges of the magnetic horizons. Strike (assumed to be 155°) and dip adopted for models are shown in white. Graticule: NZMG, interval between ticks 1000 m. Aerial Photograph: Land Information NZ; Crown Copyright reserved.
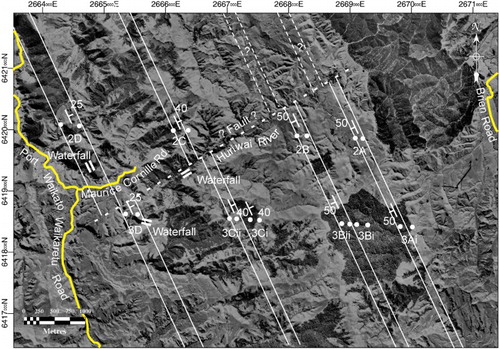
Enhancement lines have been drawn on the aerial photo to show the inferred positions of the slab edges, taking both the modelling and the topography into account. Magnetic anomaly PW3Ci has no match on profile PW2 and may represent a concentration of volcanic rock embedded in the formation.
We note that anomalies 2C and 2D are separated from 2A and 2B by a larger distance than the corresponding anomalies on the PW3 profile. This could be explained by a small amount of displacement on a fault suggested by a lineation trending 058° in the aerial photograph (), part of which coincides with the Huriwai River.
The modelled magnetisations for the magnetised prisms (detailed on ) are in the order of 0.2 A/m, which could arise from magnetisation induced by the geomagnetic field if the susceptibility were in the order of 5 × 10⁻³ SI. This induced magnetisation is far too large to be due to ferromagnesian minerals (or their alteration products) alone, or even to sedimentary rock containing haematite as the primary magnetic mineral (Thompson & Oldfield Citation1986). Being around one-tenth of the magnetisations commonly found in (magnetite-rich) volcanic material (Robertson Citation1983) this implies that the causative bodies are sediments containing some 10% volcanic material. From the comments of Purser (Citation1961), quoted above, and the absence of reported lava flows or igneous intrusive bodies (which would be smaller and more strongly magnetised), we infer that the causative bodies for the anomalies are volcaniclastic horizons, conformal with bedding within the Kaimango Syncline. Grant-Mackie (University of Auckland, pers. comm. 2014) and Hudson (University of Auckland, pers. comm. 2014) suggest that these horizons are likely to be massive sandstones and/or conglomerates.
These horizons may be useful as marker beds, but more detailed geological mapping, ground magnetic surveying, drilling and petrological data are required to characterise them fully.
Awhitu Ironsand (f), Mauku Line (i), Elbow Hill Anomaly (j), Kaimango Syncline extension (k) and Ponganui Fault (l) (features on Figure 2)
The topographical map (LINZ NZMS260 1:50,000 Sheet Q12/R12 Pukekohe) shows distinctive drainage alignment in the Mauku Stream. This alignment can be followed on a bearing of 326° from the Kaiwaka No. 2 Island, KI (), on the Waikato River, to the debouchment of the Mauku Stream into the Taihiki River, TR. For reference, these two localities are indicated on by small white arrows labelled ‘i’. If this line is projected northwestwards across the Manukau Harbour it accurately coincides with the East Scenic Drive Fault, bounding the Waitakere Ranges on the east (Hayward Citation1983, Citation2009; Edbrooke Citation2001) and marking the eastern limit of outcrop of the volcanic Manukau Subgroup. This strongly suggests the continuation of a major fault, but we refer to it as the ‘Mauku Line’ because the criterion of observable relative displacement is not yet met.
The Mauku Line is not convincingly expressed on the total magnetic intensity images (). Thus if crustal weakening has occurred, it seems not to have been exploited by volcanic intrusions, which in turn suggests that the East Scenic Drive Fault postdates the Plio-Pleistocene South Auckland Volcanics. There is a second lineation present nearby, marked ‘j–j’ on and trending 336°, expressed as an interruption to the South Auckland Volcanics towards the northwest of the image and as a linear magnetic anomaly towards the south. This we call the ‘Elbow Hill Anomaly’, after a feature, EH (), beneath which it passes. The Elbow Hill Anomaly is sub-parallel to the JMA (see above) and, by a first-order analysis similar to that outlined above (see Kaimango Syncline and Junction Magnetic Anomaly), applied to a line segment from EH1 () to EH2, the west and east Elbow Hill anomalies probably arise from steeply dipping volcanogenic horizons of apparent width 800 and 400 m, respectively, magnetisation 0.2 and 0.3 A/m, both overlain by some 400 m of younger sedimentary rock. These horizons are probably part of the Murihiku Supergroup (see Kaimango Syncline, above), overlain in this area by the Te Kuiti Group (). However, they could possibly represent volcanogenic layers within the buried Palaeozoic basement ().
Some further features are also discernible in the aeromagnetic image.
The Ponganui Fault, near Port Waikato (, marked ‘l’ on ), is expressed as an abrupt change in intensity and sharpness of the suite of linear magnetic anomalies, indicating down-throw to the south. We note that a line of igneous plugs, marked ‘l2–l2’ on , suggests that the Ponganui Fault extends northeastwards, cutting the JMB. The overall trend of the Ponganui Fault is 027°, which is very close to the direction of the Tonga–Kermadec Trench ((b)).
A linear magnetic anomaly (marked ‘k–k’, on ), is faintly perceptible against the background of the anomalies due to the ironsand on the Awhitu Peninsula. There is no surface expression of this anomaly. Modelling of this anomaly on an east–west line at ‘AL’ on by an analogous approach to that used above (see Kaimango Syncline) suggests that it could be due to a sub-vertical prism 100 m wide, with magnetisation 0.3 A/m in the direction of the present geomagnetic field, the upper surface of which lies c. 25 m beneath the surface (85 m beneath the flight line). This is entirely consistent with the causative body being an extension of the volcanogenic horizons marked ‘h’ in and ‘A’ or ‘B’ in and , and being overlain by some 25 m of younger sediment.
Conclusions
In summary, quantitative analysis of the detailed aeromagnetic survey has provided a remarkable insight ‘into the ground’ in the Franklin area, allowing some previously unsuspected features to be discovered and some already known features to be characterised more accurately. In particular, the following statements can be made.
The bed of the Waikato River, and in places the paleo-bed, is discernible due to iron oxide minerals incorporated in the detrital sediment load.
A northeast-trending fault array is identified.
The Junction Magnetic Anomaly causative body (JMB) is located with improved accuracy, its upper surface being buried by some 800–900 m, its western edge being straight and its eastern edge being irregular.
The South Auckland Volcanic Field of plugs, vents, flows and ash is well delineated by the magnetic analytical signal.
Arcuate magnetic anomalies seen near Waiau Pa may be due to buried ironsand dunes predating the closure of the Manukau Harbour, or else a sequence of up-domed and eroded (probably Miocene), buried volcanic layers.
A linear chain of igneous plugs has been discovered, between Kaiwaka No. 2 Island and Waipipi, the trend of which is 305°, perpendicular to the Tonga–Kermadec Trench and common to other volcanic lineations in the region, which range in age from 6.2 to 1.2 Ma.
Magnetically enhanced layers in the Murihiku Supergroup near Port Waikato are shown to conform with bedding on the respective limbs of the Kaimango Syncline and are correlated with surface expression in the aerial photograph.
A putative fault (‘the Mauku Line’), which has no magnetic expression, is found to accurately align with the East Scenic Drive Fault on the north of the Manukau Harbour.
Sundry geological features are shown to have magnetic signatures including the ironsands in the Awhitu Peninsula, further buried layers within the Murihiku Supergroup, and the Ponganui Fault, which appears to extend to the northeast as a chain of igneous centres.
Acknowledgements
Data analysed in this project, which is lodged with NZ Petroleum and Minerals as Project Number PP39344, are used by kind permission of Sinosteel Australia Pty., Ltd. We gratefully acknowledge the many people who have assisted this project in many ways. Special thanks are accorded to Manfred Hochstein, Tom Lumb, David Yates and Jerrod Yates, John Antunovich, Neville Hudson, Jack Grant-Mackie, Bernhard Spörli, Peter Malin, Jill Kenny, Kelly Brown and Louise Cotterall. The contribution of SKZ was supported by Physics Department funds. DJR wishes to thank the IESE, in addition to the Physics Department, University of Auckland, for use of research facilities. Associate editor: Associate Professor Andrew Gorman.
Disclosure statement
No potential conflict of interest was reported by the authors.
Related Research Data
References
- Berry KA. 1986. Stratigraphic, structural and geophysical studies of Neogene sediments of the Manukau lowlands [MSc thesis]. University of Auckland.
- Black PM, Briggs RM, Itaya T, Dewes ER, Dunbar HM, Kawasaki K, Kuschel E, Smith IEM. 1992. K-Ar age data and geochemistry of the Kiwitahi Volcanics, western Hauraki Rift, North Island, New Zealand. New Zeal J Geol Geop. 35:403–413. doi: 10.1080/00288306.1992.9514535
- Black PM, Clark SB, Hawke AA. 1993. Diagenesis and very low-grade metamorphism of volcaniclastic sandstones from contrasting geodynamic environments, North Island, New Zealand: the Murihiku and Waipapa terranes. J Metamorph Geol. 11:429–435. doi: 10.1111/j.1525-1314.1993.tb00159.x
- Bradshaw JD. 1993. A review of the Median Tectonic Zone: terrane boundaries and terrane amalgamation near the Median Tectonic Line. New Zeal J Geol Geop. 36:117–125. doi: 10.1080/00288306.1993.9514559
- Briggs RM, Itaya T, Lowe DJ, Keane AJ. 1989. Ages of the Pliocene—Pleistocene Alexandra and Ngatutura Volcanics, western North Island, New Zealand, and some geological implications. New Zeal J Geol Geop. 32:417–427. doi: 10.1080/00288306.1989.10427549
- Columbus J, Sirguey P, Tenzer R. 2011. A free fully assessed 15 metre digital elevation model for New Zealand. Surv Q. issue 66:16–19.
- Cussen L. 1888. Notes on the Waikato River basins. T Proc R Soc New Zeal. 21:406–416.
- Eccles JD, Cassidy J, Locke CA, Spörli KB. 2005. Aeromagnetic imaging of the Dun Mountain Ophiolite Belt in northern New Zealand: insight into the fine structure of a major SW Pacific terrane suture. J Geol Soc. 162:723–735. doi: 10.1144/0016-764904-060
- Edbrooke SW. 2001. Geology of the Auckland area. Institute of Geological and nuclear Sciences 1:250 000 geological map 3. Lower Hutt, New Zealand. GNS Science. 1 sheet + 74 p.
- Ford GE, Algazi R, Meyer DI. 1983. A noninteractive procedure for land-use determination. Remote Sens Environ. 13:1–16. doi: 10.1016/0034-4257(83)90024-X
- Hatherton T. 1967. A geophysical study of Nelson — Cook Strait region, New Zealand. New Zeal J Geol Geop. 10:1330–1347. doi: 10.1080/00288306.1967.10423219
- Hatherton T. 1969. Geophysical anomalies over eu-and mio-geosynclinal systems of California and New Zealand. Geol Soc Am Bull. 80:213–230. doi: 10.1130/0016-7606(1969)80[213:GAOTEA]2.0.CO;2
- Hawke AA. 1978. Some aspects of metamorphism in the Hunua metagreywackes [MSc Thesis]. University of Auckland.
- Hayward BW. 1976. Lower Miocene stratigraphy and structure of the Waitakere Ranges and the Waitakere Group (new). New Zeal J Geol Geop. 19(6):871–895. doi: 10.1080/00288306.1976.10420745
- Hayward BW. 1983. Sheet QII-Waitakere. Geological map of New Zealand 1:50 000. Wellington: Department of Scientific and Industrial Research.
- Hayward BW. 2009. Land, sea and sky. In: MacDonald F, Kerr R. editors. West - The history of Waitakere. Auckland: Random House; p. 7–22.
- Hochstein MP, Nunns AG. 1976. Gravity measurements across the Waikato Fault, North Island, New Zealand. New Zeal J Geol Geop. 19(3):347–358. doi: 10.1080/00288306.1976.10423564
- Hunt T. 1978. Stokes magnetic anomaly system. New Zeal J Geol Geop. 21(5):595–606. doi: 10.1080/00288306.1978.10424087
- Hunt TM, Syms MC. 1977. Magnetic map of New Zealand 1:250 000 Total force anomalies Sheet 3 Auckland. Wellington: Department of Scientific and Industrial Research.
- IGNS. 2015. New Zealand Geological Timescale v. 2015/1. Lower Hutt: Institute of Geological and Nuclear Sciences Ltd.
- Kenny JA, Lindsay JM, Howe TM. 2011. Large scale faulting in the Auckland region. Institute of Earth Science and Engineering report 1-2011.04.
- Kenny JA, Lindsay JM, Howe TM. 2012. Post-Miocene faults in Auckland: insights from borehole and topographic analysis. New Zeal J Geol Geop. 55(4):323–343. doi: 10.1080/00288306.2012.706618
- Kermode LO. 1992. Geology of the Auckland urban area. Scale 1:50 000. Institute of Geological and Nuclear Science geological map 2. Lower Hutt: Institute of Geological and Nuclear Sciences Ltd.
- Kimbrough DL, Mattinson JM, Coombs DS, Landis CA, Johnston MR. 1992. Uranium-lead ages from the Dun Mountain ophiolite belt and Brook Street Terrane, South Island, New Zealand. Geol Soc Am Bull. 104(4):429–443. doi: 10.1130/0016-7606(1992)104<0429:ULAFTD>2.3.CO;2
- Lawton DC, Hochstein MP. 1993. Geohysical study of the Taharoa ironsand deposit, west coast, North Island, New Zealand. New Zeal J Geol Geop. 36:141–160. doi: 10.1080/00288306.1993.9514564
- Lindsay JM. 1995. Little Barrier volcano: geology and geochemistry [MSc thesis]. University of Auckland.
- MacLeod IN, Jones K, Dai TF. 1993. 3-D Analytic signal in the interpretation of total magnetic field data at low magnetic latitudes. Explor Geophys. 24:679–688. doi: 10.1071/EG993679
- Mayer W. 1968. Petrology of the Waipapa Group, near Auckland, New Zealand. New Zeal J Geol Geop. 12:412–435. doi: 10.1080/00288306.1969.10420291
- Meyers JB. 2009. New Zealand Petroleum and Minerals, Mineral Report reference No. MR4482.
- Neall VE. 1979. Sheets P19, P20 and P21 New Plymouth, Egmont and Manaia. Geological Map of New Zealand 1:50 000. 1st ed. Wellington: New Zealand Department of Scientific and Industrial Research.
- Nelson CS, Kamp PJJ, Mildenhall DC. 1989. Late Pliocene distal silicic ignimbrites, Port Waikato, New Zealand: implications for volcanism, tectonics and sea level changes in South Auckland. New Zeal J Geol Geop. 32:357–370. doi: 10.1080/00288306.1989.10425715
- Purser BH. 1961. Geology of the Port Waikato Region, Onewhero Sheet N51. New Zealand Geological Survey bulletin 69(NS).
- Rafferty WJ. 1977. The volcanic geology and petrology of South Auckland [MSc thesis]. University of Auckland.
- Rafferty WJ, Heming RF. 1979. Quaternary alkali and sub-alkalic volcanism in South Auckland, New Zealand. Contrib Mineral Petr. 71:139–150. doi: 10.1007/BF00375430
- Rattenbury MS, Cooper RA, Johnston MR. ( compilers) 1998. Geology of the Nelson area: scale 1:250,000. Lower Hutt: Institute of Geological and Nuclear Sciences Limited. Institute of Geological & Nuclear Sciences 1:250,000 geological map 9. 67 p. + 1 folded map.
- Robertson DJ. 1976. A paleomagnetic study of volcanic rocks in the South Auckland area [MSc thesis]. University of Auckland.
- Robertson DJ. 1983. Paleomagnetism and geochronology of volcanics in the northern North Island, New Zealand [PhD Thesis]. University of Auckland.
- Roest WR, Verhoef J, Pilkington M. 1992. Magnetic interpretation using the 3D analytic signal. Geophysics. 57:116–125. doi: 10.1190/1.1443174
- Schofield JC. 1958. Notes on volcanism and structure in Franklin County. New Zeal J Geol Geop. 1:541–559. doi: 10.1080/00288306.1958.10422787
- Schofield JC. 1967. Geological Map of New Zealand, 1:250 000 Sheet 3 Auckland. Wellington: Department of Scientific and Industrial Research.
- Spörli KB. 1982. Review of paleostrain/stress directions in Northland, New Zealand, and of the structure of the Northland allochthon. Tectonophysics. 87:25–36. doi: 10.1016/0040-1951(82)90219-0
- Spörli KB, Aita Y Gibson GW. 1989. Juxtaposition of Tethyan and non-Tethyan Mesozoic radiolarian faunas in melanges, Waipapa terrane, North Island, New Zealand. Geology. 17(8):753–756. doi: 10.1130/0091-7613(1989)017<0753:JOTANT>2.3.CO;2
- Spörli KB, Black PM, Lindsay JM. 2015. Excavation of buried Dun Mountain–Maitai terrane ophiolite by volcanoes of the Auckland Volcanic field, New Zealand. New Zeal J Geol Geop. 58:229–243. doi: 10.1080/00288306.2015.1035285
- Stokes S, Nelson CS. 1991. Tectono-volcanic implications of provenance changes in late Neogene coastal sand deposits of Kaihu Group, South Auckland, New Zealand. New Zeal J Geol Geop. 34:51–59. doi: 10.1080/00288306.1991.9514438
- Telford WM, Geldart LP, Sheriff RE. 1990. Applied geophysics. Cambridge: Cambridge University Press. ISBN 0-521-33938-3. 770p.
- Thompson R, Oldfield F. 1986. Environmental magnetism. Boston and Sydney: Allen and Unwin. ISBN 0-04-538003-1. 227p.
- Turnbull IM, Allibone AH. ( compilers) 2003. Geology of the Murihiku area. Institute of Geological and Nuclear Sciences 1:250 000 geological map 20. 1 sheet and 74pp. Lower Hutt, New Zealand. Institute of Geological and Nuclear Sciences Limited.
- Viljevac Z, Murphy G, Smaill A, Crowcroft G, Bowden D. 2002. South Auckland groundwater, Kaawa aquifer recharge study and management of the volcanic and Kaawa aquifers. Auckland Regional Council Technical publication No. 133. ISBN 0908938969, 9780908938964, 85 pp.
Appendix
Grid References of locations in NZMG (expressed in km), NZTopo50 and NZMS260.