
ABSTRACT
Investigations of modern coseismic ground surface deformation where fault rupture is absent typically rely on remote sensing techniques. We used monitoring of salt marsh vegetation and substrate for 3 years after the 22 February 2011 Christchurch earthquake (MW 6.2) to document the biological response to vertical deformation, to provide estimates of the amount of uplift and subsidence and ground-truth remote sensing data. Comparison of vegetation-derived vertical deformation with estimates from remote-sensing techniques (Light Detection and Ranging, Global Positioning System and Differential Interferometric Synthetic Aperture Radar) shows good agreement at sites where several decimetres of vertical movement occurred, and less agreement where smaller amounts of vertical movement occurred and/or where vegetation-monitoring sites were affected by differential movement of artificial structures such as roads and breakwaters. Biological and sedimentological changes observed in salt marshes around the Avon–Heathcote Estuary/Ihutai (AHEI) as a result of the 22 February 2011 Christchurch earthquake are likely to be preserved as subtle geological signatures in restricted locations around the AHEI.
Introduction
Estuarine paleoenvironments are successfully utilised to assess the frequency and amount of deformation associated with pre-historical earthquakes on known faults (Atwater Citation1987; Darienzo & Peterson Citation1990; Kelsey et al. Citation2002; Cisternas et al. Citation2005; Hamilton et al. Citation2005; Garrett et al. Citation2013; Shennan et al. Citation2016; Clark et al. Citation2015; Dura et al. Citation2016). This is enabled by the elevation sensitivity of many flora and fauna that live in these environments and their good preservation potential (Jennings & Nelson Citation1992; Nelson & Kashima Citation1993; Hemphill-Haley Citation1995; Patterson et al. Citation2000; Hughes et al. Citation2002). Many marginal marine plants and animals have specific preferences for the salinity and tidal exposure of their habitat, i.e. species are zoned relative to sea level (Hayward et al. Citation1999). The sedimentary substrate also varies with tidal elevation because of differing wave energy and access to sources of sand, silt, clay and organic material. Coseismic vertical deformation causes a change in relative sea level at coastal sites which initiates a migration of biota to their preferred newly established tidal zone. If such a transition is preserved in the sedimentary record (with evidence in the form of a sudden and widespread change in sediment and fossilised pollen grains, algae, plants and animals), and can be dated, then a record of past earthquakes can be developed. Coseismic uplift and subsidence has been determined in coastal sedimentary sequences at several locations in New Zealand (Cochran et al. Citation2006, Citation2007; Hayward et al. Citation2006, Citation2016; Wilson et al. Citation2007; Clark et al. Citation2015). In these studies, sudden transitions from estuarine to freshwater environments were used to infer coseismic uplift. Conversely salt marsh soils buried by subtidal sediments and infilling of accommodation space with a chaotic mix of grain sizes, microfossils and reworked organic material has been interpreted to indicate coseismic subsidence.
Historical earthquakes have provided some insights into the effects of uplift on tidal zonation for rocky shorelines (Bodin & Klinger Citation1986; Castilla & Oliva Citation1990; Carver et al. Citation1994; Castilla et al. Citation2010). However, these hard substrate settings are often difficult to apply to paleoseismology in the geological record because biota may not be preserved in situ. One New Zealand historical earthquake that caused vertical deformation in a soft sediment (estuarine) coastal setting was the 1931 Hawke’s Bay earthquake (MW 7.8, often referred to as the Napier Earthquake); it raised Ahuriri Lagoon by at least 1 m turning the intertidal sand flats into extensive salt marsh flats (Marshall Citation1933; Hull Citation1990; Hayward, Grenfell et al. Citation2015). However, this earthquake occurred prior to the use of high-resolution paleoecological techniques for the detection of past large earthquakes in the geological record, so the biological response to vertical deformation was not studied in detail at the time of the event.
The MW 6.2 earthquake of 22 February 2011 on a fault underlying Christchurch, resulted in both uplift and subsidence in the coastal zone, and provided a unique opportunity to study an estuarine soft-sediment surface affected by vertical tectonic deformation. Modelling of Global Positioning System (GPS) observations indicated that the earthquake occurred on at least one southeast-dipping reverse fault immediately beneath the Avon–Heathcote Estuary/Ihutai (AHEI), resulting in uplift at the southern end of the estuary and subsidence at the northern end (Beavan et al. Citation2011; Beavan, Motagh et al. Citation2012; Elliott et al. Citation2012; Kaiser et al. Citation2012) Initial post-earthquake field observations of tide levels around the estuary were in agreement with the modelled vertical deformation because high tides no longer reached salt marsh around the southern estuary and trees were inundated by tides around the northern shores. Therefore, we decided to document the response of these coastal plants to the altered tide levels using standard biological monitoring techniques.
The aims of this study were to document the response of estuarine salt marsh plants to uplift and subsidence, to provide biologically derived estimates of this vertical deformation for comparison with Light Detecting and Ranging (LiDAR) differential elevation maps, and to investigate what signature this earthquake of known parameters is likely to leave in the geological record.
Regional setting
Christchurch, on the east coast of the South Island of New Zealand, is located on the edge of the boundary between the Pacific and Australian tectonic plates (A). The plate boundary motion in the central South Island is predominantly (75%) taken up on the Alpine Fault, but the remainder is distributed across strike-slip and reverse faults to the east (Pettinga et al. Citation2001; Cox et al. Citation2012; Litchfield et al. Citation2014). These include the oblique–dextral Marlborough Fault System in the north and predominantly reverse faults within and east of the Southern Alps. The plate boundary is considered to be widening over time and a number of geologically immature faults occur beneath and surrounding the Canterbury Plains (Cowan et al. Citation1996; Dorn et al. Citation2010). Many of these are inferred to be reactivated Cretaceous normal faults (Browne et al. Citation2012; Campbell et al. Citation2012; Ghisetti & Sibson Citation2012).
Figure 1. Location and differential Light Detection and Ranging (LiDAR) maps. A, New Zealand plate boundary context. PT, Puysegur Trench; AF, Alpine Fault; HT, Hikurangi Trench; MF, Marlborough Fault System. B, Cartoon of the Canterbury Earthquake Sequence main shock (S) and major aftershock epicentral locations (F and J) and their associated faults (fault and epicentre locations from Bannister & Gledhill, Citation2012) in relation to the Avon–Heathcote Estuary/Ihutai (AHEI). C, Panoramic view of the AHEI looking northward from a vantage point on the Port Hills. D, Differential LiDAR map of eastern Christchurch and the AHEI with location of survey sites used in this study. LiDAR data from July 2011 and 2003.
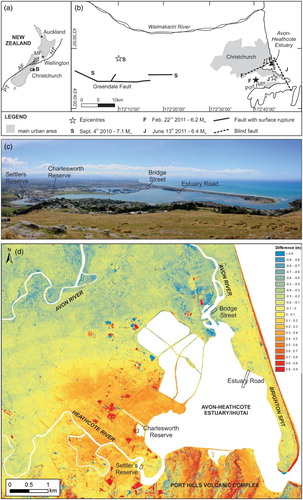
The 2010–2011 Canterbury Earthquake Sequence (CES) was initiated on 4 September 2010 with the MW 7.1 Darfield earthquake and included 14 aftershocks above MW 5.5 and three at or above MW 6 (22 February 2011, MW 6.2, 13 June 2011, MW 6.4; and 23 December 2011, MW 6.0) (B). Liquefaction was associated with most events above MW 5 (Quigley et al. Citation2013), and was most prevalent following the February 2011 event in correlation with highest peak ground accelerations (Quigley et al. Citation2013). Although the September 2010 MW 7.1 earthquake resulted in surface rupture of the previously unknown Greendale fault (Elliott et al. Citation2012; Quigley et al. Citation2012; Villamor et al. Citation2012), subsequent large CES aftershocks did not produce surface rupture (Bannister & Gledhill Citation2012; Kaiser et al. Citation2012; Beavan, Motagh et al. Citation2012). Subsurface rupture associated with the February 2011 MW 6.2 earthquake was a mixed right lateral strike-slip and reverse slip (Kaiser et al. Citation2012), and resulted in vertical ground deformation in eastern and southern Christchurch (Beavan et al. Citation2011; Beavan, Motagh et al. Citation2012) (). Ground motions associated with this rupture were strong, with peak ground accelerations up to 2.2 g (Bradley & Cubrinovski Citation2011; Bradley et al. Citation2014), and were a major contributor to the destruction and loss of life in Christchurch.
Comparison of LiDAR data collected before (2003) and after (July 2011) the 2011 Christchurch earthquake shows vertical land surface changes, most of which can be attributed to the February 2011 Christchurch earthquake (Beavan et al. Citation2011; Elliott et al. Citation2012; Kaiser et al. Citation2012; D). The overall signal is an area of uplift centred on the southern half of the AHEI, and subsidence at the north end. The vertical deformation recorded by the LiDAR difference map is consistent with Differential Interferometric Synthetic Aperture Radar (DInSAR) and other GPS data used to model the geometry of faults and the rupture pattern (Beavan, Motagh et al. Citation2012; Elliott et al. Citation2012). These models show that two, possibly three faults ruptured during the 2011 Christchurch earthquake, but the one that caused the majority of the vertical motion was a west–southwest-trending, steeply south–southeast-dipping reverse fault the upper tip of which lies c. 1 km beneath the northern part of the estuary (B).
The AHEI is a shallow triangular bar-built estuary, c. 8 km2 in area, formed by longshore drift of sediment from the Waimakariri River to the north (Jones & Marsden Citation2005) (). It is dominated by intertidal sand and mud, and is bound on its southern margin by the volcanic rocks of the Port Hills and elsewhere by marine, dune and alluvial sands and silts. The Avon and Heathcote rivers drain into the AHEI from the north and southwest respectively. Salt marshes are well developed in some areas of the estuary and although plant species have changed over the last two decades, salt marsh herbfields had stabilised by 2006/2007 (Jupp et al. Citation2007). This stabilisation followed disturbance and increased sedimentation in the estuary resulting from urbanisation and industrialisation that began with European settlement of Christchurch in the mid-1800s and intensified through the 1900s (Findlay & Kirk Citation1988). Salt marsh herbfields in the AHEI are dominated by the glasswort Sarcocornia quinqueflora (Jupp et al. Citation2007), a species typical of New Zealand salt marshes (Thannheiser & Holland Citation1994). The distribution of plants within the high intertidal zone is variable within New Zealand, and those that delineate mean high water springs (MHWS) tidal levels vary from location to location (Thannheiser & Holland Citation1994). Within the AHEI Sarcocornia is restricted to the high intertidal zone and delineates MHWS, where other salt marsh plants such as Plantago coronopus may intermingle with grasses less tolerant of salinity, and Selliera radicans and Mimulus repens occur but do not dominate in this zone. This dominance of Sarcocornia in AHEI salt marshes may be in part linked to the wide salinity tolerance range of Sarcocornia (Jupp et al. Citation2007) and its role as a pioneer species (Laegdsgaard Citation2002). Following the September 2010, February 2011, June 2011 and December 2011 earthquakes, sand volcanoes were abundant in the AHEI (Measures et al. Citation2011; Reid et al. Citation2012) and the injection of sand into the intertidal zone, along with vertical deformation, has overall raised the floor of the AHEI expanding the area within the intertidal zone yet reducing the tidal prism (Measures et al. Citation2011).
Materials and methods
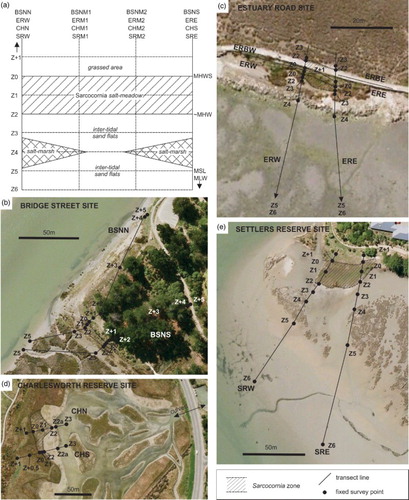
Four monitoring sites were selected within the AHEI based on examination of preliminary GPS and LiDAR elevation change data and a reconnaissance field visit in April 2011 to locate sites where the glasswort Sarcocornia was present as a dominant salt marsh plant. Sarcocornia was selected as the marker taxon because in the AHEI it has well-defined tidal elevation limits, unlike other plants that locally are not as tightly controlled with respect to elevation or not as widely distributed. The northern site, Bridge Street, was selected for its apparent subsidence in LiDAR data, and Settler’s Reserve in the southern AHEI for its apparent uplift (D). Both are natural estuary sites with residential or industrial areas now developed adjacent to them. The Estuary Road and Charlesworth Reserve sites were selected based on the occurrence of Sarcocornia and their position toward the middle of the estuary to act as controls in the zone of little or no apparent vertical movement, although LiDAR data shows uplift at Charlesworth Reserve (D). The Estuary Road site is bisected by a raised boardwalk and bounded seaward by a boulder breakwater to baffle waves under the boardwalk. Charlesworth Reserve is a restored wetland created in stages in 1991 and 2001 to provide bird habitat at high tide on vacated city-owned land. Extensive areas of stable Sarcocornia salt marsh naturally colonised the restored site with clearly delineated landward and seaward margins. The site is separated from the AHEI proper by culverts that pass under Humphreys Drive (D), and maximum tidal inundation in the reserve lags behind the AHEI by c. 1 h in response to flow capacity of the culverts.
Figure 2. Site sampling layout with respect to tidal elevation. A, Plan view of idealised layout of sampling grid at each site with respect to Sarcocornia salt marsh. Z1–6 are progressively below pre-earthquake mean high water springs, and Z + 1 and onward represents sites above pre-earthquake mean high water springs. B–E, Field layout of sampling grid in response to local features: B, Bridge Street; C, Estuary Road; D, Charlesworth Reserve; E, Settler’s Reserve. For location of sites B–E see D, aerial photographs from Google Earth, March 2009 images.
Salt marsh monitoring
Each monitoring site was laid out in early June 2011 as transects running landward to seaward with zone marker points based on pre-existing plant cover (intertidal and non-intertidal plants) (A). In all monitoring sites, Z0 corresponds to the most landward occurrence of Sarcocornia (MHWS), and Z2 the most seaward occurrence as at June 2011. As transects were laid over autumn and winter months before new seedlings of Sarcocornia had developed, the position of adult plants reflected pre-deformation tidal zones. Z3 to Z6 were positioned progressively seaward toward the low intertidal zone through salt marsh and intertidal sand flats (A) as required. Grassed areas above the most landward extent of Sarcocornia were marked by Z + 1 to Z + 5 progressively landward above MHWS. At Bridge Street Z + 2 to Z + 5 were installed in early 2012 when it became clear further zones would be required to capture potential plant migration. Four repeats of each transect were laid out over 20–30 m laterally to capture site diversity. At Charlesworth Reserve an additional zone, Z2a, was marked along a faint berm dotted with occasional Sarcocornia plants; if subtle deformation had occurred it was anticipated that this sparse growth would thicken or recede. Likewise, Charlesworth also contains an additional zone landward, Z + 0.5, to capture evidence of subtle subsidence. Transects on the left and right boundaries of the monitoring site had each zone position (i.e. Z + 5 to Z6 as relevant) marked by a metal stake, so that lateral transect counts were taken at the same location for each monitoring period, and existed as fixed reference points in topographic surveys. The middle (M1, M2) monitoring points were at the same zone elevation, but were randomly placed to capture zone variation.
Each monitoring site was visited at 3-monthly intervals, starting June 2011, and continuing in the months August, November, February and May until February 2014. On each visit percentage cover was quantified with the aid of a 0.5 m2 quadrat (0.7 × 0.7 m). Intertidal plants were recorded to species level, non-intertidal plants were categorised as ‘grass’ or ‘weeds’ (see Table S1). Estimates of percentage cover were made based on visual evaluation of the quadrat, and field photographs. Individual plants of Sarcocornia were not counted because plant size is highly variable and individual plants difficult to determine without disturbing the root area. Additionally, numerical counts of crab burrows and the mudflat snail Amphibola crenata were made, because these mobile components are abundant across the intertidal sand flats. The data were recorded in a spreadsheet, and a mean for each zone calculated from the four repeat quadrats. Pie charts of dominant components were constructed to visually represent the data.
At the conclusion of the survey, a two-sample t-test assuming equal variances was performed comparing Sarcocornia coverage in June 2011 and February 2014 for each survey site zone, where the null hypothesis was that the mean proportion of Sarcocornia had not changed over the time interval of the survey. A P-value of < 0.05 indicated likelihood of failure of the null hypothesis. In addition, a two-way analysis of variance (ANOVA) with replication was run on Sarcocornia percentage occurrence comparing difference in coverage down the survey site intertidal profile and difference in coverage through time, and any interaction between profile changes with time. Here, a P-value of < 0.05 indicated a difference in coverage through prolife and time, and an interaction P-value of < 0.05 indicated a link between change in profile and time.
Sediment grain size
At each zone marker on the left- and right-bounding transects sediment samples were collected for analysis of sediment grain-size on a Saturn Digisizer II 5205 V1.01 (Digisizer). Percentage sand was calculated from the results. Small pits were dug at Bridge Street and Settlers Reserve to inspect any vertical change in sediment composition.
Foraminifera sampling
Foraminiferal samples were collected through the study period and were analysed separately, and a comparison of June 2011 and February 2013 presented in Vettoretti (Citation2014). These data are not presented here; the findings, however, are discussed later in this paper.
Topographic survey
Each of the four monitoring sites was surveyed using a Real Time Kinematic Global Navigation Satellite System (RTK GNSS) with a vertical accuracy of ± 0.05 m to develop site elevation profiles. Quadrat positions and detailed transect profiles were surveyed. The survey was benchmarked against a survey mark at the Avon River mouth uncorrected for earthquake deformation, so the elevations can only be compared relative to each other, not to absolute sea level. These profiles were used to assess change in elevation of Sarcocornia distribution over the period of the study, and to calculate vegetation-based vertical deformation. At each site, the surveyed profile was used to calculate the change in elevation based on 2011 pre-deformation Sarcocornia limits and February 2014 positions. The ground elevation difference was calculated for each left- and right-staked profile, and then a mean calculated from change in upper limit and lower limit of Sarcocornia for each profile to obtain an average value for each site (). The uncertainty is estimated at 0.1 m, which takes into account the survey measurement uncertainty (0.05 m).
Table 1. Original and final elevation of upper and lower limits of Sarcocornia growth for each survey site. Elevation difference is averaged to give an overall elevation difference for each site. Note that at Estuary Road compete loss of Sarcocornia on the seaward facing surface has meant that only change at ERBW-Z0 is available for determining an elevation change.
LiDAR difference map
LiDAR data was acquired after each of the Canterbury earthquakes (collected September 2010, March 2011, May 2011, July 2011 and February 2012) and one pre-earthquake dataset existed from 2003. We re-processed the Christchurch LiDAR from point data (e.g. as provided in Beavan, Levick et al. Citation2012 and Appendix E of Tonkin & Taylor Citation2014) so that it was at an appropriate resolution (1 m grid) to compare with our biologically derived estimates of vertical deformation. We created a bare earth elevation difference map using the July 2011 and 2003 LiDAR surveys (D). Although minor aftershock-related deformation is likely to have occurred after July 2011, we did not update our map with the survey collected in February 2012 because it showed insignificant changes from the July 2011 dataset for our study sites.
Results
Vegetation monitoring results are presented site-by-site below and then the sediment grain size data are summarised for all sites. Results of each three-monthly monitoring for all sites are given in online supplementary data.
Bridge Street site
In April 2011, the Sarcocornia salt marsh occupied a narrow band at the edge of a berm (C). Both LiDAR and initial field assessment indicated that this site had subsided, with high spring tides now inundating an area of trees landward of the Sarcocornia (A).
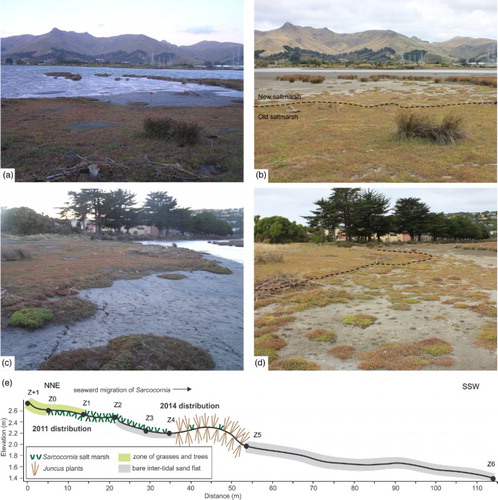
Figure 3. Site photographs representing the salt marsh changes at the Bridge Street survey site. A, April 2011, view landward from approximately Z + 2 showing high tide inundating grassed and treed area (not previously inundated prior to February 2011 earthquake), trees numbered T1–4 for reference to B. B, Same view as A in March 2014, showing landward migration of Sarcocornia salt marsh. Note tree stumps labelled T1–4. C, Shore-parallel view of the Sarcocornia marsh in April 2011 representing pre-subsidence distribution. Z0 position indicated. D, Same view as C in March 2014, showing replacement of Sarcocornia with bare sand flat and scattered Juncus plants. Z0 position indicated by dashed line and metal stake, circled. E, Schematic profile of Bridge Street northern transect with pre-subsidence distribution of key flora shown below profile-line, and February 2014 floral distribution shown above the profile line.
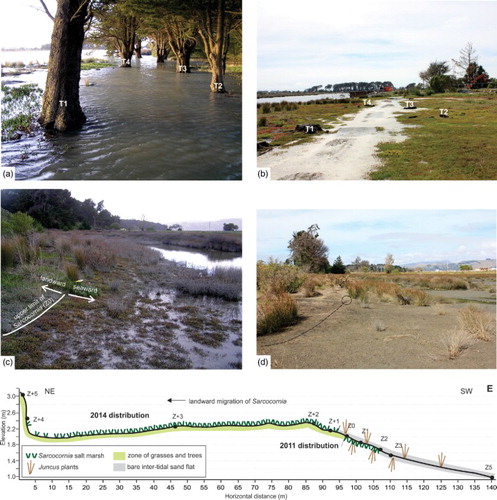
New Sarcocornia seedlings started to appear in Z + 1 by November 2011 and the pre-deformation Sarcocornia salt marsh began to show degradation by February 2012 (). Late summer 2012 (February) growth resulted in the establishment of new plant growth landward. Through 2012, the pre-deformation salt marsh was progressively degraded with almost complete loss of Sarcocornia by November 2012 (), replaced with bare ground and debris (D). This degradation was observed to be both a result of more tidal wetting than prior to coseismic deformation, as well as an increase in wave wash over the seaward Juncus rushes, impacting the previously protected salt marsh. During the same period and throughout 2013, new Sarcocornia salt marsh was established landward up to Z + 3 (B). Juncus rushes died back in their lower limit adjacent to this site, and to the south (Hayward, Sabaa et al. Citation2015), but their upper limit was not substantially changed. Amphibola snails appeared at this site and became frequent in Z0–Z5, however, these and burrows formed by crabs showed no particular pattern of elevation response throughout the AHEI. The post-earthquake distribution of macroinvertebrates in the AHEI responded to nutrient availability and sediment characteristics (Skilton Citation2013).
Figure 4. Pie charts of percentage ground cover at each zone level from June 2011 to February 2014 for the Bridge Street site. Each pie chart represents the zone level data averaged across lateral repeats. See C,D for the location of the Bridge Street site and B for the location of each survey site.
Established trees that existed above the intertidal zone prior to deformation (A) were killed by root disturbance and increased wetting (Morgenroth & Armstrong Citation2012), and were removed by the Christchurch City Council in May 2012 (B). This tree removal disturbed the ground from Z + 2 to Z + 4 and correlates with an increase in bare ground in these zones. In February 2014, a single small new plant was observed on the northern transect at Z + 4 at the new extreme high water spring (EHWS) tidal mark. On the southern transect Sarcocornia plants were at Z + 3 but not apparent landward of this. The seaward lower limit of Sarcocornia was at Z + 1 on both the northern and southern transects.
A significant difference in Sarcocornia coverage was evident in zones Z2 to Z + 2 between June 2011 and February 2014 (t-test where P = 1.14E−4 –7.866E−3) and marginal significance at Z + 3 (t-test where P = 0.057). There was a significant change in Sarcocornia between zones and over time (two-way ANOVA) and a significant relationship between time and zone distribution.
Elevation changes
The newly established upper and lower limits of Sarcocornia and elevation difference to pre-deformation limits are summarised in and E. The ground elevation difference for the upper and lower limit on each transect was averaged and indicates that 0.34 ± 0.1 m of subsidence had occurred at the Bridge Street site. The northern transect showed more subsidence than the southern transect because the former is adjacent to the Avon River channel and lateral spreading has contributed to overall deformation there.
Estuary Road site
In April 2011, the Sarcocornia salt marsh had occupied a narrow band behind an artificial breakwater of large boulders; this Sarcocornia salt marsh was lost during the survey period (). This site had little above-tide grassland, occupying only a small ridge adjacent to a boardwalk before descending back into the intertidal zone into a salt marsh beneath the boardwalk ().
Figure 5. Pie charts of percentage ground cover at each zone level from June 2011 to February 2014 for the Estuary Road site. Each pie chart represents the zone level data averaged across lateral repeats. BZ0, BZ2 and BZ3 refer to zone levels on the landward side of the boardwalk (see for profile and photo). See C for the location of the Estuary Road site and C for the location of each survey site.
Figure 6. Site photographs and schematic profile representing change at the Estuary Road site. A, June 2011 view looking east across the site, note boardwalk to left and rock bund to seaward edge of the site. Z0 level shown by dashed line. This site had only a narrow band of Sarcocornia, S, and Z1 was not included. B, Same view as in A in March 2014, showing degradation of site and landward extent of bare ground. Sarcocornia, S, expanded up the berm at Z0, but was eroded by wave action from the seaward side of the site and not able to re-establish. C, Schematic profile of the western transect (ERW) at Estuary Road to show the relative migration of Sarcocornia and expansion of bare ground on seaward side.
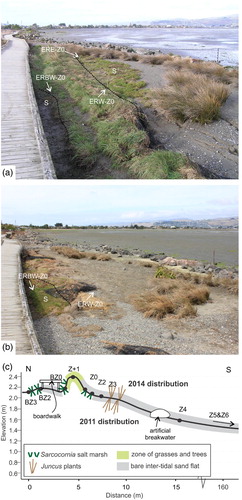
LiDAR data for land in the vicinity of this site is complex and indicates subsidence of c. 0.1 m (D); however, this is within the ± 0.1 m LiDAR dataset resolution. Visual observations of tidal inundation during the study at this site indicated that subsidence had occurred. However, the site is open to winds from all directions, except the north, and small waves obscure true inundation.
Overall, change at this site was characterised by the almost complete loss of the seaward Sarcocornia salt marsh (), partial erosion of the grass ridge (B) and the appearance of sparse Sarcocornia atop this ridge, landward of its pre-deformation position. Subsidence at this site has lowered the height of the artificial breakwater relative to tidal height and wind-driven waves now impact the site where, prior to deformation, they were baffled. Beneath the boardwalk, the site was sheltered from wind-driven waves and existing Sarcocornia plants remain and have increased in size, while new plants have migrated up the ridge profile, above Z0 (B), but only sparsely occurring in Z + 1 ().
There was a significant difference in Sarcocornia between June 2011 and February 2014 only in seaward Z2, now bare (t-test where P = 0.036). There was a significant change in Sarcocornia between zones and marginally significant difference over time (two-way ANOVA) and a relationship between time and change in zone distribution.
Elevation changes
The removal of Sarcocornia from the seaward side of this site, and limited post-deformation establishment introduces uncertainty to the calculated elevation changes (). The small salt marsh of Sarcocornia under the boardwalk was well established and expanding, and elevation change can be confidently measured, but the only data point is the upper limit of Sarcocornia (Z0) on the western transect. Overall subsidence of 0.16 ± 0.1 m was calculated.
Charlesworth Reserve
LiDAR and DInSAR data show general uplift in this region of the estuary (D) that is key to the Beavan, Motagh et al. (Citation2012) interpretation of the Port Hills fault geometry. Initial field observations in April 2011 did not reveal clear evidence for uplift or subsidence at this site.
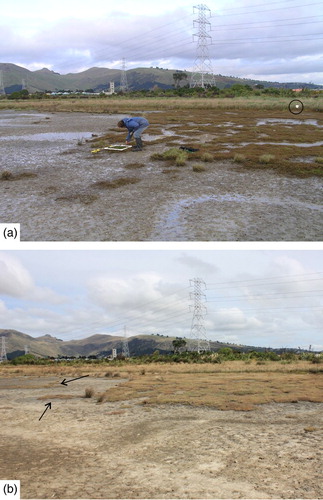
Overall, there was no detectable change in the intertidal plant community zonation at Charlesworth Reserve. The Sarcocornia plants remained at very stable abundances throughout the study (). The only change seen at Charlesworth was a noticeable drying of intertidal muds seaward of the Sarcocornia salt marsh. In June 2011 this was very wet soft organic-rich mud (A), and by February–March 2014 was a sticky mud-cracked surface (B). This was not a seasonal effect and this drying was maintained through winter and summer months. Drying is interpreted to be the result of less-frequent inundation and may be linked to a small amount of uplift, but this is not supported by change in the intertidal plant community.
Figure 7. Pie charts of percentage ground cover at each zone level from June 2011 to February 2014 for the Charlesworth Reserve site. Each pie chart represents the zone level data averaged across lateral repeats. See C for the location of the Charlesworth Reserve site and D for the location of each survey site.
Figure 8. Site photographs looking southwest across the Charlesworth Reserve site. A, June 2011 photograph with tape extended along the northern transect line (CHN), Z0 is at the landward edge marked by a circled bucket, and the quadrat is at Z2. B, Same view as in A in March 2014 showing no change in the position of the Sarcocornia salt marsh. New Sarcocornia plants only occur on sand flats atop remnant sand volcanoes, arrows, where the slight elevation difference has allowed new plants to establish.
There was no significant difference in Sarcocornia coverage at Charlesworth Reserve between June 2011 and February 2014 (t-test where P > 0.118). Likewise, there was no significant change in Sarcocornia between zones and over time (two-way ANOVA) or a relationship between time and zone distribution ().
Table 2. Comparison of elevation difference data from various sources. Vegetation data is from this study, LiDAR data from 2003–2011 datasets (this study), and GPS and DInSAR data from Beavan, Levick et al. (Citation2012).
Elevation changes
The distribution of Sarcocornia at Charlesworth Reserve had not changed through this study, with respect to elevation. Some new plants of Sarcocornia are established on modified sand volcanoes in the low intertidal zone (B), but these are raised patches in this zone and do not reflect true establishment of Sarcocornia on lower tidal mudflats.
Settlers Reserve
In April 2011, the Sarcocornia salt marsh formed a well-established zone with a well-defined boundary to bare intertidal mudflats (). LiDAR data indicated uplift of 0.1 m but this is again within the dataset resolution of ± 0.1 m.
Figure 9. Pie charts of percentage ground cover at each zone level from June 2011 to February 2014 for the Settlers Reserve site. Each pie chart represents the zone level data averaged across lateral repeats. See C for the location of the Settlers Reserve site and E for the location of each survey site.
Initial observations of poor spring tide inundation in April 2011 suggested that uplift had occurred (A). Small seedlings of Sarcocornia were present on intertidal mudflats in November 2012, and summer growth of these was significant and Sarcocornia formed a distinct component of Z3 data by February 2013 (). These new plants of Sarcocornia were further established the following summer to cover > 25% of what was previously bare mudflats (A–D), and started to appear at the edge of the pre-existing zone of rushes (Juncus kraussi). New Sarcocornia plants were scattered though the Juncus zone by February 2014 (E), but as Juncus plants trap sediment the surface elevation is raised above the surrounding sand flat and they do not represent the lowest intertidal occurrence of Sarcocornia plants.
Figure 10. Site photographs and profile schematic showing change at the Settlers Reserve site. A, April 2011 looking seaward with the Sarcocornia salt marsh in the foreground with the intertidal sandflat seaward, and Juncus salt marsh partly inundated. Image taken at high spring tide when Sarcocornia marsh would normally be partly or completely inundated. B, Same view as A in March 2014 showing migration of Sarcocornia salt marsh across previous intertidal sand flat, and extension toward Z4 and Juncus salt marsh. Previous limit of Sarcocornia marsh marked by dashed line. C, April 2011 looking eastward across seaward margin of Sarcocornia salt marsh (Z2). D, Same view as C in March 2014 showing seaward migration of Sarcocornia salt marsh, dashed line indicates approximate position of Z2 and 2011 salt marsh margin. E, Schematic profile of Settlers Reserve western transect (SRW) with pre-subsidence distribution of key flora shown below profile-line, and February 2014 floral distribution shown above the profile line.
The area of Sarcocornia salt marsh present prior to 2011 remained throughout the survey, however, plants in this older salt marsh did not thrive and showed steady die-off through 2011 to February 2014 in Z0 and Z1 (). These plants were only wetted during rainfall and flood events in the Heathcote River and not by tidal inundation alone. New, healthy and actively growing and flowering Sarcocornia plants were only present in the lower margin (Z2) of the old zone. It is anticipated that in the future, the pre-2011 area of Sarcocornia will diminish further as grasses become more established.
There was high significant difference in Sarcocornia coverage in Z0 between June 2011 and February 2014 (t-test where P = 4.78E–5), and marginal significance at Z3 (P = 0.038). The intervening zones Z1 and Z2 show no significant difference in Sarcocornia coverage (P = 0.301 and 0.374 respectively). There was significant difference in Sarcocornia between zones and over time (two-way ANOVA) and a significant relationship between time and zone distribution ().
Elevation changes
The newly established upper and lower limits of Sarcocornia and elevation difference to pre-deformation limits are summarised in . The upper and lower limit on each transect was averaged and indicates 0.22 ± 0.1 m of uplift at Settlers Reserve.
Sediment data
At the Bridge Street and Estuary Road sites trend lines through grain size data show a slight increase in percentage sand from November 2011 to November 2013 (A,B). Sand volcanoes initially present at both sites, and progressively eroded and redistributed are the likely source of this sand. Small pits dug to reveal vertical sediment profiles at Bridge Street Z1 and Bridge Street Z2 revealed a thin smear of grey sandy sediment atop mottled brown pre-deformation soils, but this is not widespread across the site. At Settlers Reserve no change is seen in percentage sand (D) despite widespread eroded sand volcanoes at this site. P-values from two-tailed equal variance t-tests show no significant change in percentage sand over the study period.
Figure 11. Per cent sand for each zone at each survey site, calculated from Digisizer data. Each data point is the mean of left and right transect data for each zone, i.e. Bridge Street Z + 5 is the mean of results from the northern (BSNN-Z + 5) and southern (BSNS-Z + 5) transects. Trend lines for each zone are included. Note Estuary Road Z0 had no repeat and is a single data point.
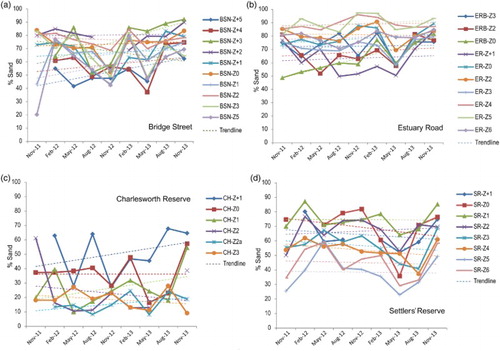
Observations throughout the study show that sediment grain size data are a snapshot of that present when sampled. At Bridge Street, redistributed sand volcano sand accumulated at Z0 to Z1 in 2012, only to be removed in 2013 by storm activity. Localised erosion where Sarcocornia plants died leaving the soil bare means that grain size data reflect older sediment rather than new accumulating sediment. The sediment accumulation patterns at each site have not yet stabilised and although the accumulation of sand volcano sand might be anticipated, the actual grain size or percentage sand post deformation reflects local site changes.
Discussion
The glasswort Sarcocornia showed a clear change in distribution during 2011 to 2014 having been stable in its pre-2011 distribution for over a decade (Jupp et al. Citation2007). At the site that underwent relative uplift (Settler’s Reserve), Sarcocornia migrated seaward down the intertidal profile, and at sites that underwent subsidence (Bridge Street and Estuary Road), Sarcocornia migrated landward. Mean amounts of vertical movement calculated from the Sarcocornia changes are 0.22 ± 0.1, –0.34 ± 0.1 and –0.16 ± 0.1 m at the above-mentioned sites respectively, while the Charlesworth Reserve site showed no apparent change (0 m) (). These vegetation changes have occurred in response to the cumulative effects of coseismic tectonic deformation and co- and post-seismic soft-sediment deformation over the whole CES. Although some authors have attempted to separate tectonic from soft-sediment deformation at a regional scale (Hughes et al. Citation2015; Quigley et al. Citation2016), we do not attempt this because we are not aware of any data that would enable this to be done reliably at the scale of our study sites.
Comparison with other datasets used to measure ground deformation
We compare the vegetation-derived mean vertical deformation estimates with those from remote-sensing data (LiDAR, GPS and DInSAR) in and . These techniques, although all used to measure ground deformation, can vary greatly in their temporal and spatial scales, making them hard to compare directly. For example, measurement of vegetation migration represents a relatively long-term response (years) over localised areas (tens of m2) compared with the instantaneous, point-based measurement of some geodetic techniques. Nevertheless, at the sites initially selected for measuring uplift (southern, Settlers Reserve) and subsidence (northern, Bridge Street), the sense of movement is indeed consistent in these directions in all remote sensing datasets. The amounts of movement calculated from each dataset differ, but most likely within the uncertainties at least at Settlers Reserve. At Bridge Street, the vegetation-based subsidence is lower than that calculated from the LiDAR and DInSAR datasets, which may partly be explained by the migration of the intertidal plants still yet to be completed.
Figure 12. Elevation difference data from vegetation, Light Detecting and Ranging (LiDAR), Global Positioning System (GPS) and Differential Interferometric Synthetic Aperture Radar (DInSAR). GPS and DInSAR data from Beavan, Levick et al. (Citation2012). Note vegetation data at Charlesworth Reserve are influenced by local effects, see text for discussion.
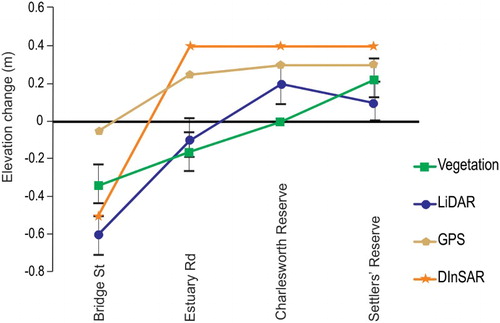
The amounts of movement calculated from the vegetation changes at the sites originally interpreted to be control sites (Estuary Road and Charlesworth Reserve) are small (–0.16 and 0 m) and they differ from the other datasets. At Estuary Road, the GPS and DInSAR data indicate uplift, whereas the vegetation and LiDAR datasets indicate subsidence. This may be an artefact of the spatial resolution capacity of GPS and DInSAR data in conjunction with the observed subsidence being small. At the Charlesworth Reserve Site, the apparent lack of uplift in the vegetation data is likely a localised effect. Tide levels at Charlesworth Reserve are controlled by water flow through culverts under a roadway that join it to the AHEI proper (D). The roadway is constructed of fill atop older estuarine sediments and it is suggested here that the weight of fill has amplified soft-sediment compaction during seismic shaking, resulting in subsidence of the culverts into and out of Charlesworth Reserve, but combined with tectonic uplift the net effect is broadly similar tidal wetting and thus no change in plant distribution. The drying of intertidal muds at Charlesworth Reserve may be linked either to a shorter period of wetting and/or increased drainage driven by uplift and changes to local base level.
Differential LiDAR data is now routinely used to map ground deformation, because it can be rapidly acquired, has potential to show significant detail and is visually intuitive (Hudnut et al. Citation2002; Kayen et al. Citation2006; Oskin et al. Citation2012; Quigley et al. Citation2012; Duffy et al. Citation2013). To ground truth LiDAR results is not as rapid. Geodetic datum points need to be recalibrated manually to determine new elevations, and geodetic data may be lacking in non-urban regions. The February 2011 coseismic deformation event included the AHEI, and at coastal locations, deformation could be measured through changes in tidal wetting. Daily tides, however, are influenced by initial lunar-derived predictions, barometric pressure and local conditions, and thus using tidal gauge data does not provide an accurate measure of change in the short term. During the course of this study, inundation by tides of the same predicted lunar elevation were widely different—one tidal event at Bridge Street was observed to be c. 0.4 m lower than predicted simply because of persistent winds from the north limiting tidal flow into the northern AHEI. For this reason, short-term observations of tide levels are not accurate. Intertidal flora and fauna adjust to long-term tidal averages, and so are more likely to reflect the actual amounts of vertical movement.
In general, the similarity in indicated vertical deformation between the different datasets is reassuring but in detail, there are reasons why different methods may under- or overestimate amounts of change. All methods of measurement, whether digital or on the ground, will have a margin of error. The precision of measurement of LiDAR data, and the ground area that one pixel represents, may be too coarse for the on-ground changes that can be observed in long-term vegetation changes. Conversely, the limited sampling area of vegetation studies mean that they may accurately reveal change at an immediate point but fail to reflect change over a broader area.
Potential geological signal
Sediment monitoring throughout the study showed a weak signal of increase in grain size that is attributed to redistribution of sand volcano material. However, in this instance, the sand was derived from older estuary or coastal sediments, and so bears similar characteristics to modern sediments; grain size alone would not be sufficient as an indicator of deformation. Throughout this study, redistributed sand volcano material was seen as slightly cleaner sands but over time, it might be expected that bioturbation and mixing with underlying sediment would further dilute any potential geological signal.
To date, only thin veneers of sand have accumulated at Bridge Street and Settlers Reserve and are still vulnerable to erosion in storm events. Both Bridge Street and Estuary Road experienced subsidence and both exhibited wave erosion of the pre-deformation shoreline caused by a reduction in baffling by either artificial structures or seaward rushes. This erosion surface is likely to be seen in the future geological record of this event, and if sand accumulation continues, a layer of sand with mid intertidal flora and fauna would be expected to overlie high-intertidal soils (see figure 30 in Cochran et al. Citation2014). At Settlers Reserve high intertidal soils would be expected to form on the uplifted mid-intertidal sediments with time (see figure 31 in Cochran et al. Citation2014), but this change might not be distinguishable from the normal estuarine infilling signal.
Foraminiferal material collected from each monitoring site in June 2011 and February 2013 showed no significant difference (t-test P = 0.865) in accumulated foraminiferal tests (Vettoretti Citation2014). This is likely linked to the wide spacing of monitoring points failing to sufficiently sample the high-intertidal zone, and possibly the negative effects of urban sewage draining into the AHEI after each major event. High salt marsh foraminifera south of the Bridge Street survey site have shown changes in composition between 2010 and 2013 (Hayward, Sabaa et al. Citation2015) when the high intertidal zone has been sufficiently sampled. However, even if forams do recover and new sediments contain forams reflective of new intertidal elevation, the life habit of forams may influence interpretation. Most foraminifera live in the upper 0.02–0.08 m of sediment, but live foraminifera may be present up to 0.29 m beneath the sediment surface in New Zealand salt marshes (Hayward, Clark et al. Citation2015). This is comparable with foraminiferal habitats elsewhere (Ozarko et al. Citation1997; Tobin et al. Citation2005) and new post-deformation tests will be mixed with older pre-deformation tests (Engelhart et al. Citation2013). The record of sudden elevation change will then be muted as, for example, high-tidal fauna may be mixed with low-tidal tests resulting in a mid-tidal interpretation, thus muting the signal of deformation events as recorded by foraminifera.
In this modern study, ground motions, epicentre and fault position were known or could be determined. Our sites were selected based on this knowledge to maximise the likelihood of seeing vegetation change and the potential geological signal. Yet even at sites with clear vertical deformation (Bridge Street and Settlers Reserve), the potential geological signal is weakened by soft-sediment compaction and the microfossil mixing discussed above. The February 2011 earthquake produced extreme ground accelerations (Bradley & Cubrinovski Citation2011; Bradley et al. Citation2014) and widespread damage, yet the geological signal of uplift or subsidence linked to this deformation may be weak. We suggest any record of vertical deformation preserved in the geological record must factor strongly when developing earthquake hazard and risk models, in recognition that they may under-represent the true amount of deformation. This is further compounded by the difficulty in detecting the geomorphic effects of blind faults (Quigley et al. Citation2016), particularly when their existence may be unknown. In paleoseismic studies, selection of sampling sites is key to obtaining evidence of earthquake-induced changes, yet despite deformation in the AHEI, the potential for preservation was restricted to a few locations (Settlers Reserve and Bridge Street regions). Although accurate placement of sampling sites is possible when exploring paleoseismicity of known faults, or faults with preserved fault trace, it will be extremely challenging in the case of faults lacking surface rupture or that are only approximately located by geophysical techniques.
Conclusions
Salt marsh plants in the AHEI have responded to coseismic deformation and have migrated seaward or landward in response to respective uplift or subsidence. In the case of subsidence at Bridge Street, the pre-deformation zone of salt marsh Sarcocornia has been completely lost and Sarcocornia has established in previously grassed areas. The vegetation changes have been used to calculate mean vertical deformation of –0.34 ± 0.1, –0.16 ± 0.1, 0 and 0.22 ± 0.1 m at the sites from north to south. This corroborates previous interpretations that vertical deformation in the 2011 Christchurch earthquake was primarily caused by a southeast-dipping blind reverse fault crossing beneath the AHEI.
The vegetation response on the ground, measured over 2011 to early 2014, correlates broadly with other datasets, most notably LiDAR data, except where local drainage features have influenced vegetation growth (Charlesworth Reserve). In fine detail, there are small differences between datasets that may reflect either margin of error in LiDAR (or vegetation) or scale issues where ground vegetation features are too fine to be represented accurately in digital data.
Change in the nature of sediments is controlled by local dynamics, and although erosion surfaces are present, grain size change may not be evident, at least not at the timescale of this study. This earthquake is likely to be preserved in the geological record as a subtle sedimentological signature of erosion surfaces overlain by intertidal sediments (subsidence) or horizons with slightly sandier sediments where introduced sand volcano sand is reworked but not removed (uplift and subsidence) in restricted locations around the estuary. Sediments may show change, but actual sediment response is dependent on the local dynamics. Soft-sediment compaction acts to mute uplift records, and along with mixing of proxy fossil material, the geological record may significantly under-represent tectonic uplift in estuarine settings.
Acknowledgements
Sean Freeman, Gina Vettoretti (University of Canterbury), Finn Scheele (GNS and University of Canterbury) and Bella Ansell (GNS) provided valuable support in sample and data processing through the life of this project. Vanessa Tappenden and Anekant Wandres (University of Canterbury Geological Sciences) are thanked for support with RTK surveying equipment and data processing. Bruce Hayward (Geomarine Research) and Peter Johnson (Landcare Research, Dunedin) are thanked for constructive review of the manuscript. Associate editor: Professor Tim Little.
Disclosure statement
No potential conflict of interest was reported by the authors.
Additional information
Funding
References
- Atwater BF. 1987. Evidence for great Holocene earthquakes along the outer coast of Washington State. Science. 236:942–944. doi: 10.1126/science.236.4804.942
- Bannister S, Gledhill K. 2012. Evolution of the 2010–2012 Canterbury earthquake sequence. New Zealand Journal of Geology and Geophysics. 55:295–304. doi: 10.1080/00288306.2012.680475
- Beavan J, Fielding E, Motagh M, Samsonov S, Donnelly N. 2011. Fault location and slip distribution of the 22 February 2011 MW 6.2 Christchurch, New Zealand, earthquake from geodetic data. Seismological Research Letters. 82:789–799. doi: 10.1785/gssrl.82.6.789
- Beavan J, Levick SR, Lee JM, Jones KE. 2012. Ground displacements and dilatational strains caused by the 2010–2011 Canterbury earthquakes. GNS Science consultancy report 2012/67:29 p.+1 CD.
- Beavan J, Motagh M, Fielding EJ, Donnelly N, Collett D. 2012. Fault slip models of the 2010–2011 Canterbury, New Zealand, earthquakes from geodetic data, and observations of post-seismic ground deformation. New Zealand Journal of Geology and Geophysics. 55:207–221. doi: 10.1080/00288306.2012.697472
- Bodin P, Klinger T. 1986. Coastal uplift and mortality of intertidal organisms caused by the September 1985 Mexico earthquakes. Science. 233:1071–1073. doi: 10.1126/science.233.4768.1071
- Bradley BA, Cubrinovski M. 2011. Near-source strong ground motions observed in the 22 February 2011 Christchurch Earthquake. Seismological Research Letters. 82:853–865. doi: 10.1785/gssrl.82.6.853
- Bradley BA, Quigley MC, Van Dissen RJ, Litchfield NJ. 2014. Ground motion and seismic source aspects of the Canterbury earthquake sequence. Earthquake Spectra. 30:1–15. doi: 10.1193/030113EQS060M
- Browne GH, Field BD, Barrell DJA, Jongens R, Bassett KN, Wood RA. 2012. The geological setting of the Darfield and Christchurch earthquakes. New Zealand Journal of Geology and Geophysics. 55:193–197. doi: 10.1080/00288306.2012.682654
- Campbell JK, Pettinga JR, Jongens R. 2012. The tectonic and structural setting of the 4 September 2010 Darfield (Canterbury) earthquake sequence, New Zealand. New Zealand Journal of Geology and Geophysics. 55:155–168. doi: 10.1080/00288306.2012.690768
- Carver GA, Jayko AS, Valentine DW, Li WH. 1994. Coastal uplift associated with the 1992 Cape Mendocino earthquake, northern California. Geology. 22:195–198. doi: 10.1130/0091-7613(1994)022<0195:CUAWTC>2.3.CO;2
- Castilla JC, Manríquez PH, Camaño A. 2010. Effects of rocky shore coseismic uplift and the 2010 Chilean mega-earthquake on intertidal biomarker species. Marine Ecology Progress Series. 418:17–23. doi: 10.3354/meps08830
- Castilla JC, Oliva D. 1990. Ecological consequences of coseismic uplift on the intertidal kelp belts of Lessonia nigrescens in central Chile. Estuarine, Coastal and Shelf Science. 31:45–56. doi: 10.1016/0272-7714(90)90027-O
- Cisternas M, Atwater BF, Torrejon F, Sawai Y, Machuca G, Lagos M, Eipert A, Youlton C, Salgado I, Kamataki T, et al. 2005. Predecessors of the giant 1960 Chile earthquake. Nature. 437:404–407. doi: 10.1038/nature03943
- Clark KJ, Hayward BW, Cochran UA, Wallace LM, Power WL, Sabaa AT. 2015. Evidence for past subduction earthquakes at a plate boundary with widespread upper plate faulting: Southern Hikurangi Margin, New Zealand. Bulletin of the Seismological Society of America. 105:1661–1690. doi: 10.1785/0120140291
- Cochran UA, Berryman KR, Zachariasen J, Mildenhall DC, Hayward BW, Southall K, Hollis CJ, Barker P, Wallace LM, Alloway B, Wilson K. 2006. Paleoecological insights into subduction zone earthquake occurrence, Eastern North Island, New Zealand. Geological Society of America Bulletin. 118:1051–1074. doi: 10.1130/B25761.1
- Cochran UA, Hannah M, Harper M, van Dissen R, Berryman KR, Begg J. 2007. Detection of large, Holocene earthquakes using diatom analysis of coastal sedimentary sequences, Wellington, New Zealand. Quaternary Science Reviews. 26:1129–1147. doi: 10.1016/j.quascirev.2007.01.008
- Cochran UA, Reid CM, Clark KJ, Litchfield NL, Marsden I, Ries W. 2014. The Avon-Heathcote Estuary as a Recorder of Coseismic Vertical Deformation. GNS Science Consultancy Report 2014/128: 50 p. + Appendices on CD. Available from: http://www.eqc.govt.nz/sites/public_files/3781-Avon-Heathcote-estuary-coseismic-vertical-deformation.pdf
- Cowan H, Nicol A, Tonkin P. 1996. A comparison of historical and paleoseismicity in a newly formed fault zone and a mature fault zone, North Canterbury, New Zealand. Journal of Geophysical Research. 101:6021–6036. doi: 10.1029/95JB01588
- Cox SC, Rutter HK, Sims A, Manga M, Weir JJ, Ezzy T, White PA, Horton TW, Scott D. 2012. Hydrological effects of the MW 7.1 Darfield (Canterbury) earthquake, 4 September 2010, New Zealand. New Zealand Journal of Geology and Geophysics. 55:231–247. doi: 10.1080/00288306.2012.680474
- Darienzo ME, Peterson CD. 1990. Episodic tectonic subsidence of late Holocene salt marshes, northern Oregon central Cascadia margin. Tectonics. 9:1–22. doi: 10.1029/TC009i001p00001
- Dorn C, Green AG, Jongens R, Carpentier S, Kaiser AE, Campbell F, Horstmeyer H, Campbell J, Finnemore M, Pettinga JR. 2010. High-resolution seismic images of potentially seismogenic structures beneath the northwest Canterbury plains, New Zealand. Journal of Geophysical Research. 115:B11303. doi: 10.1029/2010JB007459
- Duffy B, Quigley MC, Barrell DJA, van Dissen R, Stahl T, Leprince S, McInnes C, Bilderback E. 2013. Fault kinematics and surface deformation across a releasing bend during the 2010 MW 7.1 Darfield, New Zealand, earthquake revealed by differential LiDAR and cadastral surveying. Geological Society of America Bulletin. 125:420–431. doi: 10.1130/B30753.1
- Dura T, Hemphill-Haley E, Sawai Y, Horton BP. 2016. The application of diatoms to reconstruct the history of subduction zone earthquakes and tsunamis. Earth-Science Reviews. 152:181–197. doi: 10.1016/j.earscirev.2015.11.017
- Elliott JR, Nissen EK, England PC, Jackson JA, Lamb S, Li Z, Oehlers M, Parsons B. 2012. Slip in the 2010–2011 Canterbury earthquakes, New Zealand. Journal of Geophysical Research. 117:B03401. doi:10.1029/2011JB008868.
- Engelhart SE, Horton BP, Nelson AR, Hawles AD, Witter RC, Wang K, Wang P-L, Vane CH. 2013. Testing the use of microfossils to reconstruct great earthquakes at Cascadia. Geology. 41:1067–1070. doi: 10.1130/G34544.1
- Findlay RH, Kirk RM. 1988. Post-1847 changes in the Avon-Heathcote Estuary, Christchurch: a study of the effect of urban development around a Tidal Estuary. New Zealand Journal of Marine and Freshwater Research. 22:101–127. doi: 10.1080/00288330.1988.9516283
- Garrett E, Shennan I, Watcham EP, Woodroffe SA. 2013. Reconstructing paleoseismic deformation, 1: modern analogues from the 1960 and 2010 Chilean great earthquakes. Quaternary Science Reviews. 75:11–21. doi: 10.1016/j.quascirev.2013.04.007
- Ghisetti FC, Sibson RH. 2012. Compressional reactivation of E–W inherited normal faults in the area of the 2010–2011 Canterbury earthquake sequence. New Zealand Journal of Geology and Geophysics. 55:177–184. doi: 10.1080/00288306.2012.674048
- Hamilton S, Shennan I, Combellick R, Mulholland J, Noble C. 2005. Evidence for two great earthquakes at anchorage, Alaska and implications for multiple great earthquakes through the Holocene. Quaternary Science Reviews. 24:2050–2068. doi: 10.1016/j.quascirev.2004.07.027
- Hayward BW, Clark KJ, Sabaa AT, Cochran UA. 2015. Taphonomically- and infaunally-adjusted salt marsh foraminiferal record of late holocene earthquake displacements and a tsunami sand, New Zealand. Journal of Foraminiferal Research. 45:354–368. doi: 10.2113/gsjfr.45.4.354
- Hayward BW, Grenfell HR, Sabaa AT, Carter R, Cochran UA, Lipps JH, Shane PR, Morley MS. 2006. Micropaleontological evidence of large earthquakes in the past 7200 years in southern Hawke’s Bay, New Zealand. Quaternary Science Reviews. 25:1186–1207. doi: 10.1016/j.quascirev.2005.10.013
- Hayward BW, Grenfell HR, Sabaa AT, Clark KJ, Cochran UA, Palmer AS. 2015. Subsidence-driven environmental change in three Holocene embayments of Ahuriri Inlet, Hikurangi Subduction Margin, New Zealand. New Zealand Journal of Geology and Geophysics. 58:344–363. doi: 10.1080/00288306.2015.1077872
- Hayward BW, Grenfell HR, Sabaa AT, Cochran UA, Clark KJ, Wallace LM, Palmer AS. 2016. Salt-marsh foraminiferal record of 10 large Holocene (last 7500 yr) earthquakes on a subducting plate margin, Hawkes Bay, New Zealand. Geological Society of America Bulletin. 128:896–915. doi: 10.1130/B31295.1
- Hayward BW, Grenfell HR, Scott DB. 1999. Tidal range of marsh foraminifera for determining former sea-level heights in New Zealand. New Zealand Journal of Geology and Geophysics. 42:395–413. doi: 10.1080/00288306.1999.9514853
- Hayward BW, Sabaa AT, Figueira B, Reid CM, Nomura R. 2015. Foraminiferal record of the 2010-2011 Canterbury earthquake sequence, New Zealand, and possible predecessors. Palaeogeography, Palaeoclimatology, Palaeoecology. 438:213–225. doi: 10.1016/j.palaeo.2015.07.050
- Hemphill-Haley E. 1995. Diatom evidence for earthquake-induced subsidence and tsunami 300 yr ago in Southern Coastal Washington. Geological Society of America Bulletin. 107:0367–378. doi: 10.1130/0016-7606(1995)107<0367:DEFEIS>2.3.CO;2
- Hudnut KW, Borsa A, Glennie C, Minster J-B. 2002. High-resolution topography along surface rupture of the 16 October 1999 hector mine, California, earthquake (MW 7.1) from airborne laser swath mapping. Bulletin of the Seismological Society of America. 92:1570–1576. doi: 10.1785/0120000934
- Hughes JF, Mathewes RW, Clague JJ. 2002. Use of pollen and vascular plants to estimate coseismic subsidence at a tidal marsh near Tofino, British Columbia. Palaeogeography, Palaeoclimatology, Palaeoecology. 185:145–161. doi: 10.1016/S0031-0182(02)00283-3
- Hughes MW, Quigley MC, van Ballegooy S, Deam BL, Bradley BA, Hart DE. 2015. The sinking city: earthquakes increase flood hazard in Christchurch, New Zealand. GSA Today 25.
- Hull AG. 1990. Tectonics of the 1931 Hawke’s Bay earthquake. New Zealand Journal of Geology and Geophysics. 33:309–320. doi: 10.1080/00288306.1990.10425689
- Jennings AE, Nelson AR. 1992. Foraminiferal assemblage zones in Oregon tidal marshes; relation to marsh floral zones and sea level. The Journal of Foraminiferal Research. 22:13–29. doi: 10.2113/gsjfr.22.1.13
- Jones MB, Marsden ID. 2005. Life in the Estuary: illustrated guide and ecology. Christchurch: University of Canterbury Press.
- Jupp K, Partridge TR, Hart DE, Marsden ID. 2007. Ecology of the Avon-Heathcote Estuary: Comparative salt marsh survey 2006–2007. Estuarine Research Report 34. School of Biological Sciences University of Canterbury. 77 p.
- Kaiser A, Holden C, Beavan J, Beetham D, Benites R, Calentano A, Collet D, Cousins J, Cubrinovski M, Dellow G, et al. 2012. The Mw 6.2 Christchurch earthquake of February 2011: preliminary report. New Zealand Journal of Geology and Geophysics. 55:67–90. doi: 10.1080/00288306.2011.641182
- Kayen R, Pack RT, Bay J, Sugimoto S, Tanak H. 2006. Terrestrial-LIDAR visualization of surface and structural deformations of the 2004 Niigata Ken Chuetsu, Japan, Earthquake. Earthquake Spectra. 22:147–162. doi: 10.1193/1.2173020
- Kelsey HM, Witter RC, Hemphill-Haley E. 2002. Plate-boundary earthquakes and tsunami of the past 5500 yr, Sixes River Estuary, Southern Oregon. Geological Society of America Bulletin. 114:298–314. doi: 10.1130/0016-7606(2002)114<0298:PBEATO>2.0.CO;2
- Laegdsgaard P. 2002. Recovery of small denuded patches of the dominant NSW coastal saltmarsh species (Sporobolus virginicus and Sarcocornia quinqueflora) and implications for restoration using donor sites. Ecological Management and Restoration. 3:200–204. doi: 10.1046/j.1442-8903.2002.00113.x
- Litchfield N, Van Dissen R, Sutherland R, Barnes PM, Cox S, Norris R, Beavan J, Langridge R, Villamor P, Berryman K, et al. 2014. A model of active faulting in New Zealand. New Zealand Journal of Geology and Geophysics. 57:32–56. doi: 10.1080/00288306.2013.854256
- Marshall P. 1933. Effects of earthquake on coast-line near Napier. New Zealand Journal of Science and Technology. 15:79–92.
- Measures R, Hicks M, Shankar U, Bind J, Arnold J, Zeldis J. 2011. Mapping earthquake induced topographical change and liquefaction in the Avon-Heathcote Estuary. NIWA Client Report No CHC11-066:28p.
- Morgenroth J, Armstrong T. 2012. The impact of significant earthquakes on Christchurch, New Zealand’s urban forest. Urban Forestry and Urban Greening. 11:383–389. doi: 10.1016/j.ufug.2012.06.003
- Nelson AR, Kashima K. 1993. Diatom zonation in Southern Oregon tidal marshes relative to vascular plants, foraminifera, and sea level. Journal of Coastal Research. 9:673–697.
- Oskin ME, Arrowsmith JR, Corona AH, Elliott AJ, Fletcher JM, Fielding EJ, Gold PO, Garcia JJG, Hudnut KW, Liu-Zeng J, Teran OJ. 2012. Near-Field deformation from the El Mayor-Cucapah earthquake revealed by differential LIDAR. Science. 335:702–705. doi: 10.1126/science.1213778
- Ozarko DL, Patterson T, Williams HFL. 1997. Marsh foraminifera from Nanaimo, British Columbia (Canada): implications of infaunal habitat and taphonomic biasing. Journal of Foraminiferal Research. 27:51–68. doi: 10.2113/gsjfr.27.1.51
- Patterson RT, Hutchinson I, Guilbault J-P, Clague JJ. 2000. A comparison of the vertical zonation of diatom, foraminifera, and macrophyte assemblages in a coastal marsh: implications for greater paleo-sea level resolution. Micropaleontology. 46:229–244. doi: 10.2113/46.3.229
- Pettinga JR, Yetton M, van Dissen R, Downes G. 2001. Earthquake source identification and characterization for the Canterbury region, South Island, New Zealand. Bulletin of the New Zealand Society of Earthquake Engineering. 34:282–317.
- Quigley MC, Bastin S, Bradley BA. 2013. Recurrent liquefaction in Christchurch, New Zealand, during the Canterbury earthquake sequence. Geology. 41:419–422. doi: 10.1130/G33944.1
- Quigley MC, Hughes MW, Bradley BA, van Ballegooy S, Reid CM, Morgenroth J, Horton TW, Duffy B, Pettinga JR. 2016. The 2010-2011 Canterbury Earthquake sequence: environmental effects, seismic triggering thresholds and geologic legacy. Tectonophysics. 672-673:228–274. doi: 10.1016/j.tecto.2016.01.044
- Quigley MC, Van Dissen R, Litchfield N, Villamor P, Duffy B, Barrell D, Furlong K, Stahl T, Bilderback E, Noble D. 2012. Surface rupture during the 2010 MW 7.1 Darfield (Canterbury) earthquake: implications for fault rupture dynamics and seismic-hazard analysis. Geology. 40:55–58. doi: 10.1130/G32528.1
- Reid CM, Thompson NK, Irvine JRM, Laird TE. 2012. Sand volcanoes in the Avon-Heathcote Estuary produced by the 2010–2011 Christchurch earthquakes: implications for geological preservation and expression. New Zealand Journal of Geology and Geophysics. 55:249–254. doi: 10.1080/00288306.2012.674051
- Shennan I, Garrett E, Barlow N. 2016. Detection limits of tidal-wetland sequences to identify variable rupture modes of megathrust earthquakes. Quaternary Science Reviews. 150:1–30.
- Skilton JE. 2013. Invertebrate responses to large-scale change: impacts of eutrophication and cataclysmic earthquake events in a Southern New Zealand Estuary [Unpublished PhD thesis]. University of Canterbury. 265 p. Available from: https://ir.canterbury.ac.nz/handle/10092/8725
- Thannheiser D, Holland P. 1994. The plant communities of New Zealand Salt Meadows. Global Ecology and Biogeography Letters. 4:107–115. doi: 10.2307/2997436
- Tobin R, Scott DB, Collins ES, Medioli FS. 2005. Infaunal benthic foraminifera in some North American marshes and their influence on fossil assemblages. Journal of Foraminiferal Research. 35:130–147. doi: 10.2113/35.2.130
- Tonkin and Taylor Ltd. 2014. Canterbury Earthquake Sequence: Increased Flooding Vulnerability Assessment Methodology. Chapman Tripp acting on behalf of the Earthquake Commission (EQC) Report # 52010.150.: 31.
- Vettoretti GJ. 2014. Intertidal foraminifera of the Avon-Heathcote Estuary: response to coseismic deformation and potential to record local historic events [Unpublished MSc thesis]. University of Canterbury. 105 p. Available from: https://ir.canterbury.ac.nz/handle/10092/10259
- Villamor P, Litchfield N, Barrell D, Van Dissen R, Hornblow S, Quigley MC, Levick S, Ries W, Duffy B, Begg J, et al. 2012. Map of the 2010 Greendale Fault surface rupture, Canterbury, New Zealand: application to land use planning. New Zealand Journal of Geology and Geophysics. 55:223–230. doi: 10.1080/00288306.2012.680473
- Wilson KJ, Berryman K, Cochran U, Little T. 2007. Early Holocene paleoseismic history at the Pakarae locality, eastern North Island, New Zealand, inferred from transgressive marine sequence architecture and biostratigraphy. Tectonics. 26:TC4013. doi: 10.1029/2006TC002021