
ABSTRACT
Diagenesis of calcareous and siliceous sediments in northern Zealandia produces characteristic seismic reflections that are a valuable tool for constraining paleoenvironmental and tectonic history. We correlate Deep Sea Drilling Program (DSDP) borehole lithology changes with seismic reflectivity to characterise distinct diagenetic horizons. An increase in reflectivity in calcareous Paleocene to Miocene age sediments marks the depth that ooze alters to chalk. Predominantly occurring at c. 300 m below the seafloor on the Lord Howe Rise, variations are observed in the New Caledonia Trough, and in the Eocene in the Southern Lord Howe Rise due to changes in sediment composition. Paleocene–Eocene silica-rich sediments undergoing diagenesis produced distinct negative–positive polarity paired reflections from unaltered and altered sediments, respectively. Sediments undergoing diagenesis range in age from Paleocene to Miocene, indicating that overburden thickness and temperature are the main controlling factors for the onset of diagenesis, whereas the diagenetic potential of sediments is controlled by composition and burial conditions.
Introduction
Physical properties of pelagic sediments are affected by compaction and diagenesis during burial, with the largest changes occurring at shallow burial depths of < 1 km beneath the seabed (Cook and Egbert Citation1983). Geophysical studies, petroleum industry and research boreholes in continental shelf and upper bathyal environments (< 800 m water depths), have been used to quantify processes of compaction and diagenesis for a variety of rock types that form in these environments (Storvoll et al. Citation2005). The bathyal zone (200–4000 m) is the most common target of the Deep Sea Drilling Program (DSDP), and its successors. Bathyal environments in the oceans are found on continental slopes and submarine plateaux of extended continental crust or thick oceanic crust created by hotspot activity (Schubert and Sandwell Citation1989). Below the influence of surface currents, but above the carbonate compensation depth, these environments typically accumulate fossil-rich, near-continuous sedimentary records.
Sediment cores have been collected by scientific drilling programmes over five decades, and hence there is a broad data set to understand physical properties of deeper ocean sediments (Erickson and Jarrard Citation1998).
Outside major changes in depositional lithology, compaction and diagenetic alteration have the biggest influence on the physical properties of bathyal sediments. The top c. 1000 m below the seafloor (mbsf) can be divided into distinct zones of shallow and deep burial diagenesis (Cook and Egbert Citation1983). In the shallow burial zone (0–300 mbsf), seismic velocity gradients are low () and sediments are progressively consolidated, although porosity is still high. Diagenetic alteration of carbonate ooze to chalk occurs by chemical reactions, cementation and mechanical compaction. These processes increase seismic velocities in the deep burial zone (c. 300–1000 mbsf) (Cook and Egbert Citation1983). When heated, silica-rich opal-A sediments undergo diagenesis by dissolution and recrystallisation to the more stable forms of cristobalite and tridymite (opal-CT) (Riech Citation1981). Silica and carbonate diagenesis may be associated with step changes in physical properties due to changes in porosity. The depth range at which these diagenetic changes occur is dependent on temperature and fluid pressure conditions, terrigenous sediment content (mainly clay), and on sediment chemistry, which is in turn related to environmental conditions at the time of deposition, including ocean productivity, chemistry and temperature (Cook and Egbert Citation1983). We address the diagenetic history and physical properties of the bathyal sediments found on one of the largest submarine plateaux on Earth: the northern submerged part of the Zealandia continent (Mortimer et al. Citation2017), which is located in the southwest Pacific.
Table 1. Physical properties measured and calculated from drill core data on northern Zealandia.
Seismic reflections observed in northern Zealandian multichannel data, that are calibrated to boreholes, show distinct characteristics that make them useful for interpreting the tectonic and climate history of the region (Nouze et al. Citation2009; Bache et al. Citation2014). These reflections are produced by abrupt changes in physical properties that are observable in down-hole geophysical logs (Cook and Egbert Citation1983; Anselmetti and Eberli Citation1993). The Oligocene–Eocene unconformity produces a distinctive negative-polarity seismic reflection in many places that is continuous and underlain by several high-amplitude reflections. This unconformity is an erosion surface linked to deformation and vertical motions associated with Tonga–Kermadec subduction initiation (Sutherland et al. Citation2010, Citation2017; Bache et al. Citation2014) and a change in ocean currents associated with climate cooling and the opening of Southern Ocean gateways (Kennett et al. Citation1975). Kennett et al. (Citation1975) attribute the regional nature of the Eocene–Oligocene unconformity to the development of enhanced deep-sea erosion from Antarctic bottom water, a result of increased sea ice (Shackleton and Kennett Citation1975). Significant changes in pelagic sediment composition are observed across this unconformity (Nouze et al. Citation2009), and distinctive high-amplitude reflections are caused by diagenetic fronts associated with the diagenetic alteration of calcareous ooze to chalk (Anselmetti and Eberli Citation1993) and siliceous ooze (opal-A) to opal-CT and chert (Riech Citation1981; Nouze et al. Citation2009; Rollet et al. Citation2012).
Observations of borehole lithology and diagenesis can be tied to reflections on seismic lines that can be traced regionally and correlated with the larger scale Cenozoic climate and tectonic events that have shaped northern Zealandia. The aim of this paper is to present a synthesis of existing drilling and geophysical data that provide a framework for: (1) future regional geophysical interpretations, and (2) research into the physical properties and diagenesis of this regionally extensive bathyal sedimentary succession.
Geologic setting
The northern Zealandian region comprises a series of structural highs and lows. For example, west of the North Island, the Lord Howe Rise and West Norfolk Ridge are interspersed with the deeper New Caledonia Trough and Reinga Basin (Uruski Citation2010) (). Water depths across the region range from c. 500 to c. 3500 m. Crust in this region formed as an accreted margin during Gondwana subduction from 350 to 100 Ma, was thinned during back arc extension from 100 to 85 Ma (Bradshaw Citation1989), and finally separated from Australia by the Tasman Sea spreading centre from 85 to 52 Ma (Gaina et al. Citation1998). These plateaux of northern Zealandia are confirmed to be underlain by extended continental crust by dredging of continental rocks and by seismic models of crustal velocities and thickness (Tulloch et al. Citation1991; Mortimer Citation2004; Klingelhoefer et al. Citation2007; Mortimer et al. Citation2017).
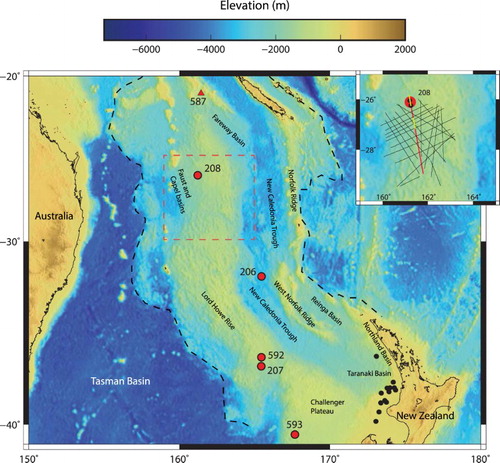
Figure 1. Location figure for northern Zealandia. The main basins and rises are labelled. (⬤) DSDP boreholes used for velocity and lithology information in this study (Burns et al. Citation1973a, Citation1973b, Citation1973c; Kennett et al. Citation1986b). (▴) DSDP borehole used for heat flow data (Kennett et al. Citation1983). (⬤) Taranaki Basin wells. The dashed black line outlines northern Zealandia, and the red dashed box is the location of the inset. Inset shows the Sonobuoys (⬤) and the Geoscience Australia seismic array (GA-302, lines) on the northern Lord Howe Rise used for velocity analysis (Petkovic Citation2010). The red line is multichannel seismic line GA-302-09. Yellow lines show the coverage of the sonobuoys that recorded velocity data and coincide with the locations of the multichannel seismic data sections shown in .
Deposition of pelagic oozes on the 3,000,000 km3 submarine plateau has occurred since at least the Late Cretaceous (Burns et al. Citation1973b). DSDP borehole data indicate that these are calcareous pelagic and hemi-pelagic oozes with siliceous fossils present predominantly in the Paleocene and Eocene, and ash and clay near topography or volcanoes (Burns et al. Citation1973a, Citation1973b, Citation1973c; Kennett et al. Citation1986b). Paleocene and Eocene sediments contain significant volumes of siliceous fossils, which increase porosity, and decrease density and seismic velocity (Burns et al. Citation1973b, Citation1973c). Volcanism and terrestrial sediments are the sources for clays that are present in the oozes, especially in the southern region in Paleocene and Eocene (volcanic) sediments at DSDP 207 (Burns et al. Citation1973c), and in Oligocene sediments at DSDP 206 (volcanic ash and erosion of nearby landmasses) (Burns et al. Citation1973a).
The variable composition of pelagic oozes across northern Zealandia indicates that there have been temporal changes to the marine environment in the Paleogene that affected the measure of siliceous ooze or carbonate ooze production (Dutkiewicz et al. Citation2015). Seismic reflectors associated with Paleogene strata have regional tectonic and climate significance, and are identified on the Lord Howe Rise (Rollet et al. Citation2012; Bache et al. Citation2014; Higgins et al. Citation2015), the New Caledonia Trough (Nouze et al. Citation2009; Sutherland et al. Citation2010), Reinga Basin (Bache et al. Citation2012), Fairway Basin (Nouze et al. Citation2009) and deep-water Taranaki Basin (Baur et al. Citation2014) (). Drilled cores and multichannel seismic data show that the burial history of these sediments has been disrupted by at least two regional unconformities of Paleocene–Eocene and Eocene–Oligocene (Eocene–Miocene in the south) ages.
Data and methods
Two main data sources are used to quantify the physical properties of northern Zealandia sediment: multichannel seismic data and DSDP drill cores. To make comparisons between physical data measured from cores () and those estimated from multichannel seismic data ( and ), drill sites that are crossed by high-quality seismic data are used. The resolution of these seismic lines varies, but reflections from layers as thin as 5 m are resolvable. DSDP drilling in northern Zealandia began with a smattering of holes cored on Leg 21 in late 1971 to early 1972 (Burns et al. Citation1973a, Citation1973b, Citation1973c) and on Leg 90 in 1982 (Kennett et al. Citation1986b), of which three penetrated sediments older than Late Eocene (Burns et al. Citation1973a, Citation1973b, Citation1973c).
Physical property measurements and lithologies from DSDP boreholes used in this study are summarised in . The cores are divided into units based on lithology () and measured physical properties. Where possible, velocity and density gradients are calculated for the units from linear regression of the corrected drill core physical properties ( and ). X-ray diffraction measurements on the cores show the occurrence of cristobalite and tridymite (opal-CT) which are the minerals formed during diagenetic alteration of opal-A ooze (Burns et al. Citation1973a, Citation1973b). The ooze to chalk transition is more subjective and based on the interpretations of onboard core describers.
Figure 2. Stratigraphic columns showing main lithology at the DSDP boreholes and the regional unconformities. Adapted from Burns et al. (Citation1973a, Citation1973b, Citation1973c) and Kennett et al. (Citation1986b). Physical property data and co-incident seismic records are shown in for DSDP sites 208, 206, 207 and 592.
Rebound corrections
To compare measurements of velocity and density under atmospheric conditions with in situ measurements, values measured on core must be corrected for porosity rebound due to overburden removal. This is achieved using empirical solutions derived from consolidation tests (Hamilton Citation1976), in which downhole (in situ) measurements are compared with laboratory measurements on extracted cores. The literature holds many examples of empirical solutions for these corrections (Hamilton Citation1976; Carlson et al. Citation1986; Rea and Gaillot Citation2004), however, they are site specific. The majority of sediments sampled in northern Zealandia are calcareous oozes and chalks, so we use the formula for density rebound per cent (%) calculated for carbonate sediments (Hamilton Citation1976).(1) where R is the percent increase in density and z is depth in km bsf.
However, rebound corrections for seismic velocities based on pore volumes produce inadequate fits between downhole logged sonic velocities and laboratory measurements on cores (Urmos and Wilkens Citation1993). Urmos and Wilkens (Citation1993) used comparisons between well logs and laboratory measurements of Ontong Java carbonates to determine an empirical relationship for the misfit between the two data types. Converting drill core values to their in situ equivalents, the calculated velocity correction with depth is given by Urmos and Wilkens (Citation1993):(2) where n = 0.66 and z = depth in km.
Applying this correction to velocities measured on cores from northern Zealandia () produces two-way times (TWTs) at lithologic changes in DSDP 207 that are correlated with reflections in the coincident multichannel data (e.g. Eocene–Oligocene unconformity, and seismic basement; ). However, further adjustment to the coefficient (n) is required to match lithology changes in the drill cores to reflections in the seismic data for DSDP 206 (n = 0.86, matching the regional unconformity), 208 and 592 (n = 1.03, matching the regional unconformity, and two chalk horizons, respectively) ( and ). Because there are no in situ measurements in northern Zealandia for comparison, the exponential term is not adjusted. Velocities are around 5% faster than would be predicted using the Urmos and Wilkens (Citation1993) formula for rebound correction for DSDP 206, and 8% for DSDP 208 and 592 at the base of the hole. It is noted that northern Zealandian DSDP sites are in c. 1000 m shallower water than the Ontong Java sites and their higher velocities may arise from larger grain sizes or compositional variations (Cook and Egbert Citation1983).
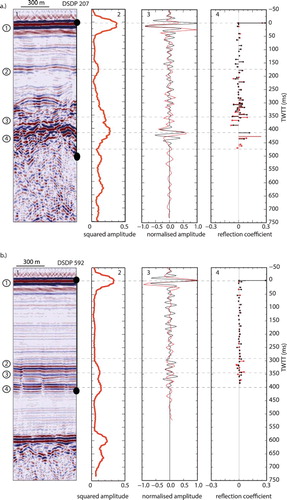
Figure 3. Physical property data from DSDP sites in northern Zealandia. Plot shows raw (▴) and corrected drill core (red and black lines) derived measurements of velocity and density. Velocity and density measurements are plotted as white circles when they are interpolated from adjacent measurements. The third graph shows impedance (ρVp). A, DSDP 208, Lord Howe Rise, north. B, DSDP 206, New Caledonia Trough. Note the similar thickness of the Eocene low-velocity zone (630–680 mbsf). C, DSDP 207, Lord Howe Rise south. Note the good degree of fit between the drill core derived and synthetic data attributed to greater sampling frequency in the core. D, DSDP 592, Lord Howe Rise, south. The low-velocity/density anomaly associated with the regional unconformity is small and likely due to slumped sediments on top of the horizon.
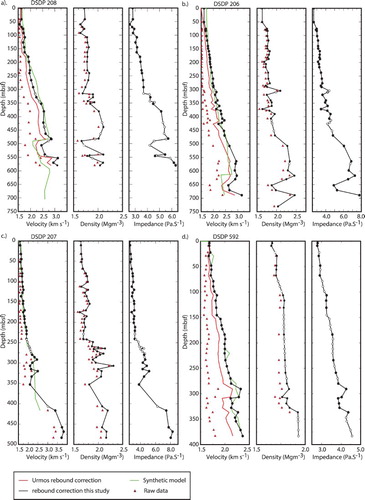
Figure 4. A, Panel 1: section of seismic data from seismic line GA-302-09 at the DSDP 208 site. Circled numbers refer to lithological units in . The seafloor reflection on all seismic data is a strong and positive polarity, and is used to normalise amplitudes for synthetic models and to provide a zero point in TWT for the data in panels 1 to 4. Note the change in reflectivity at c. 220 ms TWT associated with increased lithification and at 300 ms TWT with the occurrence of chalk in the drill core. Note the strong negative polarity reflection at c. 490 ms TWT associated with the Eocene/Oligocene unconformity and the two strong positive reflections at 540 ms TWT (impure chert) and 580 ms TWT (opal-A/CT transition) associated with silicification. Panel 2: smoothed amplitude. The plot shows squared reflection amplitudes with a moving average (40 ms window) filter. The plot highlights general changes in reflection energy with depth. Panel 3: real (red) and synthetic (black) seismic data at the borehole. The synthetic data are a first-order fit to the observed amplitude and phase of the main reflection events at the site. The velocity model used to create the synthetic data is shown in (A) (green line). Panel 4: reflection coefficients calculated from the corrected well velocity and density data (red) and the synthetic model (black). Note the reduction in reflection coefficients in the synthetic data. B, Comparing lithology with seismic characteristics. DSDP 206, New Caledonia Trough. Panel 1: section of seismic data from seismic line TL-01 at the DSDP 206 site. For other plot details see (A). The velocity model used to create the synthetic data in panel 3 is shown in (C) (green line).
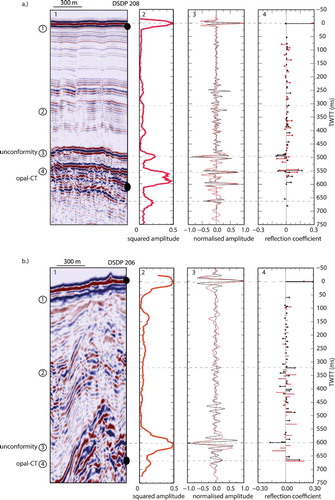
Figure 5. A, Comparing lithology with seismic characteristics. DSDP 207, Lord Howe Rise, south. Section of seismic data from seismic line TAN1409-LHRS_12 at the DSDP 207 site. For other plot details see (A). The velocity model used to create the synthetic data in panel 3 is shown in (C) (green line). B, Comparing lithology with seismic characteristics. DSDP 592, Lord Howe Rise, South. Section of seismic data from seismic line TAN1409-LHRS_01 at the DSDP 592 site. For other plot details see (A). The velocity model used to create the synthetic data in panel 3 is shown in (D) (green line).
Synthetic seismograms
Synthetic seismograms are used to model velocity and density variations, and hence to correlate between lithology in the drill cores and reflections in co-incident seismic data. The amount of energy reflected from a lithologic change at depth depends on the impedance contrast between the two layers. The reflection coefficient (RC) determines the amount of reflected energy and is given by:(3) where impedance, I = Vpρ, ρ is density, and I1 and I2 are impedances of the top and bottom layers, respectively. Synthetic seismograms (Claritas© Synvert) were constructed to reproduce the relative amplitudes and TWTs of prominent reflections on seismic traces extracted at the drill core locations (, and ). Velocity, density and Q (inverse of attenuation) values are used to calculate reflection coefficients and seismic response (Equation 3). The corrected velocity and density variations with depth ( and ) are used as an initial input model. The models are adjusted, preserving relative velocity changes with depth, until the synthetic data replicate TWTs and amplitudes of reflections in the seismic trace data (, green lines). Major reflections or changes in reflectivity are assumed to correlate with observed major changes in lithology in the drill core, i.e. the top chalk, the Eocene–Oligocene unconformity and the opal-A/CT transition.
Reflection coefficients calculated from the drill core physical properties exhibit fluctuations in magnitude that are greater than those calculated from the velocity and density values in the synthetic models (). This is probably due to the incident seismic energy being sensitive to variations in physical properties over a broader depth range (wavelength dependent) (Sheriff and Geldart Citation1995) than the point locations (resolution) and higher-frequency sonic measurements of drill core measured data. Although, the smallest misfits are in DSDP 592 and 207, where the downhole frequency of physical property measurements is greatest, low-velocity zones or large, rapid, changes in density and velocity with depth are the main contributors to data misfits. The discrepancy between the corrected physical data and the synthetic model is greatest in the Eocene silica-rich layer, indicating that the rebound correction is less effective at reproducing in situ properties for this layer.
Figure 6. Empirical solutions for velocity with depth on the North Lord Howe Rise. The blue line is the wide-angle, forward modelling (ray tracing) solution for velocity with depth at the borehole from sonobuoy data (Petkovic Citation2010). This velocity model is from refracted arrivals only and the step increase in VP at 470 mbsf is too shallow due to the hidden layer of Eocene low-velocity sediments. The brown line indicates interval velocities calculated from seismic reflection data on the northern Lord Howe Rise (Petkovic Citation2010). Velocity with depth solutions based on Taranaki Basin sediments (yellow line, see Supplementary data) and Ontong Java carbonates (red line, derived from Urmos and Wilkens, Citation1993) are plotted for comparison. The green line is the best fit synthetic model for DSDP 208 sediments, which best resolves the low velocity layer at c. 500 mbsf.
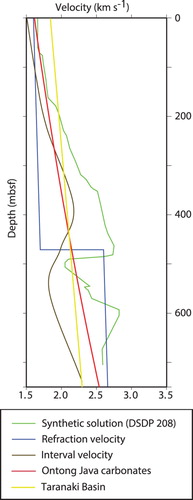
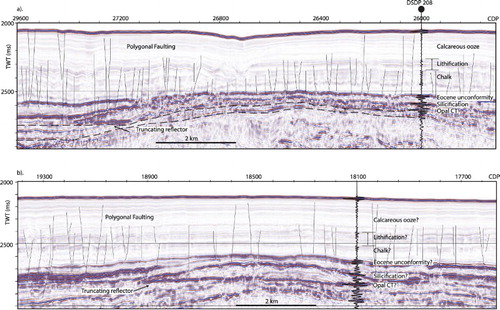
Figure 7. Stacked and migrated multichannel seismic data (GA-302-09, red line, inset.) from the GA-302 seismic survey near DSDP 208 (Petkovic Citation2010a). A, The section of the GA-302-09 seismic line intersects DSDP 208, and the plot shows the borehole location and main lithologies in the core. The black line is the seismic trace extracted at DSDP 208 borehole. The main reflections on the seismic trace are matched to changes in lithology (). Note the flat reflection at CDP 27200 locally truncates stratigraphic horizons and can be traced laterally to the opal-A/CT transition observed in the core at the borehole. The black dashed line is the trace of the reflection back to the borehole. The Eocene unconformity is a reverse polarity reflection. The small faults in the chalk and ooze layers are interpreted as polygonal faulting. B, The section of the GA-302-09 seismic line is c. 100 km south of the DSDP 208 borehole. Figure shows the opal-A/CT transition truncating stratigraphic horizons. The seismic trace extracted at CDP 18100 shows very similar characteristics to the one from the borehole in (A) and lithological interpretations are inferred by linking the seismic signature to known lithology at DSDP 208.
Results
Velocity data and depth solutions for bathyal sediments
In situ sediment velocity data from sources on the Lord Howe Rise, the adjacent Taranaki Basin, and the comparable depositional environment of the Ontong Java Plateau are assessed to formulate a solution for velocity variation with depth for northern Zealandian sediments. Four sources of sediment velocity data are used including wide-angle data from sonobuoys and interval velocities calculated from multichannel seismic stacking velocities from the northern Lord Howe Rise (Petkovic Citation2010), check shot data from the neighbouring Taranaki Basin (see Supplementary data), and rebound corrected downhole measurements of seismic velocities from the Ontong Java Plateau (Urmos and Wilkens Citation1993).
Velocity with depth relationships established from these data sources are plotted against the synthetic velocity model for DSDP 208 for comparison (). Data from the northern Lord Howe Rise sample northern Zealandian carbonates, although the resolution of the velocity models is coarse. Seismic velocity with depth relationships () were obtained from forward modelling (ray tracing) of sonobuoy receiver gathers (Petkovic Citation2010). However, the model does not resolve sharp changes in Vp due to diagenetic alteration. Moreover, the step increase in Vp at 475 m is c. 100 m shallower than that inferred from the lithology change in DSDP 208. This misfit is attributed to the hidden layer problem (Sheriff and Geldart Citation1995), whereby the wide-angle refraction data do not ‘see’ the low Vp zone associated with Eocene siliceous sediments. Similarly, from Lord Howe Rise multichannel data, calculated interval velocities smooth out the velocity variations with depth and the velocity of the Eocene siliceous layer is misrepresented ().
Although boreholes are sparse in northern Zealandia, a high-density data set is available in the neighbouring Taranaki Basin. We use check shot data from 13 Taranaki Basin wells to calculate TWT with depth values ( and ). The solution is provided by fitting a second-order polynomial regression (red line in ) to check shot data points () from which a velocity–depth relationship () is calculated as:(4) where Vp is p-wave speed, t is TWT in seconds and z is depth in mbsf (see Supplementary data).
Figure 8. A, Empirical solutions for seismic velocity with depth. Equations and sources are shown in the lower panel. Solutions are from the literature and based on seismically constrained borehole measurements (Hamilton Citation1979; Carlson et al. Citation1986; Urmos and Wilkens Citation1993; Petkovic Citation2010). The equation for Ontong Java is calculated from the rebound corrected data of Urmos and Wilkens (Citation1993) in this study. A range of velocity gradients is predicted by the studies; however, none produce a good fit to the rebound-corrected data from northern Zealandia (DSDP 206 and 208). Note the step in Vp between opal-A and opal-CT. Coloured shapes are used to group the velocity–depth data points into their main lithology/diagenetic states. The plot on the right shows the velocity with depth relationships extrapolated to 3 km depth.
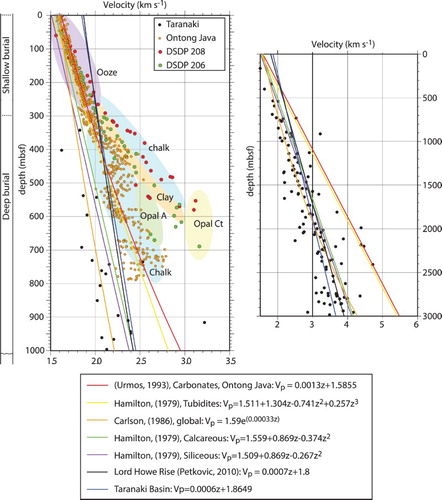
Global solutions for velocity–depth relationships of deep-sea sediments have been published (Johnson et al. Citation1978; Hamilton Citation1979; Carlson et al. Citation1986) (). Carlson et al. (Citation1986) correlated depths and one-way travel times from 154 DSDP sites worldwide (with coincident seismic lines) to establish an empirical expression for velocity versus depth in deep-sea sediments (see for equations). Similarly, Hamilton (Citation1979) used borehole measurements and sonobuoy velocity profiles to estimate velocity with depth for three different sediment groups (carbonates, silicates and turbidites) in a wide range of DSDP boreholes. In addition, we calculate an empirical solution from a high-density data set of Ontong Java carbonate sediments by fitting a regression to the rebound-corrected data of Urmos and Wilkens (Citation1993) ( and ), which is given by:(5) where z is metres below seafloor.
The published equations () and those presented here give similar velocity–depth profiles, except for the top 300 m for the Taranaki and Lord Howe Rise sonobuoy solutions, which lack good velocity constraint due to a scarcity of data in this depth range (see Supplementary data). Velocities determined using the rebound correction of Urmos and Wilkens (Citation1993) for carbonates are broadly applicable to oozes and chalks at other deep-sea sites (Meteor Rise, Exmouth Plateau, Owen Ridge) (Urmos and Wilkens Citation1993) where measurements on drill cores are corrected to in situ downhole log data, and this solution provides the closest fit to the velocity increase with depth measured in northern Zealandian carbonates in DSDP wells ().
Physical properties of carbonate sediments undergoing diagenesis
On the northern Lord Howe Rise (DSDP 208), an increase in lithification in drill core at c. 220 mbsf marks the top of a transition zone ( and ) in which calcareous ooze grades downward into chalk. Although the reflectivity and velocity gradient increase at this depth, density shows little increase (A). At c. 300 mbsf, moderate-amplitude continuous reflections are observed on seismic-reflection data ( and ), and there are step increases in velocity and density (and hence impedance) observed in the drill core (A). The tie with DSDP boreholes (DSDP 208, 592) ( and ) allows this velocity step to be correlated with the diagenetic change from ooze to chalk. Similar depths to the top chalk are found in nearby boreholes on the northern Lord Howe Rise (DSDP 588 and 591) (Kennett et al. Citation1986b, Citation1986c).
Similar increases in Vp, density and lithification are also observed over the same depth range at DSDP 206 in the New Caledonia Trough, but here there are compositional differences: calcareous ooze contains clay, volcanic glass and siliceous fossils. The observed increase in Vp and density at 290 mbsf in DSDP 206 is attributed to lithification and increasing clay content, but chalk is not described within the borehole (base of hole, 734 mbsf), and velocity increases are gradual, rather than stepwise as observed at DSDP 208 (A,B).
On the southern Lord Howe Rise, density and velocity measurements are more variable in chalk at DSDP 207; however, an increase in Vp and a strong reflection () are associated with lithification at the top of the layer. Diagenetic alteration horizons are not contemporaneous with those identified in the north. The depth at which chalk occurs in the drill core is similar to that at DSDP 208 on the northern Lord Howe Rise at c. 300 m; however, the chalk in the south (Paleocene) is significantly older than the chalk in the north (Miocene). Diagenesis is inhibited by greater clay concentration (Burns et al. Citation1973c), but it is likely that the overburden in the south reached the required thickness (pressure) for chalk diagenesis at a similar time to the north.
In DSDP 592, c. 50 km northeast of DSDP 207, the transition from ooze to chalk occurs at c. 280 mbsf but does not correlate with an increase in reflectivity (D). At 305 mbsf, an unconformity separates Early Miocene chalk from Early Oligocene nannofossil ooze and is associated with a negative-polarity reflection at DSDP 592 (). In contrast to the other sites, the negative phase reflection is attributed to a lithology change from chalk to ooze, rather than the presence of siliceous fossils (). Volcanic glass and ash are present in this layer (Kennett et al. Citation1986d). A second chalk unit of Late Eocene age occurs below the calcareous ooze. Sediments of this age are absent elsewhere in northern Zealandia boreholes where there is non-deposition or erosion during the Eocene–Oligocene unconformity. The lower chalk unit correlates with an increase in reflectivity. Siliceous microfossils are present in this layer and the top of the unit is associated with a negative polarity reflection ().
At DSDP 593 on the Challenger Plateau (), the transition from calcareous ooze to chalk () occurs at the greater depth of 550 mbsf. Water depths are similar to the southern Lord Howe Rise sites, but it is c. 400 km south of DSDP 207 and 592. The deeper diagenetic transition to chalk at the site is attributed to a change to cooler water nannofossil taxa (Nelson Citation1986) or to ocean chemistry change, or sediment production rates (Steele et al. Citation2009) during Eocene cooling. The alternating ooze and chalk in Eocene sediments at DSDP 592 may also be due to this change in climate in the late Eocene and Oligocene and temporal changes in diagenetic potential of southern sites in the northern Zealandia is inferred.
Physical properties of siliceous sediments undergoing diagenesis
In most places, the Eocene–Oligocene unconformity produces a negative polarity seismic reflection from the top of a layer of low-velocity, unaltered, silica-rich sediments (). Increases in porosity have been attributed to the net-like structure of siliceous fossils, which decrease Vp and density (Boyce Citation1973). Rebound corrected borehole measurements and interval velocities misrepresent the seismic velocity of this layer. Best estimates of its velocity structure come from synthetic modelling that combines constraints from the TWTs for reflections from the top and bottom of the layer on multichannel data, and depths to lithologic changes observed in boreholes. With these constraints, velocities within this layer are estimated to be 2.0–2.3 km s−1, a decrease of c. 0.4 km s−1 compared with the overburden (A) in DSDP 208 and 206.
The silica diagenetic front may appear as a bottom simulating reflection, cross-cutting stratigraphic horizons (Auzende et al. Citation2000; Pecher Citation2004; Nouze et al. Citation2009; Rollet et al. Citation2012). At DSDP 208, reflections associated with silica diagenesis can be traced laterally to sub-horizontal horizons that cross-cut stratigraphy (). A strong positive reflection is associated with chert in boreholes DSDP 208 and 206 () (Burns et al. Citation1973a, Citation1973b), and marks the top of a zone of interbedded silicified and unaltered sediments. Such banding is commonly observed and attributed to chemical dissolution and precipitation (Riech Citation1981). Opal-CT (cristobalite and tridymite) occurs at 580 mbsf in DSDP 208 and in DSDP 206 at 725 m (). A silica diagenetic front has been inferred at similar depths (c. 500–600 m) in the Fairway Basin from interpretation of stratigraphic relationships and heat flow modelling that rules out gas hydrates as the cause for cross-cutting bottom-simulating reflections (Nouze et al. Citation2009). The strong reflection is observed on a number of seismic lines in the area at c. 600 ms TWT bsf.
Near DSDP 208, a second negative-polarity reflection occurs, variably 50–100 ms below the inferred opal-A/CT boundary (). This reflection also cross-cuts stratigraphy and may be the base of the diagenetic zone, below which, velocities decrease (). A similar set of reflection events is observed in the Sea of Japan, where reflections of positive polarity at the top and negative polarity at the base are used to define the silica diagenesis zone (Lee et al. Citation2003).
The drill core at DSDP 206 has interbedded chert horizons from 680 mbsf and opal-CT occurring at 725 mbsf in the Paleocene. Similar to DSDP 208, a silica digenesis transition zone of around 40 m thickness is inferred. Because of the lower frequency of the seismic data at DSDP 206, it is likely that the strong positive reflection event at 680 ms TWT may be attributed to the entire silicification zone, rather than distinct banding observed as at DSDP 208 ().
Siliceous fossils are present in Eocene sediments in DSDP 207; however, they are less abundant and do not appear to reduce velocities (Burns et al. Citation1973c). Chert bands occur at shallower depths than in the north; between 250 and 300 mbsf in the partly silicified Paleocene–Eocene calcareous ooze. This may contribute to the increase in internal reflectivity and impedance contrasts in these sediments.
Similarly, at DSDP 592, chert nodules are found at c. 330 mbsf in late Eocene sediments, where siliceous fossils remain in trace amounts. The chert layer is c. 15 m thick and is associated with an increase in reflection amplitude. The low-velocity, siliceous fossil layer is not as prominent at this site, but the top of the layer can be traced from the site as a negative-polarity reflection on multichannel data (). The layer contains a low percentage of siliceous fossils, and there is a velocity drop across the boundary of only c. 0.1 km s−1 (similar to DSDP 207), compared with c. 0.4 km s−1 in the north (DSDP 208 and 206, ).
Discussion
Physical property variations in bathyal sediments undergoing diagenesis
Shallow diagenesis complicates velocity with depth estimates in carbonates due to rapid changes in Vp associated with cementation (Anselmetti and Eberli Citation1993). A step increase in Vp is observed in DSDP 208 at the top of chalk on the Lord Howe Rise (). Likewise, there is a rapid transition and a Vp increase of c. 0.5 km s−1 between unaltered and cherty silica-rich sediments (). Low-velocity zones associated with siliceous fossil-rich sediments and the rapid changes in physical properties attributed to diagenetic alteration are poorly fitted with simple empirical solutions for velocity increase with depth ().
Studies of deep-sea sediments have produced empirical solutions to describe velocity with depth relationships (Hamilton Citation1979; Carlson et al. Citation1986). These solutions are mostly based on borehole measurements of Vp and constrained by seismic reflection data. We calculate a solution for velocity with depth for rebound-corrected Ontong Java carbonates; however, the boreholes used are in c. 1 km deeper water than those on the Lord Howe Rise. Northern Zealandian velocities are systematically faster. The Ontong Java solution provides the best fit, but requires some modification to fit northern Zealandian sediments (), indicating that slight changes in the depositional environment may have a significant impact on velocity with depth profiles for carbonates.
This study highlights the risks involved in assuming an empirical solution for velocity increase with depth in bathyal sediments where diagenetic alterations occur, and site-specific variables affect velocities. Velocity measurements from cores in the northern Zealandia indicate rapid Vp variations with depth in calcareous and siliceous sediments due to diagenetic alteration occurring over tens of metres. We suggest that improvements to estimates of physical properties of bathyal sediments and velocity with depth relationships may be possible if diagenetic alteration can be characterised seismically.
Diagenesis of northern Zealandian sediments
Depositional lithology plays a major role in the diagenetic potential of a carbonate (Anselmetti and Eberli Citation1993). This is evident in the lateral differences in diagenetic alteration between contemporaneous carbonates at similar depths below seafloor in the northern Zealandia. In DSDP wells () on the Lord Howe Rise, the transition from ooze to chalk occurs at around 300 mbsf in Paleocene to Miocene sediments, indicating that the diagenetic potential of carbonates may be similar across the Lord Howe Rise regardless of water depth or age of sediment. The ooze-to-chalk transition is found in northern Zealandia at 250–315 mbsf, and mechanical compaction (overburden thickness) is inferred to be the key control on diagenesis of carbonates. However, on the Challenger Plateau in the southeast, the depth to the ooze–chalk transition is substantially deeper at c. 550 mbsf. This site is c. 400 km south of the DSDP 207 and 592 sites. Although volcanic ash and glass are present (Kennett et al. Citation1986a, Citation1986d), a change in the carbonate fossil assemblage in DSDP 593 and 592 in the late Eocene has been inferred to lower the diagenetic potential of the sediment (Nelson Citation1986).
Reversals in diagenetic potential have also been attributed to changes in grain size, dissolution before burial and sedimentation rates (Steele et al. Citation2009) all factors that are related to the original oceanographic conditions during deposition. Sediments of this age are not sampled elsewhere in the northern Zealandia DSDP boreholes, due to the Eocene–Oligocene unconformity that developed during a period of erosion or non-deposition that coincides with major changes in ocean circulation during the opening of the Tasman Gateway (Kennett et al. Citation1975). Sediments at these southern sites reveal ocean conditions that occurred during the opening of the Tasman Gateway in the late Eocene and early Oligocene. A major reorganisation of ocean currents is inferred from changes in foraminifera assemblages at this time and linked to the establishment of cold water circum-Antarctic currents (Kennett et al. Citation1975).
Seismic velocities between 300 and 500 mbsf on the Lord Howe Rise are on average 0.3 km s−1 higher than those at equivalent depths in the New Caledonia Trough (A,B), due to the diagenetic alteration of ooze to chalk. At DSDP 206 in the New Caledonia Trough, chalk is not observed, even at c. 700 mbsf near the base of the hole. The decrease in diagenetic potential in the New Caledonia Trough is attributed to the presence of clay, which inhibits fluid flow and hence cementation (Burns et al. Citation1973c; Cook and Egbert Citation1983). The clay may be from erosion of thrust nappes that loaded New Caledonia from the east () in the Eocene, from New Zealand, from erosion of ridges that were transiently uplifted in the Eocene–Oligocene, or from volcanism (Collot et al. Citation2008; Sutherland et al. Citation2010, Citation2017; Baur et al. Citation2014; Mortimer et al. Citation2014). The largest variations in diagenetic potential observed between carbonate oozes in northern Zealandia are attributed to the depositional environment of the ooze, with clay contamination and cold water nannofossil taxa both inferred to lower diagenetic potential. The age of sediment undergoing diagenesis seems irrelevant, with calcareous oozes ranging in age from Paleocene to Holocene. Variations in ocean conditions at the time of deposition (e.g. temperature) and compositional variations are paramount and should be considered for explaining diagenetic potential variations in carbonates on Zealandia’s submarine plateaux.
Relationships between faults, differential compaction, and the depth below seafloor that diagenetic alterations occur can be used to elucidate the history of diagenesis in northern Zealandia. Pervasive small-scale faults are observed in chalk on the Lord Howe Rise (), and are interpreted as polygonal faulting (). This style of faulting is common in northern Zealandian multichannel seismic lines and elsewhere in Zealandia (Morley et al. Citation2017) were sediments are inferred to be post Paleocene carbonates. The Eocene–Oligocene unconformity and the overlying Oligocene chalks have undulating relief (A) that indicates dewatering of the Paleocene–Eocene siliceous layer was active after the unconformity formed. The highest density of polygonal faults occurs within the Oligocene–Miocene chalk layer (). This deformation probably arose from compaction and fluid expulsion during diagenetic alteration. The faults form fluid escape paths and accommodate sediment volume decrease during lithification (Jones et al. Citation1984; Cartwright Citation2011). Estimates of the timing of onset of diagenesis in northern Zealandia are derived from layer thicknesses tied to dated sediments in DSDP boreholes, and are middle Miocene in the north, and Late Miocene to Early Pliocene at DSDP 592 in the south.
Diagenetic alteration of Paleocene–Eocene siliceous-rich sediments in northern Zealandia is incomplete in most places. Low-velocity unaltered sediments above a diagenetic front produce a distinct pattern of reflectivity that can be observed across the region in multichannel data. The transition from opal-A to opal-CT is a time and temperature dependent process that can occur, at typical temperatures of 25 °C to 55 °C, within c. 10 Ma of deposition (Hesse and Schacht Citation2011), although temperature ranges vary considerably in the literature from 2 °C to 56 °C (Hein et al. Citation1978; Keller and Isaacs Citation1985; Nobes et al. Citation1992; Bohrmann et al. Citation1994; Behl Citation1999). Heat-flow measurements in the Fairway Basin indicate geothermal gradients of 46–77 °C km−1 (Nouze et al. Citation2009), with an average value of 55 °C km−1. On the northern Lord Howe Rise at DSDP 587 (), a similar geothermal gradient of 55 °C km−1 was calculated (Kennett et al. Citation1983). If this gradient is representative, the depth to the opal-A/opal-CT transition in northern Zealandia is between 450 and 1000 mbsf (25–55 °C). The current c. 600–700 mbsf to opal-CT observed at DSDP 206 and 208 boreholes and the bottom-simulating nature of the transition observed on multichannel data is in keeping with the transition being an active process. However, it is noted that the silica diagenesis is offset by faults in places, is disrupted by Oligocene volcanism on the northern Lord Howe Rise and may be linked to fluid flow driven by igneous activity (Rollet et al. Citation2012). The front also cross-cuts Eocene stratigraphy (Rollet et al. Citation2012), so a late Paleogene age is likely.
Low deposition rates in the early Cenozoic, combined with erosion or a lack of deposition manifested in two regional unconformities, may have delayed diagenesis of siliceous and calcareous oozes in northern Zealandia. Although other processes are in effect, this delay is linked to the thickness of overburden being insufficient for temperature reactions (silica) and mechanical compaction (chalk). Despite unaltered siliceous and calcareous sediments that date from the Paleocene ongoing sedimentation means that diagenesis may be an active process in northern Zealandia.
Conclusions
Diagenetic alteration of bathyal sediments in the top few hundred metres below the seafloor has a significant effect on physical properties. Rapid increases in seismic velocity occur at diagenetic fronts associated with transformation of calcareous ooze to chalk and at the opal-A/opal-CT transition in siliceous-rich sediments. The distinctive geophysical characteristics of diagenesis provide a useful basis for correlation of seismic stratigraphic units with lithostratigraphic and chronostratigraphic units.
Chalk and silica diagenesis is sensitive to the composition of the sediments, so diagenesis enhances seismic reflectivity of certain layers. Chalk formation below c. 300 mbsf is characteristic of Oligocene–Miocene strata, and creates moderate-amplitude continuous reflections. However, chalk diagenesis is not uniformly observed across northern Zealandia. Variability in diagenetic potential and the depth to chalk are attributed to changes in depositional lithology.
Silica diagenesis is characteristic of Paleocene–Eocene strata and creates many high-amplitude seismic reflections of high or moderate continuity beneath c. 500–600 mbsf, and may create a high-amplitude positive-polarity bottom-simulating reflection event at the top of this zone. The top of Eocene strata is, in many places, marked by a reverse-polarity continuous reflection, because Oligocene or Miocene chalk above it has higher impedance than the siliceous ooze beneath.
In a region with very sparse borehole control, this diagenetic framework for interpretation of seismic reflection data provides a valuable tool for mapping Cenozoic sequences and hence inferring the tectonic and climate history of the region. Extrapolating borehole scale observations across networks of multichannel seismic data enables mapping at regional tectonic scales. Understanding the distribution of diagenesis and the conditions required for alteration may further reveal clues to the thermal evolution and depositional history of the region.
A1. Supplementary data
Download MS Word (26 KB)Supplementary data
Download EPS Image (952.6 KB)Acknowledgements
This research used borehole data provided by the Deep Sea Drilling Program (DSDP). The GA-302 multichannel seismic and velocity data were provided by Geoscience Australia. The TL-01 seismic line was acquired by the New Zealand and Australian governments for UNCLOS. Seismic data from the TAN1409 voyage was acquired onboard the RV Tangaroa, with the support of the public research funding from the Government of New Zealand to GNS Science and the OS2020 programme. The voyage was also supported by funds from the Government of New Caledonia to the Geological Survey of New Caledonia. We would like to sincerely thank the two reviewers and the editor for their efforts and whose suggestions have greatly improved the clarity of this paper.
Disclosure statement
No potential conflict of interest was reported by the authors.
Related Research Data
References
- Anselmetti FS, Eberli GP. 1993. Controls on sonic velocity in carbonates. Pure and Applied Geophysics. 141(2-4): 287–323. doi: 10.1007/BF00998333
- Auzende J-M, Van de Beuque S, Dickens G, Francois C, Lafoy Y, Voutay O, Exon N. 2000. Deep sea diapirs and bottom simulating reflectors in Fairway Basin (SW Pacific). Marine Geophysical Researches. 21:579–587. doi: 10.1023/A:1004848715044
- Bache F, Mortimer N, Sutherland R, Collot J, Rouillard P, Stagpoole V, Nicol A. 2014. Seismic stratigraphic record of transition from Mesozoic subduction to continental breakup in the Zealandia sector of eastern Gondwana. Gondwana Research. 26(3-4):1060–1078. doi: 10.1016/j.gr.2013.08.012
- Bache F, Sutherland R, Stagpoole V, Herzer RH, Collot J, Rouillard P. 2012. Stratigraphy of the southern norfolk ridge and the reinga basin: a record of initiation of Tonga–kermadec–northland subduction in the southwest pacific. Earth and Planetary Science Letters. 321-322:41–53. doi: 10.1016/j.epsl.2011.12.041
- Baur J, Sutherland R, Stern T. 2014. Anomalous passive subsidence of deep-water sedimentary basins: a prearc basin example, southern New Caledonia Trough and Taranaki Basin, New Zealand. Basin Research. 26(2):242–268. doi: 10.1111/bre.12030
- Behl RJ. 1999. Since Bramlette (1946): The Miocene Monterey formation of California revisited. Geological society of America special paper 338. In: Moores EM, Sloan D, Stout DL, editors. Classic cordilleran concepts: a view from California. Boulder, Colorado: Geological Society of America. p. 301–313.
- Bohrmann G, Abelmann A, Gersonde R, Hubberten H, Kuhn G. 1994. Pure siliceous ooze, a diagenetic environment for early Chert formation. Geology. 22(3):207–210. doi: 10.1130/0091-7613(1994)022<0207:PSOADE>2.3.CO;2
- Boyce RE. 1973. Physical Properties Summary. Initial Reports of the Deep Sea Drilling Project 15.
- Bradshaw JD. 1989. Cretaceous geotectonic patterns in the New Zealand region. Tectonics. 8:803–820. doi: 10.1029/TC008i004p00803
- Burns RE, Andrews JE, van der Lingen GJ, Churkin MJ, Galehouse JS, Packham G, Davies TA, Kennett JP, Dumitrica P, Edwards AR, others. 1973a. Site 206: Initial Reports of the Deep Sea Drilling Project 21. 103–195 p.
- Burns RE, Andrews JE, van der Lingen GJ, Churkin MJ, Galehouse JS, Packham G, Davies TA, Kennett JP, Dumitrica P, Edwards AR, others. 1973b. Site 208: Initial Reports of the Deep Sea Drilling Project 21. 271–281 p.
- Burns RE, Andrews JE, van der Lingen GJ, Churkin MJ, Galehouse JS, Packham G, Davies TA, Kennett JP, Dumitrica P, Edwards AR, others. 1973c. Site 207: Initial Reports of the Deep Sea Drilling Project 21. 197–214 p.
- Carlson RL, Gangi AF, Snow KR. 1986. Empirical reflection travel time versus depth and velocity versus depth functions for the deep-sea sediment column. Journal of Geophysical Research. 91(B8):8249–8266. doi: 10.1029/JB091iB08p08249
- Cartwright J. 2011. Diagenetically induced shear failure of fine-grained sediments and the development of polygonal fault systems. Marine and Petroleum Geology. 28:1593–1610. doi: 10.1016/j.marpetgeo.2011.06.004
- Collot J, Geli L, Lafoy Y, Vially R, Cluzel D, Klingelhoefer F, Nouze H. 2008. Tectonic history of northern New Caledonia basin from deep offshore seismic reflection: relation to late Eocene obduction in New Caledonia, southwest pacific. Tectonics. 27:TC6006. doi: 10.1029/2008TC002263
- Cook HE, Egbert RM. 1983. Diagenesis of deep-sea carbonates. In: Larsen GC, ed. Developments in sedimentology: diagenesis in sediments and sedimentary rocks, 2. Amsterdam-Oxford-New York: Elsevier scientific publishing.
- Dutkiewicz A, Müller RD, O’Callaghan S, Jónasson H. 2015. Census of seafloor sediments in the world’s ocean. Geology. 43(9):795–798. doi: 10.1130/G36883.1
- Erickson SN, Jarrard RD. 1998. Velocity-porosity relationships for water-saturated siliciclastic sediments. Journal of Geophysical Research: Solid Earth. 103(B12):30385–30406. doi: 10.1029/98JB02128
- Gaina C, Mueller DR, Royer J-Y, Stock J, Hardebeck JL, Symonds P. 1998. The tectonic history of the tasman Sea: a puzzle with 13 pieces. Journal of Geophysical Research: Solid Earth. 103:12413–12433. doi: 10.1029/98JB00386
- Hamilton EL. 1976. Variations of density and porosity with depth in deep-sea sediments. Journal of Sedimentary Petrology. 46(2):280–300.
- Hamilton EL. 1979. Sound velocity gradients in marine sediments. The Journal of the Acoustical Society of Amercia. 65:909–922. doi: 10.1121/1.382594
- Hein JR, Scholl DW, Barron JA, Jones MG, Miller J. 1978. Diagenesis of late Cenozoic diatomaceous deposits and formation of the bottom simulating reflector in the southern Bering Sea. Sedimentology. 25:155–181. doi: 10.1111/j.1365-3091.1978.tb00307.x
- Hesse R, Schacht U, editors. 2011. Early Diagenesis of Deep-Sea Sediments. 557–713 p.
- Higgins K, Hashimoto T, Rollet N, Colwell J, Hackney R, Milligan P, editors. 2015. Structural analysis of extended Australian crust: Capel and Faust basin, Lord Howe Rise. London: Geological Society, London, Special Publications, Geological Society, 9–33 p.
- Johnson TC, Hamilton EL, Bachman RT, Berger WH. 1978. Sound velocities in calcareous oozes and chalks from Sonobuoy data: Ontong Java plateau, western equatorial pacific. Journal of Geophysical Research. 83(B1):283–288. doi: 10.1029/JB083iB01p00283
- Jones ME, Bedford J, Clayton C. 1984. On natural deformation mechanisms in the chalk. Journal of the Geological Society of London. 141:675–683. doi: 10.1144/gsjgs.141.4.0675
- Keller MA, Isaacs CM. 1985. An evaluation of temperature scales for silica diagenesis in diatomaceous sequences including a new approach based on the Miocene Monterey Formation, California. Geo-Marine Letters. 5(1):31–35. doi: 10.1007/BF02629794
- Kennett JP, Von der Borch CC, Shipboard Scientific Party. 1983. Site 587: Lansdowne Bank, Southwest Pacific. Initial Reports of the Deep Sea Drilling Project. 90:116–138.
- Kennett JP, Houtz RE, Andrews PB, Edwards AR, Gostin VA, Hajos M, Hampton M, Jenkins DG, Margolis SV, Ovenshine AT, others. editors. 1975. Cenozoic paleoceanography in the Southwest Pacific Ocean, Antarctic glaciation, and the development of the Circum-Antarctic Current. College Station, TX, United States: Texas A & M University, Ocean Drilling Program, DSDP Deep Sea Drilling Project.
- Kennett JP, von der Borch CC, Baker PA, Barton CE, Boersma A, Caulet JP, Dudley WCJ, Gardner JV, Jenkins DG, Lohman WH, others. 1986a. Site 593: Challenger Plateau: Initial Reports of the Deep Sea Drilling Project 90.
- Kennett JP, von der Borch CC, Baker PA, Barton CE, Boersma A, Caulet JP, Dudley WCJ, Gardner JV, Jenkins DG, Lohman WH, others. 1986b. Site 588; Lord Howe Rise; 26 degrees S: Initial Reports of the Deep Sea Drilling Project 90. College Station, TX, USA: Texas A & M University, Ocean Drilling Program.
- Kennett JP, von der Borch CC, Baker PA, Barton CE, Boersma A, Caulet JP, Dudley WCJ, Gardner JV, Jenkins DG, Lohman WH, others. 1986c. Site 591; Lord Howe Rise; 31 degrees S: Initial Reports of the Deep Sea Drilling Project 90. College Station, TX, United States: Texas A & M University, Ocean Drilling Program.
- Kennett JP, von der Borch CC, Baker PA, Barton CE, Boersma A, Caulet JP, Dudley WCJ, Gardner JV, Jenkins DG, Lohman WH, others. 1986d. Site 592; Lord Howe Rise; 36 degrees S: Initial Reports of the Deep Sea Drilling Project 90. College Station, TX, United States: Texas A & M University, Ocean Drilling Program.
- Klingelhoefer F, Lafoy Y, Collot J, Cosquer E, Geli L, Nouze H, Vially R. 2007. Crustal structure of the basin and ridge system west of New Caledonia (southwest Pacific) from wide-angle and reflection seismic data. Journal of Geophysical Research. 112(B11102):1–18.
- Lee GH, Kim H-J, Jou H-T, Cho H-M. 2003. Opal-A/CT phase boundary inferred from bottom simulating reflectors in the southern South Korea Plateau, East Sea (Sea of Japan). Geophysical Research Letters. 30(24):1–4.
- Morley CK, Maczak A, Rungprom T, Ghosh J, Cartwright JA, Bertoni C, Panpichityota N. 2017. New style of honeycomb structures revealed on 3D seismic data indicate widespread diagenesis offshore Great South Basin, New Zealand. Marine and Petroleum Geology. 86:140–154. doi: 10.1016/j.marpetgeo.2017.05.035
- Mortimer N. 2004. Basement gabbro from the Lord Howe Rise. New Zealand Journal of Geology and Geophysics. 47(3):501–507. doi: 10.1080/00288306.2004.9515072
- Mortimer N, Campbell H, Tulloch AJ, King PR, Stagpoole V, Wood RA, Rattenbury MS, Sutherland R, Collot J, Seton M. 2017. Zealandia: Earth’s hidden continent. GSA Today. 27(3):27–35. doi: 10.1130/GSATG321A.1
- Mortimer N, Gans PB, Palin M, Herzer RH, Pelletier B, Monzier M. 2014. Eocene and Oligocene basins and ridges of the coral Sea-New Caledonia region: tectonic link between Melanesia, Fiji, and Zealandia. Tectonics. 33:1386–1407. doi: 10.1002/2014TC003598
- Nelson CS 1986. Lithology of deep sea drilling project leg 90 drill sites in the southwest pacific: an overview. Initial reports of the Deep Sea Drilling Project DSDP 90. College Station, TX, United States: Texas A & M University, Ocean Drilling Program.
- Nobes DC, Murray RW, Kuramoto S, Pisciotto KA, Holler P. 1992. Impact of silica diagenesis on physical property variations. Proceedings of ODP, Scientific Results. 127/128 Pt 1(College Station, Tx.). p. 3–31.
- Nouze H, Cosquer E, Collot J, Foucher J-P, Klingelhoefer F, Lafoy Y, Geli L. 2009. Geophysical characterization of bottom simulating reflectors in the Fairway Basin (off New Caledonia, Southwest Pacific), based on high resolution seismic profiles and heat flow data. Marine Geology. 266:80–90. doi: 10.1016/j.margeo.2009.07.014
- Pecher IA. 2004. Waveform inversion applied to a bottom simulating reflection on the eastern Lord Howe Rise. Wellington, New Zealand: Institute of Geological and Nuclear Sciences science report 2004/27.
- Petkovic P. 2010. Seismic velocity models of the sediment and upper crust of the Capel and Faust Basins, Lord Howe Rise. In: Canberra GA, editor. Record 2010/03 [CD-ROM]. Canberra: Geoscience Australia. p. 1–69
- Rea BR, Gaillot P, editor. 2004. Correction of core physical properties and composite depths for Sites 1215–1222 using core-log correlation–derived rebound coefficients. 1-21 p.
- Riech V. 1981. Siliceous sediments from the Nauru basin, diagenetic alteration of biogenic opal and authigenesis of silica and silicates. Initial Reports of the Deep Sea Drilling Project. 61:523–531 p.
- Rollet N, McGiveron S, Hashimoto T, Hackney R, Petkovic P, Higgins K, Grosjean E, Logan GA. 2012. Seafloor features and fluid migration in the Capel and Faust basins, offshore eastern Australia. Marine and Petroleum Geology. 35:269–291. doi: 10.1016/j.marpetgeo.2012.03.011
- Schubert G, Sandwell D. 1989. Crustal volumes of the continents and of oceanic and continental submarine plateaus. Earth and Planetary Science Letters. 92:234–246. doi: 10.1016/0012-821X(89)90049-6
- Shackleton NJ, Kennett JP, editor. 1975. Paleotemperature history of the Cenozoic and the initiation of antarctic glaciation; oxygen and carbon isotope analyses in DSDP sites 277, 279, and 281. College Station: Texas A & M University, Ocean Drilling Program.
- Sheriff RE, Geldart LP 1995. Exploration seismology. 2nd ed. New York: Cambridge University Press. 592 p.
- Steele JH, Thorpe SA, Turekian KK, editor. 2009. Elements of Physical Oceanography: A Derivative of the Encyclopedia of Ocean Science.
- Storvoll V, Bjørlykke K, Mondol NH. 2005. Velocity-depth trends in Mesozoic and Cenozoic sediments from the Norwegian shelf. AAPG Bulletin. 89(3):359–381. doi: 10.1306/10150404033
- Sutherland R, Collot J, Bache F, Henrys S, Barker D, Browne GH, Lawrence MJF, Morgans HEG, Hollis CJ, Clowes C, others. 2017. Widespread compression associated with Eocene Tonga-Kermadec subduction initiation. Geology. 45(4):355–358. doi: 10.1130/G38617.1
- Sutherland R, Collot J, Lafoy Y, Logan GA, Hackney R, Stagpoole V, Uruski C, Hashimoto T, Higgins K, Herzer RH, others. 2010. Lithosphere delamination with foundering of lower crust and mantle caused permanent subsidence of New Caledonia trough and transient uplift of Lord Howe rise during Eocene and Oligocene initiation of Tonga-kermadec subduction, western pacific. Tectonics. 29:TC2004. doi: 10.1029/2009TC002476
- Tulloch AJ, Kimbrough DL, Wood RA. 1991. Carboniferous granite basement dredged from a site on the southwest margin of the challenger plateau, Tasman Sea. New Zealand Journal of Geology and Geophysics. 34:121–126. doi: 10.1080/00288306.1991.9514449
- Urmos J, Wilkens RH. 1993. In situ velocities in pelagic carbonates: New insights from ocean drilling program Leg 130, Ontong Java Plateau. J Geophys Res. 98:7903–7920. doi: 10.1029/93JB00013
- Uruski C. 2010. New Zealand’s deepwater frontier. Marine and Petroleum Geology. 27:2005–2026. doi: 10.1016/j.marpetgeo.2010.05.010