
ABSTRACT
We conducted an integrated magneto-biostratigraphic study of a 37 m-thick composite section exposed at two sites near Nouméa (New Caledonia). The section contains a transition from pelagic micrite to terrigenous-rich calciturbidites. This transition, observed regionally in coeval records of New Caledonia, marks a shift from pelagic sedimentation on a stable continental submarine plateau to turbidite deposition indicating development of a slope in a convergent tectonic regime. The studied section spans magnetic polarity Chrons C22r to C20r, calcareous nannofossil zones CNE5 to CNE10, and radiolarian zones RP9 to RP11 (49.5 to c. 44 Ma), and the micrite–turbidite transition occurred around 45.3 Ma (early middle Eocene). This transition could be the onshore correlative of a regional switch from tectonic extension to compression, which has been inferred from analysis of new seismic profiles acquired for the Tasman–northern Zealandia area, and that has been interpreted as precursor of the Tonga–Kermadec subduction initiation.
Introduction
The southwest Pacific area (A) has a complex tectonic history, the timing and dynamics of which remain incompletely resolved (Matthews et al., Citation2015). At present, a series of north–south trending ridges and basins are bordered to the east by the Tonga–Kermadec arc, beneath which the Pacific Plate subducts westward, and to the north by the Vanuatu–Solomon subduction zone, with an opposite vergence. The westernmost and largest basin, the Tasman Sea, opened between the Late Cretaceous and the early Eocene (c. 85–53 Ma; Gaina et al., Citation1998) and separates the continent of Australia from northern Zealandia, which comprises a large area of continental crust, including Lord Howe Rise, Norfolk Ridge, part of New Zealand and New Caledonia (Mortimer et al., Citation2017). The early Eocene is also the time in which a shift to a convergent tectonic regime is inferred from the rocks exposed in New Caledonia, the only emerged part of northern Norfolk Ridge (Cluzel et al., Citation2006, Citation2012a; Maurizot, Citation2011; Maurizot and Cluzel, Citation2014). Grande Terre (the main island of New Caledonia) represents an Eocene subduction–obduction complex including high pressure–low temperature (HP–LT) metamorphic units, sedimentary and ophiolitic terranes thrust onto the Norfolk Ridge basement (Cluzel et al., Citation2001, Citation2006; Maurizot, Citation2011). The Eocene convergent tectonic regime is not limited to northern Norfolk Ridge, but appears to be widespread in the Tasman Sea area. This is evident from seismic profiles in which pervasive reverse faulting and folding of both oceanic and continental crust have been observed (Sutherland et al., Citation2010, Citation2017).
Figure 1. Present-day geological setting for New Caledonia and the described sections. A, Bathymetric and tectonic map of the southwest Pacific area, including sites of International Ocean Discovery Program (IODP) Expedition 371 (Sutherland et al., Citation2016) (Zealandia delimited by dashed line). B, Simplified geological and tectonic map of Grande Terre, New Caledonia (modified from Maurizot and Vendé-Leclerc, Citation2009). C, The Nouméa peninsula indicating the study area. D, Geological map of the Denouel and Ilôt Brun sections. The red dots indicate the sampling localities.
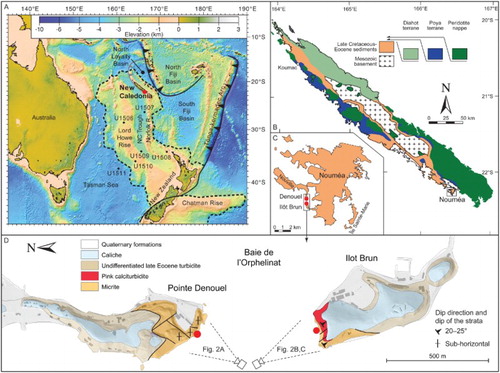
The inception of Eocene convergence is also recorded in sediments exposed on Grande Terre (B; Maurizot, Citation2011, Citation2013; Cluzel et al., Citation2012a; Maurizot and Cluzel, Citation2014). A switch from pelagic sedimentation on a stable submarine plateau to turbidite deposition is inferred as deriving from the development of a foreland basin resulting from subduction initiation on the northern Norfolk Ridge (Maurizot, Citation2011; Maurizot and Cluzel, Citation2014).
Foraminiferal biostratigraphy, based on observations of thin sections, has been used to infer that this lithofacies switch occurred in the early Eocene (c. 50 Ma; Maurizot, Citation2011, Citation2014; Maurizot and Cluzel, Citation2014). However, an integrated biostratigraphic and magnetostratigraphic study to better constrain the timing of the switch from micrite to turbidite deposition has been lacking. Here, we present a detailed stratigraphic study of Eocene sedimentary rocks that crop out near Nouméa (C,D), using a combination of paleomagnetic and microfossil analyses. Using this data, we calibrate the age of the micrite–calciturbidite transition in southern New Caledonia to the geomagnetic polarity timescale (GPTS; Ogg, Citation2012), and explore its relationship to tectonic events in the wider southwest Pacific.
Geological setting
Zealandia represents a vestige of Gondwana that separated from Australia and Antarctica in the Late Cretaceous with the opening of the Tasman Sea (Hayes and Ringis, Citation1973; Gaina et al., Citation1998; Sutherland, Citation1999; Mortimer et al., Citation2017). Grande Terre is the main island of the New Caledonia archipelago, the only emergent portion of northern Norfolk Ridge (A,B). The geology of this island results from tectonic amalgamation of various sedimentary, metamorphic and igneous terranes, ultimately overthrusted by ultramafic rocks (Cluzel et al., Citation2001, Citation2005, 2006, Cluzel et al., Citation2012a; Maurizot, Citation2011). Different proxies constrain the timing of the Eocene convergence inception. Subduction-related dikes that crosscut fore-arc mantle peridotite indicate an age of 54 Ma for subduction initiation (Cluzel et al., Citation2006), and a similar age of c. 56 Ma has been recorded in high-temperature amphibolite lenses locally cropping out at the base of the ‘metamorphic sole’ (Cluzel et al., Citation2012b). The peak metamorphism of eclogite and blueschists facies rocks from the HP–LT complex is dated at 44 Ma (Spandler et al., Citation2005), and its exhumation at 34 Ma (Baldwin et al., Citation2007). Post-obduction granites that intruded both basement and allochthonous ophiolitic units are dated at 24–27 Ma (Paquette and Cluzel, Citation2007).
The Late Cretaceous–middle Eocene sedimentary sequence exposed on Grande Terre consists of a fining-upwards succession of sediments. Basal sediments are Late Cretaceous syn-rift conglomerates and coal-bearing sandstones/siltstones (‘Formation a Charbon’) with interlayered volcanic rocks. These are overlain by post-rift fine-grained terrigenous mudstone of Late Cretaceous age, overlain by black chert of latest Cretaceous age, and micritic limestone of Paleocene–Eocene age. The micritic limestone was deposited at bathyal depths in a terrigenous sediment-starved, fully oceanic setting (Cluzel, Citation1998, Cluzel et al., Citation2012a; Maurizot, Citation2011; Maurizot and Cluzel, Citation2014). This post-rift sequence records progressive deepening due to regional thermal subsidence from the Late Cretaceous to the early Eocene (Aitchison et al., Citation1995).
The micritic limestone on Grande Terre is overlain by predominantly pink-reddish clay-rich calciturbidites, indicating the reappearance of terrigenous supply. This facies varies in thickness from a few metres to tens of metres in the different localities, with significant lateral variations throughout New Caledonia (Maurizot, Citation2011). The sand-sized particles in the calciturbidites are dominated by planktic foraminiferal tests, and the presence of selective sorting, grading, and parallel and oblique microlaminations confirms the turbiditic origin of the sediments (Maurizot, Citation2011). Thus, alternating fine- and coarser-grained beds are inferred to represent turbidites rather than an artefact of diagenesis (Arzani, Citation2006). The terrigenous fraction consists of Al-rich clay minerals like illite (2–4% Al2O3), hematite (2–4% Fe2O3) and silica (10–12% SiO2; Maurizot, Citation2011; Cluzel et al., Citation2012a). The calciturbidite lies at the base of a coarsening upward sequence referred to as ‘Eocene Flysch’ (Gonord, Citation1967, Citation1977).
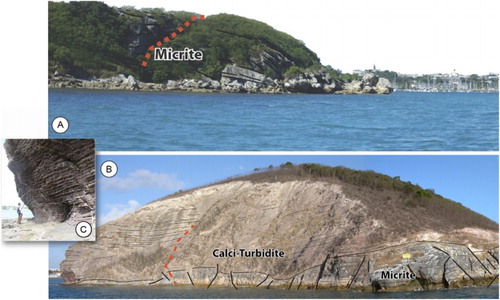
In the Nouméa Peninsula, the micrite–calciturbidite transition is well exposed and easily accessible in a composite section that crops out on both sides of Baie de l’Orphelinat: Point Denouel (hereafter referred as Denouel) and Ilôt Brun (C,D and A). These two sections most likely belong to a single large fragmented olistolith enclosed in the late Eocene Flysch (Maurizot, Citation2011; Cluzel et al., Citation2012a), as inferred by proximity and stratigraphic continuity. The Denouel section consists of 14 m of white micritic limestone, with sub-horizontal faint metre-thick bedding, with chert nodules at the base. The upper 4 m of the white micritic limestone is exposed at the base of Ilôt Brun section (B,C), where it is overlain by c. 4 m of well-bedded limestone with increasing terrigenous content, and 15 m of thin-bedded (c. 10–20 cm) pink to red terrigenous-rich calciturbidites that dip 20–25° to the northeast.
Figure 2. Panorama view of A, Point Denouel and B, Ilôt Brun peninsula. The main stratigraphic features, including the boundary between micrite and calciturbidite, the orientation of strata, minor sub-vertical faulting and the sampling track (red dotted line) are shown in (B). C, Close-up view of the basal well-stratified calciturbidites at Ilôt Brun.
Methods
Rock and paleomagnetism
A total of 65 oriented cores (2.5 cm of diameter) were collected from the 37 m of composite section (Table S1): 27 cores at Denouel and 38 at Ilôt Brun. Samples were taken with a gasoline-powered drill and oriented with a compass and clinometer.
From each core, we trimmed at least one c. 11 cm3 standard specimen for paleomagnetic analyses (two for seven core samples from the Denouel section). To evaluate the nature of the magnetic minerals, a representative set of minicores (c. 0.5 cm3 each; four from Denouel and six from Ilôt Brun) were subjected to stepwise isothermal remanent magnetisation (IRM) acquisition up to 2.4 T. Magnetic coercivity components were determined following the cumulative log-Gaussian analysis procedure described by Kruiver et al. (Citation2001). The maximum unblocking temperature of the coercivity components was then determined by means of stepwise thermal demagnetisation of three orthogonal IRMs (TD-IRMs; Lowrie, Citation1990) up to a maximum of 675 °C, where the IRMs were imparted along the three axes using subsequent fields of 2.4, 0.4 and 0.12 T.
To retrieve the vector components of the natural remanent magnetisation (NRM), specimens obtained from all cores were subjected to stepwise thermal demagnetisation up to a maximum temperature of 650 °C, with initial steps of 50 °C reduced to 25 °C from 400 °C. The NRM was measured after each step with a 2-G Enterprises superconducting magnetometer placed in a magnetically shielded room. Vector components were isolated by visual inspection of vector end-point demagnetisation diagrams (Zijderveld, Citation1967) and estimated using the principal component analysis (PCA) of Kirschvink (Citation1980). Average directions and associated 95% cone of confidence (α95) were estimated using the spherical statistics of Fisher (Citation1953). Analyses have been performed using the freeware compiled by Jones (Citation2002) and Tauxe et al. (Citation2016).
Anisotropy of magnetic susceptibility (AMS) was measured on seven sister specimens from Denouel with an Agico KLY-3 Kappabridge. The AMS is defined by a second rank symmetric tensor geometrically represented by an ellipsoid with principal axes k1 ≥ k2 ≥ k3. We calculated the AMS of each specimen measuring the magnetic susceptibility in 15 different positions, as proposed by Jelínek (Citation1978). The tensor can then be described using the mean susceptibility (km), lineation and foliation (L, F), the shape factor (T), and the corrected anisotropy degree (P′; Jelínek, Citation1981). To calculate the AMS associated with each sample and the average tensor we used the freeware Anisoft 4.2 (Chadima and Jelínek, Citation2008). All analyses were conducted at the Laboratory of Paleomagnetism of the Ludwig Maximilians University (Munich, Germany) except for the AMS measurements, which were carried out the Alpine Laboratory of Paleomagnetism (Peveragno, Italy).
Calcareous nannofossils
Examination of calcareous nannofossil assemblages was undertaken on 65 samples trimmed from the oriented cores (Tables S2 and S3): 27 samples at Denouel and 38 at Ilôt Brun. Smear slides were prepared from rock fragments using standard procedures (Bown and Young, Citation1998). Analyses were conducted using a Zeiss transmitted light microscope at ×1250 magnification. Calcareous nannofossils were determined using taxonomy proposed by Aubry (Citation1984, Citation1988, Citation1989, Citation1990, Citation1999), Perch-Nielsen (Citation1985), Bown (Citation2005), and Agnini et al. (Citation2014). The samples examined have an average spacing of c. 65 cm, and preliminary qualitative estimates of the abundance and preservation state of calcareous nannofossil assemblages were performed for all samples. The total abundance was estimated using parameters proposed by Norris et al. (Citation2014). A qualitative estimate of preservation was provided following Roth and Thierstein (Citation1972) and (Roth, Citation1983).
Calcareous nannofossil biostratigraphic results are based on semi-quantitative counts of selected taxa performed on 2 mm2 for samples from the Ilôt Brun section and 3 mm2 of the same from the Denouel section. All data were then normalised to 1 mm2 (modified after Backman and Shackleton, Citation1983), so results have internal consistency. The biostratigraphic schemes adopted are those of Agnini et al. (Citation2014) and (Martini, Citation1971), which are calibrated to geologic time scale of Gradstein et al. (Citation2012; GTS2012).
Radiolaria
A radiolarian study was undertaken on 51 samples collected adjacent to cores for paleomagnetism (Table S4): 21 from Denouel and 30 from Ilôt Brun. Approximately 10–30 g of rock was crushed into 5 mm chips and leached in dilute (10%) HCl until the reaction ceased. The fine fraction residue was cleaned by gentle heating in a solution of calgon and 10% H2O2 for 30 min. The residue was washed through a 63 µm mesh and dried. Radiolarian occurrence was determined by examination with a stereo-microscope and, of the 51 samples processed, 28 contained no radiolarian microfossils or only indeterminate debris (Table S4).
The sample residues of the 23 samples that contained radiolarians were processed and slides prepared as described in Norris et al. (Citation2014). Between one and three slides were prepared for each sample, depending on the amount of residue. All slides were scanned fully using a Zeiss light microscope and counts of c. 150 radiolarians were undertaken. Radiolarians were determined using literature from low- to high-latitude taxonomic studies (Pascher et al., Citation2015 and reference therein; Table S5). Abundance was recorded as follows: B (barren); R (rare), < 50 specimens on a strewn slide; F (few), 50–100 per slide; C (common), 100–500 on a slide; A (abundant), > 500 on a slide.
Assemblages were correlated to the low-latitude radiolarian zones (RP) of Sanfilippo and Nigrini (Citation1998) as emended by Kamikuri et al. (Citation2012). These were calibrated to GTS2012 by Norris et al. (Citation2014) and some revisions to this calibration are made herein (Table S6). Correlation with the southwest Pacific zonation of Hollis (Hollis, Citation1997; Hollis et al., Citation1997, Citation2005) was also considered. All samples and residues are stored in the National Paleontology Collection, GNS Science, Avalon, Lower Hutt, New Zealand.
Results
Rock magnetic properties
The two lithologic units exhibit marked differences in rock-magnetic behaviour. The pelagic micrite contains a dominant (> 90% of saturation IRM) low coercivity phase with a B1/2 (the field at which half of the saturation is reached) of 45 mT (A). Associated TD-IRMs shows that the intensity of the remanence of this component decays to zero at 575 °C, approximately the maximum unblocking temperature of magnetite (Dunlop and Özdemir, Citation1997). Along with this major component, there exists a minor high coercivity phase (B1/2 > 0.5 T). This is interpreted as goethite, a secondary Fe-oxyhydroxide mineral commonly formed at the expense of primary magnetite in carbonate rocks (Van Der Voo and Torsvik, Citation2012).
Figure 3. Rock and paleomagnetic data from Denouel and Ilôt Brun. A, Isothermal remanent magnetisation (IRM) acquisition diagrams and associated thermal demagnetisation of three orthogonal IRMs (TD-IRMs) of two representative specimens from the micrite and turbidite facies; LAP, linear acquisition plot; GAP, gradient acquisition plot. In the LAP and GAP diagrams open squares are the IRM data, the thin solid and dashed lines are the low and high coercivity components respectively; the sum of them is given by the thick solid line. B–F, Representative vector end-point demagnetisation diagrams (Zijderveld, Citation1967) from the Denouel (nou) and Ilôt Brun (nob) sections. Open and solid symbols are projections onto the vertical and horizontal plane respectively. Demagnetisation steps are in °C. At Denouel strata crop out sub-horizontally and no correction for bedding tilt has been applied. Ilôt Brun diagrams are plotted in tilt corrected coordinates. G–J, Equal area projections of the natural remanent magnetisation components at Denouel and Ilôt Brun; open and solid symbols represent respectively up- and down-pointing directions; squares are mean directions of each mode, while diamonds of all directions plotted on common polarity. Mean directions are associated with the α95 cone of confidence (Fisher, Citation1953). Grey circles (H) are interpolating planes on which the most probably directions (grey dots) are estimated following McFadden and McElhinny (Citation1988). The open star (G) indicates the expected geomagnetic axial dipole (GAD) field, while dashed circle indicates the 45 Ma expected inclination at the sampling site (52.1°).
The pink–red calciturbidites are characterised by contrasting low (B1/2 = c. 40 mT) and high (B1/2 > 0.5 T) coercivity components (A). The IRM intensity of the low coercivity phase decreases to zero at ≥ 600 °C, higher than expected for pure magnetite, likely indicating some degree of oxidation. Both the 0.4 and 2.4 T branches of the TD-IRMs decay abruptly to zero between 625 °C and 675 °C, in agreement with the presence of well-formed hematite grains (Dunlop and Özdemir, Citation1997). The large decrease of IRM observed between c. 350 °C and 450 °C is interpreted as deriving from the inversion of maghemite (γFe2O3) to hematite (αFe2O3). Very similar TD-IRM curves have been obtained from the Paleogene hemipelagic red beds of the Belluno Basin (northeastern Italy; Dallanave et al., Citation2010, Citation2012a, Citation2012b) and from the Plio-Pleistocene marine sediments of the Rio Dell formation (northern California; Kodama, Citation1982). In these two cases, the maghemite–hematite transition has been observed at slightly lower temperatures, approximately between 300 °C and 400 °C. However, the temperature of γFe2O3 to αFe2O3 inversion depends on factors like grain size, degree of oxidation, and incorporation of impurity ions into the lattice (Dunlop and Özdemir, Citation1997). Overall, rock magnetic data indicate magnetite associated with minor goethite in the micritic limestone, and hematite, associated with maghemite, in the pink–red calciturbidite.
Paleomagnetism and magnetostratigraphy
As for rock-magnetic properties, vector end-point diagrams for the micrite and the turbidite samples behave differently. Both are characterised by a magnetic overprint component ‘A’ of the NRM, isolated up to 150–200 °C in micrite samples and up to 250 °C in calciturbidite samples (B–F). The ‘A’ overprint is statistically directed north–northeast-up at both Denouel and Ilôt Brun and it is largely influenced by the recent geomagnetic field (G).
In 14 specimens from the Denouel micrite, the ‘A’ overprint is followed by a mid-temperature ‘B’ component isolated between 200 and 400 °C. For nine specimens, it is possible to interpolate a line through the demagnetisation points (B); in the other five specimens, the points follow a curved path better interpolated by a plane (C,D). We combined planes and linear directions following the protocol of McFadden and McElhinny (Citation1988). The obtained mean ‘B’ direction is pointing southeast-down (H; ). At Ilôt Brun, between 200 °C and 400 °C, the demagnetisation points are not organised in a coherent linear or curved path, but rather are grouped in a restricted space (E), hence the ‘B’ component could not be successfully isolated. From 400 °C to a maximum temperature of 600 °C micrite samples show a characteristic remanent magnetisation (ChRM) linearly decaying to zero (B–E). The maximum unblocking temperature ranging between 575 °C and 600 °C suggests magnetite as carrier of the ChRM, in agreement with the rock-magnetic analyses. The transition from micrite to pink–red calciturbidite is accompanied by an increase in NRM intensity (). In the specimens from the calciturbidites, the ChRM component has been isolated straight after the ‘A’ overprint between 250 °C and 650 °C (F). This temperature range indicates hematite as the carrier of the magnetisation, as expected from the rock-magnetic analyses.
Figure 4. Magnetostratigraphy of the composite Denouel–Ilôt Brun section. Left to right: lithologic log, natural remanent magnetisation (NRM) intensity, declination, inclination and associated virtual geomagnetic pole (VGP) latitude. Black and white bands are normal and reverse polarity intervals respectively.
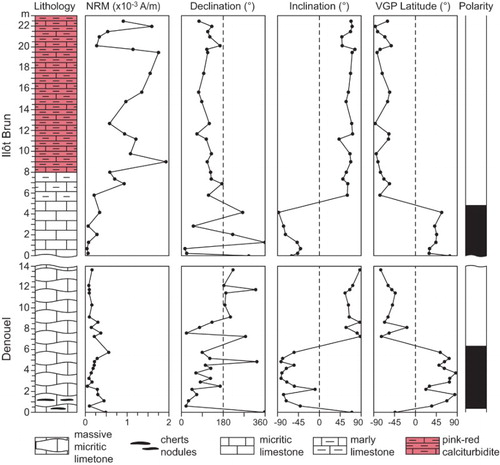
Table 1. Average paleomagnetic directions from Denouel and Ilôt Brun.
The orientation of the ChRM directions at Denouel and Ilôt Brun is different, and they are thus plotted separately. At Denouel directions are organised in two modes steeply pointing northeast-up and southwest-down and departing from antipodality by 15.6° (I, ). Performing the statistical test proposed by Watson (Citation1983), the two distribution modes result statistically antipodal (Vw = 4.3, Vcritical = 6.3; see also Tauxe, Citation2010 for details on the method), passing the reversal test with a class ‘C’ of McFadden and McElhinny (Citation1990). At the Ilôt Brun section the two modes point steeply north-up and southeast-down, departing from antipodality by 23° (J, ). In this case, the Watson’s reversal test fails (Vw = 7.7, Vcritical = 7.4), likely because of the high level of noise of some demagnetisation paths, together with the small number of north-up directions. We minimised the bias between the two modes calculating the average of all ChRM directions plotted on a common north-up pointing polarity.
For each ChRM direction we calculate the virtual geomagnetic pole (VGP). We then used the latitude of each VGP relative to the mean paleomagnetic (north) pole to determine the magnetic polarity stratigraphy (Lowrie and Alvarez, Citation1977). VGPs approaching 90°N and 90°S are interpreted as representing normal and reverse magnetic polarity, respectively. Reversals are located by averaging the position of two adjacent samples with different polarities. At Denouel, above a single reverse polarity sample, a normal polarity interval spans the strata from 0.30 to 6.50 m, whereas the overlying section is of reverse polarity (). At Ilôt Brun a single normal-reverse (upward) transition is recorded at 4.98 m. Paleomagnetic data referred to each sample are listed in Table S1.
Anisotropy of magnetic susceptibility
The shape and orientation of the AMS tensor helps to determine possible strain on sedimentary rocks, which may have affected the ChRM directions (Cogné and Perroud, Citation1985; Lowrie et al., Citation1986; Jackson et al., Citation1993; Parés et al., Citation1999). For compacted but undeformed sedimentary rocks, the AMS tensor is normally oblate (k1 ≈ k2 >> k3), with the k3 axis perpendicular to the bedding plane (Parés, Citation2015). However, the presence of tectonic stress can significantly alter the AMS fabric (Parés et al., Citation1999; Borradaile and Jackson, Citation2004). Ultimately, when deformation is pervasive and cleavage is visible in the field, the AMS tensor will assume an oblate to prolate shape with the k3 axis parallel to the shortening direction (Parés et al., Citation1999). We selected seven specimens from Denouel because pelagic limestones, compared with clay-rich turbidites, are less affected by primary detrital fabric and can thus better record the effect of any strain related to post-depositional processes (Martín-Hernández et al., Citation2004). The AMS anisotropy degree P′ is systematically lower than 1.1 (), typical of not strongly deformed sediments (Cifelli et al., Citation2005). However, the average tensor is clearly prolate in shape, indicating a lineated magnetic fabric, as revealed by the L (=k1/k2) vs. F (=k2/k3) diagram of Flinn (Citation1962) ((A)). The orientation of the AMS tensor of each sample and the mean orientation of the axes (with 95% confidence boundaries) are shown in (B) (see also ). This AMS fabric is in agreement with the presence of pressure solution cleavage, associate with calcite-filled tension cracks, observed in the micritic limestone, and generally with similar pressure solution structures widespread in the Nouméa Peninsula.
Figure 5. Anisotropy of the magnetic susceptibility (AMS) analysis. A, Flinn’s (Citation1962) diagram (lineation vs. foliation) of AMS measure on seven samples from Denouel, indicating the prolate shape of the measured ellipsoids. B, Equal area projection of the principal axes of the AMS tensors; stars are the average directions of the axes, shown together with the confidence ellipses (Jelínek, Citation1978).
Table 2. Anisotropy of magnetic susceptibility (AMS) tensor parameters.
Calcareous nannofossil biostratigraphy
Samples from both sections contain impoverished calcareous nannofossil assemblages of low diversity and abundance. The preservation is generally moderate, which means that specimens exhibit some etching, recrystallisation or both, and primary morphological features are somewhat altered. This could be due to the tectonically induced pressure solution observed in the rock. However, most samples contain some nannofossils that can be identified to species level (). Identification of standard well-known nannofossil biohorizons is complicated by low abundance or an absence of marker species. Nevertheless, some of the data, such as the stratigraphic ranges of index species and the presence of auxiliary taxa, allow a relatively well-defined framework that helps the correlation of the magnetic polarity stratigraphy with the GPTS. We avoid using these data to provide tie points for the age model because they likely represent delayed lowest occurrences or anticipated highest occurrence of taxa. The only exception is the first appearance of Sphenolithus cuniculus, which is used to approximate the base of Zone CNE11 (see discussion below).
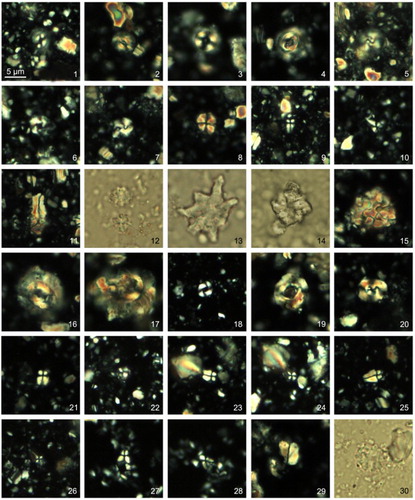
Plate A1. Microphotographs of Eocene calcareous nannofossils from Denouel (1–15) and Ilôt Brun (16–30) sections (New Caledonia). Scale bar, 5 μm. Denouel section: 1, Coccolithus pelagicus (Wallich, 1877) Schiller, 1930. Crossed nicols. Sample nou06. 2, Coccolithus crassus Bramlette & Sullivan, 1961. Crossed nicols. Sample nou06. 3, Ericsonia formosa (Kamptner, 1963) Haq 1971. Crossed nicols. Sample nou06. 4, Toweius magnicrassus (Bukry, 1971) Romein, 1979. Crossed nicols. Sample nou06. 5, Girgisia gammation (Bramlette & Sullivan, 1961) Varol, 1989. Crossed nicols. Sample nou06. 6, Reticulofenestra dictyoda (Deflandre in Deflandre & Fert, 1954) Stradner in Stradner & Edwards, 1968. Crossed nicols. Sample nou06. 7, Dictyococcites hesslandii Haq, 1971. Crossed nicols. Sample nou06. 8, Sphenolithus moriformis (Bronnimann & Stradner, 1960) Bramlette and Wilcoxon, 1967. Crossed nicols. Sample nou06. 9, Sphenolithus radians Delfandre in Grassé, 1952. Crossed nicols 0°. Sample nou06. 10, Sphenolithus radians Delfandre in Grassé, 1952. Crossed nicols 45°. Sample nou06. 11, Zygrhablithus bijugatus (Deflandre in Deflandre & Fert, 1954) Deflandre, 1959. Crossed nicols. Sample nou06. 12, Discoaster kuepperi Stradner, 1959. Parallel light. Sample nou06. 13, Discoaster lodoensis Bramlette & Riedel, 1954. Parallel light. Sample nou06. 14, Nannotetrina cristata (Martini, 1958) Perch-Nielsen, 1971. Parallel light. Sample nou06. 15, Thoracosphaera heimii (Lohmann, 1920) Kamptner, 1944. Crossed nicols. Sample nou06. Ilôt Brun Section: 16, Coccolithus eopelagicus (Bramlette & Riedel, 1954) Bramlette & Sullivan, 1961. Crossed nicols. Sample 208-1262A-15H-3,44. 17, Chiasmolithus gigas (Bramlette & Sullivan 1961) Radomski 1968. Crossed nicols. Sample nob27. 18, Reticulofenestra minuta Roth, 1970. Crossed nicols. Sample nob27. 19, Reticulofenestra hillae Bukry & Percival, 1971. Crossed nicols Sample nob27. 20, Dictyococcites aff. bisectus. Crossed nicols. Sample nob27. 21, Sphenolithus furcatolithoides (morph. A) Locker, 1967. Crossed nicols 0°. Sample nob27. 22, Sphenolithus furcatolithoides (morph. A) Locker, 1967. Crossed nicols 45°. Sample nob27. 23, Sphenolithus furcatolithoides (morph. A) Locker, 1967. Crossed nicols 0°. Sample nob27. 24, Sphenolithus furcatolithoides (morph. A) Locker, 1967. Crossed nicols 45°. Sample nob27. 25, Sphenolithus furcatolithoides (morph. A – Locker, 1967) transitional to Sphenolithus cuniculus (Bown, Citation2005) Crossed nicols 0°. Sample nob31. 26, Sphenolithus furcatolithoides (morph. A – Locker, 1967) transitional to Sphenolithus cuniculus (Bown, Citation2005) Crossed nicols 0°. Sample nob31. 27, Sphenolithus spiniger Bukry, 1971. Crossed nicols. Crossed nicols 0°. Sample nob27. 28, Sphenolithus spiniger Bukry, 1971. Crossed nicols. Crossed nicols 45°. Sample nob27. 29, Zygrhablithus bijugatus (Deflandre in Deflandre & Fert, 1954) Deflandre, 1959. Crossed nicols. Sample nob27. 30, Discoaster barbadiensis Tan, 1927. Parallel light. Sample nob27.
At Denouel, the total abundance of calcareous nannofossils only occasionally exceeds 20 specimens/mm2 (). The absence of Tribrachiatus orthostylus, combined with the absence of Toweius spp., and the presence of Reticulofenestra spp./Dictyococcites spp., Coccolithus crassus (up to 8.63 m) and Discoaster kuepperi indicates that the base of the section is within Zone CNE5 (= Zone NP13). The presence of C. crassus and D. kuepperi through most of the Denouel record, and the presence of a single specimen ascribable to Nannotetrina cristata (which defines the base of Zone CNE8; Agnini et al., Citation2014) at 11.43 m, allows us to correlate the section to undifferentiated Zones CNE5–CNE6–CNE7 (Zone NP13 to NP14) to Zone CNE8 (). Unfortunately, the bases of Zones CNE6 and CNE7 cannot be identified because the key marker species are extremely rare (a single specimen of Discoaster lodoensis) or absent (D. sublodoensis).
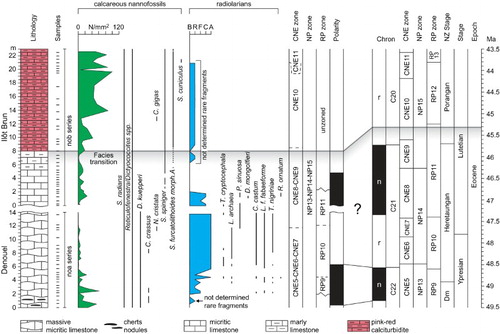
Figure 6. Integrated bio- and magnetostratigraphy of the composite Denouel and Ilôt Brun section. Left to right: lithologic log, calcareous nannofossil abundance and ranges of selected species, radiolarian preservation index and ranges of selected species, biostratigraphic zonation (CNE, Agnini et al., Citation2014; NP, Martini, Citation1971; RP, Sanfilippo and Nigrini, Citation1998), magnetic polarity stratigraphy, and correlation with the geomagnetic polarity time scale (GPTS, Gradstein et al., Citation2012; following Agnini et al., Citation2014; Norris et al., Citation2014) and New Zealand stages (Raine et al. Citation2015). The grey band marks the transition from micrite to calciturbidite.
For the Ilôt Brun section, calcareous nannofossil abundance increases upward, reaching values > 100 specimens/mm2 (). The presence of a single specimen of short-range index species Chiasmolithus gigas at 13.8 m (sample nob27) constrains this overlying interval to Zones CNE10–CNE11 (= Subzone NP15b). A lower datum, the Base Sphenolithus furcatolithoides morphotype A (8.50 m; sample nob21; ) helps to refine the biostratigraphic framework.
This datum occurs less than 20 kyr above the base of Zone CNE10 (Agnini et al., Citation2014), and we therefore use it to approximate the base of Zone CNE10 (= NP15b). A single specimen ascribable to Sphenolithus cuniculus is observed at 20.97 m (sample nob35) almost at the same level where a decrease in abundance (sporadic occurrence) of Sphenolithus furcatolithoides morphotype A is recorded. This isolated occurrence indicates the proximity of the CNE10/CNE11 Zones transition (mid-upper part of Subzone NP15b), where a sporadic occurrence of S. cuniculus, preceding its common occurrence, has been observed in other reference records (see figure 13 in Agnini et al., Citation2014). In summary, the Ilôt Brun section spans from undifferentiated Zones CNE8–CNE9 (upper part of Zone NP14–Subzone NP15a) to CNE11 (Subzone NP15b).
Radiolarian biostratigraphy
Radiolarian preservation is moderate to poor in the samples investigated. Radiolarian tests are recrystallised and often broken or partly dissolved (e.g. pore-frames are barely recognisable). Abundance varies greatly through the composite section but shows an overall antithetical pattern to nannofossil occurrence (). Samples with low nannofossil abundance tend to be rich in radiolarians and vice versa. The radiolarian assemblages are moderately diverse and, although lacking several primary index species, include several species useful for biostratigraphy (). The assemblages are correlated to the Eocene zones established by Riedel and Sanfilippo (Citation1970) and Foreman (Citation1973), codified by Sanfilippo and Nigrini (Citation1998), and emended in part by Riedel and Sanfilippo (Citation1978) and Kamikuri et al. (Citation2012).
Plate A2. Photographic images of selected radiolarian species. All scale bars = 100 µm. 1–4, Bekoma? sp. A (1: nou05; 2: nou15A; 3: SEM image nou15A; 4: SEM image nou24); 5–7, Calocycloma? sp. A (5: nou11; 6: nou15A; 7: SEM image nou24); 8, Calocycloma castum (nou15A); 9, Calocycloma ampulla (SEM image nou24); 10, Lamptonium fabaeforme fabaeforme (SEM image nou24); 11, Lithochytris archaea (SEM image nou24); 12, Lithochytris vespertilio (nob01); 13–14, Podocyrtis acalles (13: nou19; 14: nou21); 15–16, Podocyrtis acalles transitional form to P. sinuosa (15: nou21; 16: SEM image nou24); 17, Podocyrtis aphorma (SEM image nou24); 18, Podocyrtis papalis (SEM image nou24); 19–20, Podocyrtis sinuosa early form (19–20: SEM images nou24); 21, Rhopalocanium ornatum (nou11); 22, Dictyoprora mongolfieri (nob04); 23–26, Theocotyle cryptocephala (23: nou11; 24: nou15A; 25: nou20; 26: SEM image nou26); 27–28, Theocotyle nigriniae (27: nou09; 28: SEM image nou24); 29–30, Theocotylissa ficus (29: nou09; 30: SEM image nou15A); 31, Thyrsocyrtis tensa (SEM image nou24); 32, Thyrsocyrtis hirsuta (SEM image nou24); 33, Periphaena tripyramis triangula (SEM image nou24); 34–35, Pseudostaurolonche khilmiliensis (34: SEM image nou15A; 35: nou15A).
Samples from the lower part of the Denouel section (2.20–4.21 m) contain rare to few radiolarians. However, they can be correlated to Zone RP9 (Phormocyrtis striata striata Zone) based on the presence of secondary marker species Phormocyrtis striata striata (RP9–RP14) and the absence of the primary marker species for Zone RP10, Theocotyle cryptocephala. The primary marker for Zone RP9, Theocorys anaclasta clasta, has not been confidently identified in this study. The presence of species such as Lychnocanium bellum (RP8–RP19), Theocotyle nigriniae (RP8–RP12), Lamptonium fabaeforme fabaeforme (RP7–RP12) and Theocotylissa ficus (RP8–RP16) supports correlation with RP9 (, Table S6).
The upper Denouel section (4.51–13.65 m) contains abundant radiolarians, except for one sample (4.85 m). This interval () is correlated with Zones RP10 (Theocotyle cryptocephala Zone) and RP11 (Dictyoprora mongolfieri Zone). The base of RP10 is tentatively placed at 4.51 m (sample nou11) at the lowest occurrence of T. cryptocephala (Table S4). However, because the marker species is poorly preserved and very rare, it is possible that the base of the RP10 is lower in the section. Other useful markers, such as Lithocyclia ocellus gr. and Theocotyle venezuelensis, have not been identified in this study. The base of RP11 is placed at 12.15 m (sample nou25) directly above the highest occurrence of Lithochytris archaea at 11.75 m (sample nou24). This is a well-defined datum for the top of RP10 in this section, whereas the primary marker for the base of RP11, Dictyoprora mongolfieri, is very rare and with only two specimens recorded higher in the succession. A secondary datum for the base of RP11, the lowest occurrence of Podocyrtis sinuosa, is also recorded at 11.75 m. Other marker species for RP11, such as Podocyrtis dorus, Zealithapium plegmacantha, Lamptonium fabaeforme constrictum and Theocotyle conica, have not been identified in this study.
The lower part of the Ilôt Brun section (0–1.78 m) contains few to common radiolarians and several species that are present in the Denouel section are absent (e.g. Calocycloma castum, Theocotylissa ficus, Theocotyle nigriniae, Lamptonium f. fabaeforme). The presence of T. cryptocephala in sample nob01 (0.0 m) indicates that the base of this section is in the lower part of Zone RP11 because this species has its highest occurrence near the base of the zone. The two overlying samples (nob02 and nob03 at 0.23 m and 0.68 m, respectively) in the lower part of the Ilôt Brun section are correlated to Zone RP11 because the primary marker for the base of Zone RP12 (Thyrsocyrtis triacantha Zone), Eusyringium lagena, is not observed. A possible secondary marker for the base of Zone RP12, R. ornatum, has an isolated, single occurrence at 4.51 m (sample nou11) and is found in two samples of the Ilôt Brun section (nob04 and nob05 at 1.28 m and 1.78 m, respectively; ). However, the base of R. ornatum has been reported as early as lower Zone RP10 (Sanfilippo and Blome, Citation2001) and is not considered a reliable marker. The absence of several other species with lowest occurrences in Zone RP12, such as Thyrsocyrtis triacantha and Podocyrtis phyxis, also supports correlation with Zone RP11. The rest of the Ilôt Brun section (i.e. from c. 2.0 m up section) is barren of radiolarians or contains only unidentifiable fragments ().
Based on our revised calibration of radiolarian data (Table S6; after Norris et al. Citation2014), the following ages can be applied to the radiolarian events and zone boundaries described above: base RP10 (48.6 Ma) and base RP11 (47.41 Ma). Neither the base of RP9 (50.05 Ma) nor the base of RP12 (45.24 Ma) have been identified in the composite Denouel–Ilôt Brun section.
This time interval has relatively few key data in the southwest Pacific radiolarian zonation (Hollis et al. Citation2005) but can be broadly correlated with Zone RP10[SP] (c. 50 to c. 45 Ma), based on the presence of D. mongolfieri and the absence of E. lagena. The highest occurrence of P. aphorma is a secondary datum for the base of this zone (Hollis et al., Citation2005). However, this species occurs sporadically through the lower part of the composite section, with its highest occurrence at the base or the Ilôt Brun section (nob01). Because the underlying samples lack Buryella tetradica, a distinctive species in Zone RP9[SP], we suspect that this occurrence indicates that P. aphorma persisted longer in this lower latitude setting than it did in southern southwest Pacific (Hollis et al. Citation2005).
Discussion
Age of the composite section
The age model is based mainly on magnetostratigraphic tie points. Biostratigraphic data help to correlate the magnetic polarity reversals with the GPTS and to refine the age model, for example in the upper part of the Ilôt Brun section. In some cases, biostratigraphic data are inconsistent with the proposed age model. For radiolarians, this is more likely due to relatively poor calibration of events with the geological time scale rather than representing true range extensions in this section. For nannofossils, isolated occurrence of specimens ascribable to index species below and above their established species range (Agnini et al., Citation2014) represents the sporadic occurrence or the uneven tail of distribution that sometimes occur before or after the base or top datums. Specifically, in the case of N. cristata, the presence of a single specimen in a single sample is considered an unreliable datum.
Calcareous nannofossil biostratigraphy indicates that the sediment deposited at Denouel and Ilôt Brun spans calcareous nannofossil zones CNE5–CNE11 (NP13–NP15) of Agnini et al. (Citation2014), or from the late Ypresian through early Lutetian, with an age range of 49.0–44.2 Ma (GTS2012). This age range is supported by the radiolarian biostratigraphy, which indicates that the composite record up to the basal 2 m of the Ilôt Brun section spans zones RP9–RP11 (50.5–45.3 Ma).
The top of Tribrachiatus orthostylus and the base of Reticulofenestra spp./Dictyococcites spp. are known to occur at the base of Chron C22r and in the upper part of Chron C23n, respectively (Agnini et al., Citation2014; Westerhold et al., Citation2017). Thus, the absence of T. orthostylus and the presence of Reticulofenestra spp./Dictyococcites spp. through the composite section indicates that the basal reverse magnetic polarity interval can be correlated to upper Chron C22r (). Similarly, the presence of Coccolithus crassus and Discoaster kuepperi in the overlying part of the composite section suggests the normal through reversed interval correlates with Chrons C22n and C21r (Agnini et al., Citation2014). The base of Nannotetrina cristata at 11.43 m supports this correlation, as this datum is found to occur in the middle of Chron C21r (Molina et al., Citation2011; Agnini et al., Citation2014). Based on these results, the magnetic polarity sequence at Denouel is inferred to extend from upper Chron C22r to C21r ().
At Ilôt Brun, the presence of Sphenolithus spiniger from 2.34 m and Sphenolithus furcatolithoides morphotype A from 8.50 m are key stratigraphic constraints. These data are known to occur within Chron C21n and at the base of Chron C20r, respectively (Agnini et al., Citation2014). Thus, the normal–reverse sequence in this section is correlated to Chrons C21n–C20r (). This correlation is supported by the presence of Sphenolithus cuniculus, the base of which is commonly reported in the mid-upper part of Chron C20r (Agnini et al., Citation2014), and is identified here near the top of the section. The Ilôt Brun spans from the upper part of Chron C21n to possibly most of Chron C20r.
Origin of the natural remanent magnetisation
Spreading in the Tasman Sea, which separated northern Zealandia from Australia, ended at magnetic anomaly 24 (Hayes and Ringis, Citation1973; Gaina et al., Citation1998), c. 53 Ma (Ogg, Citation2012). Thus, deposition of sediments at Denouel and Ilôt Brun occurred well after Tasman seafloor spreading ceased. This allows us to compare the paleomagnetic inclination of the ‘B’ and ‘ChRM’ components of the NRM from Denouel and Ilôt Brun with the expected paleomagnetic inclination calculated from the 50–10 Ma Australian synthetic apparent polar wander path (Torsvik et al., Citation2012). We use only the inclination because samples come from two blocks that are detached from the basement, and paleomagnetic declination are hence not significant.
Component ‘B’ of the NRM from Denouel has a single mode pointing southeast-down with a mean inclination of 40.4°. The associated 95% cone of confidence envelopes the expected inclinations calculated from the 10, 20 and 30 Ma reference poles (respectively 42.5°, 45.8° and 50.2°; G). In New Caledonia, the last phases of obduction occurred at the end of the Eocene (c. 34 Ma; Cluzel et al., Citation1998; Sevin et al., Citation2012). Tectonic and orogenic events often promote the formation of magnetic overprint (Kirscher et al., Citation2013). Component ‘B’ thus may have acquired during the last phases of the obduction under a reverse (down-pointing) geomagnetic field.
The ChRM directions from Denouel, organised in two modes statistically antipodal, have a mean inclination of 78.6°, which is 26.5° steeper than the expected inclination (53.1°) calculated averaging the 40 Ma and 50 Ma reference poles (I). Primary depositional processes that could have caused such paleomagnetic steepening include slumping (Cronin et al., Citation2001; Schwehr and Tauxe, Citation2003) or deposition of steeply clinostratified strata. Both these options can be excluded because the micritic limestones from Denouel were deposited in pelagic conditions and no evidence of slumping is visible in the field. It is more likely that ChRM directions deviated during a compressional phase related to the obduction. AMS prolate fabric and field observation indicate the presence of strain, derived by plastic deformation of the limestones during tectonic stress. Reorientation of magnetic remanence during plastic deformation is a long-known phenomenon, often described in terms of ‘nonmaterial line’ (Cogné and Perroud, Citation1985; Lowrie et al., Citation1986; Borradaile and Jackson, Citation2004). However, we contend that the polarity reversals are primary and reliable. Laboratory experiments show that primary remanent magnetisation carried by magnetite survives up to greenschist metamorphic facies (Till et al., Citation2010), well above any pressure–temperature conditions experienced by the Nouméa sediments. Furthermore, the directional steepening appears to be pervasive and constant throughout the section, deviating both up- and down-pointing directions of a similar amount, as tested by a positive reversal test.
Sediments from Ilôt Brun are characterised by similar behaviour. Here the mean direction has an inclination of 68.3°, that is 16.2° steeper than the 52.1° expected (J). Here, steepening of the remanent magnetisation is, however, less severe than at Denouel. This is because the ChRM component is carried mainly by detrital hematite. Because of the shape of the grains, detrital hematite tends to acquire a magnetic remanence characterised by (sometimes strong) inclination shallowing of paleomagnetic directions (Tauxe and Kent, Citation1984, Citation2004; Dallanave et al., Citation2009, Citation2012b; Kirscher et al., Citation2014). This primary detrital fabric may have buffered the effect of the subsequent tectonic steepening of paleomagnetic directions. Also at Ilôt Brun, the presence of a reversal and quasi-antipodal ChRM directions gives us confidence in the primary origin of the magnetisation and the reliability of the magnetic polarity correlation. The stratigraphic continuity of the two blocks suggests that they belong to the same original large olistolith (Maurizot, Citation2011). However, the average ChRM declinations from the two sections have an angular difference of c. 120° (I,J; ). This implies that the two blocks disconnected and rotated separately at some stage during inclusion in the late Eocene sediments.
The micrite–turbidite transition
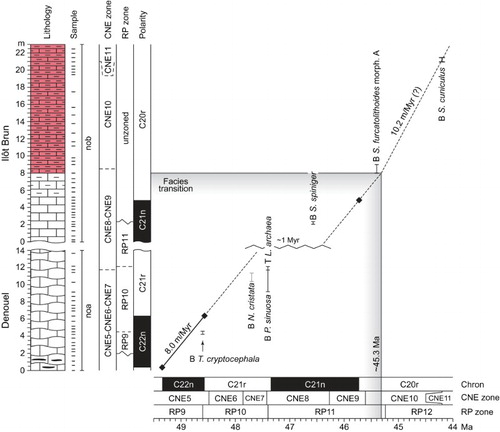
The age of the micrite–turbidite facies transition across Grande Terre is crucial to understanding regional tectonics. An estimate of the compacted sediment accumulation rate (SAR) at Denouel can be made through linear interpolation of Chron C22n with the GPTS (). This results in a SAR of the Denouel sediments of c. 8 m/Myr. By applying this correlation, we observed some mismatch with the biostratigraphic data. In particular, the base of N. cristata appears to be younger in the Denouel section than in the reference records. The first occurrence of this taxon is, however, characterised by diachroneity (see, e.g. Agnini et al., Citation2014 and Molina et al., Citation2011). Using this event as a tie-point we would also expect the presence of the C21r/C21n Chron boundary at the upper part of the Denouel section, which is not the case. We thus consider only the magnetic-polarity based estimation of the SAR. Extending this SAR up to the Ilôt Brun micrite and through the C21n/C20r Chron boundary indicates that the increase of terrigenous input started c. 45.6 Ma, and the micrite–turbidite boundary is dated c. 45.3 Ma. This age model results also in a c. 1 Myr gap (c. 47.5 Ma and 46.5 Ma) between the Denouel and Ilôt Brun records, in agreement with the biostratigraphic data. It is reasonable to assume an increase of the SAR with the inception of the calciturbidite sedimentation. Because there are no magnetic polarity reversals in this part of the Ilôt Brun section, we estimated the SAR using the presence of S. cuniculus, resulting in a value of 10.2 m/Myr (). This biohorizon is, however, defined by a single sample, and the estimate SAR may not be particularly reliable.
Figure 7. Age-depth plot for the Denouel and Ilôt Brun composite section, with indication of the main biostratigraphic events based on multiple observation (black line) or single observation (grey line). B. base; T, top. (⧫) Magnetic polarity reversals tie points. The age model for Denouel has been determined by interpolation of magneto- and biostratigraphic tie points. The same sediment accumulation rate (SAR) has been then extended to Ilôt Brun, forcing the line through the top of Chron C21n. For the calciturbidite, we estimate the SAR using the base of Sphenolithus cuniculus as tie point.
Implications for regional tectonic evolution
The calciturbidites described here are inferred to have formed within an accretionary complex during subduction within the South Loyalty Basin (Maurizot, Citation2011, Citation2013; Cluzel et al., Citation2012a; Maurizot and Cluzel, Citation2014). The shift from pelagic to turbiditic sedimentation requires the formation of a slope sufficient to sustain sediment flow (Meiburg and Kneller, Citation2010). Furthermore, the clay and magnetic mineral assemblage within the calciturbidites indicates that emerged land was a source of part of the terrigenous input, suggesting considerable uplift (i.e. form bathyal depth to sea surface). Illite clays in the terrigenous fraction likely derived from weathering of uplifted sedimentary rocks (Islam et al., Citation2002; Schaetzl and Anderson, Citation2005). In addition to the presence of clay, the mineralogical association maghemite + hematite indicates subaerial weathering. It is part of the ferrihydrite → maghemite → hematite pathway that is normally found in soils forming under tropical or subtropical conditions, characterised by a long dry season (Torrent et al., Citation2006; Schwertmann, Citation2008).
What triggered the uplift? The early and middle Eocene was a time of complex reorganisation in the kinematics of the Pacific Plate circuit. This is revealed by the bend in the Emperor–Hawaii seamount chain between c. 50 and 47–42 Ma (Sharp and Clague, Citation2006; Tarduno et al., Citation2009), which is broadly coeval with the Pacific–Farallon spreading ridge rearrangement (c. 53–47 Ma; Caress et al., Citation1988; Madsen et al., Citation2006), as well as the cessation of Tasman Sea spreading at magnetic anomaly 24 (c. 53 Ma; Gaina et al., Citation1998).
Among the different scenarios outlined for the tectonic evolution of the southwest Pacific (see Matthews et al., Citation2015 for a review), Steinberger et al. (Citation2004) proposed the persistence of a passive margin between the Lord Howe Rise and the Pacific plate until c. 45 Ma, when subduction is envisaged to have started. Plate motion reconstructions using different plate circuits suggest little to no relative motion between the Lord Howe Rise and the Pacific Plate between c. 74 Ma and c. 55 Ma (Matthews et al., Citation2015). However, subduction can occur even in the absence of convergence (Doglioni et al., Citation2006). A clear signature of regional widespread Eocene convergent deformation, reverse faulting and uplift has been detected by seismic reflectors across the Tasman area, and has been labelled the ‘Tectonic event of the Cenozoic in the Tasman area’ (TECTA; Sutherland et al., Citation2017). This compressive phase started directly after 53–48 Ma and is followed by a deep (< 1 km) subsidence at c. 37 Ma (Collot et al., Citation2008). It has been interpreted to be the precursor of the subduction initiation of the Pacific Plate beneath the Tonga-Kermadec arc (Sutherland et al., Citation2017).
Geological data from New Caledonia are in good agreement with the timing of the Pacific circuit reorganisation. The radiometric age of 56 Ma for the onset of convergence obtained from pre-obduction dikes in the ophiolites of New Caledonia (Cluzel et al., Citation2006) is coeval with the cessation of Tasman Sea spreading. In this context, the uplift inferred from the Nouméa record may be linked to the inclusion of the Norfolk Ridge in the bulge zone of the east-plunging subduction of the South Loyalty Basin beneath the North Loyalty Basin crust (Maurizot, Citation2011; Cluzel et al., Citation2012a). Alternatively, the uplift could be a consequence of widespread convergence related to the TECTA event. However, results from a single section do not allow ruling out other processes causing uplift and the steepening of submarine slopes needed for the generation of calciturbidites (e.g. normal faulting, dynamic topography). Further integrated stratigraphic studies to determine the timing of a similar switch in sedimentary regime in northern New Caledonia will help establish if the shift to turbiditic sedimentation is due to a southward migration of the east-plunging Loyalty subduction or to the synchronous regional large-scale uplift associated with the TECTA event.
Possible influence of Eocene climate changes
The onset of calciturbidite deposition at c. 45.3 Ma lies within a long-term phase of climatic cooling that begins with the termination of the early Eocene climatic optimum (EECO) at 48–49 Ma and concludes with ice-sheet expansion in the earliest Oligocene at c. 34 Ma (Zachos et al., Citation2008). There is some evidence for a significant cooling step in the early middle Eocene associated with a 20–40 m fall in sea level (Pekar et al., Citation2005). However, a glacioeustatic event of this magnitude is unlikely to have been the sole cause for a switch from pelagic to turbiditic sedimentation in a bathyal setting.
Conclusions
We identified a series of five magnetic polarity zones in the composite Denouel and Ilôt Brun section. Calcareous nannofossil and radiolarian biostratigraphies indicate that the section spans, respectively, Zones CNE5–CNE10 (Agnini et al., Citation2014) and RP9–RP11 (Sanfilippo and Nigrini, Citation1998). These biostratigraphic results allow us to correlate the magnetic polarity zones with Chrons C22r to C20r and infer an age range of 49.5 to c. 44.2 Ma for the composite section. This is the first time that a magneto-biochronology has been successfully applied in an onshore Cenozoic section in New Caledonia.
A shift from pelagic micritic limestone to calciturbidites, which contain continental weathering products, suggests uplift, emergence and development of a slope of sufficient gradient to allow the development of turbidity currents. This transition occurred 45.3 Ma and is inferred to correspond with the inception of compressive deformation in New Caledonia, which is consistent with other evidence for convergence causing the stacking of Nappes onto the Norfolk Ridge between 54 Ma and 34 Ma.
Our analysis is limited to a single section and may not be representative of the entire northern Zealandia. Integrated stratigraphic study of other records from New Caledonia will help to test tectonic models for the region (Sutherland et al., Citation2010, Citation2017, Maurizot, Citation2011; Cluzel et al., Citation2012a).
Because much of this region is under the sea, ocean drilling is needed to gauge the full extent and timing of Eocene compressive deformation revealed by the seismic profiles acquired in the Tasman area. This is a primary aim of IODP Expedition 371 (27 July to 26 September 2017, A; Sutherland et al., Citation2016).
Table S1
Download MS Excel (14.9 KB)Table S2. Counts on calcareous nannofossil assemblages of the Denouel section performed on 3 mm2. The total number of specimens is normalized to 1 mm2.
Download MS Excel (12.7 KB)Table S3. Counts on calcareous nannofossil assemblages of the Ilôt Brun section performed on 2 mm2. The total number of specimens is normalized to 1 mm2.
Download MS Excel (17.3 KB)Table S4
Download MS Excel (20.6 KB)Table S5. Radiolarian species list in alphabetic order, including one taxonomic reference and the range of the species (if known).
Download MS Excel (12.7 KB)Table S6. Revised calibration of radiolarian data for Zone RP9 to RP13 (after Norris et al. 2014).
Download MS Excel (16.7 KB)Acknowledgments
We thank Ted Moore, two anonymous reviewers, and Erica Crouch (Editor) for the comments that greatly improved the quality of the manuscript. Edoardo Dallanave and Valerian Bachtadse are supported by Deutsche Forschungsgemeinschaft (DFG) projects BA1210/19-2 and DA1757/1-1. We thank the French Navy for access to the Ilôt Brun section. Fieldwork by Christopher Hollis and Gerald Dickens was supported by the Marsden Fund. Micropaleontological study by Hollis and Kristina Pascher was supported by the GNS Science Global Change through Time Programme and DIMENC. Claudia Agnini is supported by the University of Padova through SID project (prot. BIRD161002).
Disclosure statement
No potential conflict of interest was reported by the authors.
ORCID
Edoardo Dallanave http://orcid.org/0000-0003-4673-1792
Additional information
Funding
Related Research Data
References
- Agnini C, Fornaciari E, Raffi I, Catanzariti R, Pälike H, Backman J, Rio D. 2014. Biozonation and biochronology of Paleogene calcareous nannofossils from low and middle latitudes. Newsletters on Stratigraphy 47:131–181. doi: 10.1127/0078-0421/2014/0042
- Aitchison JC, Clarke GL, Meffre S, Cluzel D. 1995. Eocene arc-continent collision in New Caledonia and implications for regional southwest pacific tectonic evolution. Geology 23(2):161–164. doi: 10.1130/0091-7613(1995)023<0161:EACCIN>2.3.CO;2
- Arzani N. 2006. Primary versus diagenetic bedding in the limestone-marl/shale alternations of the epeiric seas, an example from the lower Lias (early Jurassic) of SW Britain. Carbonates and Evaporites. 21:94–109. doi: 10.1007/BF03175469
- Aubry, M-P. 1984. Handbook of Cenozoic Calcareous Nannoplankton. Ortholithae (Discoaster). New York, USA: American Museum of Natural History Micropaleontology Press.
- Aubry, M-P. 1988. Handbook of Cenozoic calcareous nannoplankton. Ortholithae (Catinasters, Ceratoliths, Rhabdolits). New York, USA: American Museum of Natural History Micropaleontology Press.
- Aubry, M-P. 1989. Handbook of Cenozoic Calcareous Nannoplankton. Ortholithae (Pentaliths and Other), Heliolithae (Fasciculiths, Sphenoliths and Others). New York, USA: American Museum of Natural History Micropaleontology Press.
- Aubry, M-P. 1990. Handbook of Cenozoic Calcareous Nannoplankton. Heliolithae (Helicoliths, Cribriliths, Lopadoliths and others). New York, USA: American Museum of Natural History Micropaleontology Press.
- Aubry, M-P. 1999. Handbook of Cenozoic calcareous nannoplankton. Heliolithae (Zygoliths and Rhabdoliths), Micropaleontology. New York, USA: American Museum of Natural History Micropaleontology Press.
- Backman J, Shackleton NJ. 1983. Quantitative biochronology of Pliocene and early Pleistocene calcareous nannofossils form the Atlantic, Indian and Pacific Ocean. Marine Micropaleontology 8:141–170. doi: 10.1016/0377-8398(83)90009-9
- Baldwin SL, Rawling T, Fitzgerald PG. 2007. Thermochronology of the New Caledonian high pressure terrane-implications for the middle tertiary plate boundary process in the SW pacific. Geol. Soc. Am. Spec. Pap. 419:117–134.
- Borradaile GJ, Jackson M. 2004. Anisotropy of magnetic susceptibility (AMS): magnetic petrofabrics of deformed rocks. Geological Society, London, Special Publications 238:299–360. doi: 10.1144/GSL.SP.2004.238.01.18
- Bown PR. 2005. Palaeogene calcareous nannofossils from the Kilwa and Lindi areas of coastal Tanzania (Tanzania drilling project sites 1 to 10, 2003-4). J. Nannoplankt. Res. 27:21–95.
- Bown, PR., Young, JR. 1998. Techniques. In: Bown PR, editor. Calcareous Nannofossil Biostratigraphy. British Micropaleontological Society Publications Series. New York, USA: Springer Sciences + Business Media, LLC; p. 16–21.
- Caress DW, Menard HW, Hey RN. 1988. Eocene reorganization of the pacific-Farallon spreading center north of the Mendocino fracture zone. Journal of Geophysical Research 93:2813–2838. doi: 10.1029/JB093iB04p02813
- Chadima M, Jelínek V. 2008. Anisoft 4.2.–Anisotropy data browser. Contrib. to Geophys. Geod. Paleo, Rock Environ. Magn. Castle Meet. 11, Bojnice.
- Cifelli F, Mattei M, Chadima M, Hirt AM, Hansen A. 2005. The origin of tectonic lineation in extensional basins: combined neutron texture and magnetic analyses on “undeformed” clays. Earth and Planetary Science Letters 235:62–78. doi: 10.1016/j.epsl.2005.02.042
- Cluzel D. 1998. Le “flysch post-obduction” de Népoui, un bassin transporté? Conséquences sur l’âge et les modalités de l’obduction tertiaire en Nouvelle-Calédonie (Pacific sud-ouest). C.R. Acad. Sci. Paris. 327:419–424.
- Cluzel D, Aitchison JC, Picard C. 2001. Tectonic accretion and underplating of mafic terranes in the late Eocene intraoceanic fore-arc of New Caledonia (southwest pacific): geodynamic implications. Tectonophysics. 340:23–59. doi: 10.1016/S0040-1951(01)00148-2
- Cluzel D, Bosch D, Paquette J-L, Lemennicier Y, Montjoie P, Ménot R-P. 2005. Late Oligocene post-obduction granitoids of New Caledonia: A case for reactivated subduction and slab break-off. The Island Arc. 14:254–271. doi: 10.1111/j.1440-1738.2005.00470.x
- Cluzel D, Chiron D, Courme MD. 1998. Discordance de l’Eocène supérieur et événements pré-obduction en Nouvelle-Calédonie. Comptes Rendus L’Académie des Sci. 327:485–491.
- Cluzel D, Jourdan F, Meffre S, Maurizot P, Lesimple S. 2012b. The metamorphic sole of New Caledonia ophiolite: 40Ar/ 39Ar, U-Pb, and geochemical evidence for subduction inception at a spreading ridge. Tectonics. 31:1–18. doi: 10.1029/2011TC003085
- Cluzel D, Maurizot P, Collot J, Sevin B. 2012a. An outline of the geology of New Caledonia; from Permian–Mesozoic Southeast Gondwanaland active margin to Cenozoic obduction and supergene evolution. Episodes-Newsmagazine Int. Union Geol. Sci. 35:72–86.
- Cluzel D, Meffre S, Maurizot P, Crawford AJ. 2006. Earliest Eocene (53 Ma) convergence in the southwest pacific: evidence from pre-obduction dikes in the ophiolite of New Caledonia. Terra Nova 18:395–402. doi: 10.1111/j.1365-3121.2006.00704.x
- Cogné JP, Perroud H. 1985. Strain removal applied to paleomagnetic directions in an orogenic belt: the Permian red slates of the Alpes Maritimes, France. Earth and Planetary Science Letters 72:125–140. doi: 10.1016/0012-821X(85)90122-0
- Collot J, Geli L, Lafoy Y, Vially R, Cluzel D, Klingelhoefer F, Nouzé H. 2008. Tectonic history of northern New Caledonian basin from deep offshore seismic reflection: relation to late Eocene obduction in New Caledonian, southwest pacific. Tectonics. 27:1–20. doi: 10.1029/2008TC002263
- Cronin M, Tauxe L, Constable CG, Selkin P, Pick T. 2001. Noise in the quiet zone. Earth and Planetary Science Letters 190:13–30. doi: 10.1016/S0012-821X(01)00354-5
- Dallanave E, Agnini C, Muttoni G, Rio D. 2009. Magneto-biostratigraphy of the cicogna section (Italy): implications for the late Paleocene–early Eocene time scale. Earth and Planetary Science Letters 285:39–51. doi: 10.1016/j.epsl.2009.05.033
- Dallanave E, Agnini C, Muttoni G, Rio D. 2012a. Paleocene magneto-biostratigraphy and climate-controlled rock magnetism from the belluno basin, tethys ocean, Italy. Palaeogeography, Palaeoclimatology, Palaeoecology. 337–338:130–142. doi: 10.1016/j.palaeo.2012.04.007
- Dallanave E, Muttoni G, Agnini C, Tauxe L, Rio D. 2012b. Is there a normal magnetic-polarity event during the Palaeocene-Eocene thermal maximum (∼55 Ma)? insights from the palaeomagnetic record of the Belluno basin (Italy). Geophysical Journal International 191:517–529. doi: 10.1111/j.1365-246X.2012.05627.x
- Dallanave E, Tauxe L, Muttoni G, Rio D. 2010. Silicate weathering machine at work: rock magnetic data from the late Paleocene-early Eocene cicogna section, Italy. Geochemestry Geophysics Geosystems 11(7):1–14.
- Doglioni C, Carminati E, Cuffaro M. 2006. Simple kinematics of subduction zones. International Geology Review 48:479–493. doi: 10.2747/0020-6814.48.6.479
- Dunlop DJ, Özdemir Ö. 1997. Rock magnetism: fundamentals and frontiers. Cambridge, UK: Cambridge University Press.
- Fisher R. 1953. Dispersion on a sphere. Proceedings of the Royal Society A: Mathematical, Physical and Engineering Sciences. A217:295–305. doi: 10.1098/rspa.1953.0064
- Flinn D. 1962. On folding during three-dimensional progressive deformation. Quarterly Journal of the Geological Society 118:385–428. doi: 10.1144/gsjgs.118.1.0385
- Foreman HP. 1973. Radiolaria of Leg 10 with systematics and ranges for the families Amphipyndacidae, Artostrobiidae and Theoperidae. In: Worzel JL, Bryant W, Beall AO, Capo R, Dickinson K, Foreman HP, Laury R, McNeely BW, Smith LA editors. Initial Reports of the Deep Sea Drilling Project, Vol. 10. Washington, DC: U.S. Government Printing Office; p. 407–474.
- Gaina C, Müller RD, Royer J-Y, Stock J, Hardebeck J, Symonds P. 1998. The tectonic history of the Tasman Sea: A puzzle with 13 pieces. Journal of Geophysical Research: Solid Earth 103:12413–12433. doi: 10.1029/98JB00386
- Gonord H. 1967. Note sur les quelques observations nouvelles précisant age er mode de formation du flysch volcanique sur la cote sud-occidentale de la nouvelle-calédonie. Compte Rendu des Séances la Société Géologique Fr. 7:287–289.
- Gonord H. 1977. Recherches sur la géologie de la Nouvelle-Calédoni; sa place dans l’ensemble structural du Pacifique sud-ouest. Université des sciences et techniques de Montpellier.
- Gradstein FM, Ogg JG, Schmitz MD, Ogg GM. 2012. The geologic time scale 2012. Amsterdam, Netherlands: Elsevier.
- Hayes DE, Ringis J. 1973. Seafloor spreading in the tasman Sea. Nature. 243:454–458. doi: 10.1038/243454a0
- Hollis CJ. 1997. Cretaceous-Paleocene Radiolaria from eastern Marlborough, New Zealand. Institute of Geological and Nuclear Sciences Monograph 17:1–152.
- Hollis CJ, Dickens GR, Field BD, Jones CM, Strong CP. 2005. The Paleocene–Eocene transition at Mead Stream, New Zealand: A southern Pacific record of early Cenozoic global change. Palaeogeography Palaeoclimatology Palaeoecology 215:313–343. doi: 10.1016/j.palaeo.2004.09.011
- Hollis CJ, Waghorn DB, Strong CP, Crouch EM. 1997. Integrated Paleogene Biostratigraphy of DSDP Site 277 (Leg 29): Foraminifera, Calcareous Nannofossils, Radiolaria, and Palynomorphs. Institute of Geological and Nuclear Sciences: 1–73.
- Islam MR, Stuart R, Risto A, Vesa P. 2002. Mineralogical changes during intense chemical weathering of sedimentary rocks in Bangladesh. Journal of Asian Earth Sciences 20:889–901. doi: 10.1016/S1367-9120(01)00078-5
- Jackson MJ, Borradaile GJ, Hudleston P, Banerjee SK. 1993. Experimental deformation of synthetic magnetite-bearing calcite sandstones: effects on remanence, bulk magnetic properties, and magnetic anisotropy. Journal of Geophysical Research: Solid Earth 98:383–401. doi: 10.1029/92JB01028
- Jelínek V. 1978. Statistical processing of anisotropy of magnetic susceptibility measured on groups of specimens. Studia Geophysica et Geodaetica 22:50–62. doi: 10.1007/BF01613632
- Jelínek V. 1981. Characterization of the magnetic fabric of rocks. Tectonophysics. 79:T63–T67. doi: 10.1016/0040-1951(81)90110-4
- Jones CH. 2002. User-driven integrated software lives: “Paleomag” paleomagnetics analysis on the Macintosh. Computers & Geosciences 28:1145–1151. doi: 10.1016/S0098-3004(02)00032-8
- Kamikuri S, Moore TC, Ogane K, Suzuki N, Pälike H, Nishi H. 2012. Early Eocene to early Miocene radiolarian biostratigraphy for the low-latitude Pacific Ocean. Stratigraphy 9(1):77–108.
- Kirscher U, Bilardello D, Mikolaichuk A, Bachtadse V. 2014. Correcting for inclination shallowing of early Carboniferous sedimentary rocks from Kyrgyzstan--indication of stable subtropical position of the North Tianshan Zone in the mid-late Palaeozoic. Geophysical Journal International 198:1000–1015. doi: 10.1093/gji/ggu177
- Kirscher U, Zwing A, Alexeiev DV, Echtler HP, Bachtadse V. 2013. Paleomagnetism of Paleozoic sedimentary rocks from the Karatau range, southern Kazakhstan: multiple remagnetization events correlate with phases of deformation. Journal of Geophysical Research: Solid Earth. 118:3871–3885. doi: 10.1002/jgrb.50253
- Kirschvink JL. 1980. The least-square line and plane and the analysis of paleomagnetic data. Geophysical Journal International 62:699–718. doi: 10.1111/j.1365-246X.1980.tb02601.x
- Kodama KP. 1982. Magnetic effects of maghemitization of Plio-Pleistocene marine sediments, northern California. Journal of Geophysical Research: Solid Earth 87:7113–7125. doi: 10.1029/JB087iB08p07113
- Kruiver PP, Dekkers MJ, Heslop D. 2001. Quantification of magnetic coercivity components by the analysis of acquisition curves of isothermal remanent magnetisation. Earth and Planetary Science Letters 189:269–276. doi: 10.1016/S0012-821X(01)00367-3
- Lowrie W. 1990. Identification of ferromagnetic minerals in a rock by coercivity and unblocking temperature properties. Geophysical Research Letters 17:159–162. doi: 10.1029/GL017i002p00159
- Lowrie W, Alvarez W. 1977. Upper Cretaceous–Paleocene magnetic stratigraphy at gubbio, Italy III. Upper Cretaceous magnetic stratigraphy. Geological Society of America Bulletin 88:374–377. doi:10.1130/0016-7606(1977)88<374:UCMSAG>2.0.CO;2
- Lowrie W, Hirt AM, Kligfield R. 1986. Effects of tectonic deformation on the remanent magnetization of rocks. Tectonics. 5:713–722. doi: 10.1029/TC005i005p00713
- Madsen JK, Thorkelson DJ, Friedman RM, Marshall DD. 2006. Cenozoic to recent plate configurations in the pacific basin: ridge subduction and slab window magmatism in western North America. Geosphere. 2:11–34. doi: 10.1130/GES00020.1
- Martín-Hernández F, Luneburg CM, Aubourg C, Jackson M. 2004. Magnetic fabric: methods and applications. London: Geological Society Special Pubblication 238.
- Martini E. 1971. Standard Tertiary and Quaternary calcareous nannoplankton zonation., in: Farinacci, A. (Ed.), Proceedings of the 2nd International Conference Planktonic Microfossils. Edizioni Tecnoscienza, Rome, pp. 739–785.
- Matthews KJ, Williams SE, Whittaker JM, Müller RD, Seton M, Clarke GL. 2015. Geologic and kinematic constraints on late Cretaceous to mid Eocene plate boundaries in the southwest pacific. Earth-Science Reviews 140:72–107. doi: 10.1016/j.earscirev.2014.10.008
- Maurizot P. 2011. First sedimentary record of the pre-obduction convergence in New Caledonia: formation of an early Eocene accretionary complex in the north of Grande Terre and emplacement of the “Montagnes blanches” nappe. Bulletin de la Societe Geologique de France 182:479–491. doi: 10.2113/gssgfbull.182.6.479
- Maurizot P. 2013. Palaeocene age for the Adio limestone, New Caledonia: stratigraphic and regional context. New Zealand Journal of Geology and Geophysics 56:16–26. doi: 10.1080/00288306.2012.735677
- Maurizot P. 2014. Evolution and sedimentation in a forebulge environment: example of the late Eocene Uitoé limestone, New Caledonia, southwest pacific. New Zealand Journal of Geology and Geophysics 57:390–401. doi: 10.1080/00288306.2014.938085
- Maurizot P, Cluzel D. 2014. Pre-obduction records of Eocene foreland basins in central New Caledonia: an appraisal from surface geology and cadart-1 borehole data. New Zealand Journal of Geology and Geophysics 57:300–311. doi: 10.1080/00288306.2014.885065
- Maurizot P, Vendé-Leclerc M. 2009. New Caledonia geological map, scale 1/500 000. Dir. l’Industrie, des Mines l’Energie - Serv. la Géologie Nouv. Boureau Rech. Géologiques Minières.
- McFadden PL, McElhinny MW. 1988. The combined analysis of remagnetization circles and direct observations in palaeomagnetism. Earth and Planetary Science Letters 87:161–172. doi: 10.1016/0012-821X(88)90072-6
- McFadden PL, McElhinny MW. 1990. Classification of the reversal test in palaeomagnetism. Geophysical Journal International 103:725–729. doi: 10.1111/j.1365-246X.1990.tb05683.x
- Meiburg E, Kneller B. 2010. Turbidity currents and their deposits. Annual Review of Fluid Mechanics 42:135–156. doi: 10.1146/annurev-fluid-121108-145618
- Molina E, Alegret L, Apellaniz E, Bernaola G, Caballero F, Dinarès-Turell J, Hardenbol J, Heilmann-Clausen C, Larrasoaña JC, Luterbacher H. et al. 2011. The global stratotype section and point (GSSP) for the base of the Lutetian stage at the Gorrondatxe section, Spain. Episodes 34:86–108.
- Mortimer N, Campbell HJ, Tulloch AJ, King PR, Stagpoole VM, Wood RA, Rattenbury MS, Sutherland R, Collot J, Seton M. 2017. Zealandia: earth’s hidden continent. GSA Today. 27:1–8.
- Norris RD, Wilson PA, Blum P, Fehr A, Agnini C, Bornemann A, Boulila S, Bown PR, Cournede C, Friedrich O, et al. 2014. Methods, in: Norris, R.D., Wilson, P.A., Blum, P., and the Expedition 342 Scientists (Eds.), Proceedings of the Integrated Ocean Drilling Program. College Station, Texas, USA.
- Ogg JG. 2012. The geomagnetic polarity time scale. In: Gradstein F.M., Ogg J.G., Schmitz M.D., Ogg G.M., editor. The geologic time scale 2012. Amsterdam: Elsevier; p. 85–113.
- Paquette J-L, Cluzel D. 2007. U-Pb zircon dating of post-obduction volcanic-arc granitoids and a granulite-facies xenolith from New Caledonia. inference on southwest pacific geodynamic models. International Journal of Earth Sciences 96:613–622. doi: 10.1007/s00531-006-0127-1
- Parés JM. 2015. Sixty years of anisotropy of magnetic susceptibility in deformed sedimentary rocks. Front. Earth Sci. 3:1–13.
- Parés JM, van der Pluijm BA, Dinarès-Turell J. 1999. Evolution of magnetic fabrics during incipient deformation of mudrocks (Pyrenees , northern Spain). Tectonophysics. 307:1–14. doi: 10.1016/S0040-1951(99)00115-8
- Pascher KM, Hollis CJ, Bohaty SM, Cortese G, McKay RM, Seebeck H, Suzuki N, Chiba K. 2015. Expansion and diversification of high-latitude radiolarian assemblages in the late Eocene linked to a cooling event in the southwest pacific. Climate of the Past. 11:1599–1620. doi: 10.5194/cp-11-1599-2015
- Pekar SF, Hucks A, Fuller M, Li S. 2005. Glacioeustatic changes in the early and middle Eocene (51-42 Ma): shallow-water stratigraphy from ODP Leg 189 site 1171 (south tasman rise) and deep-sea δ18O records. Geological Society of America Bulletin 117:1081–1093. doi: 10.1130/B25486.1
- Perch-Nielsen K. 1985. Cenozoic calcareous nannofossils. In: Bolli H.M., Saunders J.B., Perch-Nielsen K., editor. Plankton stratigraphy. Cambridge, UK: Cambridge University Press; p. 427–554.
- Raine JI, Campbell HJ, Crundwell MP, Beu AG, Cooper RA, Hollis CJ, Boyes AF, Crampton JS. 2015. Revised calibration of the New Zealand Geological Timescale: NZGT2015/1. GNS Sciences Report, 2012/39. Lower Hutt, New Zealand.
- Riedel WR, Sanfilippo A. 1970. Radiolaria, Leg 4, Deep Sea Drilling Project. In: Bader RG, Gerard RD, Benson WE, Bolli HM, Hay WW, Thomas Rothwell W, Ruef MH, Riedel WR, Sayles FL editors. Initial Reports of the Deep Sea Drilling Project, Vol. 4. U.S. Washington, DC: Government Printing Office; p. 503–575.
- Riedel WR, Sanfilippo A. 1978. Stratigraphy and evolution of tropical Cenozoic radiolarians. Micropaleontology 24(1):61–96. doi: 10.2307/1485420
- Roth PH. 1983. 25. Jurassic and Lower Cretaceous Calcareous Nannofossils in the Western North Atlantic (Site 534): Biostratigraphy, Preservation, and Some Observations on Biogeography and Paleoceanography. Initial Reports Deep Sea Drill. Proj. 76, 587–621.
- Roth PH, Thierstein HR. 1972. Calcareous nannoplankton: leg 14 of the deep sea drilling project. Initial Reports Deep sea Drill. Proj. XIV:421–485.
- Sanfilippo A, Blome CD. 2001. Biostratigraphic implications of mid-latitude Palaeocene-Eocene radiolarian faunas from Hole 1051A, Ocean Drilling Program Leg 171B, Blake Nose, western North Atlantic. In: Kroon D, Norris RD, Klaus A editors. Western North Atlantic Palaeogene and Cretaceous Palaeoceanography, Special Publications of the Geological Society of London; p. 185–224.
- Sanfilippo A, Nigrini C. 1998. Code numbers for Cenozoic low latitude radiolarian biostratigraphic zones and GPTS conversion tables. Marine Micropaleontology 33:109–156. doi: 10.1016/S0377-8398(97)00030-3
- Schaetzl R, Anderson S. 2005. Soils: genesis and geomorphology, vadose zone journal. Cambridge, UK: Cambridge University Press.
- Schwehr K, Tauxe L. 2003. Characterization of soft-sediment deformation: detection of cryptoslumps using magnetic methods. Geology. 31:203–206. doi:10.1130/0091-7613(2003)031<0203:COSSDD>2.0.CO;2
- Schwertmann U. 2008. Iron oxides. In: Chesworth W., editor. Encyclopedia of soil science. Dordrecht, The Netherland: Springer; p. 363–359.
- Sevin B, Ricordel-Prognon C, Quesnel F, Cluzel D, Lesimple S, Maurizot P. 2012. First palaeomagnetic dating of ferricrete in New Caledonia: new insight on the morphogenesis and palaeoweathering of “Grande Terre”. Terra Nova 24:77–85. doi: 10.1111/j.1365-3121.2011.01041.x
- Sharp WD, Clague DA. 2006. 50-Ma initiation of Hawaiian-emperor bend records major change in pacific plate motion. Science 313:1281–1284. doi: 10.1126/science.1128489
- Spandler C, Rubatto D, Hermann J. 2005. Late Cretaceous-tertiary tectonics of the southwest pacific: insights from U-Pb sensitive, high-resolution ion microprobe (SHRIMP) dating of eclogite facies rocks from New Caledonia. Tectonics. 24:1–16. doi: 10.1029/2004TC001709
- Steinberger B, Sutherland R, O’Connell RJ. 2004. Prediction of emperor-Hawaii semount locations from a revised model of global plate motion and mantle flow. Nature. 430:167–173. doi: 10.1038/nature02660
- Sutherland R. 1999. Basement geology and tectonic development of the greater New Zealand region: An interpretation from regional magnetic data. Tectonophysics. 308:341–362. doi: 10.1016/S0040-1951(99)00108-0
- Sutherland R, Collot J, Bache F, Henrys S, Barker D, Browne GH, Lawrence MJF, Morgans HEG. 2017. Widespread compression associated with Eocene Tonga- kermadec subduction initiation. 355–358: Geology 45.
- Sutherland R, Collot J, Lafoy Y, Logan GA, Hackney R, Stagpoole V, Uruski C, Hashimoto T, Higgins K, Herzer RH, et al. 2010. Lithosphere delamination with foundering of lower crust and mantle caused permanent subsidence of New Caledonia trough and transient uplift of lord Howe rise during Eocene and Oligocene initiation of Tonga-Kermadec subduction, western pacific. Tectonics 29:1–16. doi: 10.1029/2009TC002476
- Sutherland R, Dickens GR, Blum P. 2016. International ocean discovery program expedition 371 scientific prospectus: Tasman frontier subduction initiation and paleogene climate. International Ocean Discovery Program. doi: 10.14379/iodp.sp.371.2016
- Tarduno JA, Bunge H-P, Sleep N, Hansen U. 2009. The bent Hawaiian-emperor hotspot track: inheriting the mantle wind. Science 324:50–53. doi: 10.1126/science.1161256
- Tauxe L. 2010. Essentials of paleomagnetism. Berkeley: University of California Press.
- Tauxe L, Kent DV. 1984. Properties of a detrital remanence carried by haematite from study of modern river deposits and laboratory redeposition experiments. Geophysical Journal International 76:543–561. doi: 10.1111/j.1365-246X.1984.tb01909.x
- Tauxe L, Kent DV. 2004. A simplified statistical model for the geomagnetic field and the detection of shallow bias in paleomagnetic inclinations: Was the ancient magnetic field dipolar? In: Channell JET, Kent DV, Lowrie W, Meert JG (Eds.), Timescales of the Paleomagnetic Field, Geophys. Monogr. Washington, DC: American Geophysical Union; p. 101–115.
- Tauxe L, Shaar R, Jonestrask L, Swanson-Hysell NL, Minnett R, Koppers AAP, Constable CG, Jarboe N, Gaastra K, Fairchild L. 2016. Pmagpy: software package for paleomagnetic data analysis and a bridge to theMagnetics information consortium (MagIC) database. Geochemistry, Geophysics, Geosystems. 17:2450–2463. doi: 10.1002/2016GC006307
- Till JL, Jackson MJ, Moskowitz BM. 2010. Remanence stability and magnetic fabric development in synthetic shear zones deformed at 500??C. Geochemistry, Geophys. Geosystems. 11:1–20.
- Torrent J, Barrón V, Liu Q. 2006. Magnetic enhancement is linked to and precedes hematite formation in aerobic soil. Geophysical Research Letters 33:4–7. doi: 10.1029/2005GL024818
- Torsvik TH, Van der Voo R, Preeden U, Mac Niocaill C, Steinberger B, Doubrovine PV, van Hinsbergen DJJ, Domeier M, Gaina C, Tohver E, et al. 2012. Phanerozoic polar wander, palaeogeography and dynamics. Earth-Science Reviews 114:325–368. doi: 10.1016/j.earscirev.2012.06.007
- Van der Voo R, Torsvik TH, 2012. The history of remagnetization of sedimentary rocks: deceptions, developments and discoveries, in: Elmore, R.D., Muxworthy, A.R., Aldana, M.M., Mena, M. (Eds.), Remagnetization and chemical alteration of sedimentary rocks. Geological Society of London Special Publications, 371. London: The Geological Society of London; p. 23–53.
- Watson G. 1983. Large sample theory of the langevin distribution. Journal of Statistical Planning and Inference. 8:245–256. doi: 10.1016/0378-3758(83)90043-5
- Westerhold T, Röhl U, Frederichs T, Agnini C, Raffi I, Zachos JC, Wilkens RH. 2017. Astronomical calibration of the Ypresian time scale: implications for seafloor spreading rates and the chaotic behaviour of the Solar System? Clim. Past Discuss. 13:1129–1152. doi: 10.5194/cp-13-1129-2017
- Zachos JC, Dickens GR, Zeebe RE. 2008. An early Cenozoic perspective on greenhouse warming and carbon-cycle dynamics. Nature. 451:279–283. doi: 10.1038/nature06588
- Zijderveld JDA. 1967. A.C. demagnetization of rocks: analysis of results. In: Collinson D.W., Creer K.M., Runcorn S.K., editor. Methods in paleomagnetism. New York: Elsevier; p. 254–286.