
ABSTRACT
The Waikaia alluvial gold mine is hosted in a Pleistocene paleochannel that is buried beneath younger sediments beside the Waikaia River. The paleochannel sediments were derived primarily from local basement, with a minor component of recycled Miocene quartz pebble conglomerate. The detrital gold in the paleochannel has a wide range of textures, from angular nugget-like particles, through equant rounded and abraded particles, to highly flattened thin flakes that have commonly been folded. The internal grain structures of these various particles reflect differing degrees of particle deformation during transport, followed by variable amounts of post-depositional recrystallisation and associated leaching of Ag from the gold. The diverse gold textures represent passage through different numbers of sedimentary recycling events and associated deformation since the first particles were eroded from the adjacent Otago Schist source area in the Cretaceous. Minor authigenic gold overgrowths occur on the gold particles, typically with authigenic clay. However, the finest sediment component (<10 µm) of mine-related waters is dominated by quartz and albite rather than clay minerals.
Introduction
The Central Otago placer goldfield evolved on Otago Schist basement during > 100 Ma of uplift, erosion and recycling of sediments and detrital gold (A–C; Williams Citation1974; Craw Citation2010, Citation2013, Citation2017; Craw et al. Citation2015a). This goldfield has produced more than 8 million ounces (> 250 tonnes) of gold, mostly from the Clutha River catchment and paleoplacers on the margins of that catchment (B; Williams Citation1974). Paleodrainage southwards from the Central Otago area carried detrital gold into what is now Eastern Southland in the middle to late Cenozoic until rise of intervening mountain ranges severed that drainage system (D,E; Craw et al. Citation2015a, Citation2017). After that severance, the Eastern Southland placer goldfield developed largely independently of Central Otago drainages, although some gold has continued into Southland via the Mataura River catchment (B,C; Youngson et al. Citation2002; Craw Citation2013).
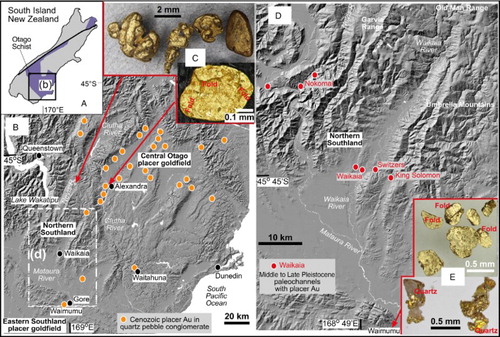
Figure 1. Location maps for the Waikaia placer mine and regional context for alluvial gold. A, The Otago Schist goldfield in the South Island of New Zealand. B, Hillshade topographic image of Central Otago and Eastern Southland goldfields, with locations of principal Cenozoic gold paleoplacers that have formed sources for gold in younger deposits during uplift and recycling. C, Coarse proximal gold nuggets with variable rounding, from the Nevis River catchment (top; Hesson et al. Citation2016), and a gold flake with folded edges from paleo-Clutha River channel (bottom; Stephens et al. Citation2015). D, Hillshade topographic image of the Waikaia River catchment and neighbouring rivers, with locations of principal gold mines in Pleistocene auriferous paleochannels. E, Placer gold from Waimumu Pliocene paleochannels, including flattened and folded flakes (top) and more proximal small nuggets (bottom).
The Waikaia placer gold mine, in the lower Waikaia River is located in Northern Southland, in between the better-known goldfields of Central Otago and Eastern Southland ( and ). This mine was opened in 2014 and has been developed in a Middle to Late Pleistocene paleochannel of the Waikaia River, adjacent to sites of historic gold dredge mining in the active river (A). Opening this mine has provided rare access to the geology and mineralogy of the otherwise-buried paleochannel deposits that host the mine, and this paper reports on these features, based on outcrops and samples obtained while the mine was active. Other Pleistocene paleoplacer gold deposits occur in the same general area ( and A) but these are either highly weathered, inaccessibly buried or both.
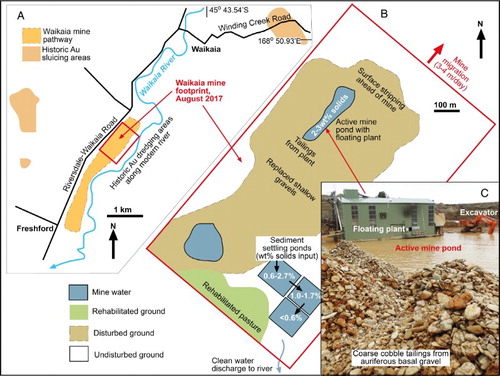
Figure 2. Maps of the Waikaia placer gold mine site. A, General location of the mine in a Middle to Late Pleistocene paleochannel of the Waikaia River in relation to historical placer gold mine sites. B, Sketch map of the migrating footprint of the active mine, drawn from an aerial photograph taken in August 2017. Generalised suspended sediment contents of mine waters are indicated. C, Photograph of the floating plant in active mine pond, being fed auriferous basal gravel (submerged) by excavator. Coarse tailings from plant are in the foreground.
A key feature of placer mines such as the modern Waikaia one is that the mine excavation migrated along the paleochannel and the excavations were refilled and surfaces rehabilitated during the mining operation. Hence, once the mine is closed and the sites rehabilitated, all access to geological and mineralogical information is lost. This paper aims to record these features for geological and historical purposes, and in particular to provide a description of the mineralogical features that are relevant to the economics and environmental effects of placer mining in this geological setting. We describe these features in the order that they are exposed in the mining operation, from gravel excavations, through concentration of heavy minerals and gold from the gravel tailings, to disposal of fine sediments and groundwater. We focus on the internal and external structure and morphology of the detrital gold in the context of regional placer gold in Central Otago to the north and Eastern Southland to the south (C–E).
General setting
The ultimate source of detrital gold in Central Otago is a set of Cretaceous orogenic gold deposits that were emplaced into the Mesozoic Otago Schist belt in the latter stages of metamorphism and early stages of extension-related exhumation (Williams Citation1974; Craw Citation2010; Mortensen et al. Citation2010). Some of these orogenic deposits contained quartz veins with minor free hydrothermal gold particles of sufficient size to be retained in downstream fluvial sediments (Craw et al. Citation2015a). However, most gold was encapsulated in hydrothermal sulphide minerals and gold particle size was increased by supergene processes (Craw et al. Citation2015b; Craw Citation2017). Supergene gold mobilisation occurred during Cretaceous–Cenozoic groundwater alteration in and near the vadose zone during uplift and exhumation (Craw et al. Citation2015b, Citation2017; Hesson et al. Citation2016).
Progressive uplift and recycling of fluvial schist debris since the Cretaceous, combined with groundwater alteration of that debris, resulted in formation of fluvial quartz pebble conglomerates of varying ages in Central Otago and Eastern Southland (B; Macpherson Citation1937; Williams Citation1974; Youngson et al. Citation2006; Craw et al. Citation2016, Citation2017). Groundwater cementation of quartz pebble conglomerates has yielded silcrete horizons that form hard boulders and cobbles when eroded. Numerous historical gold mines were developed in erosional remnants of the quartz pebble conglomerates, which range in age from Eocene to Pleistocene, and some small modern placer mines have also operated at times (Macpherson Citation1937; Williams Citation1974; Youngson et al. Citation2006; Falconer and Craw Citation2009; Craw Citation2013; Craw et al Citation2015a, Citation2016). In addition, erosion of these deposits has shed detrital gold and quartz pebbles into lithic Pleistocene–Holocene river gravels that formed the hosts for a large proportion of the historical placer mining in Otago and Southland (B,D; Macpherson Citation1937; Williams Citation1974; Youngson et al. Citation2006; Craw Citation2010, Citation2013; Craw et al. Citation2016).
The Waikaia River catchment has evolved since Miocene initiation of the mountain ranges that separate Central Otago from Southland (D; Jackson et al. Citation1996). In particular, the Old Man Range (D) has been rising, and is still rising, as an antiformal structure adjacent to a long-lived and active fault zone on its eastern margin (Stephens et al. Citation2015). Detrital gold, including some centimetre-scale nuggets (C), has been shed from orogenic deposits into proximal and distal fluvial sediments of the Waikaia catchment periodically since the Miocene (Craw and Lilly Citation2016; Hesson et al. Citation2016; Craw et al. Citation2017). The differing ages of liberation of gold from basement sources have led to differing degrees of subsequent rounding and flattening of gold in the principal source areas between Otago and Southland (C; Craw et al. Citation2016, Citation2017; Craw and Lilly Citation2016).
Most of the modern Waikaia River catchment is underlain by low-grade schist (lower greenschist facies and pumpellyite–actinolite facies) and greywacke of the Caples Terrane portion of the Otago Schist belt (Turnbull Citation2000; Turnbull and Allibone Citation2003). Consequently, sediments in the modern river consist of lithic debris derived from the adjacent rising ranges that are underlain by these basement rocks, especially more durable greywacke. In addition, Pleistocene glaciation events contributed high-grade schist from Central and northwestern Otago to the Mataura River and the lower reaches of the Waikaia River merged with the Mataura River on the northern edge of the Southland plains as far north as Waikaia (D; Turnbull Citation2000; Turnbull and Allibone Citation2003). Remnants of these Pleistocene fluvial sediments occur as terraces of varying heights above the current river levels, but the terrace deposits have also been disrupted by active faults locally (Turnbull and Allibone Citation2003).
Methods
Detrital gold samples and associated heavy minerals were selected at random from processing concentrates at the Waikaia mine. Some of these gold particles were mounted onto aluminium stubs using double-sided carbon tape and examined using a scanning electron microscope (SEM) at the Otago Centre for Electron Microscopy (University of Otago, New Zealand). Backscatter electron images were obtained at 15 kV without carbon coating.
Subsamples of gold particles were selected at random and shaken on to sticky tape before being embedded in 25 mm epoxy resin discs. The discs were ground to expose sections through the particles, and finely polished with 1 µm diamond paste. These sections were then etched with aqua regia to remove the smeared gold polishing layer and enhance the definition of internal structures (Stewart et al. Citation2017). These internal structures were documented via incident light microscopy and SEM. Electron backscatter diffraction (EBSD) maps of crystallographic orientations of the internal grain structures of etched gold particles (Prior et al. Citation2009) were obtained by SEM using the instrument and settings described by Little et al. (Citation2016) and preparation procedures described by Stewart et al. (Citation2017). Map pixels were digitally coloured according to crystallographic Euler angles using AZTEC software (Oxford Instruments, Abingdon, UK), from which relative grain misorientations were obtained in transects across particles using Channel 5 software (Oxford Instruments).
Groundwater entering the mine through the gravel sequence was sampled at four sites in the active excavation pit in 2014 (Craw et al. Citation2017). The densities and sediment contents of mine discharge waters are monitored routinely at the mine by weighing known volumes of water samples in the settling ponds (B). Sediment-rich water was sampled for this study from four locations in two sediment settling ponds: (1) the inflow pipe from the active mine to the primary settling pond; (2) the primary settling pond water after the coarsest material has settled; (3) the inflow pipe from the primary to a secondary settling pond; and (4) the same secondary settling pond. The sediment was settled from these water samples in glass beakers on a laboratory bench. The water was syringed off the beakers and sent to Hill Laboratories Ltd (Hamilton, New Zealand) for major ion analysis. Samples of the dried sediment from these waters was pressed onto carbon tape on aluminium stubs and carbon-coated for SEM imaging and energy dispersive spectroscopy (EDS) analysis. Mineralogy of the sediments was determined with X-ray diffraction (XRD) at the University of Otago Geology Department. XRD analysis was done using powdered whole sediment, and for the finest fraction additional analysis was done on subsamples derived from drying of cloudy water. The latter subsamples were reanalysed by XRD after 24 h in ethylene glycol atmosphere and after heating at 550 °C for 5 h, to identify clay minerals.
Waikaia placer gold mine
The modern Waikaia gold mine has extracted detrital gold that has accumulated in coarse gravels at the base of a Middle to Late Pleistocene paleochannel of the Waikaia River ( and A; Becker and Batt Citation2016). These auriferous gravels rest unconformably on greywacke basement or thin remnants of mid-Cenozoic marine sediments that in turn rest on greywacke basement (A). The paleochannel gravels are overlain by Late Pleistocene–Holocene fluvial gravels which merge laterally with modern Waikaia River gravels ( and B). The base of the auriferous paleochannel is up to 20 m below present surface (A). The paleochannel gravels are dominated by greywacke clasts in crudely bedded units of varying clast size, typically 1–10 cm (C). However, clasts in the basal gravels are distinctly coarser and range up to 20 cm across (D). Silcrete cobbles and rounded quartz pebbles are minor but distinctive components of the paleochannel gravels (C,D).
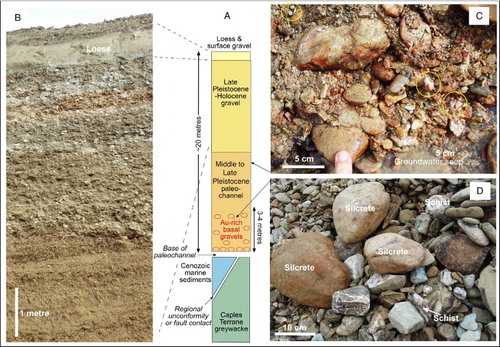
Figure 3. Stratigraphy and lithologies of the Waikaia placer gold mine. A, Generalised stratigraphic section through the auriferous paleochannel and underlying basement. B, Photograph of excavated wall of overburden gravels in the mine. C, Photograph of an upper portion of Middle to Late Pleistocene auriferous paleochannel gravel with iron oxyhydroxide staining (brown) and pale clay-altered greywacke clasts. Seeping groundwater has suspended clay. Yellow circles highlight rounded quartz pebbles recycled from Cenozoic quartz pebble conglomerates (B). D, Coarse cobbles from the basal auriferous paleochannel gravel, in mine tailings (C). Most clasts are greywacke, but rare silcrete and high-grade schist are indicated.
The modern mine has migrated progressively upstream in the paleochannel, and the disturbed land has been rehabilitated behind it (A,B). Details of the resource definition and mining operation have been summarised by Becker and Batt (Citation2016). The richest gold contents (typically 500–4000 mg/m3) are found in the bottom 3–4 m of the paleochannel (A) and this interval has been the principal target of the mine. Gold particles are typically c. 0.5 mm across within this interval but range from 50 µm to 2 mm (Becker and Batt Citation2016).
Heavy mineral suite
In conjunction with detrital gold and rare gold–quartz intergrowths, there are abundant detrital heavy mineral particles that have been concentrated into the placer deposit (). The heavy mineral suite is dominated by hematite, which forms abundant black sand in the mine concentrate (A). Some of the hematite is specular, with readily discernible oriented micaceous flakes (> 50 µm), but most hematite is fine grained (µm scale) and intimately intergrown with fine-grained quartz to form grey composite clasts. Hematite–quartz intergrowths form hard clasts that range up to 10 mm across. The hematite clasts are rounded to subrounded, and many are discoidal in shape.
Figure 4. Detrital heavy minerals from the auriferous basal gravels of the Waikaia paleochannel. A, Hematite (Hem) and subordinate magnetite (Mt) form abundant black sand, with variably rounded and flattened gold particles. Round gold particle to right of centre has intergrown Fe oxyhydroxide (FeOx) and quartz. B, Small angular gold nugget with intergrown quartz, and accompanying hematite, zircon and spessartine garnet (Spess) heavy mineral suite. C, Cinnabar clast (HgS). D, Small angular gold nugget with gold crystal facets exposed, and intergrown clear quartz crystals. E–I, SEM backscatter electron images of gold particles showing the wide range of shape modification from subrounded (E) to folded and highly flattened (H,I).
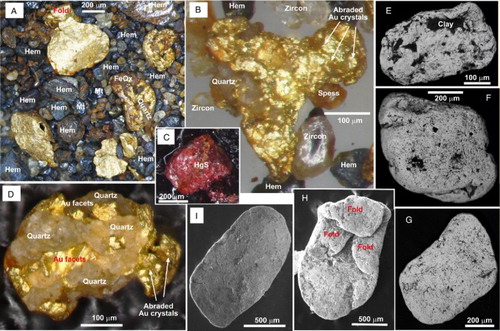
Minor sand-sized rounded magnetite clasts are distributed through the black sand (A), with very rare black Cr-bearing spinel clasts. Brown iron oxyhydroxide is locally intergrown with some of the more angular gold particles (A). Clear euhedral to subrounded zircon particles, typically c. 50 µm across, are abundant within the heavy mineral suite (B) but are greatly subordinate to hematite. Garnets are relatively rare and consist of pale pink spessartine (A) and darker red Mn-poor almandine. Cinnabar clasts (C) are also rare but distinctive.
Authigenic minerals
Most greywacke and schist clasts in the Waikaia auriferous paleochannel gravels have had some degree of in situ clay alteration, either on rims or more rarely throughout the clasts. Alteration has resulted in pale clay-rich outer rims (C), although agitation and water-washing during processing of the gravels removes much of the clay rims from many clasts (D). Fine-grained lithic clasts in matrix sediment have also been variably clay-altered, and groundwater seeps carry finely suspended clays through the gravels (C). The clay minerals are dominated by kaolinite, smectite and interlayered clays. These clay minerals form coatings and infills in cavities of gold particles at the 1–10 µm scales ().
Figure 5. SEM electron backscatter images of authigenic gold overgrowths on gold particles from Waikaia placer mine. A, Clay-filled depression (dark grey) in abraded gold surface has abundant nanoparticulate gold overgrowths (white spots). B, Close view of the boundary between a clay-filled depression (left) and abraded gold surface (right), with nanoparticulate gold intergrown with clay, and crystalline gold overgrowths on the adjacent gold. C, D, Delicate intergrowths of clay and authigenic nanoparticulate gold and micron scale authigenic gold plates.
Fine-grained (µm scale) authigenic pyrite is widespread through the auriferous paleochannel gravels, typically forming partial coatings adhering to the exterior surfaces of clasts including some gold particles. The pyrite oxidises rapidly when the gravels are exposed during mining, and quickly (time scale of days) forms brown coatings of amorphous iron oxyhydroxides on clast surfaces (A). Iron oxyhydroxide staining of clasts is widespread near to the groundwater redox boundary in the paleochannel where ferrous iron-bearing minerals in the gravels, including some authigenic pyrite, have been oxidised (C).
Authigenic gold has formed from groundwater dissolution and redeposition on many Waikaia mine gold particles, similar to that seen on most other Otago and Southland placer gold and elsewhere in southern New Zealand (Falconer and Craw Citation2009; Reith et al. Citation2012; Craw et al. Citation2015a, Citation2016; Hesson et al. Citation2016; Kerr et al. Citation2017). The authigenic gold is most visible as nanoparticles that are intergrown with authigenic clays (A,B). In addition, authigenic gold locally forms overgrowth plates, crystal clusters and lacy intergrowths on the exterior surfaces of gold particles and associated clays (B–D).
Detrital gold textures
Exterior morphology
The most notable feature of the external morphology of Waikaia gold particles is the extreme diversity, from angular nuggety gold to highly flattened flakes (). Some angular nuggets, which are rare, retain their original faceted gold crystalline structures on the exposed surfaces of the particles, especially where these have been protected from abrasion by intergrown quartz (D). Some Au crystalline forms are still recognisable despite minor abrasion of the gold on protruding parts of the particles (B,D). However, with progressive abrasion, the particles have become rounded on their exterior surfaces, with numerous irregular embayments that are typically filled with authigenic clay (E,F).
The above-described nuggety equant particles form only a minor component (< 10%) of the gold, and the rest consists of particles that have been flattened to some degree. These variably flattened flakes are typically c. 0.5–1 mm across and range in thickness from 20 to 500 µm (A,G–I). The thinner flakes have commonly been folded and refolded to varying extents (e.g. H), with flaps of folded flakes as thin as 10 µm in places (A). Some highly flattened flakes are so thin that they have developed holes through their interiors.
Figure 6. Internal structure of a subrounded gold particle from Waikaia placer mine, as exposed in a polished section etched with aqua regia. A, Incident light view of the particle, with contrasting flattened and folded flakes to right. B, Close incident light view of a portion of the particle, showing the textural contrast between core and rim displayed by differential etching. C, EBSD map of the internal grain structure of the particle. D, Close incident light view of a portion of the particle, showing the textural contrast between core and rim displayed by differential etching. White dotted line shows inner boundary of Ag-poor rim. E, EBSD map of the internal grain structure of a portion of the particle, showing contrast between core and rim grain size. Yellow dashed line is inner boundary of fine-grained rim, as also indicated in C and D.
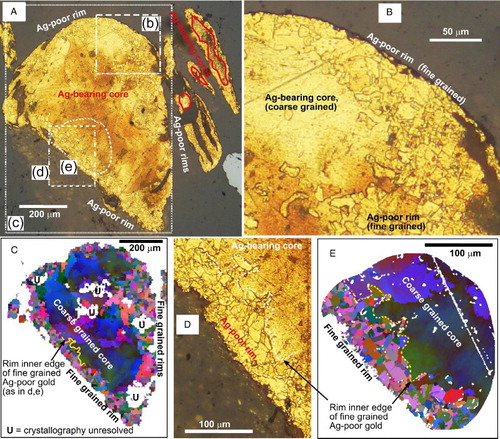
Interior zoned textures
Most of the Waikaia gold displays interior zoning, with each particle having a thin (10–50 µm) rim around a texturally and chemically distinct core (). The gold in the cores typically contains between 2 and 9 wt% Ag, and core compositions for individual particles are internally consistent within <1 wt% Ag. By contrast, the rims contain little or no detectable Ag, and the µm-scale authigenic overgrowths on the gold particles () also contain no detectable Ag. Hence, almost all the gold particles have an Ag-bearing core surrounded by an Ag-poor rim except where the flakes are so flattened that Ag-poor rim gold is all that remains (A). The chemical distinction between cores and rims is displayed by the response of the gold particles to etching by aqua regia, with the Ag-bearing gold becoming etched more readily than the Ag-poor gold (A,B,D).
The chemical distinction between cores and rims is also apparent with differences in the gold crystallographic grain size within the particles. The Ag-bearing cores are coarse grained (50–100 µm), whereas the Ag-poor rims are finer grained (1–20 µm), as displayed by both differential etching and EBSD mapping (). The boundaries between Ag-bearing and Ag-poor gold coincide exactly with the grain size change between cores and rims (B–E). Similar coinciding grain size and Ag content contrasts have been described for detrital gold particles in the Central Otago goldfield by Stewart et al. (Citation2017) and attributed to deformation-driven recrystallisation of rim gold.
Grain textures with progressive clast deformation
The coarse-grained cores of gold particles that have undergone only minor flattening have well-defined grain boundaries, many of which are straight and form interlocking grain textures (A–C). However, even these weakly flattened particles have evidence of internal ductile deformation of the grain structures, as indicated by the gradational variations in crystallographic orientations detected with EBSD mapping (C). Minor recrystallisation of these internally deformed grains has resulted in scattered finer new grains or subgrains, which become more common towards the edges of the particles where recrystallisation has been more advanced (B,C). Rim recrystallisation is most advanced in the particle in (B,C) on the angular protruding corner of the particle (lower right of images).
Figure 7. Images of contrasting grain size and texture of core and rim of weakly deformed gold particles from Waikaia placer mine. A, Incident light image of etched section of particles with large coarse-grained cores and narrow finer grained rims. B, Close view of portion of central particle in A, showing contrast in grain size highlighted with etching. C, EBSD image of the coarse internal grain structure of the same area as in B, with gradational colour changes showing the weak ductile deformation. D, EBSD map of a moderately flattened flake dominated by coarse grains and a thin fine-grained edge. E, Bar graph of crystallographic angular misorientation across grain boundaries along a longitudinal transect of the particle in D.
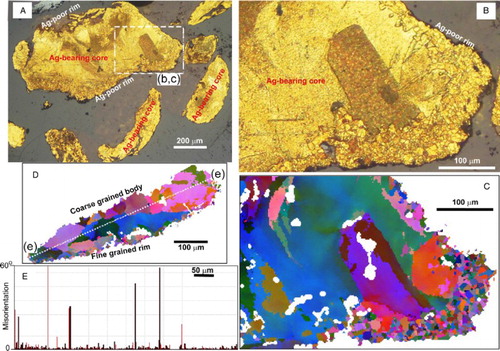
The contrast in crystallographic disruption of the gold grains during these early stages of deformation can be quantified with measurements of the angular misorientations of crystal lattices in a transect across a particle (D,E). The moderately flattened particle in (D) is dominated by coarse grains that have been deformed internally in a ductile manner, with incipient formation of new grains and subgrains. The bar graph in (E) traces the angular misorientation of grain lattices along the length of this particle, avoiding the thin fine-grained rim. Most of the misorientations across the large grains are < 5°, with a few large angular changes across major grain boundaries (D,E).
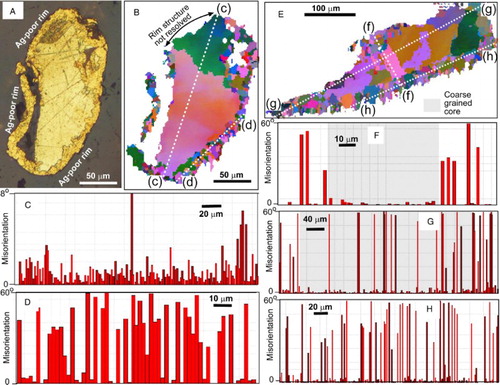
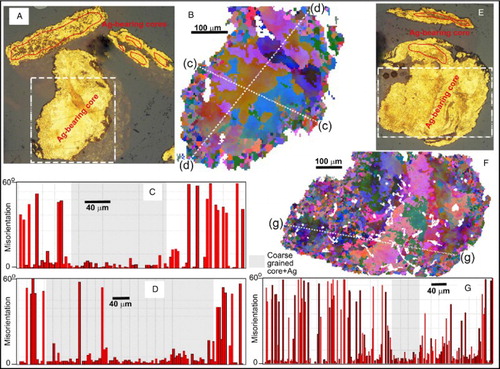
With the development of more prominent rims, the contrast in grain structure becomes starker (). A particle that has undergone sufficient deformation to develop a partly folded rim (A) has only weak internal deformation of crystal lattices, yielding misorientations that are typically only c. 2–3° across the particle (B,C). The fine-grained recrystallised rim gold, by contrast, has misorientations across grain boundaries of 40–60° (B,D). Likewise, a flattened flake with well-defined rim but remnant coarse grain structure (E) has retained some strong contrasts in internal grain misorientations between core and rim (F–H).
Figure 8. Grain structure of gold particles with well-developed fine-grained rims from Waikaia placer mine. A, Incident light view of etched section of a particle with a rim that has been partly folded. B, EBSD map of particle in A, showing the fine-grained rim structure. C, Bar graph of crystallographic angular misorientation across deformed coarse core grains along a longitudinal transect of the particle in B. D, Bar graph of misorientations across fine recrystallised grain boundaries along a transect of the rim of particle in B. E, EBSD map of a flattened flake with fine-grained rim. F–H, Bar graphs of crystallographic angular misorientations across grain boundaries along the transects indicated in E, contrasting core and rim grain textures.
Strongly deformed gold particles with more advanced internal ductile deformation lose their original coarse grain texture as grain boundaries have migrated and new grains and subgrains have formed (). The coarse-grained core is still recognisable in the particle in (A), although grain boundaries have become highly irregular (B). Despite this internal ductile deformation, the core grains still have only small angular misorientations across the particle compared with the distinct new grain structure of the rims (C,D). With even more advanced deformation that has led to folding of rims of a particle (E), the grain structure of the core has been almost entirely obscured by recrystallisation to finer grains with high angular misorientations (F,G). Well-flattened flakes or flattened portions of particles have little or no unrecrystallised core gold remaining (red ellipses in and A,E).
Figure 9. Internal structure of deformed gold grains with relict cores and well-developed rims. A, Incident light image of etched section showing some relict cores. B, EBSD map of a portion of large grain in a showing remnants of deformed core grains and recrystallised rim. C, D, Bar graphs of crystallographic angular misorientations in near-orthogonal transects across the particle in B. E, Incident light image of etched section of deformed particles. F, EBSD map of grain structure of large particle in E, showing almost complete recrystallisation of coarse deformed core grains to finer grained gold. G, Bar graph of misorientations of grains along the transect in F.
Fine sediment particles and groundwater
Sediments with particle sizes of silt or finer in the matrix of the paleochannel gravels are readily suspended and transported in the groundwater used in the mine’s processing plant. These sediments and their hosting groundwater pass through a series of settling ponds where the sediments are removed and the clean water discharges to the Waikaia River or to historically disturbed ground adjacent to the river ( and A). These settling ponds provide the best views into the nature of the finest sediments and groundwater that has interacted chemically with those sediments within the paleochannel and during the brief mine activity. The configuration of settling ponds varied as the mine progressed up the paleochannel (e.g. and ), depending on land availability and the permeability of the gravel substrate. However, the essential principle remained the same and involved pumping water from the active mine pond (C) to the first pond(s) where the coarsest suspended sediments settled out, followed by passing of water with remaining suspended sediment progressively through the downstream ponds ( and A). When upstream settling ponds became filled with sediments, new ponds were constructed, and the sediments were dewatered (A) for disposal during the rehabilitation.
Figure 10. Fine sediments suspended in groundwater during the mining process and pumped from the active mine pond. A, Aerial view of a train of settling ponds built when the mine opened in 2014. Coarser particles dominate at the upstream end where different ponds were in different stages of operation. B–E, SEM secondary electron images of particles collected at the most upstream pond input from the active mine pond (B) in October 2017. White patches are artefacts in image as a result of charging where poor electrical connections result from incomplete carbon coating of irregular shapes during sample preparation. F, SEM image (as for D–E) of sediment collected from water within the most upstream pond.
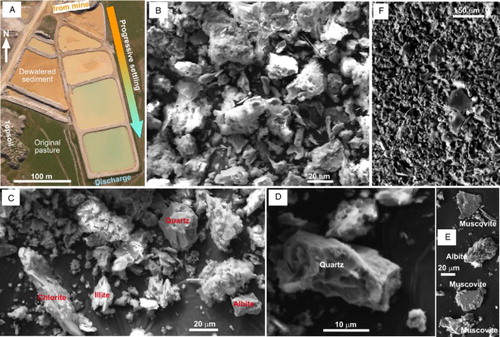
The fine sediments consist primarily of tectosilicates (quartz and albite) and phyllosilicates ( and A,C). The phyllosilicates include muscovite, chlorite and kaolinite, and authigenic clay-altered interlayered minerals that include illite, smectite, smectite–vermiculite and an interlayered 12 Å phase. Qualitative SEM analyses of these clay minerals show variable proportions of Al, Fe, Mg and K, although exact analyses are not possible because of their small size and irregular shapes. These latter clay minerals are common groundwater alteration products of metamorphic muscovite and chlorite in an alteration trend towards diagenetic kaolinite formation in lithic sediments throughout southern New Zealand (Craw et al. Citation1995; Chamberlain et al. Citation1999; Kerr et al. Citation2017). Localised coatings of wispy films of a sulphate mineral occur on some particles (B), but the small size and irregular distribution on detrital particles prevents definitive chemical characterisation. Some μm-scale iron oxyhydroxide spheres and irregular particles, probably of authigenic origin, are also scattered through the fine sediments (C).
Figure 11. SEM secondary electron images and element maps of particles collected from water in the most downstream settling pond (B) in October 2017. A, Typical particle shapes and sizes. B, Wispy sulphate encrustation. C, Authigenic iron oxyhydroxide. D, Secondary electron image of particles, and associated silicon (Si), aluminium (Al), potassium (K), iron (Fe), sodium (Na) and calcium (Ca) element maps of the same area of sediments.
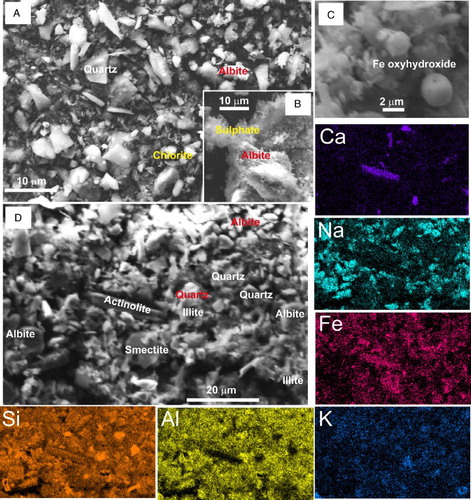
The particle sizes of the fine sediments range from 50 to < 1 µm, and most particles are distinctly angular ( and A,D). Coarser components of the suspended sediments (B–E) settle almost immediately when the mine water is discharged into the first settling pond, and more uniform particle sizes persist in suspension in that pond (F). However, by the time the waters reach the last pond, the typical particle size has decreased to < 5 µm (A,D). Notably, the finer particles still consist of abundant tectosilicates, particularly albite, as indicated by the Si and Na maps (D). However, there is also a significant phyllosilicate component, as well as scattered particles of Ca-bearing silicates such as actinolite and pumpellyite (A,D).
Groundwaters entering the mine and the waters in the settling ponds have broadly similar compositions (). Water pH is consistently near neutral and the dissolved load is low, with total dissolved solids < 90 mg/L (). The waters are generally type, which is typical of the Waikaia catchment and surrounding areas (Craw et al. Citation2017). However, the settling pond waters have higher dissolved sulphate and lower alkalinity than the incoming groundwaters ().
Table 1. Water analyses from the Waikaia placer mine.
Discussion
Sedimentary provenance
The dominance of lithic greywacke clasts in the paleochannel gravels, with subordinate low-grade schist clasts, suggests that the gravels were derived from the same Caples Terrane basement as the modern Waikaia River sediments and the associated Late Pleistocene–Holocene gravels of the Waikaia valley (A–D; Turnbull and Allibone Citation2003). However, some high-grade (upper greenschist facies) schist clasts in the paleochannel attest to a minor component of sedimentary input from Central Otago. This latter material may have arrived in the Waikaia area via the Mataura River catchment during glacial events that transported debris southwards from the Lake Wakatipu area into what are now fluvial terraces of Southland (B; Turnbull Citation2000; Turnbull and Allibone Citation2003).
The abundant hematite in the heavy mineral suite at the Waikaia mine has probably been derived from the low-grade Caples Terrane schists, especially hematitic metacherts, which are a minor but persistent component of the basement in the Waikaia and adjacent catchments (Turnbull and Allibone Citation2003). Spessartine garnets may have been derived from the same sources, or from further afield in Central Otago (Craw et al. Citation2015a). Almandine with low Mn contents are not found in the Central Otago schist and may have been derived from crystalline terranes to the west, probably via recycling from the underlying Cenozoic marine sediments (A; Youngson et al. Citation2002; Craw et al. Citation2015a).
Detrital cinnabar is common in the Nokomai catchment to the west of Waikaia (Youngson et al. Citation2002), and cinnabar-bearing outcrops occur in greywacke to the east of Waikaia (Williams Citation1974), but no sources of cinnabar are known in the Waikaia River catchment itself. Given the presumed derivation of high-grade schist debris through the Mataura River catchment (above), the Nokomai area is the most likely source of the Waikaia mine detrital cinnabar (B).
Deformation of gold particles
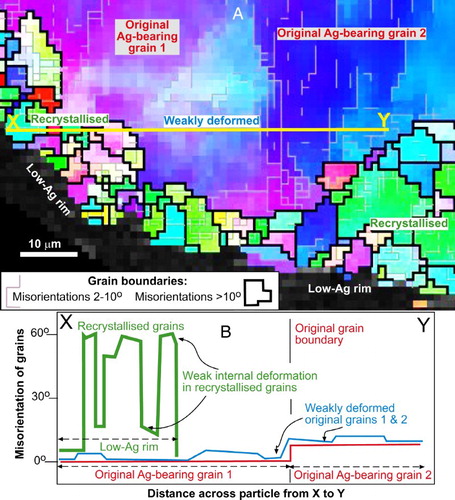
The EBSD data presented above () show that Waikaia gold particles have undergone varying amounts of deformation and recrystallisation. The sequence of changes in internal textures of particles with increasing deformation, as summarised in , initially involved small lattice distortions within the original grains that made up the eroded particle. Greater amounts of deformation on the rims led to recrystallisation of parts of the large deformed grains to smaller grains, with associated loss of Ag (; Stewart et al. Citation2017). Subsequent deformation of the new rim grains resulted in small internal lattice misorientations ().
Figure 12. Schematic summary of internal textural changes that have occurred in gold particles during and after transport-related deformation. A, Digitally processed EBSD map of a portion of a gold particle showing two original large core grains, with small rim grains superimposed on part of grain 1. Grain and subgrain boundaries have been highlighted, with contrasting amounts of lattice misorientation across them. B, Sketch of progressive changes in lattice misorientations with increasing deformation over time, along line X–Y in A. Initially undeformed large grains (red line) became weakly deformed large grains (blue line), then rims were recrystallised to finer grains (green line), and ultimately these became internally distorted as well.
These deformation processes typically cause gold particles to become progressively distorted and flattened with increasing transport distance, and this phenomenon has been used extensively as a prospecting tool to link detrital gold to basement sources (Eyles Citation1995; Knight et al. Citation1999; Townley et al. Citation2003; McClenaghan and Cabri Citation2011). In the context of the Central Otago goldfield, Youngson and Craw (Citation1999) showed that these flattening processes, including folding and re-flattening, occurred progressively over 250 km downstream in the Clutha River catchment. However, in most of these situations, there is an assumption of progressive deformation of gold with linear downstream transport in a single fluvial system.
Some of the gold from the Waikaia mine (e.g. H,I) shows evidence of the same extreme degrees of flattening as the more distal particles in the Clutha River described by Youngson and Craw (Citation1999). However, the general morphological variations observed in this study suggest that the links between particle flattening and transport distance have been more complex in that setting because (1) the apparent transport distance from Central Otago source(s) is relatively short (< 100 km; B,D); and (2) there is a very wide range of coexisting particle morphologies, from angular nuggets to extremely thin flakes (A,B,D–I). The latter point is readily apparent in the wide range of degrees of internal deformation and subsequent rim recrystallisation that can be observed with etching and EBSD mapping of the grain structures of particles ().
The complex geological history of uplift of the Central Otago goldfield has provided numerous stages of erosion over the past 100 million years, during which gold was eroded from primary sources and also recycled from pre-existing fluvial sediments (Craw Citation2010; Craw and Lilly Citation2016; Hesson et al. Citation2016; Craw et al. Citation2017; Stewart et al. Citation2017). Hence, each stage of uplift and erosion had potential to provide angular primary gold particles and variably deformed particles that were recycled from pre-existing sediments, yielding coexisting disparate particle shapes. These strong contrasts in coexisting particle shapes are apparent in Central Otago and Eastern Southland in general (C,E), and the Waikaia mine samples described herein (,–) quantify the breadth of this wide range in particle shapes.
The presence of silcrete boulders and rounded quartz pebbles in the Waikaia paleochannel gravels (C,D) attests to at least one stage of recycling of pre-existing quartz pebble conglomerate in the Waikaia River catchment, and some of the Waikaia gold undoubtedly came from that intermediate source. Observations in the Central Otago and Eastern Southland goldfields and environs suggest that auriferous quartz pebble conglomerates have been formed and reformed by recycling during Cretaceous, Eocene, Miocene and Pliocene times ( and ; Youngson et al. Citation2006; Craw Citation2010, Citation2013; Stewart et al. Citation2017). Hence, it is possible that the high levels of flattening, folding and refolding of many gold particles in the Waikaia mine paleochannel reflect deformation during repeated recycling within a relatively small area of Northern Southland (). This model contrasts with the long-distance linear downstream transport and deformation of gold in the Clutha River described by Youngson and Craw (Citation1999), although the deformation and associated fluvial transport processes have been similar. At various times during this long-term recycling of the auriferous sediments, uplift and erosion have contributed new angular nuggets from the basement into the evolving Waikaia catchment to maintain the wide range of coexisting disparate particle shapes (), as it has in parts of the Central Otago and Eastern Southland goldfields (C,E).
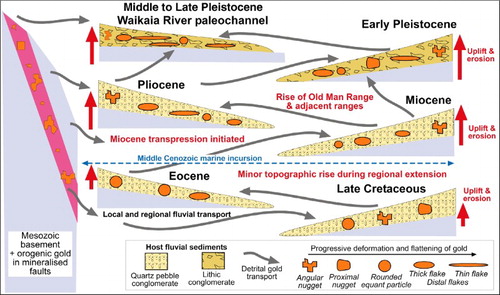
Figure 13. Cartoon summary of progressive accumulation of detrital gold via recycling of sediments and erosion of primary basement gold during long-term uplift in the region between Central Otago and Eastern Southland that became the Waikaia River catchment (B,D). The complex history yields co-existing detrital gold particles with diverse morphologies reflecting variable transport-related deformation histories in a small area.
Water compositions
The suspended sediment contents of mine waters are highly variable, but typically enter the settling pond system with up to 3 wt% solids and depart the settling system with < 0.6 wt% solids (B). A notable feature of the finest component of these sediments is the high proportion of quartz, albite and other metamorphic silicates, and relatively low proportion of clay minerals (A,D). Although there has been significant authigenic clay alteration of the gravel clasts by groundwater in the paleochannel ( and ), this authigenic clay component is apparently less amenable to mobilisation by mine-related agitation than the finest detrital material. This situation is in strong contrast to the abundant mobilisation of authigenic clays during mining of a nearby Cretaceous placer deposit at Waitahuna (Druzbicka and Craw Citation2013; Malloch et al. Citation2017).
The dissolved load in groundwater entering the mine is dominated by which is derived from dissolution of metamorphic calcite in basement clasts in the hosting gravels (; Craw et al. Citation2015a, Citation2015b, Citation2017; Kerr et al. Citation2017; Malloch et al. Citation2017). Approximately equal concentrations of Na+ and Cl− attest to a significant contribution of dissolved marine aerosols in rainwater recharge, although slightly elevated Na+ may also imply some dissolution of metamorphic albite from the basement clasts (; Craw et al. Citation2015a). Likewise, minor dissolved Mg2+ implies some dissolution of metamorphic chlorite in basement clasts (; Craw et al. Citation2017; Kerr et al. Citation2017; Malloch et al. Citation2017). The sulphate contents of the incoming groundwaters are greater than expected for derivation from marine aerosols alone, and some addition of sulphate from oxidising metamorphic and authigenic pyrite is probable (C and ; Craw et al. Citation2015a, Citation2016; Kerr et al. Citation2017; Malloch et al. Citation2017).
The dissolved loads of the incoming groundwater and the discharging mine waters are remarkably similar considering the abundant agitation of labile sediments in water that accompanies the mining processes. However, the distinctly higher sulphate contents of the discharge waters and associated lower alkalinities imply that there has been some chemical change within the mining process beyond the natural groundwater–rock interactions. The most likely process is that agitation in the mine led to enhanced oxidation of authigenic and/or metamorphic pyrite to yield minor sulphuric acid that was neutralised by the high initial alkalinity, summarised as Reaction 1:(1) This reaction implies that consumption of 2 mol of alkalinity should produce 1 mol of additional sulphate. Analyses in imply that 0.6 mmol of alkalinity have been consumed during the mining process, but only 0.08 mmol of additional sulphate have been added to the mine discharge waters. Hence, if Reaction 1 is a correct representation of the chemical process in the mine waters, there is a shortfall of dissolved sulphate in the mine discharge waters. This shortfall may reflect precipitation of sulphate mineral(s) that are locally coating the sediment particles (B). However, it is not yet possible to distinguish between sulphate minerals precipitated in the settling ponds and sulphate minerals precipitated in the laboratory during preparation and drying for SEM examination.
Conclusions
The Waikaia alluvial gold mine is hosted in a Pleistocene paleochannel of the south-draining Waikaia River in Northern Southland. The paleochannel sediments were derived primarily from local Caples Terrane greywacke and low-grade schist basement. The immediate basement for the paleochannel is either that basement or a thin remnant of Cenozoic marine sediment resting on the basement. The paleochannel also contains remnants of recycled Miocene quartz pebble conglomerate, including rounded quartz pebbles and silcrete cobbles. Rare higher grade (upper greenschist facies) schist clasts derived from Central Otago also occur in the paleochannel. The heavy mineral suite is dominated by hematite from the Caples Terrane basement, with minor magnetite, cinnabar and almandine garnets from more distal provenances.
The detrital gold in the paleochannel has a wide range of textures that imply extremely different degrees of transport-related modification. Rare but widespread angular nuggety particles are intergrown with quartz and/or iron oxyhydroxide, and some of these angular particles retain original gold crystal facets. Equant rounded and abraded particles are common, with varying degrees of flattening. However, most gold particles are highly flattened thin flakes, with variable amounts of folded and refolded edges. The wide range of particle shapes is typical of other Southland placer gold deposits whose gold has been derived from the Otago Schist belt to the north.
The internal grain structures of Waikaia gold particles are characterised by coarse-grained (c. 100 µm) cores and finer grained (< 20 µm) rims. The gold in the cores contains up to 9 wt% Ag, whereas the rims have < 1 wt% Ag. Rim gold has been formed by recrystallisation and associated Ag leaching after transport-related deformation (). Particles that have undergone more deformation have more extensive overprinting of primary coarse-grained gold. The diverse gold textures that coexist within the placer reflect a complex history of recycling of gold within the general area of what is now the Waikaia valley. The most flattened flakes having undergone the most recycling events since initial erosion of source gold-bearing veins in the Cretaceous (). By contrast, the angular particles may have been derived from a nearby basement source during the most recent uplift of the Waikaia catchment.
Minor μm-scale authigenic gold overgrowths occur on the gold particles because of in situ dissolution and redeposition of gold by groundwater. These overgrowths typically occur with authigenic clay deposits in cavities on exterior surfaces of detrital particles. Groundwater-driven clay alteration of lithic gravel clasts has been widespread in the paleochannel. However, this clay is not extensively mobilised during mine-related agitation of the sediments, and the finest sediment component (< 10 µm) of mine-related waters is dominated by quartz and albite rather than clay minerals. Mine processing of the gravels apparently results in oxidation of authigenic and metamorphic pyrite, leading to minor consumption of alkalinity and even smaller increases in dissolved sulphate in discharge waters. These processes occur in mine waters with very low total dissolved solids (< 90 mg/L), and some minor sulphate mineral deposition may accompany the chemical reactions.
Acknowledgements
This study was kindly facilitated by Noel Becker of Waikaia Gold Ltd, who provided access to the site and samples of gold. Discussions with Donna Falconer, Gemma Kerr, Dave Prior and John Youngson were helpful in compiling the manuscript. Brent Pooley assisted with sample preparation, and Gemma Kerr assisted with the XRD work and with sampling of mine groundwaters. Helpful suggestions from Rob Chapman and Brent Alloway improved the presentation of the paper.
Disclosure statement
No potential conflict of interest was reported by the authors.
Additional information
Funding
References
- Becker N, Batt W. 2016. Waikaia placer gold mine, Southland. In: Mineral Deposits of New Zealand: Exploration and Research. (ed, A.B. Christie). Australasian Institute of Mining and Metallurgy Monograph. 31: 387–394.
- Chamberlain CP, Poage MA, Craw D, Reynolds RC. 1999. Topographic development of the Southern Alps recorded by the isotopic composition of authigenic clay minerals, South Island, New Zealand. Chemical Geology. 155:279–294. doi: 10.1016/S0009-2541(98)00165-X
- Craw D. 2010. Delayed accumulation of placers during exhumation of orogenic gold in southern New Zealand. Ore Geology Reviews. 37:224–235. doi: 10.1016/j.oregeorev.2010.03.006
- Craw D. 2013. River drainage reorientation during placer gold accumulation, southern New Zealand. Mineralium Deposita. 48:841–860. doi: 10.1007/s00126-013-0464-5
- Craw D. 2017. Placer gold and associated supergene mineralogy at Macraes Flat, East Otago, New Zealand. New Zealand Journal of Geology and Geophysics. 60:353–367. doi: 10.1080/00288306.2017.1337644
- Craw D, Hesson M, Kerr G. 2017. Morphological evolution of gold nuggets in proximal sedimentary environments, southern New Zealand. Ore Geology Reviews. 80:784–799. doi: 10.1016/j.oregeorev.2016.08.028
- Craw D, Kerr G, Falconer D. 2015a. Mineralogy and provenance of auriferous Waimumu Quartz Gravels, Southland, New Zealand. New Zealand Journal of Geology and Geophysics. 58:281–295. doi: 10.1080/00288306.2015.1070182
- Craw D, Kerr G, Falconer D. 2016. Gold and sediment provenance in Southland placer goldfields, in: Mineral Deposits of New Zealand: Exploration and Research. (ed, A.B. Christie). Australasian Institute of Mining and Metallurgy Monograph. 31:381–386.
- Craw D, Lilly K. 2016. Gold nugget morphology and geochemical environments of nugget formation, southern New Zealand. Ore Geology Reviews. 79:301–315. doi: 10.1016/j.oregeorev.2016.06.001
- Craw D, MacKenzie DJ, Grieve P. 2015b. Supergene gold mobility in orogenic gold deposits, Otago Schist, New Zealand. New Zealand Journal of Geology and Geophysics. 58:123–136. doi: 10.1080/00288306.2014.997746
- Craw D, Smith DW, Youngson JH. 1995. Formation of authigenic Fe2+-bearing smectite-vermiculite during terrestrial diagenesis, southern New Zealand. New Zealand Journal of Geology and Geophysics. 38:151–158. doi: 10.1080/00288306.1995.9514647
- Druzbicka J, Craw D. 2013. Turbidity development and dissipation in paleoplacer gold deposits, southern New Zealand. Environmental Earth Sciences. 68:1575–1589. doi: 10.1007/s12665-012-1851-4
- Eyles N. 1995. Characteristics and origin of coarse gold in late Pleistocene sediments of the Cariboo placer mining district, British Columbia, Canada. Sedimentary Geology. 95:69–95. doi: 10.1016/0037-0738(94)00101-Y
- Falconer DM, Craw D. 2009. Supergene gold mobility: a textural and geochemical study from gold placers in southern New Zealand. Economic Geology Special Publication. 14:77–93.
- Hesson M, Stewart J, Stephens S, Kerr G, Craw D. 2016. Gold nuggets in proximal placers, Old Man Range, Central Otago, in: Mineral Deposits of New Zealand: Exploration and Research. (ed, A.B. Christie). Australasian Institute of Mining and Metallurgy Monograph. 31:359–366.
- Jackson J, Norris RJ, Youngson JH. 1996. The structural evolution of active fault and fold systems in Central Otago, New Zealand: evidence revealed by drainage patterns. Journal of Structural Geology. 18:217–234. doi: 10.1016/S0191-8141(96)80046-0
- Kerr G, Malloch K, Lilly K, Craw D. 2017. Diagenetic alteration of a Mesozoic fluvial gold placer deposit, southern New Zealand. Ore Geology Reviews. 83:14–29. doi: 10.1016/j.oregeorev.2016.12.018
- Knight JB, Morison SR, Mortensen JK. 1999. The relationship between placer gold particle shape, rimming, and distance of fluvial transport as exemplified by gold from the Klondike district, Yukon Territory, Canada. Economic Geology. 94:635–648. doi: 10.2113/gsecongeo.94.5.635
- Little TA, Prior DJ, Toy VG. 2016. Are quartz LPOs predictably oriented with respect to the shear zone boundary? A test from the Alpine Fault mylonites, New Zealand. Geochemistry, Geophysics, Geosystems. 17:981–999. doi: 10.1002/2015GC006145
- MacPherson EO. 1937. The geology of the Waimumu alluvial goldfield and notes on quartz conglomerates of Southland. New Zealand Journal of Science & Technology. 18:772–778.
- Malloch K, Kerr G, Craw D. 2017. Placer gold in the Cretaceous Blue Spur Conglomerate at Waitahuna, southern New Zealand. New Zealand Journal of Geology and Geophysics. 60:239–254. doi: 10.1080/00288306.2017.1311931
- McClenaghan MB, Cabri LJ. 2011. Review of gold and platinum group element (PGE) indicator minerals methods for surficial sediment sampling. Geochemistry: Exploration, Environment, Analysis. 11:251–263.
- Mortensen JK, Craw D, MacKenzie DJ, Gabites JE, Ullrich T. 2010. Age and origin of orogenic gold mineralisation in the Otago Schist belt, South Island, New Zealand: constraints from lead isotope and 40Ar/39Ar dating studies. Economic Geology. 105:777–793. doi: 10.2113/gsecongeo.105.4.777
- Prior DJ, Mariani E, Wheeler J. 2009. EBSD in the earth sciences: applications, common practice and challenges. In: Schwartz AJ, Kumar M, Adams BL, Field DP, editors. Electron backscatter diffraction in materials science. 2nd ed. New York: Springer. Chapter 29, p. 345–357.
- Reith F, Stewart L, Wakelin SA. 2012. Supergene gold transformation: secondary and nanoparticulate gold from southern New Zealand. Chemical Geology. 320-321:32–45. doi: 10.1016/j.chemgeo.2012.05.021
- Stephens S, MacKenzie D, Barth N, Craw D. 2015. Links between orogenic and placer gold on the old man range, Central Otago, New Zealand. New Zealand Journal of Geology and Geophysics. 58:296–312. doi: 10.1080/00288306.2015.1070181
- Stewart J, Kerr G, Prior D, Halfpenny A, Pearce M, Hough R, Craw D. 2017. Low temperature recrystallisation of alluvial gold in paleoplacer deposits. Ore Geology Reviews. 88:43–56. doi: 10.1016/j.oregeorev.2017.04.020
- Townley BK, Herail G, Maksaev V, Palacios C, de Parseval P, Sepuldeva F, Orellana R, Rivas P, Ulloa C. 2003. Gold grain morphology and composition as an exploration tool: application to gold exploration in covered areas. Geochemistry: Exploration, Environment, Analysis. 3:29–38.
- Turnbull IM. 2000. Geology of the Wakatipu area. Institute of Geological & Nuclear Sciences 1:250 000 geological map 18. 1 sheet + 72p. Lower Hutt (NZ): Institute of Geological and Nuclear Sciences.
- Turnbull IM, Allibone AH. 2003. Geology of the Murihiku area: Institute of Geological & Nuclear Sciences 1:250 000 geological map 20. Lower Hutt (NZ): Institute of Geological & Nuclear Sciences Limited.
- Williams GJ. 1974. Economic geology of New Zealand. Australasian Institute of Mining & Metallurgy Monograph. 4:490 p.
- Youngson JH, Craw D. 1999. Variation in placer style, gold morphology, and gold particle behavior down gravel bed-load rivers; an example from the shotover/arrow-kawarau-clutha river system, Otago, New Zealand. Economic Geology. 94:615–633. doi: 10.2113/gsecongeo.94.5.615
- Youngson JH, Craw D, Falconer DM. 2006. Evolution of Cretaceous-Cenozoic quartz pebble conglomerate gold placers during basin formation and inversion, southern New Zealand. Ore Geology Reviews. 28:451–474. doi: 10.1016/j.oregeorev.2005.02.004
- Youngson JH, Wopereis P, Kerr LC, Craw D. 2002. Au-Ag-Hg and Au-Ag alloys in Nokomai and Nevis valley placers, northern Southland and Central Otago, New Zealand, and their implications for placer-source relationships. New Zealand Journal of Geology and Geophysics. 45:53–69. doi: 10.1080/00288306.2002.9514959