
ABSTRACT
This article presents the results of a pilot study exploring downstream changes in water chemistry in the Waitaki catchment, which drains the eastern slopes of the Southern Alps. The headwaters of this catchment are glaciated, and both natural glacial lakes and hydroelectric reservoirs occur in the catchment. The dominant lithology is calcite-poor quartzo-feldspathic metasedimentary rock. We sampled surface waters from streams and the inflow and outflow of lakes in the catchment on four occasions over the course of 1year, at c. 3-monthly intervals between summer 2013 and spring 2014. We also sampled ice released from the terminus of the Tasman Glacier. Small but measurable variations were observed in the major element (Ca, Mg, K, Na, Si), trace element (Al, Fe, Rb, Sr) and Sr isotopic composition of the surface waters in the catchment. The composition of the waters is interpreted to reflect the change from calcite-dominated weathering near the top of the catchment toward more silicate weathering down the catchment that has been observed in other studies. The composition of samples collected from the uppermost part of the catchment displays more temporal variability than those samples collected from dammed lakes, suggesting that seasonality is dampened by anthropogenic modification of the catchment.
Introduction
The denudation of mountain belts takes place via chemical and physical erosion, the relative intensities of which reflect both climatic (e.g. precipitation, temperature and runoff) and tectonic (e.g. exhumation, landscape surface age, mechanical weathering and sediment transport) factors. The chemical weathering of silicates is generally considered to be responsible for regulating the carbon cycle on geological time scales, which in turn has control on global average temperature (e.g. Berner et al., Citation1983). However, in settings where the residence time of fresh waters in a catchment is short, carbonate weathering becomes an important control on their chemical and isotopic composition. Furthermore, the relationship between physical and chemical weathering in a catchment depends on the rates of uplift and weathering. For example, previous work on the Southern Alps of New Zealand has shown that c. 90% of total weathering is physical, whereas the remainder is chemical (Lyons et al., Citation2005).
The record of 87Sr/86Sr in marine deposits has been used to make inferences about the relative drawdown of CO2 from the atmosphere by silicate weathering, such as the hypothesis that weathering of the Himalaya has led to an increase in the 87Sr/86Sr of seawater in the late Cenozoic (e.g. Raymo and Ruddiman, Citation1992). However, due to the higher solubility and faster dissolution rates of carbonate minerals in comparison with the generally much more abundant silicate minerals, it has become apparent that river water chemistry in active orogenic belts is often dominated by carbonate weathering. Mountain belts often have disseminated or vein-associated calcite, which dissolves orders of magnitude more rapidly than silicates (Blum et al., Citation1998; Jacobson et al., Citation2003). Uplift continually exposes new minerals to dissolution, allowing Ca and associated Sr concentrations in river water to become elevated (Palmer and Edmond, Citation1992; Lyons et al., Citation2005; Chamberlain et al., Citation2005). Silicate weathering rates are generally slower in mountainous areas due to a combination of short residence times of waters and low temperatures (White and Blum, Citation1995; Dalai et al., Citation2002).
Study area
The Southern Alps of New Zealand are formed by the convergent component of the motion between the Australian and Pacific plates (Toy et al., Citation2012; ). Displacement has been along the Alpine Fault, which thrusts the Pacific Plate over the Australian Plate, forming steep topography on the west coast and relatively shallow topography in the east. The Alpine Fault has accommodated c. 480 km of dextral strike-slip motion and > 35 km of vertical uplift, much of it over the past 5 million years (Norris et al., Citation1990; Cox and Sutherland, Citation2007; Toy et al., Citation2012). The Pacific Plate at the Alpine Fault experiences average uplift rates in the order of 7–8 mm/yr (Norris and Cooper, Citation2001); in the Main Divide area, this is thought to be in dynamic equilibrium with the high rates of physical erosion (C; Koons, Citation1990).
Figure 1. Maps showing the location and setting of the Waitaki catchment. A , Generalised geological map with water sampling locations indicated with Station number. B , Location of the catchment in the South Island of New Zealand and line of section for C, idealised cross section showing the topography relative to the Alpine Fault, with the highest elevation in the Southern Alps corresponding to the location of the main divide (after Koons, Citation1990).
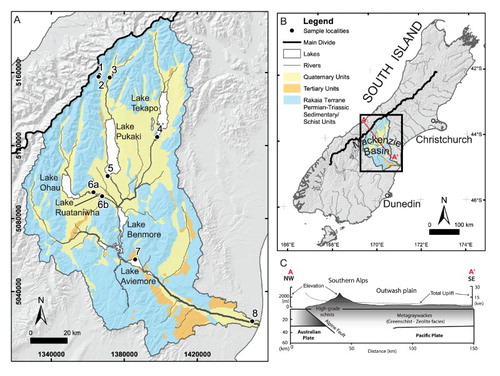
To the east of the Alpine Fault, a splay of roughly NE-SW trending reverse faults accommodate the remaining 10–40% of plate motion not taken by the Alpine Fault, creating basin and range topography (Berryman and Beanland, Citation1991; Norris and Cooper, Citation2001). Uplift in this area is c. 1.7–0.5 mm/yr. These faults are cemented with calcite-rich fault gouge, and some travertine deposits form at discharge sites of both warm and cold springs (Jacobson et al., Citation2003). The dominant rock types on the eastern side of the Southern Alps, including this study area, are greywackes and mudstones (argillites) of the composite Torlesse Composite Terrane (Adams and Graham, Citation1997; Forsyth, Citation2001). Regions of this terrane were metamorphosed to the prehnite–pumpellyite facies during the Permian–Jurassic, and are primarily composed of quartz, albite, chlorite and muscovite derived from the erosion of a continental granitoid source (MacKinnon, Citation1983). Quartz–calcite veins that are centimetres to tens of centimetres thick have been deposited by hydrothermal groundwaters accompanying the recent uplift of the Southern Alps (Koons and Craw, Citation1991). Overall, hydrothermal calcite has been estimated to compose up to 3% of the bulk rock composition (Jacobson et al., Citation2003), but it is not evenly distributed. Bedload sediments in the nearby Clutha and Haast catchments have only trace amounts of calcite (Kautz and Martin, Citation2007).
The Southern Alps form a barrier across the prevailing westerly airstream from the Tasman Sea, striking almost perpendicular to it and creating an extremely asymmetric rainfall pattern in which the western side receives high rainfall (> 6 m/yr), while the eastern side receives relatively little precipitation (≥ 0.36 m/yr). Vegetation east of the Main Divide is predominately tussock grasslands, although in the Mackenzie Basin intensive farmland and exotic forests are rapidly expanding. Maximum mean air temperatures in the Mackenzie Basin are 8 °C in winter and 23 °C in summer (NIWA, Citation2015).
The Waitaki catchment, which drains from the highest point in the Southern Alps east to the Pacific Ocean () and has an area of 12 787 km2, is the most regulated in New Zealand with respect to discharges for hydroelectricity and for irrigation. The headwaters of the catchment are located in pristine, temperate glaciated terrain, but its downstream hydrology has been greatly modified from its natural state with a number of dams and canals (). Hydroelectric power stations in the Waitaki catchment collectively produce 35–40% of New Zealand’s electricity (Purdie and Bardsley, Citation2010). In addition to the importance of the Waitaki catchment in supplying hydroelectricity (Purdie and Bardsley, Citation2010), it supplies irrigation waters for agriculture, hosts an aquaculture salmon fishery, and is used for recreational activity.
Figure 2. Schematic depiction of the hydrology of the Waitaki catchment. Water sampling locations are indicated with station numbers (after Pettinger, Citation2016).
Because dams within the catchment allow water to accumulate in the hydro-lakes during the summer and autumn high-inflow months (Purdie and Bardsley, Citation2010), the dissolved load of each lake is not simply representative of each individual storm event but is rather a weighted average of the events taking place on a seasonal basis. Damming alters the residence time of waters in different sections of a catchment relative to its natural flow conditions (Table S1; K. Walter, NIWA, pers. comm. March 2016, and E. Stead, Meridian Energy Ltd., pers. comm., February 2016). Furthermore, as the water reaches the lakes, its velocity decreases and the suspended load falls as sediment to the bottom of the lake (McGowan and Sturman, Citation1997). In winter, as water is released from the dams to satisfy the increased requirement for energy, lake levels decrease, and the streams may pick up new sediment as the water travels further downstream. All these factors have the potential to affect water chemistry within the catchment (Gross et al., Citation2001).
Sample collection and analytical methods
Field sampling
Fresh water samples were collected quarterly (December 2013 to September 2014) from nine stations () along the c. 215 km length of the catchment.
Table 1. Analytical results for water and ice samples in the Waitaki Catchment. Station numbers correspond to locations in .
Sampling locations are indicated on and and (with further information on the sites and water fluxes and residence times given in Tables S1 and S2). Three sub-alpine locations include the glacial terminal lakes Tasman and Hooker and the alpine Stocking Stream. Lake Tasman was sampled at all four seasons, but Stocking Stream was not running in spring, while Lake Hooker could only be accessed in summer and spring. The other water sample locations were associated with the major hydro-lakes in the Mackenzie Basin and Waitaki Valley. In total, 33 water samples were collected from the nine locations. All water samples were collected from flowing water; lake samples were usually taken from the primary egress of the lake, which was assumed to provide a representative sample of the entire lake volume. Both the entrance and exit of Lake Ruataniwha (Stations 6a and 6b, respectively) were sampled to explore whether within-lake geochemical processes changed the composition of the water to a measurable extent.
At each water sampling location, the pH, conductivity and temperature were measured using a YSI Professional Eh-pH metre. Uncertainty for these measurements is approximately ± 0.02 pH units, ± 0.02 µS/cm and 0.1 °C. The metre was calibrated with standard solutions prior to sampling at each station. Samples were collected in acid-cleaned HDPE bottles after rinsing and discarding the water three times. Water samples were kept in the dark and chilled until return to the laboratory.
Glacial ice that had calved into terminal lake Tasman (Station 3) was collected from a boat on each sampling trip, for four samples in total. The ice surfaces were cleaned with quartz-distilled HCl immediately after collection, and the cleaned ice triple-bagged in clean resealable bags.
Rock samples were collected from the terminal moraine in the Tasman valley (Station 3). Boulders weighing up to about 10 kg were chosen to gather a representative set of the lithologies present within the catchment. Rocks from two prominent fault systems within the Mackenzie Basin (Irishman Creek and Ostler faults) were also sampled. All the rock samples were crushed inside HDPE bags using a steel mallet, and the < 2 mm internal fragments were powdered in an agate shatterbox. Residual rock material is archived in the Geology Department at University of Otago.
Laboratory and analytical methods
Upon returning to the laboratory, water samples were vacuum filtered using Millipore Sterifil units to 0.22 µm with mixed cellulose acetate filters in order to obtain the dissolved load, which probably includes some colloidal material. The ice samples were allowed to melt and then filtered in the same way as the water samples. Filtrates were subsequently acidified to 2% with concentrated quartz-distilled nitric acid (QD HNO3). Splits of the waters were taken for analysis of major and trace elements, and a mixed isotope standard solution was added. Based on the Sr concentration obtained, further splits were taken to obtain sufficient Sr for isotope analysis. Sr isotope splits were dried down and then taken up in 3 N HNO3, which was purified on Sr.Spec resin columns. A second pass through the Sr.Spec resin was undertaken to ensure the removal of interfering isotopes in the mass spectrometer.
Rock powders were subjected to a weak leaching process intended to obtain the carbonate and exchangeable ion fraction of the samples (e.g. Jacobson et al., Citation2003; Moore et al., Citation2013). Dilute acetic acid (0.5 N) was added to a weighed split of rock powder, and the acidified samples were agitated on a shaking table for 24 h at room temperature, and then centrifuged. The leaching procedure was repeated in order to ensure that the reactions had gone to completion. Splits were taken, dried and then redissolved in 5% QD nitric acid. The leachates were then processed for elemental and Sr isotopic analysis using the same methods as for the water and ice samples.
Concentrations of major cations (Ca, Mg, K, Na) and several trace elements (Fe, Al, Rb, Sr) of all samples were measured on an Agilent 7500 quadrupole ICP-MS using standard methods. Sr isotopic compositions were measured on a Nu Plasma MC-ICP-MS. Both ICP instruments are located at the University of Otago Centre for Trace Element Analysis. Both international and in-house standards (SRM987, Tridacna, HPS Sr, BHVO-2 and BCR-2) were run periodically to ensure the accuracy and precision of the results. This study did not include mass-dependent Sr isotopic measurements, so the data were normalised to 86Sr/88Sr = 0.1194 to correct for analytical mass fractionation using an exponential law (Weis et al., Citation2006). Procedural blanks (filtration and subsequent steps for water samples; dissolution blanks for rocks) were negligible, so no blank corrections were required.
Determination of the dissolved silica concentration in the water samples was conducted on a Shimadzu UV-1800 Spectrophotometer in the Geology Department at the University of Otago, using a molybdate-blue spectrophotometry method modified from Strickland and Parsons (Citation1972). Three measurements of each sample were taken to ensure accuracy and from these an average concentration was calculated. All reagent blanks displayed absorbances less than 0.001. The silica concentrations were determined by linear regression through a 10-point standard curve using the OPAL (Vbasic macro) extension with Microsoft Excel. Silica concentrations in the summer samples were not obtained, as the entire sample had been previously acidified with 2% QD nitric acid prior to taking the Si split, compromising the sample preparation for spectrophotometry.
Although we did not measure (HCO3)− concentrations directly, we are able to infer a maximum possible value based the assumption of charge balance. Jacobson et al. (Citation2003) reported that was the dominant anion in South Island rivers, at a relative molar abundance of 89%, with subordinate amounts of (SO4)2− (7%) and Cl− (4%). Total dissolved solids for our water samples were estimated using these anion proportions. For the TDS calculation, differences in ionic proportions do not make a great deal of difference as long as alkalinity is the dominant anion.
The saturation state of the waters with regard to primary minerals and weathering products (Tables S3 and S4) was calculated using the measured field parameters and major ion concentrations as input to PHREEQC (Parkhurst and Appelo, Citation2013). Note that these are based on the same anion concentration estimates and limits discussed above. The water samples were unable to be stored appropriately and hence were discarded.
Results
Results for the water and ice samples are reported in , and results of the rock leachates are in .
Table 2. Elemental and Sr isotope geochemistry of the acetic acid leach of terminal moraine and fault rocks in the Waitaki catchment.
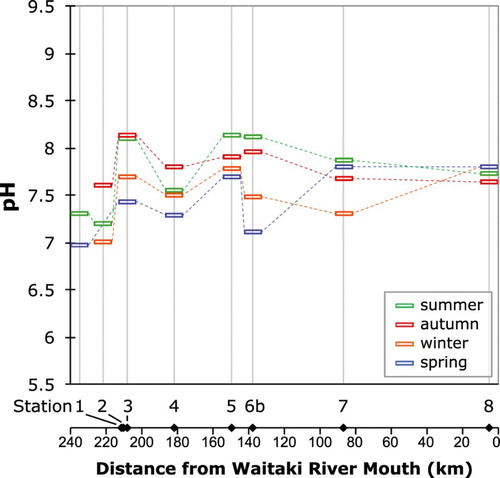
All the waters in this study are relatively dilute compared with most world rivers, as is typical of New Zealand (e.g. Kim et al., Citation1999; Jacobson et al., Citation2003), and illustrated on a Gibbs diagram (). illustrates the variation of pH in the water samples at each station, plotted as distance above the river mouth and keyed by season. The waters range in pH from 7.0 to 8.1 (), with the two lowest pH values found in the upper catchment (Stations 1 and 2). The exit of Lake Ruataniwha sampled in spring has nearly as low a pH as the alpine Stocking Stream. There is a tendency for the pH to decrease slightly at each site going from summer through to the following spring, and the variation between sites is similar to the seasonal range at any given site. The lower Waitaki River (Station 8) exhibits the smallest seasonal variation in pH (7.6–7.8), while the exit to Lake Ruataniwha (Station 6b) has the largest variation (7.1–8.1). Only the results for the exit of Lake Ruataniwha (Station 6b) are plotted on this and subsequent figures, to make them more directly comparable with other lake sampling sites. There is essentially no change in water pH from the entrance of Lake Ruataniwha to its exit ().
Figure 3. Plot of total dissolved solids (mg/L) versus molar Na/(Na + Ca), showing a number of world rivers and other water bodies (after Gibbs, Citation1970). The field encircled in red indicates the Waitaki catchment waters from this study, with shading of circles becoming darker with decreasing distance from the mouth of the river. New Zealand rainwater values from Jacobson et al. (Citation2003).
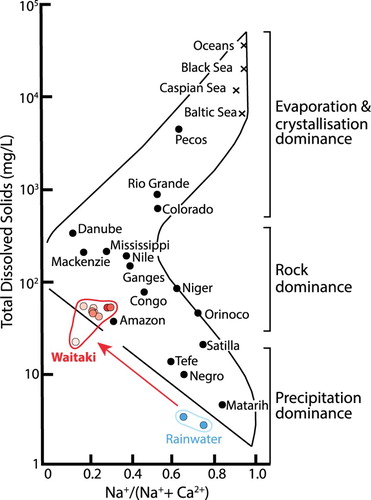
Figure 4. Plot of pH of water at the sample stations as a function of position in the catchment as distance from the Waitaki River mouth, keyed to the sampling season. Samples taken on the same date are connected by dashed lines.
illustrates the variation of the major dissolved species measured in the water samples, again plotted as distance upstream from the mouth of the Waitaki River. Stocking Stream has the lowest concentrations of all the major solution species in the water bodies for all seasons; indeed, Stocking Stream in winter has lower concentrations of dissolved species than some of the glacial ice samples, which could be expected to be similar to rainfall. The major solute geochemistry of waters in this study is similar to results found in previous studies (Kim et al., Citation1999; Jacobson et al., Citation2003; Moore et al., Citation2013).
Figure 5. Downstream variation in freshwater composition. A–D, Major cations and E, Si concentrations at the sample stations plotted as a function of position in the catchment, keyed to the sampling season.
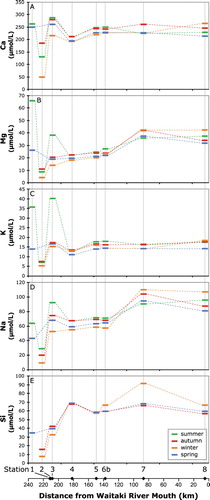
Terminal glacial lakes Hooker (Station 1) and Tasman (Station 3) have high dissolved Ca concentrations compared to the alpine stream (Station 2) and tend to be similar to the down-catchment sites. Lakes Hooker and Tasman also have higher concentrations in summer for most elements than in the other seasons. Lake Tekapo has slightly lower Ca and slightly higher Si than would be expected from the downstream pattern for the other mid to upper catchment samples. The lowermost sites in the catchment, Lake Aviemore and the lower Waitaki River, have Ca and K concentrations that are similar to the other sites, but have higher Na and Mg concentrations. Calcium is the dominant cationic species measured in all the waters (average 68%, range 58–83%), followed by Na (average 20%, range 9–28%) > Mg (average 8%, range 5–15%) > K (average 5%, range 3–9%). When measured, dissolved Si is generally similar in concentration to Na (, ).
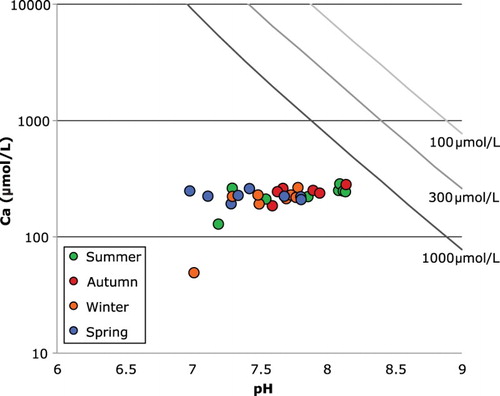
Despite the very low solute concentrations, almost all the waters are supersaturated with respect to the secondary minerals gibbsite, kaolinite and Na-beidellite (Table S4). The exception is for autumn samples of Stocking Stream and Lake Tekapo, which are undersaturated with respect to Na-beidellite. The waters are all significantly undersaturated with respect to calcite () and albitic feldspar, and are close to saturation with quartz (Table S4).
Figure 6. Plot of dissolved Ca concentrations (µmol/L) versus measured pH for stream waters in this study. Lines shown are calcite saturation curves for Ca concentration at indicated total dissolved carbonate species in the water. All the samples plot below the saturation curve even for the highest possible carbonate in the river water calculated for charge balance (as discussed in text).
Two ice samples from the Tasman Glacier have very low concentrations of all dissolved elements, as would be expected for pristine atmospheric precipitation. In contrast, the other two ice samples have markedly higher concentrations of Ca and Si than the alpine stream.
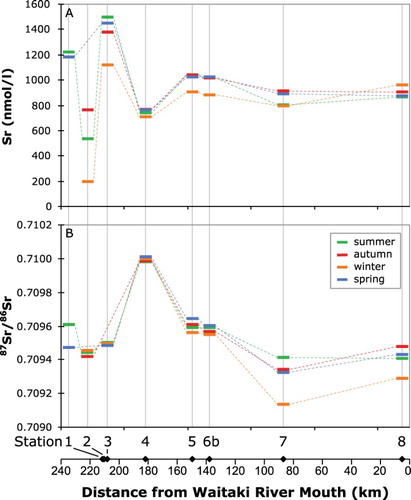
The concentrations of minor and trace elements in the waters and their Sr isotopic composition are shown in and . The summer samples have markedly higher concentrations of Al, Fe and Rb at most sites, which is similar to the results for Mg and K. Lakes Tasman and Hooker have the highest Sr concentration, and Lake Tekapo has the lowest Sr concentration below the alpine stream. The 87Sr/86Sr ratios of the stream waters range between 0.70914 and 0.71001. Water in Lake Tekapo is more radiogenic than water from the other locations. The winter water samples tend to co-vary and have slightly less radiogenic 87Sr/86Sr than samples collected at the same location in other seasons. The data in this study are generally in good agreement with previous studies that included data for the Waitaki catchment (Jacobson et al., Citation2003; Moore et al., Citation2013). An exception is Lake Tekapo, which is consistently more radiogenic in this study than that of Jacobson et al. (Citation2003). The reason for this difference is unclear.
Figure 7. Downstream variation in freshwater Sr concentration and isotopic composition. A, Sr concentration and B, 87Sr/86Sr at the sample stations plotted as a function of position in the catchment, keyed to the sampling season.
The leachates of the moraine rocks are indicative of the more labile elements that may contribute to the dissolved load of the stream waters. Of the rocks collected high in the catchment on the terminal moraine of the Tasman Glacier, the leachates of the greywackes have the highest concentrations of Ca (), argillites have the highest K, and a chert leachate contained the highest concentration of Mg and Rb but extremely small amounts of Sr. The 87Sr/86Sr ratios of the greywacke leachates are 0.70822 and 0.70965, whereas the argillite leachates have lower Sr concentrations and are more radiogenic, with 87Sr/86Sr of 0.70994 and 0.71234. The mixed greywacke-argillite has an intermediate Sr concentration and 87Sr/86Sr (0.70909). The chert sample has the most radiogenic leachate (87Sr/86Sr = 0.71468), accompanied by a very low Sr concentration. These results are within the range reported by Adams and co-workers for whole rocks from the Torlesse Terrane (e.g. Adams and Graham, Citation1997; Adams and Maas, Citation2004). The measured 87Sr/86Sr in the Waitaki catchment water samples is within a much more restricted range than either the whole rocks or leachates.
The leachate of the Irishman Creek fault rock has relatively high concentrations of cations, especially Ca, Mg and Sr, that are each an order of magnitude higher than any other sample. The Ostler Fault rock leachate has concentrations of major elements that are similar to those of greywackes except for their notably low Fe and Al concentrations (). The Ostler Fault rock leachate has very high Ca and a somewhat elevated Sr concentration, in conjunction with a relatively unradiogenic 87Sr/86Sr of 0.70915. As for the moraine samples, the fault rock leachates have a much larger range of 87Sr/86Sr than the water samples in this study.
Discussion
Downstream trends in major element concentrations and contributions
The alpine stream, glacial ice and glacial terminal lakes Tasman and Hooker are the most pristine localities in the catchment in terms of human impact. Of all the waters analysed, the alpine stream has the lowest concentrations of all the major elements measured. All the ice samples have lower Ca concentration than all the water samples, with the exception of the winter sample from Stocking Stream. Two of the ice samples have low concentrations of all the major dissolved species analysed. These low concentrations are similar to the concentration in rainwater samples reported by Jacobson et al. (Citation2003), and are interpreted to retain the signature of the precipitation from which the glacial ice formed. The other two ice samples (sampled in autumn and spring) have higher concentrations than expected for pure precipitation (rain or ice). We note that the ice samples were melted prior to filtering out any entrained dust or scree particles in the ice. It is possible that reaction between those particulates and the ice either prior to or during melting affected the concentrations of the melt water (Anderson et al., Citation1997). The observation that the alpine stream is more dilute than the terminal lakes may likewise be attributed to direct input of reactive, finely pulverised glacial sediment into the lakes. For the most part, the terminal lakes have higher absolute and proportional concentrations of Ca than the dissolved loads lower in the catchment. This is what would be expected if calcite dissolution dominates in the headwaters. Given their pH, none of the waters are saturated in calcite (); this may indicate that there is not enough calcite in the rocks that are being supplied by uplift for the waters to reach saturation, or that the residence times of the waters in the catchment are too short for the calcite supply to be completely consumed (Maher, Citation2010). In contrast, dissolved Si is higher in concentration below the terminal lakes, a trend that is generally attributed to increased water residence times in rivers with lower uplift and runoff rates (Jacobson et al., Citation2003; Maher, Citation2010). In a study of the Haast and Clutha rivers, Kautz and Martin (Citation2007) were unable to positively identify any residual calcite in bedload sediments. This would support the interpretation that the calcite supply in the lower Waitaki catchment has been consumed by previous chemical weathering while the silicate minerals remain available for continued weathering.
Although some previous studies have attributed an excess of dissolved Ca relative to Na to the chemical weathering of trace amounts of calcite (Blum et al., Citation1998; Jacobson et al., Citation2003, Citation2015; Moore et al., Citation2013), as discussed above, chemical weathering of other Ca-bearing minerals such as Ca-bearing plagioclase, apatite, epidote and fluorite, may also contribute dissolved Ca (Blum et al., Citation2002; Oliva et al., Citation2003; Andrews et al., Citation2016). The Ca/Na ratio has been used to estimate the sources of Ca in the dissolved load of waters across the world (Blum et al., Citation1998; Gaillardet et al., Citation1999; Anderson et al., Citation2000; Jacobson and Blum, Citation2000; Lyons et al., Citation2005) including the Waitaki catchment (Moore et al., Citation2013). Using the Ca/Na molar ratio (c. 0.35) of sandstones in the region (Moore et al., Citation2013) it is possible to estimate how much of the riverine Ca comes from silicate weathering for waters of the Waitaki catchment in this study. Results of this calculation indicate that, on average, 90% of the dissolved Ca is attributable to weathering of carbonate minerals (range 83%–96%), meaning that 10% (range 4%–17%) of the Ca is coming from weathering of silicates (+/− other Ca-bearing non-silicate minerals such as apatite). Earlier work across the Southern Alps by Jacobson et al., (Citation2003) found that on average carbonate weathering provides 91% of the Ca in the dissolved load.
Removing the contribution of Ca from carbonate changes the average major cation molar proportions to 51% Na (up from 20%), 18% Ca (down from 68%), 19% Mg (up from 8%) and 12% K (up from 5%) for water samples. The terminal glacial lakes Tasman and Hooker have a notably higher proportion of K than the other localities, which might reflect preferential removal of K from glacially pulverised muscovite in the alpine areas (Drever and Hurcomb, Citation1986; Axtmann and Stallard, Citation1995; Blum and Erel, Citation1997; Hodson et al., Citation2000; Lyons et al., Citation2005). Non-stoichiometric hydrolysis of silicate minerals in regions with high rates of glaciation, has been attributed to high flushing rates through the ice-marginal and subglacial environments where K-bearing minerals experience high physical erosion rates (Anderson et al., Citation1997; Hodson et al., Citation2000).
Looking in more detail at down-catchment variations, it can be seen that the intermediate lakes of the arid Mackenzie Basin, Tekapo and Ruataniwha, have low and relatively constant dissolved Na concentrations in comparison with samples from the lowermost catchment Lake Aviemore and Lower Waitaki (). The elevated Na results in a greater calculated proportion of silicate weathering in the lowest part of the catchment. Albite is the most significant Na-bearing mineral in the region, and it is suggested that feldspar is the dominant silicate weathering. Other silicates such as epidote, prehnite, pumpellyite and zeolite group minerals would not impact as strongly on the Na concentrations and would also tend to increase the dissolved Ca concentrations (Table S3). The lower catchment has more abundant, vegetated soils and relatively high temperature, factors that tend to enhance weathering of silicate minerals (Velbel, Citation1993; Calvaruso et al., Citation2006; Jin et al., Citation2008; Smits et al., Citation2012; Jacobson et al., Citation2015). Enhanced silicate weathering downstream was put forward by Andrews et al. (Citation2016) to explain stable Sr isotope variations in Fiordland. In addition, the residence time of the water in the intermediate to lower catchment may have increased due to the formation and enhancements of lakes by the emplacement of dams, allowing for increased chemical weathering of silicates. An additional source of Na from sea spray, which would be greater nearer to the coast, cannot be ruled out, in particular because we do not have an independent measure for sea spray (Cl− concentrations). However, based on the association of elevated Na with higher Si concentration in Lake Aviemore, we prefer the interpretation that the contribution of Na from sea spray is secondary to its source from silicate weathering in the lower catchment.
Sr isotopes as a monitor of mixing of waters
The Sr isotopic composition of the dissolved Sr in the catchment reflects the mixing of waters that have reacted with different source rocks as a proportion of their Sr concentration and water flux (, ; Table S1). Because we sampled all the water sources in the upper catchment (), we can use the Sr isotope and mass balance in Lake Pukaki as a test of this method to see if it may be applied downstream. The uppermost catchment waters from the terminal glacial Lakes Tasman and Hooker and the alpine Stocking Stream have a relatively restricted 87Sr/86Sr ranging from 0.70942 to 0.70961 (). Lake Tekapo has a more radiogenic 87Sr/86Sr of 0.71000 ± 0.00002. Because of the hydro-dams, 76 m3/s of water is currently being discharged by canal from Lake Tekapo into Lake Pukaki. Based on the average discharge of Lake Pukaki (211 m3/s), its waters are a mixture of 35% from Lake Tekapo and 65% from the glacial lakes and alpine stream. Using these values and the weighted average concentration of Sr in the inputs, the calculated 87Sr/86Sr of Lake Pukaki would be 0.70964. The present-day waters in Lake Pukaki have an average measured 87Sr/86Sr ratio of 0.70960 ± 0.00005, which agrees with the calculated value within the uncertainties. It should also be noted that some of the water from lakes Tasman and Hooker and Stocking Stream could be sourced from groundwater rather than solely from surface flow, as long as it has equilibrated with the same rock sources.
Figure 8. Plot showing the mass balance for Sr isotopic composition (87Sr/86Sr) in waters at each location in the Waitaki catchment. The range of 87Sr/86Sr measured at each sampling station is plotted as a function of its distance from the mouth of the Waitaki River (as in B), except that the 87Sr/86Sr for Stations 1–3 are combined. Curves are labelled with the yearly average water fluxes (in m3/s) (from Table S1). Inferred values for locations where samples were not collected are in italics. The range of 87Sr/86Sr in leachates of rocks from the terminal moraine and the fault zones are indicated by the vertical line to the left of the samples, but note that the values are beyond the limits of the comparatively restricted range in the water samples.
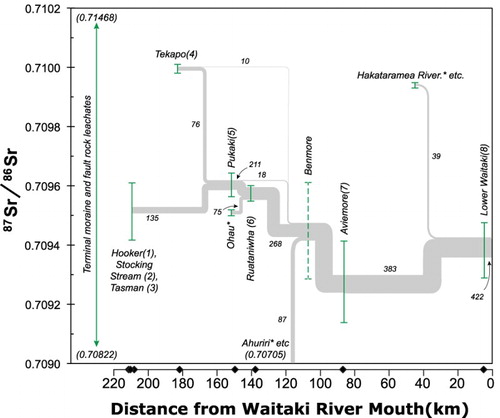
Given the agreement between the measured and calculated values for the waters in Lake Pukaki, we should be able to calculate missing inputs in the Sr isotope balance for the rest of the catchment. The results of these calculations are also illustrated in . At the next downstream location, Lake Ruataniwha (Station 6) is composed of a mixture of the entire outflow of Lake Pukaki, including the canal and river, along with an additional small inflow from the Tekapo River and an estimated additional input from Lake Ohau. The measured 87Sr/86Sr of Lake Ruataniwha is nearly identical to that of Lake Pukaki, as would be expected because it is dominated by the already mixed Pukaki by way of a canal, although an additional flux of water from Lake Ohau and its associated canal with an estimated 87Sr/86Sr similar to the uppermost catchment rivers could balance the small additional flux of more radiogenic water from Lake Tekapo. The next sampled location downstream, Lake Aviemore, with 87Sr/86Sr of 0.70931, is noticeably less radiogenic than Lake Ruataniwha. This could be accommodated by an additional flux from the Ahuriri River, which we did not collect, and other sources to the west with 87Sr/86Sr of approximately 0.70705. This is reasonable given the geology of the area, which may include more of the less-radiogenic greywackes and argillites such as those that were leached for this study (; Adams and Graham, Citation1997; Adams and Maas, Citation2004), or alternatively of mafic volcanic sources (Forsyth, Citation2001). The lowermost Waitaki sample is almost identical to Lake Aviemore, or perhaps slightly more radiogenic, which would be reasonable for a small flux of more radiogenic Sr similar to Lake Tekapo or from Cenozoic sediments, which occur in the north and eastern side of the catchment around the Hakataramea River (Forsyth, Citation2001). These calculations were done using average yearly fluxes, but it is noted that most of the lower catchment is typified by less radiogenic Sr in the winter season (, ). It is unclear whether this change is due to the increased fluxes of water through the hydro-dams to generate more electricity in winter or if the more radiogenic sources are less accessible to the streams in the winter season. The fact that the Si concentrations increase in winter in the lowermost catchment suggests that sources with greater silicate weathering become more dominant in the river in winter, and perhaps this is the signature of groundwater. In any case, the low residence time of waters in the upper- and lowermost parts of the catchment (Table S1) mean that the chemical and isotopic compositions respond quickly to variations in proportions of input sources. In the middle part of the catchment the large hydro-lakes Tekapo, Pukaki and Ohau have residence times on the order of 1–2 years, and it is noted that the Sr isotopic () and elemental compositions () of these lakes are much less seasonally variable than at either the top or bottom end of the catchment, implying that they are well mixed.
Confirmation of the Sr isotope and mass balance will entail analysing the major surface waters that were not undertaken in this study, in particular lakes Ohau and Benmore and the Ahuriri and Hakataramea rivers and subcatchments.
Effects of human activity and temporal variability of sources
The already modified hydrology of the Waitaki catchment may be further amended in the near future by changes in land use. The data presented here can be used as a baseline against which the impact of further changes in the catchment can be compared.
Although the data set presented here only covers one year, by sampling on four different occasions in different seasons over the course of a year, we have begun to investigate the possibility of temporal (seasonal) changes in the composition of Waitaki River water. It is worth noting that there is no single straightforward pattern of composition that can be related to simple conservative mixing of waters with well-characterized sources. As noted above, the parts of the hydrologic system with the shortest residence time should show the greatest geochemical variability, reflecting short-term changes in inputs, whereas the larger lakes with long residence times effectively ‘see through’ any specific events to give an integrated average of the chemical weathering taking place in the catchment.
Conclusion
In this work, downstream variations in the elemental and Sr isotopic composition of surface waters in the Waitaki River catchment were observed as a function of location at quarterly intervals over a year. In common with previous studies, we have found that the chemical weathering of calcite dominates the dissolved Ca concentrations, particularly high in the catchment, whereas both the absolute and proportional contribution of silicate weathering increases lower in the catchment. The Sr isotopic composition and flux are well explained by mixing of waters that have interacted with the various lithologies within the catchment, particularly in the upper parts of the catchment. Additional data from the parts of the catchment that were not sampled for this study, both surface and ground waters, will test the robustness and consistency of these results.
Table SF1. Cumulative seasonal mean volumes, flows and residence times for water bodies in the Waitaki Catchment (1980-2003)
Download MS Word (77.1 KB)Table SF2. Water and ice sample station locations, descriptions and distance from mouth of the Waitaki River
Download MS Word (102.1 KB)Table SF3. Mineral dissolution reactions of relevant minerals in the Torlesse Terrane and associated equilibrium constants
Download MS Word (69.8 KB)Table SF4. Results of calculations of TDS, Saturation Indices for minerals, and Na/H with water samples from the Waitaki Catchment
Download MS Word (107.6 KB)Acknowledgments
We thank Claudine Stirling, Malcolm Reid and Dave Barr for their generous help with the analyses undertaken in the Centre for Trace Element Analysis. Christine McLachlan, Briar Taylor-Silva and Rebecca Parker guided VP through measuring silica by spectrophotometry. Katrin Wellnitz helped with the analytical work and PHREEQC. Luke Easterbrook-Clarke was a great help with making figures. We thank Michael Bau, Sylvia Sander, Nathalie van Havre and Birthe Kortner for their support during the first water collecting field trip. Thanks to hydrologists Kathy Walter from NIWA and Eddie Stead from Meridian Energy Ltd. for providing unpublished river and canal flow data. Nick Mortimer and two anonymous reviewers provided suggestions that significantly improved this manuscript.
Disclosure statement
No potential conflict of interest was reported by the authors.
Related Research Data
References
- Adams CJ, Graham IJ. 1997. Age of metamorphism of Otago Schist in eastern Otago and determination of protoliths from initial strontium isotope characteristics. New Zealand Journal of Geology and Geophysics. 40:275–286. doi: 10.1080/00288306.1997.9514760
- Adams CJ, Maas R. 2004. Rb-Sr age and strontium isotopic characterisation of the Torlesse Supergroup in Canterbury, New Zealand, and implications for the status of the Rakaia Terrane. New Zealand Journal of Geology and Geophysics. 47(2):201–217. doi:10.1080/00288306.2004.9515048.
- Anderson SP, Drever JI, Humphrey NF. 1997. Chemical weathering in glacial environments. Geology. 25:399–402. doi: 10.1130/0091-7613(1997)025<0399:CWIGE>2.3.CO;2
- Anderson SP, Drever JI, Frost CD, Holden P. 2000. Chemical weathering in the foreland of a retreating glacier. Geochim Cosmochim Acta. 64:1173–1189. doi: 10.1016/S0016-7037(99)00358-0
- Andrews GM, Jacobson AD, Lehn GO, Horton TW, Craw D. 2016. Radiogenic and stable Sr isotope ratios (87Sr/86Sr, δ88/86Sr) as tracers of riverine cation sources and biogeochemical cycling in the Milford Sound region of Fiordland, New Zealand. Geochim Cosmochim Acta. 173:284–303. doi: 10.1016/j.gca.2015.10.005
- Axtmann EV, Stallard RF. 1995. Chemical weathering in the South Cascade Glacier basin, comparison of subglacial and extra-glacial weathering. IAHS Publicat Ser Proc Rep Internat Associat Hydrol Sci. 228: 431–440.
- Berner RA, Lassaga AC, Garrels RM. 1983. The carbonate-silicate geochemical cycle and its effects on atmospheric carbon dioxide over the past 100 million years. Am J Sci. 264:1183–1192.
- Berryman K, Beanland S. 1991. Variation in fault behaviour in different tectonic provinces of New Zealand. J Structural Geol. 13:177–189. doi: 10.1016/0191-8141(91)90065-Q
- Blum JD, Erel Y. 1997. Rb-Sr isotope systematics of a granitic soil chronosequence: The importance of biotite weathering. Geochim Cosmochim Acta. 61:3193–3204. doi: 10.1016/S0016-7037(97)00148-8
- Blum JD, Klaue A, Nezat CA, Driscoll CT, Johnson CE, Siccama TG, Eagar C, Fahey TJ, Likens GE. 2002. Mycorrhizal weathering of apatite as an important calcium source in base-poor forest ecosystems. Nature. 417:729–731. doi: 10.1038/nature00793
- Blum JD, Gazis CA, Jacobson AD, Chamberlain CP. 1998. Carbonate versus silicate weathering in the Raikhot watershed within the High Himalayan Crystalline Series. Geology. 26:411–414. doi: 10.1130/0091-7613(1998)026<0411:CVSWIT>2.3.CO;2
- Calvaruso C, Turpault MP, Frey-Klett P. 2006. Root-associated bacteria contribute to mineral weathering and to mineral nutrition in trees: a budgeting analysis. Appl Environ Microbiol. 72:1258–1266. doi: 10.1128/AEM.72.2.1258-1266.2006
- Chamberlain CP, Waldbauer JR, Jacobson AD. 2005. Strontium, hydrothermal systems and steady-state chemical weathering in active mountain belts. Earth Planet Sci Lett. 238:351–366. doi: 10.1016/j.epsl.2005.08.005
- Cox SC, Sutherland R. 2007. Regional geological framework of South Island, New Zealand, and its significance for understanding the active plate boundary. In: Okaya D, Stern T, Davey F, editors. Vol. 175, A continental plate boundary: Tectonics at South Island, New Zealand. Am Geophys Union Monogr. 19–46.
- Dalai TK, Krishanswami S, Sarin MM. 2002. Major ion chemistry in the headwaters of the Yamuna river system: chemical weathering, its temperature dependence and CO2 consumption in the Himalaya. Geochim Cosmochim Acta. 66:3397–3416. doi: 10.1016/S0016-7037(02)00937-7
- Drever JI, Hurcomb DR. 1986. Neutralization of atmospheric acidity by chemical weathering in an alpine drainage basin in the North Cascade Mountains. Geology. 14:221–224. doi: 10.1130/0091-7613(1986)14<221:NOAABC>2.0.CO;2
- Forsyth PJ. compiler 2001. Geology of the Waitaki area: scale 1:250,000. Lower Hutt: Institute of Geological & Nuclear Sciences Limited. Institute of Geological & Nuclear Sciences. 1:250,000 geologic map 19.64 p. +1 folded map.
- Gaillardet J, Dupré B, Allègre CJ. 1999. Geochemistry of large river suspended sediments: silicate weathering or recycling tracer? Geochim Cosmochim Acta. 63:4037–4051. doi: 10.1016/S0016-7037(99)00307-5
- Gibbs RJ. 1970. Mechanisms controlling world water chemistry. Science. 170:1088–1090. doi: 10.1126/science.170.3962.1088
- Gross EL, Patchett PJ, Dallegge TA, Spencer JE. 2001. The Colorado river system and Neogene sedimentary formations along its course: apparent Sr isotopic connections. J Geol. 109:449–461. doi: 10.1086/320793
- Hodson A, Tranter M, Vatne G. 2000. Contemporary rates of chemical denudation and atmospheric CO2 sequestration in glacier basins: An arctic perspective. Earth Surf Pro Landforms. 25:1447–1471. doi: 10.1002/1096-9837(200012)25:13<1447::AID-ESP156>3.0.CO;2-9
- Jacobson A, Blum J, Chamberlain C, Craw D, Koons P. 2003. Climatic and tectonic controls on chemical weathering in the New Zealand Southern Alps. Geochim Cosmochim Acta. 67:29–46. doi: 10.1016/S0016-7037(02)01053-0
- Jacobson AD, Andrews MG, Lehn GO, Holmden C. 2015. Silicate versus carbonate weathering in Iceland: New insights from Ca isotopes. Earth Planet Sci Lett. 416:132–142. doi: 10.1016/j.epsl.2015.01.030
- Jacobson AD, Blum JD. 2000. Ca/Sr and 87Sr/86Sr geochemistry of disseminated calcite in himalayan silicate rocks from Nanga Parbat: influence on river-water chemistry. Geology. 28:463–466. doi: 10.1130/0091-7613(2000)28<463:SASGOD>2.0.CO;2
- Jin L, Williams EL, Szramek KJ, Walter LM, Hamilton SK. 2008. Silicate and carbonate mineral weathering in soil profiles developed on Pleistocene glacial drift (Michigan, USA): Mass balances based on soil water geochemistry. Geochim Cosmochim Acta. 72:1027–1042. doi: 10.1016/j.gca.2007.12.007
- Kautz CQ, Martin CE. 2007. Chemical and physical weathering in New Zealand’s Southern Alps monitored by bedload sediment major element composition. Appl Geochem. 22:1715–1735. doi: 10.1016/j.apgeochem.2007.03.031
- Kim JP, Hunter KA, Reid MR. 1999. Geochemical processes affecting the major ion composition of rivers in the South Island, New Zealand. Mar Freshwater Res. 50:699–709. doi: 10.1071/MF98128
- Koons PO. 1990. Two-sided orogen: collision and erosion from the sandbox to the Southern Alps, New Zealand. Geology. 18:679–682. doi: 10.1130/0091-7613(1990)018<0679:TSOCAE>2.3.CO;2
- Koons PO, Craw D. 1991. Gold mineralization as a consequence of continental collision: an example from the Southern Alps, New Zealand. Earth and Planetary Science Letters. 103:1–9. doi: 10.1016/0012-821X(91)90145-8
- Lyons WB, Carey AE, Hicks DM, Nezat CA. 2005. Chemical weathering in high sediment-yielding watersheds, New Zealand J Geophys Res. 110:1–11. doi: 10.1029/2005JA011089
- McGowan HA, Sturman AP. 1997. Characteristics of aeolian grain transport over a fluvio-glacial lacustrine braid delta, Lake Tekapo, New Zealand. Earth Surf Proc Landforms. 22:773–784. doi: 10.1002/(SICI)1096-9837(199708)22:8<773::AID-ESP781>3.0.CO;2-O
- Maher K. 2010. The dependence of chemical weathering rates on fluid residence time. Earth Planet Sci Lett. 294:101–110. doi: 10.1016/j.epsl.2010.03.010
- MacKinnon TC. 1983. Origin of the Torlesse terrane and coeval rocks, South Island, New Zealand. Geol Soc Am Bull. 94:967–985. doi: 10.1130/0016-7606(1983)94<967:OOTTTA>2.0.CO;2
- Moore J, Jacobson AD, Holmden C, Craw D. 2013. Tracking the relationship between mountain uplift, silicate weathering, and long-term CO2 consumption with Ca isotopes: Southern Alps, New Zealand. Chem Geol. 341:110–127. doi: 10.1016/j.chemgeo.2013.01.005
- NIWA. 2015. New Zealand National Institute of Water and Atmospheric Research. Tekapo: National Climate Database.
- Norris RJ, Cooper AF. 2001. Late Quaternary slip rates and slip partitioning on the Alpine Fault, New Zealand. J Structur Geol. 23:507–520. doi: 10.1016/S0191-8141(00)00122-X
- Norris RJ, Koons PO, Cooper AF. 1990. The obliquely-convergent plate boundary in the South Island of New Zealand: implications for ancient collision zones. J Struct Geol. 12:715–725. doi: 10.1016/0191-8141(90)90084-C
- Oliva P, Viers J, Dupré B. 2003. Chemical weathering in granitic environments. Chem Geol. 202:225–256. doi: 10.1016/j.chemgeo.2002.08.001
- Palmer MR, Edmond JM. 1992. Controls over the strontium isotope composition of river water. Geochim Cosmochim Acta. 56:2099–2111. doi: 10.1016/0016-7037(92)90332-D
- Parkhurst DL, Appelo CAJ. 2013. Description of input and examples for PHREEQC version 3—A computer program for speciation, batch-reaction, one-dimensional transport, and inverse geochemical calculations: U.S. Geological Survey Techniques and Methods, book 6, chap. A43, 497 p., available at http://pubs.usgs.gov/tm/06/a43.
- Pettinger VL. 2016. Temporal and spatial composition of water dissolved load in a temperate-glaciated catchment, the Waitaki Catchment, South Island, New Zealand [MSc thesis]. University of Otago, 84 pp.
- Purdie JM, Bardsley WE. 2010. Seasonal prediction of lake inflows and rainfall in a hydro-electricity catchment, Waitaki river, New Zealand. Int J Climatol. 30:372–389.
- Raymo ME, Ruddiman WF. 1992. Tectonic forcing of late Cenozoic climate. Nature. 359:117–122. doi: 10.1038/359117a0
- Smits MM, Bonneville S, Benning LG, Banwart SA, Leake JR. 2012. Plant-driven weathering of apatite – the role of an ectomycorrhizal fungus. Geobiology.10:445–456. doi: 10.1111/j.1472-4669.2012.00331.x
- Strickland JD, Parsons TR. 1972. A practical handbook of seawater analysis. Ottowa, Canada: Minister of Supply and Services. 311 p.
- Toy VG, Prior DJ, Norris RJ, Cooper AF, Walrond M. 2012. Relationships between kinematic indicators and strain during syn-deformational exhumation of an oblique slip, transpressive, plate boundary shear zone: the Alpine Fault, New Zealand. Earth Planet Sci Lett. 333–334: 282–292. doi: 10.1016/j.epsl.2012.04.037
- Velbel MA. 1993. Temperature dependence of silicate wreathing in nature: how strong a negative feedback on long-term accumulation of atmospheric CO2 and global greenhouse warming? Geology. 21:1059–1062. doi: 10.1130/0091-7613(1993)021<1059:TDOSWI>2.3.CO;2
- Weis D, Kieffer B, Maerschalk C, Barling J, deJong J, Williams GA, Hanano D, Pretorius W, Mattielli N, Scoates JS, et al. 2006. High-precision isotopic characterization of USGS reference materials by TIMS and MC-ICP-MS. Geochem Geophys Geosyst. 7:Q08006. doi:10.1029/2006GC001283.
- White AF, Blum AE. 1995. Effects of climate on chemical weathering in watersheds. Geochim Cosmochim Acta. 59:1729–1747. doi: 10.1016/0016-7037(95)00078-E