
ABSTRACT
We describe ductile-to-brittle structures across the Footwall Fault directly below the Hyde-Macraes Shear Zone in the Otago Schist. These indicate that pervasive deformation along the Footwall Fault was due to northeast–southwest crustal extension. Structures below the Footwall Fault are ductile top-to-the-northeast extensional shear bands that formed in a penetrative lower greenschist facies foliation. With progressive deformation, shear bands formed at higher angles to the foliation, culminating in the shear bands being cut by low- and high-angle normal faults. In the hanging wall, extensional structures are much less pervasive and comprise a few high-angle normal faults. This sharp contrast in structural evolution of footwall and hanging wall resembles the tectonic evolution of major extensional shear zones worldwide. We propose that mid Cretaceous normal movement on the low-angle Footwall Fault accompanied the formation of the steeper Waihemo Fault further north. On a regional scale, much of the boundary between the Otago Schist core and its northern flank is cut by mid Cretaceous normal faults. Zircon fission-track ages from the footwall range from 79 ± 13.7 to 46.1 ± 6.2 Ma (2σ uncertainties) and young in the direction of hanging wall transport. One sample from the hanging wall yielded a zircon fission-track age of 76 ± 12.9 Ma. The fission-track ages are hard to interpret as zircon across the fault zone was affected by partial or full annealing. In part, the ages confirm mid Cretaceous movement but may also be interpreted to suggest additional reactivation of the Footwall Fault at slow inferred slip rates.
Introduction
A problem related to debates about exhumation, including that of the Otago Schist, is how shortening- and extension-related structures can be distinguished in the field, and also how old these structures are and what the rate of exhumation was. Regional mapping and analysis of deformation fabrics including mylonitic foliations, stretching lineations and shear-sense indicators are powerful tools for constraining the kinematic significance of tectonic contacts. However, in many cases it is still problematic to decide whether a tectonic contact results from horizontal shortening or extension. For example, typically used arguments like low-grade rocks emplaced over high-grade rocks or older over younger rocks can be ambiguous (Ring and Brandon Citation1994; Wheeler and Butler Citation1994; Ring Citation1995). Geochronology can often make a key contribution to better understand the nature of tectonic contacts. Low-temperature thermochronology works especially well for late-orogenic extensional contacts as this method allows relatively rapidly cooled footwall rocks with younger cooling ages to be distinguished from much more slowly cooled rocks with older cooling ages in the hanging wall (Thomson Citation1998; Ring et al. Citation1999). Also, low-temperature cooling ages usually result in age trends that can be reconciled with the kinematics of a fault if sampling was done in a systematic fashion (Foster and John Citation1999; Brichau et al. Citation2006; Thomson and Ring Citation2006).
The Otago Schist is a well-known regional metamorphic belt that transects the continent of Zealandia (). It formed by crustal thickening and associated regional metamorphism in a Mesozoic accretionary wedge (Gray and Foster Citation2004; Rahl et al. Citation2011; Mortimer et al. Citation2012). Although there is consensus on the broad accretionary wedge setting, there is controversy about how and when the schist was exhumed from the time of prograde metamorphism to when it was eroded by a Late Cretaceous (c. 85 Ma) marine unconformity (Forsyth Citation2001). Little et al. (Citation1999) proposed that Early Cretaceous crustal thickening might have led to destabilisation of the wedge in the late Early Cretaceous causing syn-orogenic normal faulting in its rear (schistose) part at c. 130–125 Ma. Deckert et al. (Citation2002) developed an exhumation model of regional scale normal faulting creating a high-angle fault system in the Otago Schist flanks that was coeval with low-angle structures in the schist core region at c. 110 Ma. On the basis of 40Ar/39Ar white mica ages, Gray and Foster (Citation2004) proposed a model, with c. 150–130 Ma accretionary wedge-related cleavage and folding preserved in the low-grade schist flanks, and c. 115–105 Ma overprinting extensional shear zones in the schist core. The main difference from the Little et al. model is that the extensional structures formed distinctly later than the shortening ones, which is in line with Deckert et al. (Citation2002). Forster and Lister (Citation2003) proposed a core-complex type model for the Otago accretionary wedge in which the schist core was exhumed as the result of the operation of large-scale extensional ductile shear zones between the core and the flanks.
Figure 1. A, Terrane map of South Island of New Zealand showing Otago Schist in central Otago; box shows location of . B, Northeast–southwest cross section showing overall structure of Mesozoic subduction system that formed Otago Schist; Waihemo Fault (WF) and Footwall Fault (FF) shown schematically. Inset, Zealandia with North (NI) and South Island (SI) of New Zealand and New Caledonia (NC).
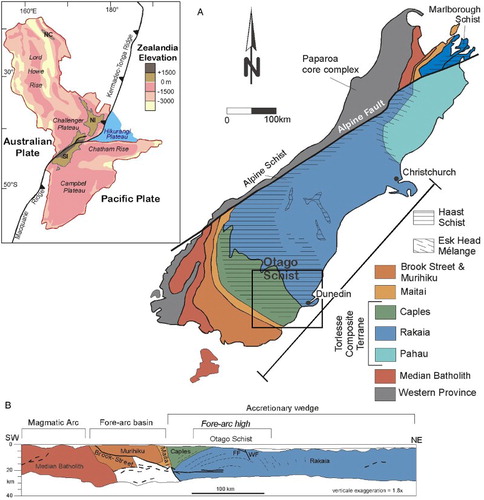
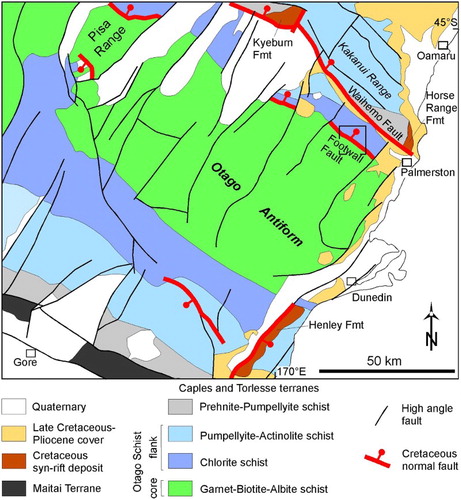
Figure 2. Tectonic map of Otago Schist and adjacent terranes showing metamorphic facies zones. Also shown Footwall and Waihemo faults, other Cretaceous normal faults and Cretaceous syn-rift deposits; note that Waihemo Fault cuts metamorphic zonation. Waipounamu Erosion Surface is part Late Cretaceous to Pliocene cover. Box outlines location of .
Here, we present new field and petrographic data in a c. 10 km long transect across the northern Otago Schist, specifically across the Footwall Fault at the base of the Hyde-Macraes Shear Zone (Butz Citation2007). We show pervasive ductile to brittle–ductile top-to-the-northeast shearing in the footwall and interpret the Footwall Fault to be a low-angle normal fault. New zircon fission-track (ZFT) data from the transect yielded complicated results that, in part, confirm mid Cretaceous movement but are also permissive of some Eocene reactivation and/or partial to full annealing.
Geologic setting
Otago Schist
Much of Zealandia and New Zealand is made up of batholiths and accreted terranes that are interpreted as a Gondwana margin Mesozoic subduction complex (). The Otago Schist is an integral part of this orogen and forms an antiformal 150 km wide belt that strikes parallel to the regional structural grain (). Metamorphic grade ranges from prehnite–pumpellyite facies along the northeast and southwest flanks of the Otago antiform, to greenschist facies along its core. Maximum P–T conditions are estimated to be 0.8–1.0 GPa and 350–400 °C in the core of the Otago culmination (Mortimer Citation2000). The penetrative foliation is generally flat lying in the schist core and southwestern flank, and steep on the northeastern schist flank.
Most of the volume of the Otago Schist () comprises imbricated and metamorphosed greywacke and argillite of the Permian–Triassic Rakaia Terrane, part of the larger Carboniferous–Early Cretaceous Torlesse Composite Terrane (Forsyth Citation2001; Mortimer et al. Citation2014). Younger accreted parts of the Torlesse Composite Terrane occur to the northeast, towards the paleo trench. Southwest of the schist, the Permian ophiolitic Maitai Terrane comprises a semi-rigid backstop to the Torlesse accretionary wedge (Mortimer et al. Citation2012). The Mesozoic subduction-related magmatic arc is the Median Batholith, located in the southern part of the South Island (). The igneous suites within the Median Batholith indicate semi-continuous subduction from at least 260 to 105 Ma (Mortimer et al. Citation2014). The age of prograde regional metamorphism and deformation within the Otago Schist accretionary wedge is more restricted; the oldest 40Ar/39Ar K-feldspar and white mica ages of schist free from detrital micas (all from the schist flanks) are c. 170–160 Ma (Little et al. Citation1999; Mortimer et al. Citation2012) with many ages in the core ranging as young as c. 105 Ma (Gray and Foster Citation2004). Overall, the age data reflect that the steep flanks formed before 140 Ma and that moderate high-pressure metamorphism and deformation occurred in the flat-lying schist core after 135–125 Ma (Mortimer, Craw, et al. Citation2016). This interpretation highlights that the age data are not the result of a single metamorphic event and subsequent heterogeneous overprints, but rather reflect various fabric-forming events (mica growth) at 135–125 Ma and 110–100 Ma.
Deeply buried parts of the Otago Schist reached the surface at c. 112–110 Ma, as indicated by the first appearance of schist fragments in the Kyeburn and Horse Range formations, Momotu Supergroup sedimentary graben fill related to Albian rifting (; Laird and Bradshaw Citation2004; Tulloch et al. Citation2009; Mitchell et al. Citation2009, Citation2014). This age approximates to the generally accepted age of cessation of long-lived Gondwana margin subduction (110–100 Ma; Tulloch et al. Citation2009). A widespread, transgressive marine breakup unconformity, the Waipounamu Erosion Surface, is cut into schist and Momotu Supergroup. In the eastern part of the Otago Schist, this unconformity is Late Cretaceous (c. 85 Ma) in age.
Footwall Fault and Hyde-Macraes Shear Zone
The Hyde-Macraes Shear Zone is a major low-angle ductile-to-brittle shear zone at the northern margin of the Otago Schist. It dips 20–35° northeast (subparallel to foliation in the hanging wall and footwall blocks), and hosts important gold mineralisation (Teagle et al. Citation1990; Forsyth Citation2001; Craw and Mackenzie Citation2016; Mortimer, Craw, et al. Citation2016; Allibone et al. Citation2017). In this paper we follow recent usage (Petrie and Craw Citation2005; Mortimer, Craw, et al. Citation2016) and distinguish between the thrust-type Hyde-Macraes Shear Zone and the Footwall Fault directly beneath the Hyde-Macraes Shear Zone (e.g. figure 3 in Mortimer, Craw, et al. Citation2016). Since the work of Mortimer (Citation2000), the Footwall Fault is known to separate greenschist-facies garnet–biotite albite zone schist in the footwall block from complexly deformed, sheared and mineralised greenschist-facies chlorite zone schist in the hanging wall (). This low-grade over high-grade structural relationship has been interpreted to yield a net-normal sense of offset.
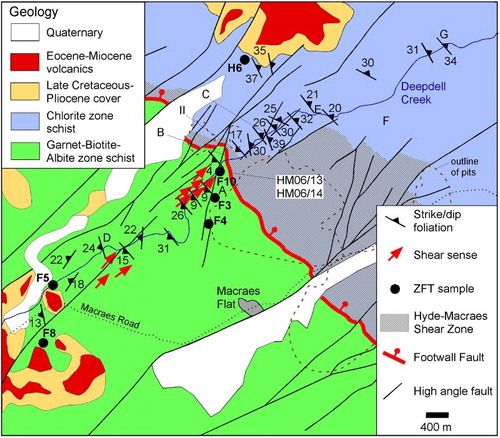
Figure 3. Simplified geological map of Deepdell Creek and adjacent Macraes gold mine (based on Bleakley and Yeo Citation1997; Forsyth Citation2001). Summary of structural measurements along Deepdell Creek transect, locations of photographs shown in , , and and localities of zircon fission-track (ZFT) samples H6, F3-5, F8 and F10 shown. Note that Hyde-Macraes Shear Zone varies considerably in thickness and gets very thin in Deepdell Creek transect.
The Hyde-Macraes Shear Zone is basically comprised of a schist package of 2–125 m structural thickness of semi-brittlely and brittlely sheared, veined, silicified, gold-mineralised and graphitised schist above the Footwall Fault. The top of the Hyde-Macraes Shear Zone is defined in many places by a hanging wall shear across which there is an abrupt transition to more intact schist. More widely separated foliation-subparallel faults and shears, some mineralised, occur at higher structural levels in the hanging wall block (). Deformation within the sheared and mineralised Hyde-Macraes Shear Zone schist package has been reported as being thrust related (McKeag et al. Citation1989; Teagle et al. Citation1990; Winsor Citation1991; Petrie and Craw Citation2005; Begbie and Craw Citation2006). To a large degree, the horizontal shortening interpretation relies on shallow-dipping veins interpreted to have formed by near-vertical extension during horizontal shortening deformation. These veins are thought to be related to the development of duplex systems and are considered flanking structures (Teagle et al. Citation1990, their figure 5) indicating that they have rotated after their formation. Various directions for thrusting have been proposed. Teagle et al. (Citation1990) determined the thrust transport direction using tight, brittle–ductile asymmetric folds and their directions range widely from top-to-the-west to top-to-the-southeast. The inferred directions of movement are at a high angle to the strike of the Hyde-Macraes Shear Zone (Teagle et al. Citation1990). Jones et al. (Citation2007) reported a top-to-the-west–northwest direction of thrusting. They inferred the thrusting direction to be perpendicular to the line of intersection of steeply dipping duplex shears with the bounding duplex shears. Begbie and Craw (Citation2006) analysed gold-bearing stockwork veins and concluded from the vein geometry that the deformation was by horizontal northwest–southeast extension and vertical shortening. They proposed that the horizontal extension deformation is a local perturbation in an overall shortening setting. None of the above studies reported any tectonic transport direction indicators like stretching lineation. In general, there is a lack of published structural analyses of the Hyde-Macraes Shear Zone showing a well-defined direction of thrusting. Mortensen et al. (Citation2010) place the time of the shortening-related mineralisation in the Hyde-Macraes Shear Zone between 140 and 135 Ma.
On the regional scale, the Footwall Fault is one of several low-angle normal shear zones that have been identified within the Otago Schist (Winsor Citation1991; Deckert et al. Citation2002; Mortimer, Craw, et al. Citation2016) (). Some 10 km to the northeast from the Footwall Fault, and across strike, is the Waihemo Fault, which dips at 60 °C to the northeast (; Forsyth Citation2001). The presence of Momotu Supergroup strata and pumpellyite–actinolite facies schist north of the fault attest to normal fault movement in the mid Cretaceous (< 112 Ma); but it has been reactivated in the Neogene as a north-side-up reverse fault. The Kakanui Range to the north reaches elevations of up to 1500 m compared with 600 m near Macraes.
The current dip of 20–35° of the Footwall Fault does not mean that such a dip was applicable to the fault at the time of its activity. However, the overall schist architecture is sealed by the Late Cretaceous unconformity near the Otago coast. Therefore, the gentle northeast dip on the Footwall Fault was acquired by this time. As shown by Forsyth (Citation2001), the contacts between Late Cretaceous to Miocene formations are subparallel to contour lines. Hence, dips are gentle and large tilts unlikely. Furthermore, the 60° dip of Waihemo Fault is most likely be an original normal fault dip angle. This reasoning makes it probable that the gentle northeast dip of the Footwall Fault is close to the original dip angle of the fault, which would mimic a thrust dip angle of c. 30° of the Hyde-Macraes Shear Zone.
Methods
The structural observations for this paper were collected as part of an MSc study (Butz Citation2007) and represent c. 30 days of fieldwork. Standard thin sections were made from oriented samples.
We sampled for ZFT dating in order to help bracket the timing of local schist exhumation, and also movement on the Footwall Fault. Our samples lie in a transect at different structural depths () but, almost by definition, are close to the Waipounamu Erosion Surface. The closure temperature for fission tracks in zircon may approximately coincide with the brittle–ductile transition (Stöckhert et al. Citation1999; Brix et al. Citation2002; Thomson et al. Citation2009; Ring et al. Citation2017), so can potentially be linked to the observed structures. For pristine zircon with no accumulation of radiation damage total annealing may require temperatures above c. 310 ± 20 °C, with partial annealing on geological time scales down to c. 250 ± 20 °C (Tagami Citation2005). Although these temperatures are lower in zircon with high accumulated radiation damage (Brandon et al. Citation1998; Rahn et al. Citation2004), with partial annealing zone temperatures between c. 230 and 180 °C for hold times of c. 15–30 Ma during slow cooling (Reiners and Brandon Citation2006).
Chi-square [P(χ2)] values of > 5% indicate that all grain ages of a sample most likely belong to a single grain-age population. For P(χ2) values of c. 1–5% the likelihood is high that two or more grain-age components are present. For P(χ2) values of < 1% it is certain that the sample contains two or more grain-age components (Galbraith Citation2005). Furthermore, the grain-age dispersion is an indicator of the presence of two or more grain-age components in the observed age distribution of a sample. In general, if the P(χ2) values are high, the percentage of age dispersion is low and vice versa. The presence of two or more age components is also reflected in radial plots with grains plotting outside the ± 2σ range on the Y-axis of the radial plot, whereas in case of a single age component (given by the central age) all grains should plot within the ± 2σ range. Using binomial peak fitting different grain-age components can be determined (Brandon Citation2002).
Zircons aliquots were mounted in Teflon® sheets, polished and etched at 228 °C for 10–20 h. Using the external detector method, muscovite sheets were attached to each sample mount. All samples were irradiated together with CN1 and IRMM540R dosimeter glasses and Fish Canyon Tuff and Buluk Tuff age standards at the FRM II reactor in Garching, Germany. Central ages (Galbraith and Laslett Citation1993), quoted with 2σ uncertainties, were calculated using the IUGS recommended Zeta-calibration approach of Hurford and Green (Citation1983), which allows for non-Poissonian variation within a population of single-grain ages belonging to an individual sample. For all samples fission-tracks were counted dry at ×1250 magnification using an Olympus BH2 microscope at the ISTerre Thermochronology laboratory at Université Grenoble Alpes, France.
Meso-structural observations
We conducted a detailed study of mesoscopic structural features in Deepdell Creek, focusing on structures from which tectonic transport, shear sense criteria and their evolution in space and time could be obtained (). Rock exposure is moderately good, but not continuous in Deepdell Creek. Our transect crosses the Footwall Fault and Hyde-Macraes Shear Zone while avoiding the open pits.
Footwall schist
The footwall block, structurally below the Footwall Fault, consists of garnet–biotite–albite zone psammitic schist that becomes more pelitic and thickly segregated towards the Footwall Fault. Penetrative ductile structures dominate the footwall and brittle–ductile to brittle structures progressively overprint the ductile structures towards the Footwall Fault. The Footwall Fault is not exposed as a discrete, identifiable structure in Deepdell Creek, but its location can be mapped to within a few metres.
At the southwest end of the transect, the pervasive foliation is moderately south-dipping and, over 1–3 km, gradually changes into a subhorizontal orientation close to the Footwall Fault (). On foliation planes there is a penetrative northeast-trending stretching lineation expressed by elongated quartz–albite aggregates and smeared chlorite and muscovite grains (). Associated with the foliation and the stretching lineation are northeast-dipping shear bands, which supply a consistent top-to-the-northeast sense of shear (A). The shear bands start to develop c. 3 km southwest of the Footwall Fault and become more prominent towards it. The foliation and foliation-parallel quartz veins are dragged into the shear bands. In thin section, the schist is segregated into quartz–albite and muscovite–chlorite laminae (). Quartz shows abundant subgrains and is recrystallised within the shear bands. Muscovite and chlorite flakes are bent into the shear bands and small new muscovite and chlorite grains have grown in the shear bands.
Figure 4. Stereographic projections of structural data. Foot- and hanging wall relative to Footwall Fault.
Figure 5. Structures in footwall of Footwall Fault. A, Footwall schist c. 150 m below Footwall Fault. Shear bands (marked by half arrows) and S-folds (arrow) provide consistent top-to-the-northeast shear sense; loaclity B. B, Brittle-ductile top-to-the-northeast displacing low-angle shear zones northeast of Deepdell settlement; locality D. C, Prominent normal fault c. 400 m below Footwall Fault with well-developed gouge layers; note two small-scale, subparallel normal faults to southwest; locality A. D, Array of high-angle normal faults c. 50 m below Footwall Fault; locality C. In B–D, normal faults highlighted by half arrows. Refer to for localities.
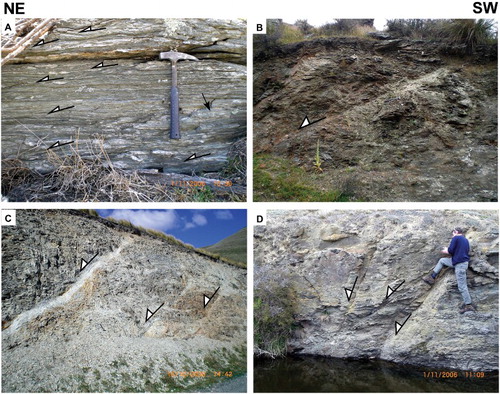
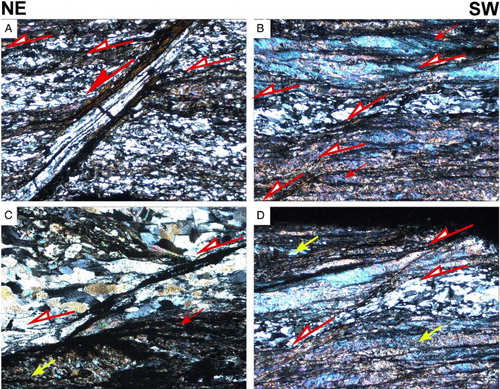
Figure 6. Photographs of footwall microstructures indicating top-to-the-northeast shear sense. A, Sample HM06/13 showing prominent c. 45°-dipping shear band (large red arrow) cutting through penetrative foliation; quartz dynamically recrystallises in shear-band structure; more small-scale shear bands (small red arrows with open arrowheads) formed in other parts of thin section and cut by c. 45°-dipping shear band; scale bar 1 mm. B, Shear bands in micaceous schist with thick quartz vein, sample HM06/14-2; note dynamic recrystallisation in shear bands; larger quartz crystals show subgrain development and deformed by shear bands; note S-C fabric in mica-rich parts of photo (full arrows); only few shear bands highlighted; scale bar 500 µm. C, Shear bands in quartz laminae and S-C fabrics in muscovite-rich layers; sample HM06/14-3; note that quartz shows grain-size reduction by recrystallisation in shear band. Mica-rich sections at bottom of thin section shows older crenulation cleavage (yellow arrow) deformed by shear band cleavage; red arrows as in B; scale bar 1 mm. D, Similar shear band structures as in A, quartz grain-size reduction and old crenulation cleavage as in C; sample HM06/14-3; arrows as in C; scale bar 1 mm. For sample locations refer to .
Brittle low-angle and high-angle normal microfaults are common in the footwall schist (B–D). The normal faults cut the penetrative foliation and associated structures and their fault planes contain striations. Displacement varies from < 1 to a few metres. All but a few of the normal faults dip to the northeast. Fault-slip analysis in these normal faults provides a consistent northeast-southwest oriented extension direction, i.e. parallel to the stretching lineation on the penetrative foliation ().
Figure 7. Fault-slip analysis below the Footwall Fault; diagram shows great circle of fault plane and projected trace of slickenside lineation in lower-hemisphere equal-area projection; principal strain axes (X > Y > Z) shown, deduced extension direction (X) are indicated by hatched diverging arrows.
Intra-shear schist
In contrast to the footwall block, schist immediately above the Footwall Fault is highly fractured and characteristically shows abundant black cataclastic shear planes. In Deepdell Creek, the true structural thickness of this package cannot be quantified due to poor exposure. However, the thickness cannot exceed 10–20 m as constrained by the exposure of foot- and hanging wall schist. The overall deformation style is cataclastic and earlier penetrative structures are obscured. Prominent metre-scale brittle to brittle–ductile shear zones are frequent and often contain millimetre to centimetre thick weakly consolidated gouge layers (A, B). The cataclastic foliation is subhorizontal to moderately north dipping. Parts of the intra-shear schist are brecciated (A). In general, Riedel shears and foliation curvature show that the north-dipping brittle to brittle–ductile shear zones provide a top-to-the-northeast sense of shear but sometimes the shear sense is ambiguous (). Late northeast-dipping normal faults (C) cut through the shallower cataclastic shear zones. The intra-shear schist basically represents the Hyde-Macraes Shear Zone.
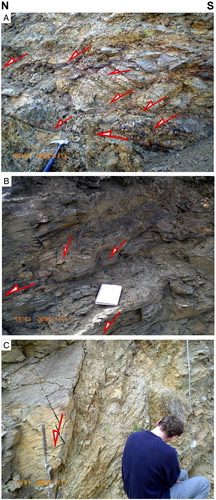
Figure 8. Structures in intra-shear schist (i.e. Hyde-Macraes Shear Zone). A, Subhorizontal brittle shear zone with high angle normal faults mainly above subhorizontal shear zone; relative displacement marked by red arrows showing top-to-the-north shearing. B, Similar structure as in A with less abundant high angle normal faults. C, Steeply northwest-dipping c. 40 cm thick normal fault. All photographs from locality II in .
Hanging wall schist
The hanging wall block above the Hyde-Macraes Shear Zone is made up of structurally coherent thinly segregated chlorite zone schist. The foliation commonly dips gently to moderately to the northeast ( and ). Sporadic folds of the main foliation are tight to open with north-dipping axial planes (A). The folds are at the decimetre scale and depending on mica content have rounded hinges. More prominent structures are centimetre-sized kink bands that dip to the south (B). The latest generation and most conspicuous structures are N-dipping normal microfaults with millimetre to centimetre offsets (C, D). At the northern end of Deepdell Creek, a low-angle normal fault subparallel to the regional foliation has associated Riedel shears indicating top-to-the-northeast displacement (C). Southwest-dipping normal faults occur as well but are less frequent (D). Fault-slip analysis in these late normal faults indicates northeast–southwest extension ().
Figure 9. Structures in hanging wall of Footwall Fault. A, Southwest-verging fold associated with northwest-dipping axial planes (dashed red lines); outcrop C. B, Kink bands with steeply dipping axial planes; kink axes on foliation planes marked by ‘corrugations’ (red arrows); outcrop F. C, Northeast-dipping normal fault with associated Riedel shears (yellow arrows); outcrop G. D, Northeast-dipping normal fault truncating foliation; outcrop E. Refer to for locations of outcrops.
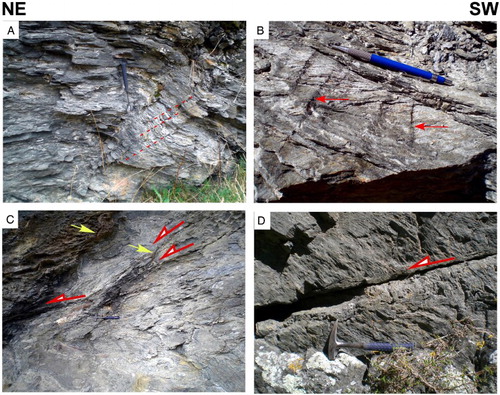
Figure 10. Fault-slip analysis in hanging wall of Footwall Fault. Data set mainly composed of southwest- and northeast-dipping normal faults with few cross faults.
Zircon fission-track dating
Data
Overall, the zircon yield in each sample was rather poor and many zircons were not countable because of inclusions, fractures, strong zoning or high track densities. This is why only 10–16 grains were analysed per sample. Given the lithologies, metamorphic history and ZFT cooling ages, the zircons analysed cannot be regarded as pristine, but rather significantly radiation damaged by the time they cooled below the ZFT closure temperature. Because the closure temperature also depends on the cooling rate, we used the Age2edot program of Brandon (see Ehlers et al. Citation2005) to relate closure temperature, cooling rate and exhumation rate to different thermal gradients (), which indicates that the effective closure temperature during mid Cretaceous/Eocene cooling of radiation damaged zircons was most likely in the range of 210–225 °C.
Table 1. Erosion rate, fission track age, closure depth, temperature and cooling rate as function of thermal gradient calculated with 1D thermal advection model Age2edot.
The analysed grains have typical uranium concentrations between 200 and 400 ppm. The five samples from the footwall yielded ZFT ages ranging from 79 ± 13.7 to 46.1 ± 6.2 Ma; sample H6 from the hanging wall yielded an age of 76 ± 12.9 Ma (, ). All samples pass the chi-square test, but samples F5 and H6 (A, B) show relatively large age dispersions (17–18%) with grains plotting outside of the ± 2σ range. When analysed with the Binomfit program of Brandon (see Ehlers et al. Citation2005), H6 has despite the small number of analysed grains two separated age peaks. The older peak is at 94.2 ± 25 Ma (43% of analysed grains), whereas the younger peak is at 60.7 ± 15.3 Ma (57% of analysed grains) (A). The age distribution in a radial plot (A) shows typical signals of partially annealed ZFT ages (Galbraith Citation2005). Half of the grains show initial cooling at c. 100 Ma and the other half shows apparent cooling at c. 50 Ma after partial annealing.
Figure 11. Radial plots of five footwall and one hanging wall sample from Hyde-Macraes Shear Zone. Plots made with Radial Plotter program of Vermeesch (Citation2009).
Table 2. Zircon fission-track ages.
From the footwall samples, F5 also provides two peaks at 82.8 ± 23.6 Ma (25% of analysed grains) and 52.0 ± 9.7 Ma (75% of analysed grains) (B). Sample F8 has a ZFT central age of 79 ± 13.7 Ma with low age dispersion (C). Nonetheless, looking at the single grain age data (File S1), c. 30% of the analysed grains have apparent cooling ages older than 95 Ma and are more consistent with show cooling through the ZFT partial annealing zone starting at c. 95 or 100 Ma. Sample F10 has one grain with an apparent cooling age of over 100 Ma (D); however, all the other grain ages range between 34 and 65 Ma and the central age is 46.2 ± 6.2 Ma. The results for samples F3 and F4 (E, F) are similar to F10 and also have no dispersion with central ages between 52.8 ± 9 and 46.6 ± 7.2 Ma.
The data show that there is a break towards an older age across the Footwall Fault (A), which hinges on one single ZFT central age of 76 ± 12.9 Ma (sample H6) in the hanging wall. H6 was collected c. 8 km off-transect from Deepdell Creek and the age of this sample is almost identical to sample F10 in the footwall.
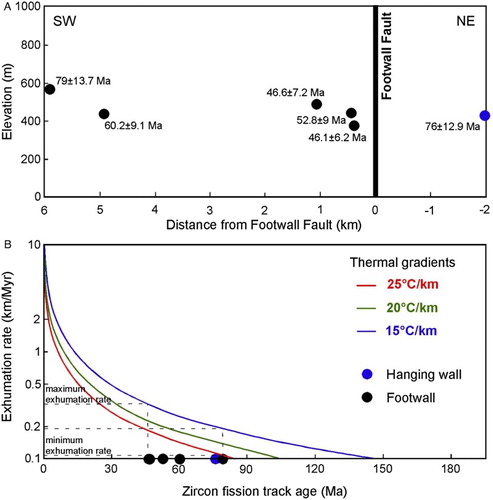
Figure 12. A, Position of zircon fission-track (ZFT) samples with respect to elevation and distance to Footwall Fault; ZFT ages given as central ages with 2σ uncertainties; note small elevation difference between samples. B, Relationship between ZFT age and exhumation rate for three thermal gradients (15, 20 and 25 °C/km) calculated, thermal parameter input for 1D thermal advection model Age2edot of Brandon (see Ehlers et al. Citation2005) kept constant; stippled lines indicate maximum and minimum exhumation rate depending on zircon fission track age and assumed thermal gradient; average long-term exhumation rates c. 0.2 ± 0.1 km/Ma.
Age versus distance relationships
The central ages of the footwall samples show an age trend with ages younging northeastward in the direction of hanging wall transport (A). Age/distance relationships of the footwall ZFT ages provide a crude estimate on the slip rate of c. 100–150 m/Ma. However, this estimate would only be true if the ZFT data were related to fault activity alone. Because of the large uncertainties of our ages and the very slow cooling, this slip rate is poorly defined and further discussed below.
Discussion
Shear zone kinematics
Our main finding is that ductile extensional shear bands are pervasive in the footwall of the Footwall Fault where they robustly indicate top-to-the-northeast shearing at lower greenschist-facies conditions. The top-to-the-northeast shear bands are associated with a well-expressed stretching lineation, which tracks the tectonic transport direction during shearing. The macroscopic curvature of the main foliation in the footwall and the microstructures are also indicative of ductile top-to-the-northeast shear (). When the footwall block was exhumed through the brittle–ductile transition, abundant brittle low- and high-angle normal faults formed. These brittle faults have the same kinematics as the earlier ductile shear bands, which suggests kinematic coordination between these structures.
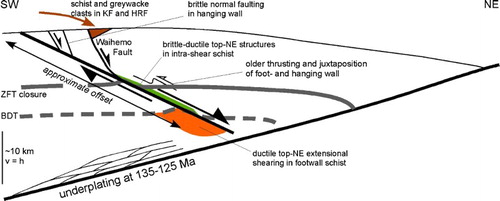
Figure 13. Tectonic interpretation for Footwall Fault, see text for explanation. Broad temperature constraints on deformation structures suggest footwall cooling during exhumation of > 200 °C; assumed 20 °C/km thermal gradient results in > 10 km throw, translating into > 20 km of displacement for 30° dipping Footwall Fault. ZFT closure, approximate closure depth for zircon fission tracks; BDT, brittle–ductile transition; KF, Kyeburn Formation; HRF, Horse Range Formation (KF and HRF part of the Momotu Supergroup).
In the intra-shear schist immediately above the Footwall Fault, both brittle and brittle–ductile structures dominate. Brittle normal faults are found mainly close to the Footwall Fault, but also occur away from it. In general, the kinematics of brittle to brittle–ductile deformation in the intra-shear schist is similar to the ductile structures in the footwall of the intra-shear schist ().
The hanging wall block does not show any ductile top-to-the-northeast shear bands. Extensional deformation is instead mainly expressed by brittle low- and high-angle normal faults, most of which dip northeast, but with some conjugate southwest-dipping faults as well. Asymmetric folds in the hanging wall block suggest top-to-the-southwest shortening preceding top-to-the-northeast extension ().
In summary, top-to-the-northeast structures in Deepdell Creek are ductile in the footwall, brittle to brittle–ductile in the intra-shear schist and brittle in the hanging wall. Such a spatial arrangement of structures is commonly observed in extensional fault systems around the world (Lister and Davis Citation1989; Platt Citation1993; Ring Citation2014). An extensional interpretation is in line with the probable northeast dip of the Footwall Fault at the time of its activity, which together with the top-to-the northeast shear sense indicates normal faulting. Therefore, an important new contribution of our work is that mesoscopic extensional structures are a significant structural element above, within and below the Footwall Fault, and that extension across the Footwall Fault commenced at relatively deep levels in the Mesozoic accretionary wedge. The displacement was likely > 20 km ().
Timing of deformation
Specific constraints on movement along the Footwall Fault are lacking but several indirect lines of evidence are relevant. From the compilation of 40Ar/39Ar ages of Mortensen et al. (Citation2010) it appears that the extensional structures and Footwall Fault would have been active at c. 106 to 101 Ma. Ages of 110–100 Ma for extensional ductile shearing are common in the Otago Schist (Forster and Lister Citation2003; Gray and Foster Citation2004). The occurrence of schist fragments in the Albian Kyeburn Formation (Mitchell et al. Citation2009) represents a maximum age for the exhumation of the Otago Schist and suggests that extensional deformation was underway by c. 112–110 Ma (Tulloch et al. Citation2009). The Henley Formation near Dunedin () has probably similar ages. Our ZFT ages are significantly younger than these 40Ar/39Ar and stratigraphic constraints, but the period 105–85 Ma was a time of protracted extensional deformation across Zealandia (Tulloch et al. Citation2009; Mortimer, Kohn, et al. Citation2016). Arguably, ZFT ages of samples H6, F5, F8 and F10 support extensional shearing and cooling at 105–85 Ma.
The hanging wall of the Footwall Fault is the footwall of the Waihemo Fault to the northeast (), which is marked by a jump from 116–104 Ma ZFT ages in the footwall to 198–136 Ma ages in the hanging wall. This indicates that the Footwall Fault was itself exhumed by normal faulting and erosion. Because the ZFT ages to the east of sample H6 are in the 116–104 Ma range it may be reasonable to assume that normal faulting on the Waihemo Fault had stopped by c. 100 Ma and the study area was afterwards exhumed by slow erosion since c. 100 Ma. Rocks with c. 100 Ma ZFT cooling ages at the surface today indicate a long-term average exhumation rate of c. 0.1 km/Ma (assuming an average closure temperature of 215 ± 20 °C, surface temperature of 15 °C and a thermal gradient of 20 °C/km; ). In general, the break in ages across the Footwall Fault is matched by a break in white mica 40Ar/39Ar ages, which are c. 160–130 Ma in hanging wall schist and < 110 Ma in footwall and intra-shear schist (Gray and Foster Citation2004; Mortensen et al. Citation2010).
Comparison to regional zircon fission-track data
We acknowledge that our ZFT ages have large uncertainties due to the low number of grains analysed, low track counts because of small available counting areas, and very slow cooling at rates of < 4 °C/Ma (). Before discussing our ZFT ages it seems warranted to show that they compare with other ages from the Otago Schist region. Although spatially not close, our ZFT ages are similar to the published ZFT datasets of Kamp et al. (Citation1989) and Tippett and Kamp (Citation1993) from schist c. 100 km northwest and west at Lindis Pass and the Pisa Range of similar metamorphic grade. Chlorite zone schist gives ZFT ages of 76–73 Ma and garnet-biotite-albite zone schist 109–71 Ma. ZFT ages <70 Ma in schist are usually found much further west where fission-track partial annealing zones were exhumed in the Neogene from greater depths than in eastern Otago. In this regard, our older ZFT ages from the hanging- and footwall (c. 79 and 76 Ma respectively) are comparable to ZFT ages from Otago Schist elsewhere. The older 2σ age uncertainties of c. 93 and 89 Ma lie well within the known 105–85 Ma age range of widespread Gondwana rifting that culminated in the separation of Zealandia from West Antarctica and correspond to exhumation-related low temperature thermochronological ages from across southern Zealandia (Mortimer, Kohn, et al. Citation2016).
Possible interpretations of the zircon fission-track ages
The ZFT footwall ages show a systematic and robust age trend with ages becoming gradually younger towards the northeast in the direction of hanging wall movement. This trend suggests that there is no random variability in the data. The observed age trend cannot be explained by slow cooling through a classic partial annealing zone alone, because all samples were collected at similar elevations (). In the lower plate of metamorphic core complexes, the systematic footwall age trend is used to identify the direction of footwall movement (Foster and John Citation1999). For the Footwall Fault this would imply that the footwall block was drawn out to the southwest from under the top-to-the-northeast moving hanging wall block. This age pattern indicates a net-normal sense of movement (Foster and John Citation1999; Thomson and Ring Citation2006; Brichau et al. Citation2010), which is in perfect agreement with the kinematic data. The classic interpretation of such data is to take decreasing central ages in the footwall of a normal fault system and determine a slip rate on the normal fault. The estimated slip rate of 100–150 m/Ma is very small. A very small slip rate suggests that post-85 Ma offset along the low-angle Footwall Fault was of the order of 3–4.5 km and therefore one would probably not see any offset of the Waipounamu Erosion Surface across the fault. The slip-rate interpretation of the data set would mean that fault slip ended at c. 50 Ma and the rocks were afterwards slowly exhumed by erosion at a rate of c. 0.2–0.3 km/Ma (). However, the ZFT age trend would indicate a different timing for movement at the Footwall Fault then the 110–100 Ma age for ductile top-to-the-northeast extension discussed above.
A feasible alternative is that partial annealing may have been caused by slow cooling after renewed hydrothermal fluid flow affecting the Footwall Fault zone between c. 60 to 50 Ma. This hydrothermal activity would need to be linked to active faulting along the Footwall Fault at that time for explaining the systematic age trend and is thus similar to the above discussed case. Such a scenario would explain the young age pattern, but to date no other supporting evidence for hydrothermal activity after 100 Ma has been found in the study area, as the hydrothermal gold deposits formed in the Cretaceous (Mortensen et al. Citation2010). Unfortunately, our dataset is too limited, all samples are basically from the same elevation and no age/elevation profiles can be sampled in the flat landscape to better constrain how partial annealing affected the rocks when they were exhumed to the surface.
Fault slip ending by 50 Ma followed by slow erosion does not fully explain the partial annealing of zircons in samples H6 and F5 in the Paleocene/Early Eocene. It is possible that the central age of sample F8 and the older peak age of H6 reflect cooling due to normal faulting and erosion in the mid Cretaceous, and that all the other ZFT ages have nothing to do with fault motion but rather reflect partial annealing. Nonetheless, partial annealing in a vertically moving partial annealing zone (Bernet Citation2009) is not compatible with the fact that all samples were collected at similar elevations. In an exhumed partial annealing zone, which would have at least a thickness of c. 2 km (given a 50 Ma holding time and a 20 °C/km thermal gradient), an age difference of c. 30 Ma, as observed in our samples, would be spread over at least 1–2 km of crustal thickness (Amaya et al. Citation2017). The difference in crustal position of our samples is < 200 m (sample F8 at 566 m elevation and sample F10 at 375 m elevation). One could argue that the observed age trend may have been caused by post-cooling counter-clockwise crustal rotation of an exhumed partial annealing zone, leading to a change in crustal position of the sampled rocks. Such a scenario, depending on thermal gradient, exhumation rate and location of the point of rotation, would require a rotation of at least 30–40°. This seems rather unlikely, as no other evidence for significant counter-clockwise crustal rotation has been observed in the study area. Furthermore, undoing such a rotation would result in a shallowly south-dipping Footwall Fault. We consider the counter-clockwise rotation hypothesis unlikely.
Because all samples were collected at the present-day surface and at very similar elevations close to the fault trace, the cooling ages may also indicate erosion of 8–14 km over the past c. 50 Ma, depending on the paleo-thermal gradient and closure depths (), which translates into a time-averaged erosion rate of c. 0.2 ± 0.1 km/Ma since the mid Cretaceous/Eocene (B). Such large amounts of erosion after Footwall Fault movement are unlikely. Paterson (Citation1942) showed that inland from Palmerston (), the sediment thicknesses are 370 m for the syn-rift Horse Range Formation and 660 m for the overlying Late Cretaceous to Miocene sediments, which is too little for explaining erosional exhumation since the Eocene.
Yet another alternative, but probably less likely, would be reheating in the Late Cretaceous. Before c. 85 Ma the Waipounamu Erosion Surface formed. Full resetting of the ZFT ages through burial would require an overburden of > 8 km (see above). There is no evidence in the entire South Island of New Zealand for such sediment accumulations during that time. In Otago, the opposite is the case and the peneplain formed. Therefore, it appears more realistic to invoke a reheating event potentially associated with initial oceanic spreading in the west and south of the South Island. Similar apatite fission-track ages of 80–72 Ma occur in several other places in the South Island (Kamp Citation1997; Batt et al. Citation2004). Schulte et al. (Citation2014) showed that extension in the Paparoa Metamorphic Core Complex on the west coast was a two-stage process in the Cretaceous with an c. 20–25 Ma pause in between both extensional events. Schulte et al. (Citation2014) suggested that a regional thermal event reset apatite and ZFT ages in the Paparoa Range. This thermal event is supposed to be related to Tasman Sea opening causing reactivation of low-angle normal faults of the Paparoa Metamorphic Core Complex and the formation of the Paparoa Basin. The tectonic evolution of West Antarctica on the other side of the Tasman Sea is remarkably similar and also suggests broad regional uplift and cooling recorded by apatite fission-track ages of 83–70 Ma (Siddoway Citation2008).
There is also the possibility of reheating in the Eocene to Miocene by broad thermal effects of volcanism in East Otago (Forsyth Citation2001). The lavas and hypabyssal intrusions are scattered and widespread (). Because the radiation damaged zircons have a rather low closure temperature, they would be more likely to be affected by a locally high volcanism-related geothermal gradient. Just northeast of the study area, the main pulse of volcanism of the Dunedin Volcanic Group gives K–Ar ages of 16–10 Ma (Forsyth Citation2001).
Tectonic model
The timing of major extensional deformation on both the Footwall and Waihemo faults is broadly constrained to be mid Cretaceous (110–100 Ma); the Footwall Fault may have been reactivated in the early Tertiary, and the Waihemo Fault was definitely reactivated in the late Cenozoic.
The first deformation across the Hyde-Macraes Shear Zone was top-to-the-southwest thrusting bringing the hanging wall above the brittle–ductile transition (). This deformation might have been associated or probably shortly following underplating of the Otago Schist in the Early Cretaceous. At c. 110 Ma, northeast–southwest extension commenced and formed the Footwall and Waihemo faults. The footwall of the Footwall Fault was exhumed through the ZFT closure depth and the Otago Schist reached the surface and shed clasts into the graben associated with the Waihemo Fault in which the Kyeburn and Horse Range formations were deposited. We concur with the common interpretation that extension across the Footwall Fault is linked to the formation of the Waihemo Fault and deposition of the Kyeburn and Horse Range Formation in the Albian (Craw et al. Citation1999; Craw and Mackenzie Citation2016; Mortimer, Craw, et al. Citation2016).
Before c. 85 Ma the Waipounamu Erosion Surface formed (Forsyth Citation2001). A possible Eocene reactivation of the Footwall Fault could be linked to the formation of the Emerald basin in the southwest of the South Island and south of it (Grant Citation1985; King Citation2000). Grant (Citation1985) showed that in the Eocene, 3000 m of coarse sediment accumulated in fault bounded basins, indicating that the formation of the Emerald basin was a major tectonic event in the southern South Island.
Otago Schist extensional exhumation
This paper contributes to growing evidence for extensional deformation at the flanks of the most deeply exhumed parts of the Otago Schist (Deckert et al. Citation2002; Forster and Lister Citation2003; Mortimer, Craw, et al. Citation2016). The Footwall Fault (this study), Cap Burn Fault (Forsyth Citation2001) and the Thomsons Gorge Fault (Deckert et al. Citation2002) () are all low-angle normal faults that dip to the northeast on the northeastern flank of the Otago Schist with a top-to-the-northeast shear sense. Published age data and our ZFT dating in a transect across the Footwall Fault show that extensional deformation is likely to be of mid Cretaceous age, possibly with some younger reactivation. In general, the mid Cretaceous corresponds to a widely developed initial phase of rifting in southern Zealandia (Mortimer, Kohn, et al. Citation2016) that ultimately resulted in the opening of the Tasman Sea and Southern Ocean by c. 85 Ma.
Conclusions
Our data show lower greenschist-facies, ductile top-to-the-northeast extensional deformation in the footwall, brittle–ductile to brittle extensional deformation in the intra-shear schist, and brittle extension in the hanging wall of the Footwall Fault. This spatial arrangement of structures is diagnostic for extensional fault systems. Therefore, the main conclusion is that extensional structures are an important structural element at the north flank of the Otago Schist and that extension across the Footwall Fault commenced at relatively deep levels of the Torlesse accretionary wedge. Asymmetric folds in the hanging wall of the Hyde-Macraes Shear Zone indicate top-to-the-southwest shortening preceding top-to-the-northeast extension.
The occurrence of Otago Schist fragments in the mid Cretaceous Kyeburn formation represents a minimum age for the exhumation of the Otago Schist and suggests that extensional deformation was underway by 112–110 Ma. However, surprisingly young ZFT ages of 79 ± 6.8 to 46.1 ± 3.2 Ma show a geometric relationship to footwall exhumation by top-to-the-northeast extensional deformation. At this stage, the interpretation of the ZFT data remains controversial, even if the data are compatible with regional fission-track data. Different scenarios for explaining the observed age trend, most likely affected by partial annealing, have been proposed. Given the structural constraints, we suggest that the most plausible explanation is a two-stage extension history across the Footwall Fault with resetting of the ZFT system by a thermal pulse at c. 85–80 Ma and renewed brittle normal faulting in the Eocene.
The problematic ZFT ages show that in the case of the Footwall Fault low-temperature thermochronology does not always provide unambiguous results for better constraining late-orogenic extensional contacts. Despite the fact that our ZFT ages show a robust and systematic age trend, no unique interpretation could be reached.
Supplementary data
Download PDF (505.4 KB)Acknowledgments
We thank Belinda Smith Lyttle for GIS work. Mortimer was supported by core funding from the New Zealand Government to GNS Science's Mineral Exploration of Zealandia programme. Dave Craw and an anonymous reviewer, as well editorial handling by Tim Little, helped considerably to improve the manuscript.
Disclosure statement
No potential conflict of interest was reported by the authors.
ORCID
Uwe Ring http://orcid.org/0000-0003-3347-9284
Nick Mortimer http://orcid.org/0000-0002-6812-3379
Additional information
Funding
Related Research Data
References
- Allibone AH, Jones P, Moore J, Craw D, Mackenzie D, Blakemore H. 2017. Kilometre-scale structural setting of ore shoots in the Frasers gold deposit, Macraes mine, New Zealand. Ore Geology Reviews. 89:1107–1121. doi: 10.1016/j.oregeorev.2017.05.019
- Amaya S, Zuluaga C, Bernet M. 2017. New fission-track age constraints on the exhumation of the central santander massif: implications for the tectonic evolution of the Northern Andes, Colombia. Lithos. 282–283:388–402. doi: 10.1016/j.lithos.2017.03.019
- Batt GE, Baldwin SL, Cottam MA, Fitzgerald PG, Brandon MT, Spell TL. 2004. Cenozoic plate boundary evolution in the South Island of New Zealand: new thermochronological constraints. Tectonics. 23:TC4001. doi:10.1029/2003TC001527.
- Begbie MJ, Craw D. 2006. Geometry and petrography of stockwork vein swarms, Macraes mine, Otago Schist, New Zealand. New Zealand Journal of Geology and Geophysics. 49:63–73. doi: 10.1080/00288306.2006.9515148
- Bernet M. 2009. A field-based estimate of the zircon fission-track closure temperature. Chemical Geology. 259:181–189. doi: 10.1016/j.chemgeo.2008.10.043
- Bleakley PA, Yeo WJA. 1997. Stoneburn project exploration permit 40-149. Annual Report for the Period 1/9/96 to 31/8/97. Unpublished Mineral Report MR3525. Wellington, New Zealand Petroleum and Minerals.
- Brandon MT. 2002. Decomposition of mixed grain age distributions using BINOMFIT. On Track. 24:13–18.
- Brandon MT, Roden-Tice MK, Garver JI. 1998. Late Cenozoic exhumation of the Cascadia accretionary wedge in the Olympic Mountains, northwest Washington state. Bulletin of the Geological Society of America. 110:985–1009. doi: 10.1130/0016-7606(1998)110<0985:LCEOTC>2.3.CO;2
- Brichau S, Ring U, Ketcham RA, Carter A, Stockli D, Brunel M. 2006. Constraining the long-termevolution of the slip rate for a major extensional fault systemin the central Aegean, Greece, using thermochronology. Earth and Planetary Science Letters. 241:293–306. doi:10.1016/j.epsl.2005.09.065.
- Brichau S, Thomson SN, Ring U. 2010. Thermochronometric constraints on the tectonic evolution of the Serifos detachment, Aegean Sea, Greece. International Journal of Earth Sciences. 99:379–393. doi:10.1007/s00531-008-0386-0.
- Brix MR, Stöckhert B, Seidel E, Theye T, Thomson SN, Küster M. 2002. Thermobarometric data from a fossil zircon partial annealing zone in high pressure–low temperature rocks of eastern and central Crete, Greece. Tectonophysics. 349:309–326. doi: 10.1016/S0040-1951(02)00059-8
- Butz CF. 2007. The Hyde-Macraes shear zone in Otago: a result of continental extension or shortening? Unpublished M.Sc. thesis, University of Canterbury.
- Craw D, Mackenzie D. 2016. Macraes orogenic gold deposit (New Zealand). Springer Briefs in World Mineral Deposits. 1:1–131.
- Craw D, Windle SJ, Angus PVM. 1999. Gold mineralization without quartz veins in a ductile-brittle shear zone, Macraes Mine, Otago Schist, New Zealand. Mineralium Deposita. 34:382–394. doi: 10.1007/s001260050211
- Deckert H, Ring U, Mortimer N. 2002. Tectonic significance of Cretaceous bivergent extensional shear zones in the torlesse accretionary wedge, central Otago Schist, New Zealand. New Zealand Journal Geology and Geophysics. 45:537–547. doi: 10.1080/00288306.2002.9514990
- Ehlers TA, Chaudhri T, Kumar S, Fuller CW, Willett SD, Ketcham RA, Brandon MT, Belton DX, Kohn BP, Gleadow, AJW, et al. 2005. Computational tools for low-temperature thermochronometer interpretation. In: Reiners PW, Ehlers TA, editors. Low-Temperature thermochronology: techniques, interpretations, and applications. Reviews in Minerology and Geochemistry; vol. 58. Chantilly, VA: Mineralogical Society of America; p. 589–622.
- Forster MA, Lister GS. 2003. Cretaceous metamorphic core complexes in the Otago Schist, New Zealand. Australian Journal of Earth Sciences. 50:181–198. doi: 10.1046/j.1440-0952.2003.00986.x
- Forsyth PJ. 2001. Geology of the Waitaki area. Institute of Geological & Nuclear Sciences. 1:250,000 Geological Map 19.
- Foster DA, John BE. 1999. Quantifying tectonic exhumation in an extensional orogen with thermochronology: examples from the southern Basin and Range province. In: Ring U, Brandon MT, Lister GS, Willett SD, editors. Exhumation processes: normal faulting, ductile flow and erosion. Geological Society Special Publications London, vol. 154. Belfast: Geological Society of London; p. 343–364.
- Galbraith RF. 2005. Statistics for fission track analysis. Boca Raton: Chapman & Hall.
- Galbraith RF, Laslett GM. 1993. Statistical models for mixed fission track ages. Nuclear Tracks. 21:459–470.
- Grant AC. 1985. Structural evolution of the head of Solander trough, south of New Zealand, based on analysis of seismic basement. New Zealand Journal of Geology and Geophysics. 28(1):5–22. doi:10.1080/00288306.1985.10422273.
- Gray DR, Foster DA. 2004. 40Ar/39Ar thermochronologic constraints on deformation, metamorphism and cooling/exhumation of a Mesozoic accretionary wedge, Otago Schist, New Zealand. Tectonophysics. 385:181–210. doi: 10.1016/j.tecto.2004.05.001
- Hurford AJ, Green PF. 1983. The zeta age calibration of fission-track dating. Chemical Geology. 41:285–317. doi:10.1016/S0009-2541(83)80026-6.
- Jones P, Craw D, Norris RJ. 2007. Golden Bar gold deposit as an extension of the Hyde-Macraes Shear Zone, east Otago, New Zealand. New Zealand Journal of Geology & Geophysics. 50:271–281. doi: 10.1080/00288300709509837
- Kamp PJJ. 1997. Paleogeothermal gradient and deformation style, Pacific front of the Southern Alps Orogen: constraints from fission track thermochronology. Tectonophysics. 271:37–58. doi:10.1016/S0040-1951(96)00246-6.
- Kamp PJJ, Green PF, White SH. 1989. Fission track analysis reveals character of collisional tectonics in New Zealand. Tectonics. 8:169–195. doi: 10.1029/TC008i002p00169
- King PR. 2000. Tectonic reconstructions of New Zealand: 40 Ma to the present. New Zealand Journal of Geology and Geophysics. 43:611–638. doi:10.1080/00288306.2000.9514913.
- Laird MG, Bradshaw JD. 2004. The break-up of a long-term relationship: the Cretaceous separation of New Zealand from Gondwana. Gondwana Research. 7:273–286. doi: 10.1016/S1342-937X(05)70325-7
- Lister GS, Davis GA. 1989. The origin of metamorphic core complexes and detachment faults formed during tertiary continental extension in the northern Colorado River region, U.S. Journal of Structural Geology. 11:65–94. doi:10.1016/0191-8141(89)90036-9.
- Little TA, Mortimer N, McWilliams MO. 1999. An episodic Cretaceous cooling model for the Otago-Marlborough Schist, New Zealand, based on 40Ar/39Ar white mica ages. New Zealand Journal of Geology and Geophysics. 42:305–325. doi: 10.1080/00288306.1999.9514848
- McKeag SA, Craw D, Norris RJ. 1989. Origin and deposition of a graphitic schist-hosted metamorphogenic Au-W deposit, Macraes, East Otago, New Zealand. Mineralium Deposita. 24:124–131. doi: 10.1007/BF00206316
- Mitchell M, Craw D, Landis CA, Frew A. 2009. Stratigraphy, provenance, and diagenesis of the Cretaceous Horse Range Formation, East Otago, New Zealand. New Zealand Journal of Geology and Geophysics. 52:171–183. doi:10.1080/00288300909509884.
- Mortensen JK, Craw D, MacKenzie DJ, Gabites JE, Ullrich T. 2010. Age and origin of orogenic gold mineralisation in the Otago Schist belt, South Island, New Zealand: constraints from lead isotope and 40Ar/39Ar dating studies. Economic Geology. 105:777–793. doi:10.2113/gsecongeo.105.4.777.
- Mortimer N. 2000. Metamorphic discontinuities in orogenic belts: example of the garnet-biotite-albite zone in the Otago schist, New Zealand. International Journal of Earth Sciences. 89:295–306. doi: 10.1007/s005310000086
- Mortimer N, Craw D, MacKenzie D, Mortensen J, Ring U, Pitcairn I. 2016. Cretaceous tectonics and gold mineralisation in the Otago Schist. In: Christie AB, editor. Mineral deposits of New Zealand: exploration and research. Monograph 31. Carlton: Australasian Institute of Mining and Metallurgy; p. 133–140.
- Mortimer N, Kohn B, Seward D, Spell T, Tulloch AJ. 2016. Reconnaissance thermochronology of southern Zealandia. Journal of the Geological Society. 173:370–383. doi: 10.1144/jgs2015-021
- Mortimer N, McLaren S, Dunlap WJ. 2012. Ar-Ar dating of K-feldspar in low grade metamorphic rocks: example of an exhumed Mesozoic accretionary wedge and forearc, South Island, New Zealand. Tectonics. 31:TC3020 (15 p.). doi:10.1029/2011TC003057.
- Mortimer N, Rattenbury MS, King PR, Bland KJ, Barrell DJA, Bache F, Begg JG, Campbell HJ, Cox SC, Crampton JS, et al. 2014. High-level stratigraphic scheme for New Zealand rocks. New Zealand Journal of Geology and Geophysics. 57:402–419. doi: 10.1080/00288306.2014.946062
- Paterson OD. 1942. The geology of the lower Shag Valley, NE Otago. Transactions and Proceedings of the Royal Society of New Zealand. 71:32–58.
- Petrie BS, Craw D. 2005. Lithological controls on structural evolution of mineralised schist, Macraes gold mine, Otago, New Zealand. New Zealand Journal of Geology and Geophysics. 48:435–446. doi: 10.1080/00288306.2005.9515124
- Platt JP. 1993. Exhumation of high-pressure rocks: a review of concepts and processes. Terra Nova. 5:119–133. doi: 10.1111/j.1365-3121.1993.tb00237.x
- Rahl JM, Brandon MT, Deckert H, Ring U, Mortimer N. 2011. Tectonic significance of ductile deformation in low-grade sandstones in the Mesozoic Otago subduction wedge, New Zealand. American Journal of Science. 311:27–62. doi: 10.2475/01.2011.02
- Rahn MK, Brandon MT, Batt GE, Garver JI. 2004. A zero-damage model for fission track annealing in zircon. American Mineralogist. 89:473–484. doi: 10.2138/am-2004-0401
- Reiners PW, Brandon MT. 2006. Using thermochronology to understand orogenic erosion. Annual Reviews of Earth and Planetary Sciences. 34:419–466.
- Ring U. 1995. Horizontal contraction or horizontal extension?: heterogeneous Late Eocene and Early Oligocene general shearing during blueschist- and greenschist-facies metamorphism at the Pennine-Austroalpine boundary zone in the Western Alps. Geologische Rundschau. 84:843–859. doi: 10.1007/s005310050044
- Ring U. 2014. Metamorphic core complexes. Encyclopedia of marine geosciences. Dordrecht: Springer. doi:10.1007/978-94-007-6644-0_104-4.
- Ring U, Brandon MT. 1994. Kinematic data for the Coast Range fault and implications for exhumation of the Franciscan complex. Geology. 22:735–738. doi:10.1130/0091-7613(1994)022<0735:KDFTCR>2.3.CO;2 doi: 10.1130/0091-7613(1994)022<0735:KDFTCR>2.3.CO;2
- Ring U, Brandon MT, Willett S, Lister GS. 1999. Exhumation processes. In: exhumation processes: normal faulting, ductile flow and erosion. In: Ring U, Brandon MT, Lister GS, Willett S, editors. Exhumation processes. Geological Society Special Publications London, vol. 154. Belfast: Geological Society of London; p. 1–28.
- Ring U, Gessner K, Thomson SN. 2017. South Menderes Monocline: Low-tem-perature thermochronology constrains role of crustal extension in structural evolution of southwest Turkey. Tectonophysics. 712/713:455–463. doi:10.1016/j.tecto.2017.06.019.
- Schulte DO, Ring U, Thomson S, Glodny J, Carrad H. 2014. Two-stage development of the Paparoa Metamorphic Core Complex, West Coast, South Island, New Zealand: hot continental extension precedes seafloor spreading by ∼25 Myr. Lithosphere. 6:177–194. doi:10.1130/L348.1.
- Siddoway CS. 2008. Tectonics of the West Antarctic Rift system: new light on the history and dynamics of distributed intracontinental extension (invited paper), Antarctica: A keystone in a changing world. In: Proceedings of the 10th International Symposium on Atlantic Earth Sciences, Washington DC: The National Academic Press.
- Stöckhert B, Brix MR, Kleinschrodt R, Hurford AJ, Wirth R. 1999. Thermochronology and microstructures of quartz - A comparison with experimental flow laws and predictions on the temperature of the brittle-plastic transition. Journal of Structural Geology. 21:351–369. doi: 10.1016/S0191-8141(98)00114-X
- Tagami T. 2005. Zircon fission-track thermochronology and applications to fault studies. Reviews in Mineralogy and Geochemistry. 58:95–122. doi: 10.2138/rmg.2005.58.4
- Teagle DAH, Norris RJ, Craw D. 1990. Structural controls on gold-bearing quartz mineralization in a duplex thrust system, Hyde-Macraes shear zone, Otago schist, New Zealand. Economic Geology. 85:1711–1719. doi: 10.2113/gsecongeo.85.8.1711
- Thomson SN. 1998. Assessing the nature of tectonic contacts using fission-track thermochronology: an example from the Calabrian Arc, southern Italy. Terra Nova. 10:32–36. doi: 10.1046/j.1365-3121.1998.00165.x
- Thomson SN, Ring U. 2006. Thermochronologic evaluation of post-collision extension in the Anatolide Orogen, western Turkey. Tectonics. 25:TC3005. doi:10.1029/2005 TC001833 (20p.) doi: 10.1029/2005TC001833
- Thomson SN, Ring U, Brichau S, Glodny J, Will TM. 2009. Timing and nature of formation of the Ios metamorphic core complex, southern Cyclades, Greece. In: Ring U, Wernicke B, editors. Extending a continent: architecture, rheology and heat budget. Geological Society Special Publications London, vol. 321. Belfast: Geological Society of London; p. 139–167.
- Tippett JM, Kamp PJJ. 1993. Fission track analysis of the late Cenozoic vertical kinematics of continental Pacific crust, South Island, New Zealand. Journal of Geophysical Research. 98:16119–16148. doi: 10.1029/92JB02115
- Tulloch AJ, Ramezani J, Mortimer N, Mortensen J, van den Bogaard P, Maas R. 2009. Cretaceous felsic volcanism in New Zealand and Lord Howe Rise (Zealandia) as a precursor to final Gondwana break-up. In: Ring U, Wernicke B, editors. Extending a continent: architecture, rheology and heat budget. Geological Society Special Publications London, vol. 321. Belfast: Geological Society of London; p. 89–118.
- Vermeesch P. 2009. Radialplotter: a Java application for fission track, luminescence and other radial plots. Radiation Measurements. 44:409–410. doi: 10.1016/j.radmeas.2009.05.003
- Wheeler J, Butler RWH. 1994. Criteria for identifying structures related to true crustal extension in orogens. Journal of Structural Geology. 16:1023–1027. doi: 10.1016/0191-8141(94)90083-3
- Winsor CN. 1991. Low-angle shear zones in central Otago, New Zealand - their regional extent and economic significance. New Zealand Journal of Geology and Geophysics. 34:501–516. doi: 10.1080/00288306.1991.9514486