
ABSTRACT
Gravity data recorded across Tongariro National Park during the 1950s and 1960s are interpreted in terms of the morphology of the basement underlying the younger surficial sediments and volcanics. The gravity data were processed to Bouguer anomalies at a height of 500 m (the average elevation of the survey region). These anomalies were then separated into regional and residual anomalies after deriving a smoothly varying regional anomaly based on observed values at stations on greywacke outcrops in the region. Density-depth relations for sediments were derived from measured values in boreholes. Simple 2D gravity models using these density relationships were used to derive a 3D structural model for the region. The final model shows a deep asymmetric trough with a steep eastern margin running from the south end of Lake Taupo (2.5 km deep) and under Mt Tongariro (1 km deep) before fading away as a major feature near Mt Ruapehu.
Introduction
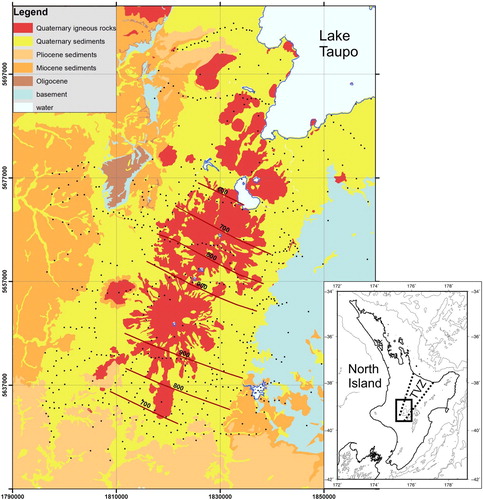
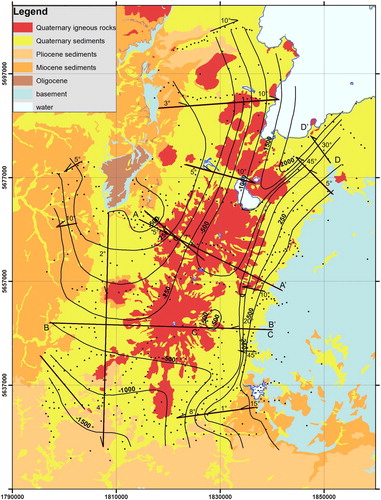
The Tongariro National Park region of the central North Island, New Zealand (), lies at the southern end of the Taupo Volcanic Zone (TVZ), an active back-arc rift basin associated with the Hikurangi Subduction Zone. It contains the active Ruapehu and Tongariro volcanic centres. A knowledge of the basement structure under the surface volcanic deposits may provide constraints on the back-arc rifting process and its propagation southwards. Gravity data recorded in the 1950s and 1960s have been used to estimate the depth to the basement inferred to underlie the surficial late Cenozoic sedimentary and volcanic rocks of the southern TVZ. Although the gravity modelling techniques used in this work have been superseded by modern computer-based methods, the final regional model derived for the depth to ‘basement’, be it greywacke or andesite, delineates the major basement features of the region, documenting the diminishing southwards of the rift structure under the eastern TVZ and will be of interest to people working on the region.
Figure 1. The southern TVZ showing simplified regional geology (geology after GNS Science Citation2014 (QMAP), colour code see Legend), gravity stations (black dots), and base of andesite contours (red lines, annotated at 100 m intervals). All maps are NZ Transverse Mercator projection, grid at 20 km intervals. Inset at lower right: location of the study area, marked by the box, within North Island, New Zealand. TVZ marked by dotted lines and TVZ. Height and depth contours (thin lines) are at 1000 m intervals
Tongariro National Park was the focus of a gravity survey over a number of years, mainly in the 1950s when Robertson was the first Director of Geophysics Division, DSIR. This data base was built up by staff travelling between Wellington and places in the north, such as Wairakei where studies of the geothermal activity were very active. This program was greatly reduced in the 1960s when Robertson was appointed Assistant Director General of DSIR and subsequently Director General, retiring in 1981. The work remained unpublished although he had carried out an analysis of the results. During his retirement, he felt concerned about not having made the results available to the scientific community and therefore was pleased that Davey offered to help prepare this report.
Gravity data
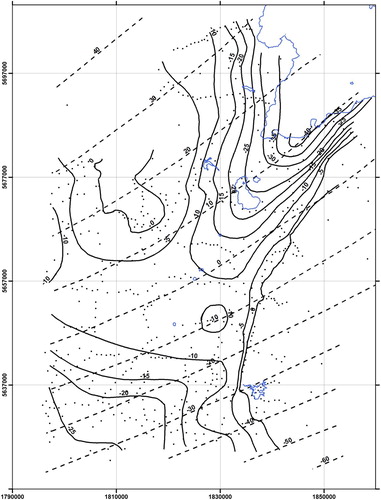
The gravity data were recorded in the survey area with a North American Geophysical Company gravity meter (number AGI-96) and a Worden gravimeter (number 283). Stations were located on bench marks where possible; elsewhere locations and heights were derived from 1:250,000 maps and barometers. 585 stations were occupied (), and about 90% of the data are in the present land gravity data base at GNS Science. The observed data were corrected to free air anomalies and then to Bouguer anomalies at a 500 m above sea level datum, the approximate mean elevation for the survey region. The accuracy of Bouguer anomalies is estimated to be about 2 mGal (Reilly Citation1972). The Bouguer anomalies were then separated graphically into regional and residual anomalies () by constructing a smoothly varying regional anomaly based on observed gravity values on basement rocks in the region. The 0 to −50 mGal regional contours on the eastern (Kaimanawa) side of the National Park area were derived by combining the Woodward and Ferry (Citation1974) Bouguer anomaly map values with additional stations established on basement during the gravity survey which forms the basis of this paper. A similar procedure was applied to the north-western part of the National Park area and included stations along the western diversion tunnels of the Tongariro Power Development Scheme where basement was encountered at very shallow depths. Comparison with Hunt’s (Citation1980) values at 500 m elevation showed that in the northwest and southwest part of the survey area the adopted values are only about 4 mGal more negative, and in the southeast part they are about 2 mGal more negative. The Bouguer regional anomalies at 500 m above sea level for the northern part of the National Park area agree with the 40, 30, 20 and 10 mGal regional contours derived by Stern (Citation1979) near the southern edge of Lake Taupo. The rms residual anomaly for 14 gravity stations sited on greywacke is 2.6 mGal.
Figure 2. Regional (dashed contours, 10 mGal interval) and residual (solid contours, 5 mGal interval) gravity anomalies for the southern TVZ. Gravity stations black dots.
Rock densities
Basement rocks (Paleozoic/Mesozoic)
The Kaimanawa Schist and greywacke along the eastern side of the study area are of Permian and Triassic ages respectively. The greywacke on the western side is Jurassic. Hunt (Citation1980) stated that
the mean wet density of 14 samples of greywacke basement rocks for the ranges flanking the Wanganui Basin … , and from drill holes in the basin … , is 2.69 (±0.05) Mg/m3. As this value is not greatly different from the standard value of 2.67 Mg/m3 used in calculating the observed Bouguer gravity anomalies, the latter was adopted as the value for the density of basement rocks.
Tertiary sediments (late Miocene/Pliocene)
The following variations of density with depth below the surface were derived from density-depth profiles and densities of rocks at the surface given by Hunt (Citation1980).
As mainly late Miocene sediments occur at the surface in the study area, the value of 2.30 Mg/m3 was used in preference to Hunt’s (Citation1980) value of 2.4 Mg/m3 for the mean wet density of surface samples of Miocene sediments (A).
Figure 3. A, Wet density profiles with depth for Late Miocene, Pliocene and acid volcanic (volcanoclastic) sediments. These profiles show an approximately exponential variation of density contrast (Δσ) with depth. B, Log plot of sediment density contrast, relative to a basement density of 2.67 Mg/m3, with sediment thickness (depth). C, The variation in gravity anomaly with increasing depths (thicknesses) of sediment slabs, assuming an exponential variation of density contrast (Δσ) with depth.
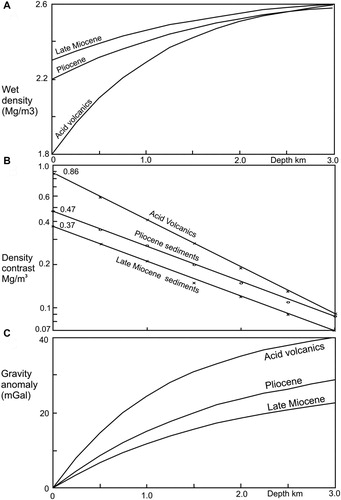
These densities conform to exponential decreases of Δσ (basement density (2.67 Mg/m3) – overburden density) with depth Z (B).
Late Miocene Δ σ = 0.37e−0.56Z
Pliocene Δ σ = 0.47e−0.56Z
Acid volcanics (Quaternary rhyolitic sediments)
The following variation of density with depth below the surface was based on the values obtained from borehole samples in the Wairakei area (Stern Citation1982).
These densities also conform with an exponential decrease of density contrast Δσ (density of basement (2.67 Mg/m3) – overburden density) with depth Z, namely Δσ = 0.86e−0.75Z (refer B).
For both sets of sediments, the mean density between two depths can be computed from the exponential variations of Δσ (basement density (2.67 Mg/m3) – overburden density) with depth Z, i.e. mean density (from depth Z1 to Z2) = 2.67 Mg/m3 (basement density) – Δσ, where for Pliocene sediments.
This in turn allows the derivation of the gravity anomaly for an infinite horizontal sheet of sediments with a defined thickness (C). For a point on the upper surface of the slab with thickness z (i.e. z1 = 0, z2 = z), (Δσ), where G is the gravitational constant.
For example, for Pliocene sediments of thickness z and density contrast as given above
Andesite (Quaternary)
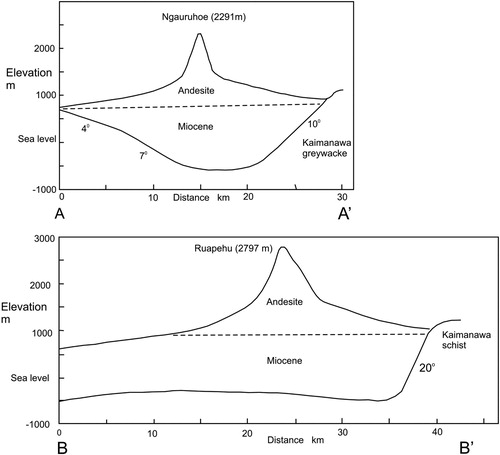
The elevation of the margins of the Mts Ruapehu, Ngauruhoe and Tongariro andesites rises from about 700 m above sea level to the south of Mt Ruapehu to about 900 m in the Mt Ruapehu region, and then decreases to about 600 m to the north of Mt Tongariro. These elevations were assumed to mark the base of the andesites and continue under the mountains as shown in . Terrain corrections were computed for the morphology of the volcano massif for a range of andesite densities to derive the density for which the corrected gravity had a minimum correlation with height (a variant on Nettleton’s method, Citation1939). Andesite densities of 2.15 and 2.35 Mg/m3 gave mean residuals of +0.8 and −3.0 mGals, respectively, for 13 stations above 1000 m elevation, so an intermediate andesite density of 2.25 Mg/m3 was assumed for the models. Sissons (Citation1981) has derived andesite densities in the region from inversion of surface and subsurface (tunnel) gravity data, obtaining a density of 2.26 Mg/m3 for the upper 300 m; his deeper, fourth, layer was poorly constrained.
Gravity models
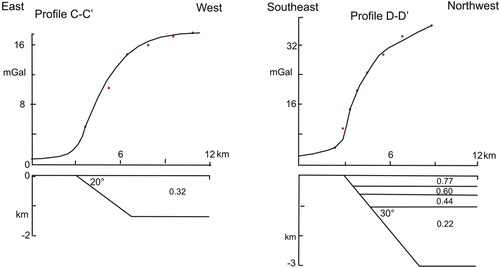
2D gravity models, along profiles oriented approximately perpendicularly to the observed residual gravity gradients, have been derived in three ways after adjusting the residual anomalies for elevation differences from the 500 m datum. This allowed the models to be consistent with sea level. All used a density contrast derived from the density-depth relationships noted earlier. Where gravity gradients are steep, models have been derived using the semi-infinite horizontal slab with an inclined edge formulation of Robertson and Cowan (Citation1964) and a mean density, two examples are given in . If the depth to basement was greater than about 1 km, a multilayer model was derived with each layer having a mean density corresponding to its depth extent (B). The semi-infinite horizontal slab approximation is valid as the anomalies are generally 2D and the distance between large gravity gradients are relatively large (10 km). Where gradients are low, the thicknesses were derived from the adjusted residual gravity anomalies assuming a horizontal slab model (C), for which errors due to the variable thicknesses away from the profile were assessed to be small.
Figure 4. Examples of 2D models of steep boundaries using the Robertson and Cowan (Citation1964) inclined edge semi-infinite slab method (profiles CC′ and DD′, located in ). For both profiles: solid lines – computed gravity model, dots – observed anomalies, dip of interface shown in degrees, density contrast for each layer annotated in Mg/m3.
For depth models across the andesitic volcanic cones () the andesite density was first estimated and the elevation of the base of the andesitic cover derived (see above). The underlying basement surface was then derived using a horizontal slab model with inclined edges for the margins and an average wet density (2.35 Mg/m3) for the depth range of the Tertiary sediments underlying the andesites. A change of 100 m in the assumed elevation of the base of the andesites produces a change in Bouguer anomaly of only 0.4 mGal. The existence of Tertiary sediments underlying the andesites is supported by a 3.0 km/s P-wave speed layer recorded by Sissons and Dibble (Citation1981) just east of Mt Ruapehu, and by their occurrence to the south and west of the andesites. These volcanoes probably have solid cores but no stations (maximum station elevation was 1700 m above sea level) were located close enough to the peaks (Mt Ruapehu 2800 m, Mt Ngauruhoe 2290 m) to detect this. As massive andesite has a wet density of about 2.67 Mg/m3 (e.g. Whiteford and Lumb, Citation1975; Sissons Citation1981) the bulk density of 2.25 Mg/m3 corresponds to a porosity of 25%. Gravity studies of volcanic islands in the Southwest Pacific Ocean by Robertson (Citation1967) gave similar results – olivine basalt core of 2.87 Mg/m3, with bulk island density of 2.35 Mg/m3 corresponding to a bulk porosity of 28%.
Figure 5. Models for the sedimentary basin and overlying andesite cone across Mt Ruapehu and Mt Tongariro edifices (profiles AA′ and BB′ in ). A constant density of 2.25 Mg/m3 was used for the andesite sediments and a Late Miocene exponential decrease with depth density profile used for the inferred underlying sediments.
The 3D structure model for basement underlying the sediments of Tongariro National Park () has been derived by interpolating between the 2D gravity models using depths derived from the adjusted residual gravity data and their relationships with depths given in C. Uncertainty in depth estimates arise from three sources – the observed anomaly (2 mGal, Reilly Citation1972), the regional anomaly (2.6 mGal, see earlier), and density contrast. Although the observed anomaly has an uncertainty of about 2 mGal, inspection of residual anomalies in areas of low gravity gradient indicate a relative uncertainty of about 1 mGal, giving a combined uncertainty of the modelled gravity anomalies of about 3.5 mGal. The rms uncertainty in density for Miocene sediments at the surface, for example, is 0.08 Mg/m3 based on data from Hunt (Citation1980). This gives an uncertainty of about 25% in the density contrast with basement. Based on these values, the depth below ground surface to basement in the shallow part of the basin (corrected residual anomaly 17 mGal) is 1370 m with a range of 1020–2050 m. However, the model is in moderate agreement with a seismic refraction model (Sissons and Dibble, Citation1981) located about 10 km east of Mt Ruapehu (SP1 – 1700 m to seismic 5.4 km/s layer cf. 1370 m for the gravity model) south to 5 km NW of Waiouru, giving confidence in the modelling. As noted earlier, basement under the basin may be greywacke or massive andesite, and sediments or compacted andesites may form the deeper parts of the basin, as both alternatives have similar densities.
Figure 6. 3D depth to basement model for the Tongariro National Park (contours at 250 or 500 m as annotated) overlain on simplified geology (geology after GNS Science Citation2014). Note the depths are relative to sea-level and the model datum was +500 m. The location of 2D gravity models used to derive the basement surface shown by black lines annotated with dip of segments, and location for profiles in and .
The major feature of the model is the asymmetric trough with a steep margin in the east at the south end of Lake Taupo, that broadens and shallows to a more symmetric trough under Mt Tongariro. It shallows further under Mt Ruapehu and then opens out southwards into the Whanganui Basin, although still with a steep eastern margin. The asymmetric trough in the northeast is similar to that seen at the north-eastern end of the TVZ in the Bay of Plenty (Davey et al. Citation1995) and may reflect the same young asymmetric extension inferred there.
Conclusions
A 3D model of the thickness of sediments overlying basement for the Tongariro National Park has been derived that incorporates a variable density with depth model. The major feature is a prominent NNE-SSW oriented trough up to 2–2.5 km deep and 20 km wide underlying southern Lake Taupo and extending southwards under Mt Tongariro but reducing in depth markedly towards Mt Ruapehu. The eastern margin of the trough, and the TVZ, is marked by a steep slope in the basement surface with dips of 20–45° being modelled. The basement model links the models derived for the Whanganui Basin (Hunt Citation1980) and the Lake Taupo region (Davy and Caldwell, Citation1998) and underlies the near surface detailed study of active faulting in the southern Taupo Rift by Villamor and Berryman (Citation2006).
Acknowledgements
J Black for ArcInfo advice. Geophysics Division, DSIR staff for the gravity observations. Comments by the editor and constructive reviews by two reviewers greatly improved this manuscript.
Disclosure statement
No potential conflict of interest was reported by the authors.
ORCID
Frederick J. Davey http://orcid.org/0000-0003-1294-5290
Related Research Data
References
- Davey FJ, Henrys SA, Lodolo E. 1995. Asymmetric rifting in a continental back-arc environment, North Island, New Zealand. Journal of Volcanology and Geothermal Research. 68:209–238. doi: 10.1016/0377-0273(95)00014-L
- Davy BW, Caldwell TG. 1998. Gravity, magnetic and seismic surveys of the caldera complex, Lake Taupo, North Island, New Zealand. Journal of Volcanology and Geothermal Research. 81:69–89. doi: 10.1016/S0377-0273(97)00074-7
- GNS Science. 2014. Geological map of New Zealand 1:250,000. GNS Science geological map 1. Lower Hutt: GNS Science.
- Hunt TM. 1980. Basement structure of the Wanganui Basin, onshore, interpreted from gravity data. New Zealand Journal of Geology and Geophysics. 23(1):1–16. doi: 10.1080/00288306.1980.10424188
- Nettleton LL. 1939. Determination of density for reduction of gravimeter observations. Geophysics. 4:176–183. doi: 10.1190/1.0403176
- Reilly WI. 1972. New Zealand gravity map series. New Zealand Journal of Geology and Geophysics. 15(1):3–15. doi: 10.1080/00288306.1972.10423942
- Robertson EI. 1967. Gravity effects of volcanic islands. New Zealand Journal of Geology and Geophysics. 10(6):1466–1483. doi: 10.1080/00288306.1967.10423230
- Robertson EI, Cowan M. 1964. Gravity anomalies produced by normal and reverse faults, grabens and fault angle depressions. Report 36, Geophysics Division, D.S.I.R.
- Sissons BA. 1981. Densities determined from surface and subsurface gravity measurements. Geophysics. 46(11):1568–1571. doi: 10.1190/1.1441163
- Sissons BA, Dibble RR. 1981. A seismic refraction experiment southeast of Ruapehu volcano. New Zealand Journal of Geology and Geophysics. 24(1):31–38. doi: 10.1080/00288306.1981.10422696
- Stern TA. 1979. Regional and residual gravity fields, central North Island, New Zealand. New Zealand Journal of Geology and Geophysics. 22(4):479–485. doi: 10.1080/00288306.1979.10424156
- Stern TA. 1982. Seismic and gravity investigation of the central volcanic region, North Island, New Zealand [PhD thesis]. Wellington: Victoria University of Wellington.
- Villamor P, Berryman KR. 2006. Evolution of the southern termination of the Taupo Rift, New Zealand. New Zealand Journal of Geology and Geophysics. 49(1):23–37. doi: 10.1080/00288306.2006.9515145
- Whiteford CM, Lumb JT. 1975. A catalogue of physical properties of rocks. Report 106, Geophysics Division. Wellington: N.Z. Department of Scientific and Industrial Research.
- Woodward D, Ferry L. 1974. Sheet 8 Taupo, “Gravity map of New Zealand 1:250,000”. Wellington: N.Z. Department of Scientific and Industrial Research.