
ABSTRACT
The active Aotea and Evans Bay faults underlie Wellington Harbour/Te Whanganui a Tara, and are inferred to extend south beneath Wellington City and eastern suburbs. The Aotea Fault dips east, has reverse displacement, and projects onshore beneath the western flank of Mount Victoria/Matairangi and Te Aro, where a basement fault has been inferred previously. East of Mount Victoria, the Evans Bay Fault may dip west and extend southward beneath the Rongotai isthmus. Marine seismic-reflection profiles tied to dated sediment cores indicate vertical separation rates of ∼0.6 ± 0.3 mm/yr on both the Aotea and Evans Bay faults, and evidence of at least two, and one, seafloor-rupturing earthquakes during the last 10,000 years on each fault, respectively. Previously, neither fault has been recognised specifically in seismic hazard assessments of New Zealand. We infer that earthquakes activating these faults have magnitude Mw ≥ 7, potential rupture lengths exceeding 30 km, and possibly involve multiple faults.
Introduction
Seismic hazard assessment relies on the identification of active faults capable of producing moderate to great magnitude earthquakes (e.g. Wesnousky et al. Citation1984; Cheng et al. Citation2007; Stirling et al. Citation2012). To this end, characterisation of fault geometry, sense and magnitude of surface displacement, and frequency of past earthquakes provide vital earthquake-source and paleoseismological data. Such information is particularly important in urban areas, where infrastructure and communities are most vulnerable to seismic hazard (Michettia et al. Citation2005). The current New Zealand National Seismic Hazard Model (NSHM) includes >530 earthquake-fault sources (Stirling et al. Citation2012). However, recent analysis of this model, in comparison with New Zealand’s historical record of moderate to large magnitude earthquakes since the 1840s, indicates that the NSHM appears to significantly under-represent faults capable of producing earthquakes of Mw ≥ 6.5 (Nicol et al. Citation2016). These authors suggest many large active faults, particularly those with low slip rates and long earthquake recurrence intervals, may remain, as yet, undiscovered due to the effects of surface erosion, sediment burial, or blind tips associated with growing folds.
Recent earthquake sequences in Canterbury (Beavan et al. Citation2012; Quigley et al. Citation2012), Cook Strait (Hamling et al. Citation2014), and Marlborough (Hamling et al. Citation2017; Stirling et al. Citation2017) have highlighted the significance and challenge identifying active faults hidden beneath New Zealand’s landscape. In addition to known active faults that ruptured recently in Marlborough (14 November 2016 Mw 7.8 Kaikōura Earthquake), these earthquakes collectively involved more than 20 previously unidentified active faults (Hamling et al. Citation2017; Stirling et al. Citation2017). Moreover, the Kaikōura Earthquake illustrated that some faults considered to typically rupture as individual earthquake sources are sometimes activated in large and complex earthquakes involving multiple faults (Litchfield et al. Citation2018). These events, together with other destructive moderate to large magnitude crustal earthquakes globally (e.g. Stein and King Citation1984; Hauksson et al. Citation1995; Calais et al. Citation2010), emphasise the potential contribution to the seismic hazard of previously unrecognised active faults hidden beneath population centres on plate boundaries.
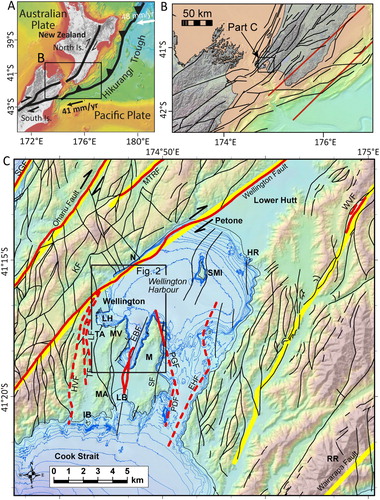
New Zealand’s capital city, Wellington, lies on the Pacific–Australian plate boundary, straddles the active Wellington Fault, overlies the Hikurangi subduction interface, and is surrounded by more than 20 known active crustal faults within a 50–60 km radius (A–B) (Barnes and Pondard Citation2010; Stirling et al. Citation2012; Wallace et al. Citation2012). Wellington’s seismic hazard profile is dominated by major strike-slip faults including the Wellington Fault (∼Mw 7.5), the Ohariu Fault (Mw 7.6) 5 km to the west, and the Wairarapa Fault (Mw 8.1) 17 km to the east, as well as the Hikurangi subduction interface (Mw 8.1–9.0) at 23 km depth beneath the city. In addition to these and other earthquake fault sources recognised in the NSHM (Stirling et al. Citation2012), previous geological and geomorphic mapping has identified many smaller bed-rock faults cross-cutting the uplifted Mesozoic greywacke basement terrain in the Wellington region (C) (Stevens Citation1990; Begg and Mazengarb Citation1996; Begg and Van Dissen Citation1998; Begg and Johnston Citation2000). There has been debate as to the late-Quaternary activity of many of these structures, which are generally considered to be of secondary importance relative to the known major faults.
Figure 1. A, Pacific–Australian plate boundary through central New Zealand. B, Crustal (black) and subduction interface (red) fault sources in the NSHM (Stirling et al. Citation2012). C, Fault structure of the Wellington Harbour/Te Whanganui a Tara and surroundings (modified from 1:50 000 map; Begg and Mazengarb Citation1996). Major active faults are shown as thick red lines. Faults considered likely to be active are red dashed lines. Other faults are shown as thinner black lines. Yellow lines are fault sources in the NSHM (Stirling et al. Citation2012). Fault labels include: SGF, Shepherd’s Gully Fault, WVF, Whitemans Valley Fault, MTRF, Moonshine-Takapu Road Fault, KF, Khandallah Fault, LF, Lambton Fault, TF, Terrace Fault, HVF, Happy Valley Fault, EBF, Evans Bay Fault, SF, Seatoun Fault, PGF, Point Gibson Fault; PDF, Point Dorset Fault; EHF, East Harbour Fault. Note (1) the MTRF was considered active by Litchfield et al. (Citation2013), (2) the PGF and PDF were considered active by Huber (Citation1992), and (3) the fine black trace of the EBF is from Huber (Citation1992). Geographic locations: LH, Lambton Harbour, LB, Lyall Bay, M, Miramar Peninsula/Te Motu Kairangi, N, Ngauranga, IB, Island Bay, MV, Mount Victoria/Matairangi, MA, Mount Albert, RR, Rimutaka/Remutaka Range, SMI, Matiu/Somes Island, HR, Hutt River/Te Awakairangi.
In this study, we present new data that characterise two active faults beneath Wellington Harbour/Te Whanganui a Tara, including the newly discovered Aotea Fault, and the previously mapped Evans Bay Fault (Lewis and Mildenhall Citation1985; Wood and Davy Citation1992). These structures appear to flank Mount Victoria/Matairangi and probably extend onshore beneath the urban environment. We use high-resolution multibeam bathymetry data, together with newly acquired marine high-resolution seismic reflection profiles tied to adjacent marine sediment borehole and core data, to map these faults and characterise their geometry and their late Quaternary displacement history and tectonic significance. We discuss their relationships to other major faults and topography, and suggest they represent previously unrecognised earthquake sources that justify inclusion in future seismic hazard assessment of Wellington City and the wider region.
Tectonic and physiographic setting
In the Wellington region, the Pacific-Australian plate boundary is characterised by oblique convergence at a rate of ∼42 mm/yr (Beavan et al. Citation2002). The region straddles the southern reaches of the North Island Dextral Fault Belt (NIDFB), and overlies the southern part of the Hikurangi subduction interface where strong inter-seismic coupling has been inferred (A) (Wallace et al. Citation2004, Citation2012; Henrys et al. Citation2013). The convergent component of plate motion is mainly accommodated on the interplate thrust (Nicol and Wallace Citation2007), whilst most of the right-lateral component is accommodated in the upper plate on dextral faults and by clockwise rotation of crustal blocks (Beanland and Haines Citation1998; Wallace et al. Citation2004). The largest and most active strike-slip faults of the southern NIDFB are the Wairarapa, Wellington and Ohariu faults, which have slip rates estimated at 8–12 mm/yr, 6–7 mm/yr, and 1–2 mm/yr, respectively (B) (Van Dissen and Berryman Citation1996; Heron et al. Citation1998; Langridge et al. Citation2005; Little et al. Citation2009). These faults have traces that cross the coastline, extending offshore into Cook Strait/Te Moana o Raukawa, where they approach and interact with major dextral faults of the Marlborough Fault System (MFS, Pondard and Barnes Citation2010).
Wellington City and harbour are surrounded by hills commonly 150–400 m above sea level, with flights of coastal marine terraces attesting to late Quaternary tectonic uplift (e.g. Ota et al. Citation1981; Stevens Citation1990; Pillans and Huber Citation1995; Begg et al. Citation2008). The SW-NE striking Wellington Fault bounds the western side of Wellington Harbour and the Hutt Valley basin (C) (Lewis Citation1989; Wood and Davy Citation1992; Begg and Mazengarb Citation1996). The fault extends to the south coast through the city and Long Gully (Langridge et al. Citation2011), and NE through the Rimutaka/Remutaka Ranges (Langridge et al. Citation2005). Other secondary-scale crustal faults mapped in the region occur in two predominant sets, striking SW-NE and approximately N-S (Stevens Citation1990; Begg and Mazengarb Citation1996). Of these secondary faults, only the Akatarawa (Van Dissen et al. Citation2001), Whitemans Valley (Begg and Van Dissen Citation1998), and Moonshine faults were included in the NSHM (B) (Stirling et al. Citation2012). However, several other faults exhibit indirect, geomorphic evidence of late-Quaternary activity and were considered by Begg and Mazengarb (Citation1996) as likely to be active. These include the Lambton Fault, Evans Bay Fault (Lewis and Carter Citation1976; Riddolls and Lewis Citation1979; Lewis and Mildenhall Citation1985), the Point Dorset and Point Gordon faults (Huber Citation1992; considered to be part of the Seatoun Fault Zone by Begg and Mazengarb Citation1996), and the Matiu/Somes Island and East Harbour faults (Wood and Davy Citation1992; Davy and Wood Citation1993) (C).
Begg and Van Dissen (Citation1998) suggested that earthquakes on the secondary-scale faults may have lengthy recurrence intervals and/or that their potential activity may have been concealed by scarp erosion and/or modification during urban development. Of particular relevance to this study in Wellington Harbour, two unnamed, bedrock faults that reach the coast at Oriental Bay and Lambton Harbour have been inferred to underlie the western flank of Mount Victoria (Begg and Mazengarb Citation1996). Uplift of Mount Victoria has resulted in Torlesse basement rocks being exposed at the summit height about 200 m above sea level (C).
The Evans Bay Fault is located immediately east of Mount Victoria and was first inferred from a linear depression in early bathymetric data from Evans Bay (C) (Stevens Citation1990). This inference was later supported by Lewis and Carter (Citation1976) using boomer seismic reflection profiles that were interpreted to indicate vertical fault separation of Holocene and late Pleistocene sediments of up to 2.5 m. They interpreted a 0.5 m-high, westward-facing seafloor fault scarp about 1.5 km in length along the centre of the bay. Subsequently, Riddolls and Lewis (Citation1979) and Lewis and Mildenhall (Citation1985) tied improved boomer seismic sections across the fault to two dated boreholes in southern Evans Bay (SB1 and SB2). The Evans Bay Fault has been inferred to extend south beneath the Rongotai Isthmus (C) (Stevens Citation1990; Begg and Mazengarb Citation1996), but its precise location and activity have been debated (e.g. Lewis and Carter Citation1976; Lewis and Mildenhall Citation1985; Huber Citation1992).
Bathymetry data show that the inner expanse of Wellington Harbour is typically about 20–25 m deep (Pallentin et al. Citation2009). Marine airgun-source seismic profiles reveal sedimentary basins on either side of a faulted central basement ridge that trends NE-SW around Matiu/Somes Island (C) (Wood and Davy Citation1992; Davy and Wood Citation1993). Quaternary sediments reach 300 m thickness in a borehole at Petone (Begg et al. Citation2008), and thicken southward offshore of Ngauranga to potentially 600 m (Davy and Wood Citation1993; Begg and Mazengarb Citation1996). These sediments attest to Quaternary net subsidence of the northern parts of the harbour and Petone, in contrast to Quaternary uplift of the surrounding topography (Ota et al. Citation1981; Pillans and Huber Citation1995; Begg et al. Citation2008). The sedimentary sequence includes alternating successions of alluvial and shallow-water marine sediments deposited during glacio-eustatic sea-level cycles (Lewis and Mildenhall Citation1985; Stevens Citation1990; Huber Citation1992; Davy and Wood Citation1993; Mildenhall Citation1994; Begg and Mazengarb Citation1996; Dunbar et al. Citation1997a; Semmens Citation2010). A Holocene (<10 ka) marine sequence represents the youngest unit, reaching 20–30 m thickness (Davy and Wood Citation1993; Willoughby et al. Citation2012). Underlying alluvial sediments, including artesian gravels associated with the Waiwhetu and older aquifers, were delivered to the flood plain by the paleo-Hutt River and other smaller streams surrounding the harbour. Historical and modern landscape and land-use changes have further affected catchment sediment sources (Goff Citation1997). Sedimentation rates in the harbour were inferred to have increased substantially from ∼2 mm/yr prior to the 1855 Wairarapa Earthquake (Dunbar et al. Citation1997b, cf. 0.5–0.8 mm/yr for pre-1855 sediments from Goff Citation1997) to more than 5 mm/yr and potentially up to 60 mm/yr at specific sites, following the earthquake.
Methods
High-resolution bathymetry and seismic reflection data
High-resolution bathymetric data cover the entire area of inner Wellington Harbour to a minimum water depth of a few metres (Pallentin et al. Citation2009) (e.g. ). These data, collected by NIWA using Kongsberg EM3000 and EM3002 multi-beam echo-sounder systems operating at a frequency of 300 kHz on survey launch Pelorus, were corrected for tides and reduced to a 0.5 m grid digital elevation model (DEM).
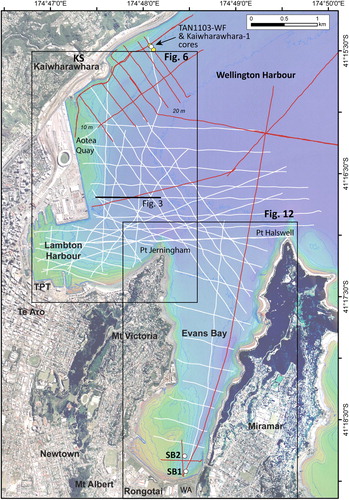
Figure 2. Boomer seismic lines acquired in the south western part of Wellington Harbour during IKA1012 (2010) and IKA1303 (2013) surveys. White lines show the extent of the IKA1303 survey, while the red lines indicate data collected during IKA1012 survey. The locations of the Kaiwharawhara-1 and Tangaroa TAN1103-WF sediment cores are shown by the white and yellow dots, respectively. Boreholes SB1 and SB2 in Evans Bay are shown by white dots. KS, Kaiwharawhara Stream; TPT, Te Papa Tongarewa (Museum of New Zealand), WA, Wellington Airport. Fine blue lines are 2 m bathymetric contours (m).
We use boomer seismic reflection data acquired on Ikatere surveys IKA1012 (2010) and IKA1303 (2013). The IKA1012 survey recorded reconnaissance profiles of Wellington Harbour, and a grid of lines over the Wellington Fault off Kaiwharawhara (Lewis Citation1989), using an Applied Acoustics CSP-S1250 S-Boom seismic source and a 25 m-long, 16 channel Geometrics GeoEel streamer with a 1.5625 m group interval (two hydrophones per group) () (Willoughby et al. Citation2012). On the IKA1303 survey, undertaken as part of the It’s Our Fault project (https://www.gns.cri.nz/Home/IOF/It-s-Our-Fault), we acquired profiles from the inner western part of the harbour using an Applied Acoustics AA301 300 Joule boomer source and the above hydrophone streamer, with a sampling rate of 0.125 ms. Seismic penetration was < 40 ms two-way travel-time (TWT) (∼30 m assuming a p-wave velocity in sediments of 1550 m/s). We processed all lines from both surveys in the same way with Globe Claritas®, as summarised in the Supplementary Material (Table S1). The seismic data are more densely spaced and are of better quality compared to earlier seismic surveys offshore of Kaiwharawhara (Lewis Citation1989) and in Evans Bay (Lewis and Carter Citation1976; Riddolls and Lewis Citation1979; Lewis and Mildenhall Citation1985). The processed data are of higher-resolution, reflecting the higher frequency content in the range from 500 to 2500 Hz. At the centre frequencies of about 1000–1200 Hz, the Ricker wavelet breadth is ∼0.6–0.8 ms, whilst the resolution after Rayleigh criterion is 0.3–0.4 ms. Considering the inferred p-wave velocity of the sediments (1550 m/s), the theoretical vertical resolution (λ/4) is about 0.3–0.4 m (where the wavelength (λ) = velocity (v)/frequency (f)). In practice, however, we estimate a measurable vertical resolution of about 0.5–1.0 m was achievable in the upper seismic-stratigraphic unit.
We correlated three prominent seismic reflections widely across the surveyed grid of profiles (, and reflections coloured yellow, red and green in ). Correlation of these reflections across the Aotea Fault was achieved via carefully positioned tie-lines running subparallel to the fault along the footwall and hanging wall sequences and tied around the northern tip of the mapped fault trace (i.e. across profiles revealing no deformation or reflection disruption). The reflections were tied directly to core and borehole data adjacent to the Wellington Fault at Kaiwharawhara (, core TAN1103-WF2), and in southern Evans Bay (). We interpreted the seismic stratigraphy across the Wellington Fault in order to tie key reflections to cores west and east of the fault trace (, cores Kaiwharawhara-1, TAN1103-WF1A and -WF1B). In the absence of borehole density and p-wave velocities that would enable development of a synthetic seismic trace for core-seismic integration, we correlated the reflections with depths calculated in the sediment cores based on an estimated p-wave velocity of 1550 (± 50) m/s. The ages of the prominent reflections above were estimated based on radiocarbon dates and average sedimentation rates (see below section Seismic stratigraphy, sediment cores, and radiocarbon dating, and the Supplementary Material).
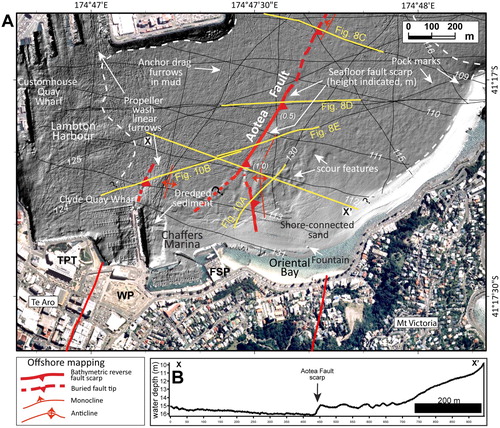
Figure 3. Seismic reflection profile from the outer part of Lambton Harbour, showing prominent reflections and seismic units deformed by the Aotea Fault. Boomer profile IKA1303-104. Refer to for line location. M denotes the seabed multiple.
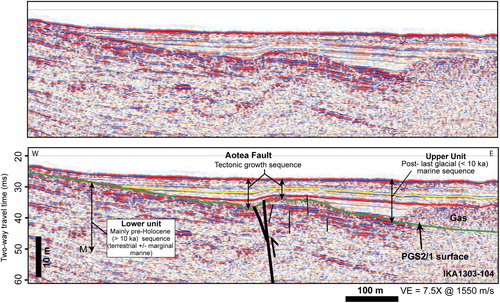
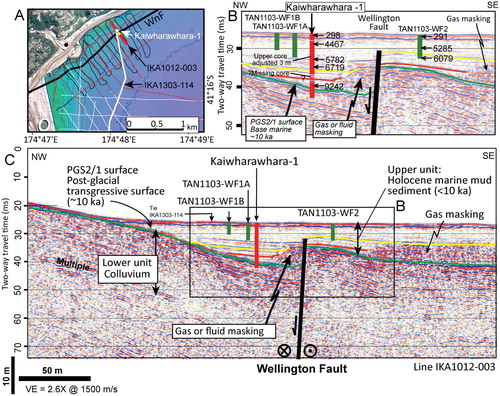
Figure 4. Seismic reflection profile IKA1012-003, showing location of sediment cores collected on either side of the Wellington Fault, offshore of Kaiwharawhara. A, IKA1012 boomer lines (in red), including profile IKA1012-003 (thick red line), IKA1303 profiles in white, and previous New Zealand Oceanographic Institute archived analogue survey data (in black) (Lewis Citation1989). Thick black line labelled WnF is the Wellington Fault, modified from Lewis (Citation1989). Kaiwharawhara-1 core, white dot; TAN1103-WF cores, yellow dots. B, Detail of profile IKA1012-003, showing sediment cores, with radiocarbon ages in calibrated years BP and interpreted reflections (green (PGS2/1), red and yellow). C. Profile IKA1012-003, showing interpreted upper and lower seismic units and key reflections (green (PGS2/1), red and yellow), sediment cores, and the Wellington Fault. The vertical scale bar and the depth-to-time conversion of sediment cores assumes a p-wave velocity in sediments of 1550 m/s.
Borehole and sediment cores: collection, processing, and dating
We used a marine-sediment core from a 12.4 m deep, sonic-drill borehole about 250 m offshore of Kaiwharawhara (), made available to NIWA in 2011 by Fugro International Ltd via a drilling contract with FMG Pacific (). The Kaiwharawhara-1 core was acquired using a sonic drilling rig onboard the barge Brandywine, which was four-point anchored over the drilling site. The site lies in 17.5 m water depth, about 20 m NW of the marine trace of the Wellington Fault (Lewis Citation1989). We also used three sediment cores, 3–5 m in length, collected in 2011 offshore of Kaiwharawhara on R.V. Tangaroa voyage TAN1103 using a Kullenberg gravity corer (, cores TAN1103-WF1A, -WF1B, and -WF2). All cores were visually logged, imaged using X-radiography, and measured for magnetic susceptibility. Details of the core processing and radiocarbon dating are provided in the Supplementary Material. The down-core data profiles assisted with stratigraphic correlation between the Kaiwharawhara-1 drill core and Tangaroa gravity cores.
Table 1. Sediment cores located offshore of Kaiwharawhara, Wellington Harbour.
Analysis of fault separation rates and displacement history
To determine vertical separation rates, the separation of reflections (including fault displacement and folding) were estimated after projecting them into the fault trace and taking account of their dip in the footwall and hanging wall sequences. We assigned an uncertainty of ± 25% to the vertical separation measurements, which takes into account the projection of the reflections across the fault (± 10%), precision of reflection/seismic wavelet picking (± 5%), depth conversion resulting from estimated seismic velocity (± 50 m/s), and the vertical seismic resolution (± 0.3 m). Estimates of vertical separation rates also account for the uncertainty in reflection ages.
In order to evaluate the recent vertical displacement history of the Aotea Fault, we analysed the Holocene tectonic growth sequence recorded in the seismic profiles. Fault-growth sequences develop when the sedimentation rate is sufficient to fill the accommodation space created by vertical deformation on a fault (Cartwright et al. Citation1998; Childs et al. Citation2003; Nicol et al. Citation2009; Barnes and Pondard Citation2010). As vertical displacement accumulates, strata and reflections from them are increasingly offset with depth. If fault growth has been episodic, such as occurs on seismogenic faults, and the average sedimentation rate exceeds the vertical displacement rate, a plot of cumulative-vertical separation against time will be characterised by a staircase displacement profile (Barnes and Pondard Citation2010; Pondard and Barnes Citation2010; Brothers et al. Citation2011). An earthquake-generating tectonic geomorphology may be identified on a staircase displacement-time curve at the onset of a stratigraphic growth interval (i.e. at the top of a sloping segment of the displacement curve). Post-seismic growth sequences may be represented by a sloping segment of the displacement-time curve, whilst zero tectonic growth is recorded by any horizontal section of the curve reflecting complete burial of the fault tip and any associated fold. Such co-seismic vertical increments of displacement are best preserved and recognisable in episodic growth sequences when individual surface displacements have sufficiently resolvable throw and when the sedimentation rate is sufficient to more than fill the accommodation space created by the vertical deformation. A less favourable situation is where the sedimentation rate cannot keep up with the long-term fault throw rate. For example, when another surface-rupturing earthquake occurs during the ongoing development of a stratigraphic growth interval and there is still preserved geomorphology associated with the fault scarp. In such as case, individual co-seismic vertical increments of displacement may be difficult to distinguish on a displacement-time curve and other co-seismic stratigraphic signatures may be required to identify them (Barnes and Pondard Citation2010).
In this study, we focussed the vertical displacement analysis on seven profiles from a 500 m long central section of the Aotea Fault, where the Holocene tectonic growth sequence is relatively more expanded compared to profiles both near shore in the south and approaching the northern tip of the mapped fault trace. For this purpose, sampling the vertical separation on reflections at the highest vertical resolution possible was critical. We limited measurements to reflections of uniform phase. The mean ages of inferred earthquakes were derived from our best estimates of their ages on multiple profiles, with error expressed at 95% confidence values determined from random distributions around the defined error magnitudes. The same analysis was not possible on the Evans Bay Fault due to a paucity of adequate data.
Results
Seismic stratigraphy, sediment cores, and radiocarbon dating
From the seismic reflection profiles, we identified two primary seismic stratigraphic units, referred to as the lower and upper units respectively, separated by an unconformity labelled PGS2/1 ().
Lower seismic unit
The lower unit is strongly reflective, and includes discontinuous to semi-continuous, moderate- to high-amplitude reflections, interspersed with patches of acoustically chaotic and/or structureless reflectivity (). This unit appears to be exposed on the seafloor around the SW margins of the harbour, but is generally buried beneath the upper unit. The lower unit was sampled in the base of the Kaiwharawhara-1 borehole (), as well as boreholes SB1 and SB2 in the southern part of Evans Bay () (Riddolls and Lewis Citation1979; Lewis and Mildenhall Citation1985). In the Kaiwharawhara-1 borehole the upper 0.6 m of the lower unit comprises a light olive-brown, firm to very hard greywacke colluvium with a clay matrix (). The colluvium is inferred to be related to alluvial fan deposition from the paleo-Kaiwharawhara Stream and/or talus deposition from the steep coastal topography that is adjacent to the site (). In boreholes SB1 and SB2 the unit comprises alternating terrestrial beds of carbonaceous sand, mud and gravel (Sequence C of Lewis and Mildenhall Citation1985). The same unit also appears to have been sampled on land, at sub-bottom depths of 10–15 m in boreholes compiled by Semmens (Citation2010), in the vicinity of Te Papa Tongarewa (Museum of New Zealand) (). There, the sequence comprises alluvial gravel, silty clay and sand, interspersed occasionally with paleosols and tephra deposits. The lower seismic unit is correlated to Pleistocene-aged lithologies on the margins of the harbour, known locally and collectively as the Wellington Alluvium (Begg and Mazengarb Citation1996; P. Kneebone, Tonkin+Taylor Ltd, pers. comm., 2017).
Figure 5. A, Lithologic log for the Kaiwharawhara-1 sediment core, with calibrated radiocarbon dates (median ± 2 sigma error). Note that the logged depths are shown here with a static shift of 3 m upwards to account for an apparent correction required to the upper sections of the core (see Supplementary Material, Figure S7). The precise depth of the lower section of the core below 7.8 m (here coloured), however, appears from the seismic sections to be too high by as much as 2 m when the static shift is applied to the entire core. This indicates uncertainty in the precise position of the lower section of the core below 7.8 m. The interpreted positions of the green PGS2/1, red and yellow reflections are indicated. B, Lithologic logs for cores TAN1103-WF1A, TAN1103-WF1B, and TAN1103-WF2, showing calibrated radiocarbon ages (median ± 2 sigma error). C, X-radiographs of Kaiwharawhara-1 core, midway down box sections 3 and 5. The darker tones indicate less dense material. Bioturbation has likely caused the mottling visible at the top and bottom of the X-radiograph of box section 3C. Shells and shell fragments are apparent as white shapes, including a large turret shell in the lower panel. The seismic reflections in the upper seismic unit must result from subtle variability in density and/or p-wave velocity. The scale bar down the left of the core shows 5 cm increments. D, Composite magnetic susceptibility (Mag sus SI) results from all cores, here showing the static shift applied to the entire Kaiwharawhara-1 core (see Supplementary Material, Figure S7).
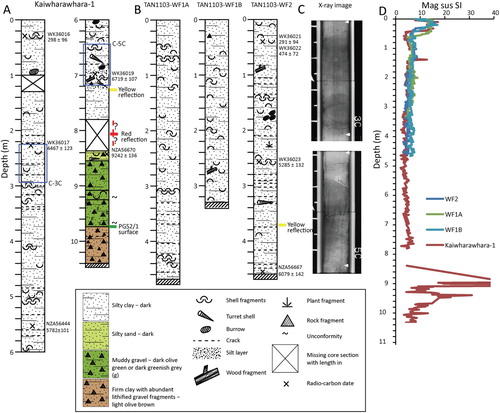
Our radiocarbon dating of sediments from Kaiwharawhara-1, together with previously published dates from boreholes SB1 and SB2 (Lewis and Mildenhall Citation1985; Goff Citation1997), indicates the lower unit is older than 10,000 ± 1500 years cal yr BP (calendar years before present; see below). The predominantly non-marine nature of the sediments reflects their deposition prior to marine inundation due to sea-level rise at the end of the last glaciation (Lewis and Mildenhall Citation1985; Davy and Wood Citation1993). The correlative unit beneath the eastern, central and northern parts of Wellington Harbour and the Hutt Valley basin comprises the Waiwhetu Artesian Gravels (Stevens Citation1956) deposited by the paleo-Hutt River, and considered coeval with the Otiran Glaciation (Marine Isotope Stages 2–4, 14–70 ka; Mildenhall Citation1994; Begg and Mazengarb Citation1996).
Post-glacial (PGS2/1) surface
The PGS2/1 surface (green reflector in ) marks the top of the lower unit, and crops out on the seafloor around the margins of the harbour. This surface is imaged in seismic reflection data as a high-amplitude, semi-continuous reflection. Stratigraphically it occurs as an onlap surface that can be traced throughout the survey lines shown in , and extensively elsewhere in the harbour (e.g. Davy and Wood Citation1993; Willoughby et al. Citation2012). The generally planar nature of this surface indicates that it represents either the last-glacial lowstand topography that was re-worked and planed during the later stages of the last marine transgression (i.e. during sea level rise associated with the transition from Marine Isotope Stages 2 to 1; Lewis et al. Citation2013). In the Kaiwharawhara-1 borehole (), the surface is correlated to about 9.8 m below seafloor, immediately underlying >1 m of olive-grey to greenish grey gravelly mud with shell fragments and abundant angular greywacke clasts. Similar marginal-marine deposits, including sand, silt and gravels with shells, were mapped in boreholes by Semmens (Citation2010) along the pre-European shoreline beneath Te Aro, south of Te Papa Tongarewa (Museum of New Zealand) ().
The PGS2/1 surface is a regional diachronous unconformity on the New Zealand continental shelf (e.g. Lamarche et al. Citation2006; Barnes and Pondard Citation2010), having formed close to sea level in the wave abrasion zone during the marine transgression that followed the last-glacial maximum (i.e. between about 18 ka and 7 ka ago). In the Kaiwharawhara-1 borehole, a thin (∼10 cm) silty sand bed at the top of the gravelly mud that overlies the PGS2/1 surface was dated at 9242 ± 136 cal yr BP (Table S2). This date supports an age estimate of 10,000 ± 1500 cal yr BP assigned to the PGS2/1 surface in the SW inner reaches of the harbour.
Upper seismic unit
The overlying upper seismic unit exceeds 20 m thickness in parts of Wellington Harbour (Davy and Wood Citation1993), pinching out around the inner fringes of Lambton Harbour (, , and ) and Evans Bay (Lewis and Mildenhall Citation1985). The unit is characterised by predominantly weak to moderate amplitude, continuous and parallel reflections that onlap the PGS2/1 surface along the margins of the harbour (e.g. ). These sediments were deposited following marine inundation of the harbour that buried remnant small-scale paleo-topography following the last-glacial transgression. The precise position of the upper unit’s pinch-out beneath Chaffers Marina, and Te Papa Tongarewa (Museum of New Zealand) is not certain and has not been mapped there ( and ). Marine sediments of probable Holocene age are present beneath reclamation fill, at about 10 m depth in boreholes at Te Papa Tongarewa (Semmens Citation2010).
Figure 6. Active traces of the Aotea Fault mapped beneath Wellington Harbour. The trace of the offshore Wellington Fault is modified from Lewis (Citation1989). Thick black lines shown on land are faults from the GNS Science 1:50 000 database; red dashed lines are inferred faults thought likely to be active (e.g. Begg and Mazengarb Citation1996). Blue lines with labels are bathymetric contours. The pinch-out of the upper seismic unit mapped in the harbour is depicted by the black dashed line near the coastline. Note the precise position of the unit’s pinch-out beneath Chaffers Marina and Te Papa Tongarewa (Museum of New Zealand; TPT) and east of Oriental Bay is not certain. Marine sediments of probable Holocene age are present beneath reclamation fill, at about 10 m depth in boreholes at TPT (Semmens Citation2010). The outline of subsurface gas masking extent is shown as a purple mask on the right-hand side of the figure. Thin black lines and white italicised labels show the boomer profile locations associated with the IKA1303 survey (see also ), unless specified. White lines indicate profiles illustrated in , and . Black circles along the Aotea Fault trace show the positions of profiles analysed in . CQW = Clyde Quay Wharf.
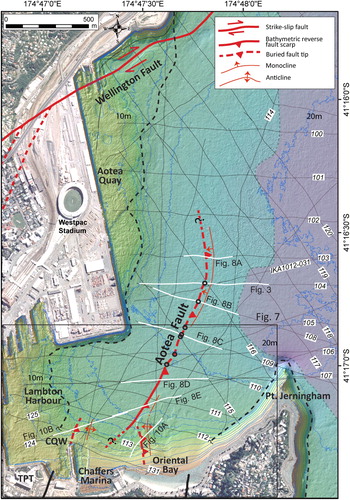
Figure 7. A, Detailed map of the southern, nearshore traces of the Aotea Fault. The inner edge of mud deposition associated with the upper seismic unit is depicted as a thin dashed white line. Thin black lines show the boomer profile locations from the IKA1303 survey. Yellow lines highlight profiles illustrated in and . Seafloor scarp heights (m) along the Aotea Fault are shown in brackets. Thin red lines on land are faults from the GNS Science 1:50 000 database (e.g. Begg and Mazengarb Citation1996). TPT = Te Papa Tongarewa (Museum of New Zealand), WP = Waitangi Park, FSP = Freyberg Swimming Pool; B, West to east bathymetric profile (X-X’) across the Aotea Fault, showing 1 m seabed scarp.
There is prominent gas masking of reflections within the upper seismic unit throughout the harbour, particularly where water depths exceed 20 m such as north and east of Point Jerningham, and in proximity to the Wellington Fault off Kaiwharawhara (e.g. and ) (Lewis Citation1989; Davy and Wood Citation1993). The gas is inferred to be biogenic, related to organic-rich mud that was transported to the harbour by rivers (particularly the Hutt River/Te Awakairangi, C). Gas-bearing sediments absorb and scatter the seismic energy resulting in zones of diffuse incoherent reflections below the gas-bearing interface. Despite gas masking across the mouth of Evans Bay, prominent reflections can be traced southward into the bay and correlated with the sedimentary units and radiocarbon-dated layers described from borehole SB2 (Lewis and Mildenhall Citation1985) ().
Sediment cores and borehole data from offshore Kaiwharawhara and in Evans Bay indicate that at these locations the upper unit is composed of 9–11 m thick, olive-grey, marine silty clays (e.g. ). This is also consistent with cores from the northern and central parts of the harbour (e.g. Goff Citation1997), where geophysical data indicate that the unit’s thickness reaches 20–30 m (Davy and Wood Citation1993). In the cores from Kaiwharawhara and Evans Bay the muddy sediment includes small (<0.5 cm) shell fragments, occasional whole mollusc valves and gastropods (e.g. turret shells), and less common woody fragments. Bedding laminations are not visible in the upper section from Kaiwharawhara, but weak laminations become more prominent below about 2–3 m below seafloor. Towards the base of the unit, very dark olive-grey silt patches become more apparent, as do shell fragments, whole shells (especially turret shells) and angular, lithified greywacke pebbles. The magnetic susceptibility values are elevated in the top 0.4 m of all three R.V. Tangaroa gravity cores and similarly the upper 0.4 m of Kaiwharawhara-1 core (corrected for depth, see Supplementary Material) (D).
Two prominent, moderately strong reflections (coloured red and yellow in ) within the upper seismic unit were traced continuously and widely throughout the grid of profiles on . Both of these reflections onlap the PGS2/1 surface, and generally deepen away from the coast. On profile IKA1012-003 the reflections intersect the borehole and radiocarbon dated sedimentary cores from offshore Kaiwharawhara (e.g. ), allowing estimates to be made of their ages. We firstly considered the radiocarbon ages of samples above and below the yellow reflection where it intersects both the Kaiwharawhara-1 and WF2 cores (B). To estimate the age of the yellow reflection at these sites, we calculated a mean sedimentation rate of 2.1 mm/yr derived from five radiocarbon ages from the upper unit between 2 and 7 m below seafloor (Table S2, Figure S9; see derivation in Supplementary Material). This rate lies within the range proposed previously for dated Holocene sediments prior to European colonisation elsewhere in the harbour (c.f. Dunbar et al. Citation1997a, b; Goff Citation1997; Goff et al. Citation1998), and is consistent with rates implied by regional Holocene isopachs (Davy and Wood Citation1993) (see Supplementary Material). The estimated age for the yellow reflection is 6380 ± 400 yr BP (at 95% confidence, assuming ± 500 year uncertainties on two individual estimates from the Kaiwharawhara-1 and WF2 cores). We estimate the age of the red reflection to be 7410 ± 1460 yr BP, assigning a larger error of ± 20% to account for increased uncertainty in the precise depths of the lower portion of Kaiwharawhara-1 core.
Aotea Fault
Structural geometry and vertical separation rate of three fault traces
We identify an active, previously undiscovered fault, herein referred to as the Aotea Fault, from the vertical separation and folding of reflections in the seismic profiles off Oriental Bay and the Aotea Quay (). The main trace of the fault is mapped for ∼2 km from the vicinity of Chaffers Marina to its northern tip, 650 m offshore from Aotea Quay and 740 m east of the Westpac Stadium (). We use the term ‘trace’, here, to represent the mapped position of the fault where it deforms Holocene sediments and/or offsets the seafloor creating a bathymetric scarp. The bathymetric expression of the fault is most apparent between 400 and 700 m NE of Chaffers Marina (B), and is illustrated on IKA1303 profiles 107a and 124 (D–E). Further north, the active fault is largely buried beneath folded Holocene sediments. Representative seismic profiles across the fault are presented in and , whilst un-interpreted versions of the sections shown in are provided in the Supplementary Material. In the following discussion, two other nearshore marine structures considered to be part of the same fault zone are referred to as the Clyde Quay Wharf and Oriental Bay traces, respectively.
Figure 8. Examples of boomer seismic reflection profiles across the Aotea Fault. See and for locations, and the Supplementary Material Figure S4 for un-interpreted sections. M denotes the seabed multiple.
The main trace of the Aotea Fault has an average strike of about 030°, swinging NW to 345° over the northernmost ∼500 m of its near-surface mapped extent (). The fault is downthrown to the west, and appears to dip to the east, although the precise dip is not well constrained by the available seismic reflection data. There is evidence of uplift and folding on the eastern (hanging wall) side of the fault. These combined features indicate a reverse component of displacement, but do not constrain any potential strike-slip component. Within 700 m from the Oriental Bay shoreline, the fault is expressed clearly in the bathymetry as a seafloor scarp up to 1.0 m high, spanning a cross-fault width of ∼20 m (A–B). Here, the fault offsets the PGS2/1 surface (green reflection) at the top of the lower seismic unit, and disrupts parallel reflections in the upper unit (E). In the hanging wall sequence east of the main trace of the fault the uplifted and locally folded lower seismic unit is dissected by additional upward-branching fault splays ( and S4). Most of these other splays do not penetrate the overlying upper unit, where this is well preserved over the fault tip, indicating their activity largely pre-dates the PGS2/1 surface.
Northeast along the strike of the fault, the main Holocene trace is buried within the upper seismic unit, which thickens towards the east. Activity of the fault (vertical displacement) during deposition of the upper unit has resulted in a fault-growth sequence across the fault tip (e.g. Barnes and Pondard Citation2010), which becomes increasingly apparent along the middle reaches of the fault trace between 1.0 and 1.7 km from shore (e.g. B–D). Here, reflections in the lower part of the upper unit on the downthrown (footwall) side of the fault are truncated against the fault plane or onlap the uplifted and folded lower seismic unit. Monoclinal-growth folding of the upper unit stratigraphy is more apparent over the northern 1 km of the fault trace (e.g. and B–C) and becomes increasingly subtle towards the northern tip of the fault ( and A).
The average strike of the offshore section of the Aotea Fault (030°), is oblique to that of the Wellington Fault, which strikes about 040° SW of the city, and 055° along the western edge of the harbour and Hutt Valley (C) (Langridge et al. Citation2011). Our data provide no direct evidence that the Aotea Fault connects directly to the Wellington Fault within the uppermost 50 m (), but it likely does so at depth. There is no evidence of Holocene deformation between the trace mapped with confidence from multiple, well resolved seismic profiles, and the Wellington Fault trace at Kaiwharawhara (∼1100 m to the north) (Lewis Citation1989).
The southern part of the Aotea Fault main trace cannot be identified confidently within 200 m of Chaffers Marina (). There is potentially a shallow structure apparent on profile IKA1303-113. However, no fault or scarp are identifiable on profile IKA1303-131 closest to the shoreline, neither within outcropping sediments of the lower unit, nor within very recently deposited cover sediments arising from the present-day beach-sand replenishment programme in Oriental Bay.
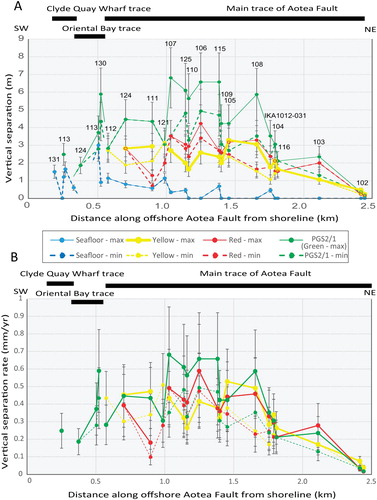
The maximum vertical separation measured on reflections correlated across the fault occurs along the middle section of the main trace (i.e. between IKA1303 profiles 111 and 108), about 1.0–1.7 km from the southern shoreline at Chaffers Marina (). Vertical separation, ranging from 1.1 to 8.8 ms TWT (∼0.9–7.0 m), was measured on the PGS2/1 surface, which we infer was reasonably planar following the marine transgression. Vertical separation of 0.9–5.5 ms TWT (0.7–4.3 m) occurs on the red reflection, and 1.4–4.2 ms (1.1–3.4 m) on the yellow horizon. These measurements contrast with the seafloor scarp which is limited to ∼1 m high approaching Oriental Bay and is absent along the northern reaches of the fault trace where the fault tip is buried (e.g. and D–E). The vertical separations on the main trace of the fault enable estimates of the maximum vertical slip rate over different periods of time (B). These rates range from ∼0.4 to 0.5 mm/yr since development of the yellow reflection horizon (i.e. 6380 ± 400 yr BP), ∼0.4–0.6 mm/yr since the red horizon (7410 ± 1460 yr BP), and 0.6–0.7 mm/yr since the PGS2/1 surface developed (10,000 ± 1500 yr BP). The maximum slip rate on the PGS2/1 surface represents our best estimate of the long-term maximum rate for the main trace of the fault.
Figure 9. A, Plot of vertical separation measured for different reflections along the strike of the Aotea Fault. Errors bars are ± 25%. In addition, estimates of maximum and minimum separations for some horizons are indicated on particular sections where the individual curves diverge. The blue line shows the seafloor offset, and the yellow, red and green lines indicate the offsets on the yellow, red and PGS2/1 horizons, respectively. B, Corresponding along-strike vertical separation rates on the Aotea Fault. Errors estimated are based on separation uncertainties of ± 25%, and the various reflector age uncertainties of ± 400 years (yellow reflector), ± 1460 years (red reflector), and ± 1500 years (PGS2/1), respectively. All lines numbered are from survey IKA1303 unless otherwise stated.
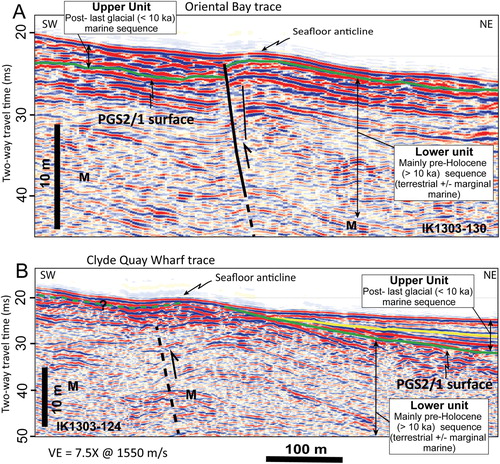
The Oriental Bay and Clyde Quay Wharf traces of the fault are observed clearly on only two seismic lines, and appear not to extend more than about 400 m from the shoreline ( and ). Considering the occurrence of asymmetric folding, the faults are interpreted to be downthrown to the west and to dip to the east, as with the main trace (). Their inferred tips may shoal to within 6–7 ms (<5 m) of the seafloor, however the precise location of the fault plane is less clear than on profiles across the main trace (cf. ). Both faults have bathymetric expression associated with an anticlinal fold with up to 3.0 m and 1.7 m of relief, respectively. The Oriental Bay trace is identified on IKA1303 profiles 113 and 130 (e.g. A), where it has an apparent strike of ∼350°, which is oblique to the main trace of the fault to the north of profile IKA1303-112 ( and ). The Oriental Bay trace may or may not connect to the main trace near profile IKA1303-112. The upper seismic unit appears to be displaced and folded by the fault on profile IKA1303-130 (A). The combined folding and vertical separation of the PGS2/1 surface is estimated to be to be 3–6 m. The fault cannot be traced with certainty to the south onto the innermost profile IKA1303-131, where remobilised beach-sand sheet-deposits extend offshore from Oriental Bay.
Figure 10. Boomer seismic reflection profiles across the Oriental Bay (A) and Clyde Quay Wharf traces (B) of the Aotea Fault. In both sections the fault is interpreted where asymmetrically folded hanging wall and footwall reflections appear to be cut off. The dashed line type in B reflects relatively increased uncertainty in the precise position of the fault plane. See for locations, and the Supplementary Material Figure S4 for un-interpreted sections. M denotes the seabed multiple.
The Clyde Quay Wharf trace of the fault is recognised just north of the area of seafloor that was excavated by dredging to enable large vessels to berth at the former International Overseas Terminal (A). The seafloor immediately NE of the wharf is scoured by linear furrows from vessel propeller wash, directly over the hanging wall anticline that is developed in the lower seismic unit (B). The anticlinal structure is mapped with certainty between IKA1303 profiles 124 and 113, and is recognised tentatively on 131. The structure does not appear to extend to profile IKA1303-112 to the north of IKA1303-124, approximately 250 m north of the end of Clyde Quay Wharf. The anticline associated with the Clyde Quay Wharf trace has buried relief on the PGS2/1 surface of about 2.5 m, and potentially up to 1–2 m bathymetric relief on the seafloor. The upper seismic unit converges and thins over the structure, consistent with a tectonic growth sequence, and may be absent from the fold crest where the lower seismic unit (possibly last-glacial age, < 30,000 years BP) could be exposed (B). This indicates that the fault may have been active in the Holocene (<10,000 years). However, we cannot, discount the possibility that the fold may represent relict topography in much older sediments, probably Pleistocene, relating to growth of the structure during the last glaciation and earlier, with the scarp preserved despite marine inundation and being only partially buried by the Holocene upper seismic unit.
Given their apparent activity and vertical separation (), similar structural style (), and proximity (< 250 m) to the main trace of the fault (), the Oriental Bay and Clyde Quay Wharf traces are considered to be part of the same fault zone. It is inferred that some or all of the vertical separation on the main trace of the fault is transferred southward onto one or both of these other nearshore traces.
Holocene fault-growth sequence and vertical separation history
We correlated individual reflections in the upper seismic unit and the PGS2/1 surface across the Aotea Fault on seven individual profiles that record a sufficiently expanded growth sequence, and measured their vertical separation. For each profile, we plotted the cumulative vertical separation against the inferred age of the reflections, which span the last 10,000 years of the fault’s displacement history (). The position of these profiles, spanning the central 500 m of the main trace of the fault, are shown on , whilst three of the profiles are illustrated in and . The two southwestern profiles (IKA1303-110 and -106) are characterised by offsets of reflections in the lower part of the upper seismic unit, and a relatively more condensed sequence over the immediate uplifted hanging wall fold (e.g. D). The five northern profiles (IKA1303-115, -105, -109, -108, and -104) cross the fault where deformation of the upper seismic unit is primarily expressed as growth folding, and where there is generally good continuity of the upper seismic unit reflections across the fault, and the uplifted sequence is relatively less condensed than nearer the southern shore as a result of lower total displacement (e.g. , B–C, and ).
Figure 11. Separation-time curves for reflections correlated across the Aotea Fault. Cumulative vertical offsets (m) of each reflection are calculated from their depth in the footwall minus their depth in the hanging wall. The inset shows the complete interval of time since development of the PGS2/1 surface, whereas the enlarged plot shows details of the primary growth intervals. Errors are estimated to be a standard value of ± 25% on all separation measurements. Uncertainties in ages vary down section, pinned by the assigned values of ± 400 years (yellow reflector), ± 1460 years (red reflector) and ± 1500 years (green reflector), respectively. Black circles around coloured symbols indicate specific recognisable displacement events (EQ1, EQ1b? and EQ2). The kilometre scale indicated in the dashed box on the right is the position of each profile along the strike of the fault from the shoreline at Chaffers Marina. Profiles used in the analysis are delineated by the ‘L’ notation, with profile positions shown as black circles in .
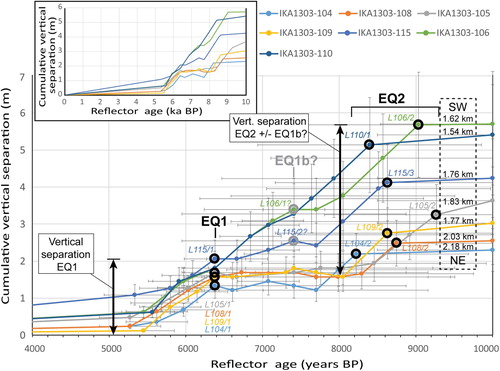
The precise shape of the vertical separation-time curves in are conditional on the accuracy of the separation measurements and horizon ages. To estimate the ages of individual reflections between the key marker horizons, we used a constant sedimentation rate of 2.1 mm/yr. The uncertainties in ages vary down section, pinned by the assigned values of ± 400 years (yellow reflection), ± 1460 years (red reflection) and ± 1500 years (green reflection), respectively. The standard uncertainty of ± 25% assigned to the individual vertical separation measurements (to account for errors associated with correlation of reflections across the fault, precision of wavelet picking, depth conversion resulting from estimated seismic velocity, and the vertical seismic resolution) is considered not to vary significantly between individual reflections on any given profile, nor substantially between adjacent profiles. Whilst the magnitude of the errors are significant, the general shapes of the displacement-time curves on are not strongly dependent on the relative uncertainties in the separation measurements between individual reflections.
Despite some variability between profiles, and assumed systematic uncertainties, the general staircase trajectories of the vertical separation-time curves show that the Aotea Fault has grown since ∼10,000 years BP at a non-uniform rate. Relatively long periods of quiescence (horizontal to gently dipping sections of the curves) are separated by relatively short periods of vertical fault growth (significantly sloping sections of the curves) () (Barnes and Pondard Citation2010). Overall there appears to be at least two and possibly three growth intervals preserved across the fault trace in the upper seismic unit.
A reflection approximately parallel to and overlying the PGS2/1 surface appears to exhibit a vertical separation equal to or very close to that of the PGS2/1 surface (). The similar vertical separation of these two horizons implies that the thin interval between them may be part of a uniformly thick sequence that once covered the fault tip and potentially extends into the underlying lower seismic unit. This >1000 year interval is represented by the oldest flat to gently sloping part of the time-separation curves and may imply an absence of vertical fault growth during this period. The earliest recognisable fault growth interval in the upper seismic unit may have initiated approximately at this first reflection immediately above the PGS2/1 surface, with an age estimated on different profiles to be 8200–9300 yr BP. The initiation of this growth interval, labelled EQ2 on , has a mean age estimated at ∼8650 ± 1300 yr BP (95% confidence interval). The growth sequence is represented by the upper sloping section of each time-separation curve, and extends for about 1000–2000 years, after which time at least five of the profiles reveal an approximately uniformly thick interval with no accrued vertical separation until about 6400 yr BP. The total vertical separation between about 8650–6400 years (i.e. between labels EQ2 and EQ1, ) reaches ∼3.5 m on profiles IKA1303-106 and -110 (see their locations on ). This maximum separation could be greater if the growth interval were, in fact, to extend downwards to the PGS2/1 surface or beneath it. As indicated from , the total vertical separation between ∼8650 and 6400 years diminishes to ∼1 m on profiles away from the locus of maximum offset.
On the separation-time curves for profiles IKA1303-106 and -115 there is a conspicuous inflection associated with a possible flat zone between ∼7400 and 7800 yr BP which separates two possibly distinctive intervals of growth stratigraphy (i.e. two separated sloping sections of the curve) (). This feature is suggestive of a period of uniformly thick sedimentation across the fault in this area and possible re-initiation of growth stratigraphy at about 7400 ± 2100 yr BP (labelled EQ1b? on ). The flat section of curve, however, is not observed on other profiles, indicating the feature may be localised.
The latest recognisable interval of vertical fault growth on the main trace of the Aotea Fault, representing up to ∼2 m of vertical separation, appears to have initiated at about 6400 yr BP (). The onset of this phase of growth is represented by the break in slope labelled EQ1 on the separation-time curves for five profiles. The curves show that most of this fault-growth sequence developed between about 6400 and 5000 years ago, with little evidence of growth since. There is however, insufficient seismic resolution and/or reflection continuity in the uppermost ∼2 m of sediment to resolve further stratigraphic details of this interval.
Evans Bay Fault
Structural geometry and vertical separation rate
The new seismic profiles from the IKA1012 and IKA1303 surveys are consistent with the interpretation of a fault and associated fold beneath Evans Bay (), as interpreted by previous workers (e.g. Lewis and Mildenhall Citation1985; Stevens Citation1990). Although we consider it not as well imaged as the Aotea Fault, we interpret the Evans Bay Fault to coincide with offset reflections and localised folding of late Pleistocene and Holocene stratigraphy. The sense of throw appears to be consistently down to the east ( and S6), not to the west as suggested previously by Lewis and Carter (Citation1976). The fault trace strikes 010–020° (N-NNE) and extends for about 3.5 km from the southern shore of the bay almost to Point Halswell (). Lewis and Mildenhall (Citation1985) recognised the fault in older seismic sections from the southern part of the bay, where it bounds the western edge of a sediment-filled trough extending along the eastern side of Evans Bay. These authors did not consider the fault to be active, however, inferring instead that folded Holocene sediments may represent differential compaction across the edge of the basin, perhaps related to seismic shaking events (e.g. Riddolls and Lewis, Citation1979; Huber, Citation1992).
Figure 12. Map of the active Evans Bay Fault. The inner edge of mud deposition associated with the upper seismic unit is depicted as the dashed black line. The extent of subsurface gas masking in the northern part of the bay is represented by the purple mask in the north of Evans Bay. Blue lines with labels are bathymetric contours. Boreholes SB1 and SB2 in southern Evans Bay are shown as white dots. Thin black lines and white italicised labels show the boomer profile locations associated with the IKA1303 survey (see also ), unless specified. Thin white dashed lines are older profiles presented by Lewis and Mildenhall (Citation1985). White lines indicate profiles illustrated in . The onshore extension of the Evans Bay Fault in Rongotai (bold red, including line labelled B&M) is modified from Begg and Mazengarb (Citation1996). For comparison with our results, the thin red dashed line with label LC&LM was the inferred active trace of the Evans Bay Fault as mapped by Lewis and Carter (Citation1976) and Lewis and Mildenhall (Citation1985). WA, Wellington Airport.
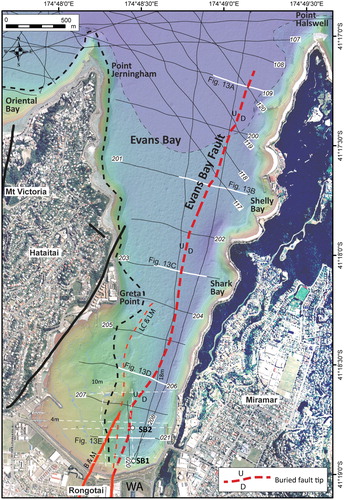
Figure 13. Boomer seismic profiles across the Evan Bay Fault, Wellington Harbour. Refer to for line locations. The bold black line is the primary trace of the fault, dashed where inferred. Coloured reflections are as on , , and . M denotes the seabed multiple. Part E displays the lithological log of borehole SB2 (Lewis and Mildenhall Citation1985), as defined by (1) mud, (2) laminated sandy mud, (3) carbonaceous muds, sands and gravels, (4) peat, and (5) shelly sands. Label 10350 alongside the log is a radiocarbon age (yr BP) from Lewis and Mildenhall (Citation1985).
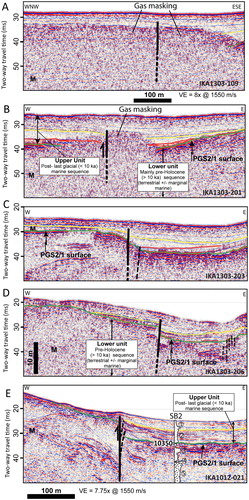
The new profiles interpreted here from the southern part of Evans Bay reveal vertical offset of the PGS2/1 surface and younger horizons, including the yellow reflection (∼6380 years), indicating the fault has been active during the Holocene (C–E, S6). There is growth stratigraphy evident across the buried tip of the fault in the upper seismic unit. In the southern part of the bay the fault tip lies 2–5 ms (TWTT) (∼2–4 m) beneath the seafloor, and reflections within the downthrown (eastern) side either truncate against the fault plane or onlap to the west against uplifted components of the lower seismic unit. At Shelly Bay and further north, on profiles IKA1303 lines 202, 201, 117, 200, 120, and 109 ( and A–B), the upper seismic unit is monoclinally folded above the inferred fault tip. There is localised deepening of the seafloor east of the fault trace (), potentially reflecting a combination of deformation and tidal scour along the western coast of Miramar Peninsula/Te Motu Kairangi. Although the fault displacement appears to be consistently downthrown to the east it is difficult to unequivocally determine the fault’s dip. Some profiles in the south are suggestive of a steep westerly dip and a reverse component of displacement (D–E, S6). Close to the northern tip of the fault trace, shallow acoustic gas masking obscures the deformation of the PGS2/1 surface and the lower parts of the upper seismic unit (e.g. A–B).
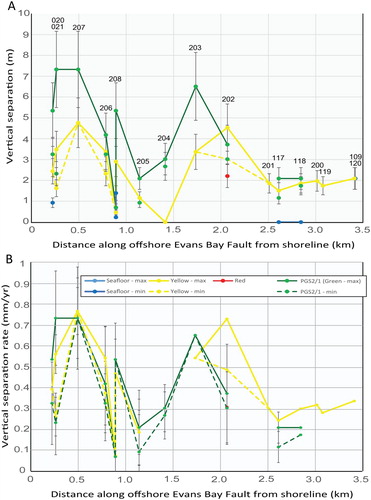
We measured minimum and maximum values of the vertical separation of the yellow reflection and PGS2/1 surface across the fault and plotted these against distance along its strike (A). The maximum separation reaches about 6–7 m on the PGS2/1 surface (∼10,000 years), and 3–4 m on the yellow reflection (∼6380 years). The maximum vertical separation rate is 0.6–0.7 mm/yr in the south, decreasing to 0.2–0.3 mm/yr in the north (B).
Figure 14. A, Plot of vertical separation measured for different reflections along the strike of the Evans Bay Fault. Errors bars are ± 25%. In addition, estimates of maximum and minimum separations for some horizons are indicated on particular sections where the individual curves diverge. B, Corresponding along-strike vertical separation rates on the Evans Bay Fault. Errors estimated are based on separation uncertainties of ± 25%, and the various reflection age uncertainties of ± 400 years (yellow reflection), ± 1460 years (red reflection) and ± 1500 years (green, PGS2/1), respectively. Lines 020 and 021 are from IKA1012 survey. All other lines are from survey IKA1303 (see for profile locations).
Lewis and Carter (Citation1976) and Lewis and Mildenhall (Citation1985) interpreted a second fault in the southern part of Evans Bay, inferring it to be downthrown to the west (). This feature was inferred to be linear and coincident with a seafloor depression that diverges up to 300 m west of the Evans Bay Fault and extends northwards to the area east of Greta Point. The presently available high-resolution bathymetry data, however, show this depression to be a partially infilled relict channel, as described in Māori oral history (Best, Citation1923; Huber, Citation1992), or current scour, possibly related to tidal flows across the shallow platform in the SW corner of Evans Bay (). We consider the new seismic sections reveal no evidence of fault displacement beneath this feature.
Discussion
Relationship of the Aotea and Evans Bay faults to other local faults, Mount Victoria, and Miramar Peninsula
Our observations above based on high-resolution bathymetry data and shallow penetration seismic reflection profiles tied to offshore boreholes and cores indicate the presence of two active faults beneath Wellington Harbour, lying northwest and east of Mount Victoria/Matairangi, respectively. Both faults have vertical slip rates over the last 10,000 years of up to 0.6–0.7 mm/yr. The seismic profiles are of insufficient sub-bottom penetration to confirm if the faults are basement-involved, but their alignment with prominent onshore topography associated with exposed basement rocks is consistent with this interpretation (e.g. Stevens Citation1990). Significant Holocene displacements on the Aotea Fault close to Chaffers Marina indicate that one or more of the mapped traces very likely extends to the south onshore into the Te Aro suburb (). Indeed, the marine traces align closely with the break in topographic slope along the lower western flank of Mount Victoria. Furthermore, on the basis of borehole data on land, Begg and Mazengarb (Citation1996) inferred a subsurface fault beneath the eastern side of Te Aro, aligning closely with the newly mapped Clyde Quay Wharf and main traces of the Aotea Fault offshore ( and ). The fault inferred beneath Te Aro coincides approximately with an abrupt deepening to the west of unconsolidated sediments (to > 100 m thickness) associated with a SW-NE aligned change from shallow soil and rock site conditions (New Zealand Standards NZS1170.5:2004 Site Class Definition Classes C and B, respectively) along the lower slopes of Mount Victoria to deep or soft soil conditions (NZS1170.5:2004 Site Class Definition Class D) beneath Te Aro (Semmens Citation2010).
These features are consistent with the interpretation that the Aotea Fault extends beneath the city along the western flank of Mount Victoria/Matairangi, in the vicinity of the break in topographic slope between Mount Victoria and Te Aro and the westward deepening of basement rocks sampled in boreholes on land (A–B). Furthermore, the apparent distribution of nearshore deformation across three traces of the Aotea Fault over a lateral width of up to 450 m, raises the possibility that multiple fault traces may extend onshore to the south. The SE dip and reverse component of displacement observed on the fault offshore is consistent with Torlesse greywacke basement rocks outcropping in the hanging wall of the fault at a road-side cliff immediately opposite Chaffers Marina (), and with uplift of Torlesse basement on Mount Victoria (Begg and Mazengarb Citation1996). The reverse component and apparent SE dip are also consistent with uplifted marine terraces evident in the topography of Mount Victoria (e.g. Ota et al. Citation1981). Whilst these terraces remain undated, consideration of the 1855 Mw > 8 Wairarapa Earthquake suggests that their long-term uplift possibly reflects combined deformation associated with the Aotea, Wairarapa, and Hikurangi subduction faults, potentially perturbed by subsidence events associated with earthquakes on the Wellington Fault (e.g. Pillans and Huber Citation1995; Begg and McSaveney Citation2005; Begg et al. Citation2008).
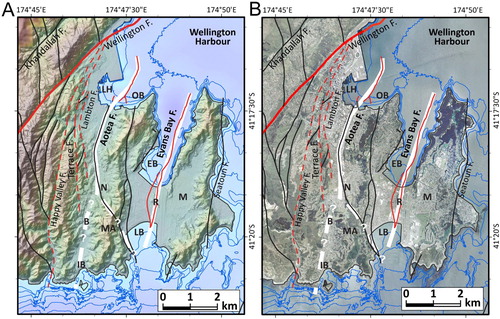
Figure 15. Major crustal faults in the Wellington region modified from Begg and Mazengarb (Citation1996), overlain onto topography and bathymetry (A) and ortho-photography (courtesy of Land Information New Zealand) (B). Red solid lines denote faults that are demonstrably active; red dashed faults were considered by Begg and Mazengarb (Citation1996) to likely be active. Other faults with uncertain activity are shown in black. Bold white lines indicate the inferred crustal extents of the active Aotea and Evans Bay faults, including their possible southern onshore extensions. The inferred southern extension of the Aotea Fault to the south coast at Lyall Bay (LB) (dashed white line) is from Begg and Mazengarb (Citation1996). A possible alternative extension south to Island Bay (IB) is proposed here. The inferred southern extension of the Evans Bay Fault onshore is from Stevens (Citation1990), Lewis and Carter (Citation1976), Huber (Citation1992), Pillans and Huber (Citation1995) and Begg and Mazengarb (Citation1996). Geographic locations: LH, Lambton Harbour; OB, Oriental Bay; EB, Evans Bay; M, Miramar; N, Newtown; MA, Mount Albert; B, Berhampore; R, Rongotai.
Onshore, south of Mount Victoria/Matairangi, the potential continuity and approximate location of the Aotea Fault is highly speculative. Based on sedimentary drainage observations in late Quaternary sediments (John Begg, GNS Science, pers. comm., 2014), Begg and Mazengarb (Citation1996) inferred the southern part of their inferred fault to swing to a NW-SE strike through Newtown, and to extend across Mount Albert into Lyall Bay (). Alternatively, we speculate that on the basis of regional geomorphology the fault zone may potentially extend southward through Berhampore to Island Bay, beneath the western flank of Mount Albert.
Our study of the Evans Bay Fault indicates that it is longer than previously inferred (extending along the length of the bay), is downthrown to the east (not the west cf. Lewis and Carter Citation1976), and appears to have been active during the Holocene (cf., Lewis and Mildenhall Citation1985; Huber Citation1992; Pillans and Huber Citation1995). The Holocene vertical separation rate on the southern part of the fault, reaching 0.6–0.7 mm/yr close to the southern shoreline of the bay (D–E and ), is supportive of previous suggestions that the fault extends onshore to the south beneath the Rongotai isthmus (Stevens Citation1990; Begg and Mazengarb Citation1996). Begg and Mazengarb (Citation1996) inferred the fault to bifurcate around a 30 m-high hill of exposed greywacke bedrock in Rongotai, and to extend south into Lyall Bay (). This relationship implies that the fault involves Torlesse basement rocks, and is not limited to the shallow sedimentary stratigraphy imaged in the marine seismic sections from Evans Bay. The Rongotai basement high is thought to have separated two former deeply incised tidal channels that once linked the Wellington Harbour with the south coast, prior to formation of the Rongotai isthmus as a tombolo (Best Citation1923; Lewis and Carter Citation1976; Stevens Citation1990; Huber Citation1992).
Based on a previous study of co-seismically uplifted Holocene paleo-shorelines in Kilbirnie, Lyall Bay and Miramar (), Huber (Citation1992) and Pillans and Huber (Citation1995) argued that the Evans Bay Fault was unlikely to have been active during the last 6500 years. They measured comparable heights (∼7–9 m above sea level) in different, isolated areas of what was inferred to be the same, highest recognisable paleo-shoreline (PS8, ∼5700–7300 years), suggesting a lack of differential uplift across the fault. The highest paleo-shoreline was not dated everywhere, however, with correlation of separate sequences in different areas hinging on the dating of younger paleo-shorelines PS4 and PS5 (∼4900–5400 years and 2700–3400 years, respectively). Despite the comparable heights for the highest recognisable paleo-shoreline in each area, they observed that the well-constrained paleo-shoreline PS4 is elevated more than 3 m above the same feature in Miramar. The difference in height was inferred to be due to differential compaction, but would be equally consistent with our observations of Holocene uplift to the west on the Evans Bay Fault. Whilst the deeper geometry of the fault remains unknown, the consistent sense of throw, down to the east in Evans Bay, suggests that the fault plays no role in the uplift of the nearby Miramar Peninsula/Te Motu Kairangi ().
Past earthquake history
The Aotea and Evans Bay faults that flank each side of Mount Victoria/Matairangi with opposing sense of vertical throw and possibly dip direction, appear to be crustal-scale structures that displace and locally uplift the Torlesse terrane basement rocks. With no evidence of fault creep beneath the lower flank of Mount Victoria (nor on any other New Zealand crustal faults; Stirling et al. Citation2012), but clear evidence of an episodic Holocene vertical displacement history (), we interpret the Aotea and Evans Bay faults to have developed during surface-rupturing earthquakes. The vertical displacement history of these faults, recorded in the growth stratigraphic architecture, therefore, has implications for past earthquakes.
We consider that at least two fault growth intervals can be recognised in the last ∼10,000 years on the northern, offshore section of the Aotea Fault (). These imply at least two surface-rupturing earthquakes on the fault, which we label EQ2 and EQ1, respectively. The earliest recognisable possible earthquake (EQ2) initiated the growth interval close in time to the development of the PGS2/1 surface, with a mean age of 8650 ± 1300 years at 95% confidence. The growth sequence extended for about 1000–2000 years, after which time at least five of the profiles reveal an approximately uniformly thick interval until about 6400 yr BP. The vertical separation between ∼8650 and 6400 years (i.e. between labels EQ2 and EQ1) reaches ∼3.5 m on IKA1303 profiles 106 and 110, assuming the growth interval did not initiate below the PGS2/1 surface. Whilst the conspicuous inflection on the time-separation curves for IKA1303 profiles 106 and 115 () could potentially result from another earthquake at about 7400 ± 2100 yr BP (labelled EQ1b?), there is no clear evidence for this event on most of the other profiles.
The inferred earthquake that triggered the initiation of the latest recognisable fault growth interval (EQ1) occurred at about 6380 ± 940 yr BP (). If it were the last earthquake on the fault, it resulted in up to ∼2 m of vertical separation, with the post-seismic growth interval largely restricted to the period between ∼ 6400 and 5000 years ago. We cannot recognise any younger earthquakes that could contribute to the vertical separation, but we cannot discount this possibility. Although details of the top 1 m are not resolved in the seismic sections due to the automatic gain control that is applied, the likelihood of anomalously high sedimentation rates in this interval related to anthropogenic activities (i.e. late 1800–1900s; Dunbar et al. Citation1997b; Goff Citation1997) would have contributed to either the tail of the youngest post-seismic growth interval or to uniformly thick sedimentation across the fault tip.
The pertinent paleoseismic data from the Aotea Fault are summarised as follows: (1) Up to 6–7 m of total vertical separation developed since ∼10,000 years BP, implying a maximum vertical slip rate of 0.6 ± 0.3 mm/yr; (2) at least two surface-rupturing earthquakes occurred since 10,000 years BP; (3) up to ∼3.5 m of co-seismic vertical separation occurred at about 8650 yr BP and ∼2 m of co-seismic vertical separation occurred at 6380 yr BP; and (4) there is a variable recurrence interval (RI) between the earthquakes recognised of 2250–6400 years if only two events occurred.
The vertical separation history of the Evans Bay Fault cannot be resolved with the same resolution as for the Aotea Fault. The Evans Bay Fault is not as clearly imaged, there appears to be more stratigraphic complexity, at least in the southern part of the bay (e.g. E), and there are too few reflections that can be confidently correlated across the fault. In the southern part of Evans Bay the inferred fault displacement and folding of the yellow reflection by up to ∼4 m (e.g. C–E) implies that the fault has ruptured since about 6380 years BP. Larger vertical separation of up to 6–7 m inferred on the PGS2/1 surface implies either that at least one other earthquake occurred on the fault in the early Holocene prior to 6380 years BP or that the PGS2/1 surface was never planar and formed across an existing scarp associated with one or more earthquakes prior to 10,000 years BP. We consider that possible future work on the raised paleo-shorelines in Kilbirnie, Lyall Bay and Miramar (Huber Citation1992; Pillans and Huber Citation1995) could yield additional paleo-seismic data for this fault.
Potential earthquake source characteristics, and implications for seismic hazard of Wellington City
A synthesis of New Zealand’s paleoseismic active-fault records by Nicol et al. (Citation2016) concluded not only that the NSHM of Stirling et al. (Citation2012) appears to be significantly under-represented by faults capable of producing earthquakes of Mw ≥ 6.5, but that surface-rupturing earthquakes in New Zealand are unlikely for magnitudes of Mw < 7. For these reasons the demonstrated activity, surface rupture, and paleo-seismic records of the Aotea and Evans Bay faults presented herein have direct relevance and implications for seismic hazard assessment of Wellington City.
To investigate potential rupture scenarios and earthquake magnitudes associated with both the Aotea and Evans Bay faults, we considered empirical relationships between fault length and area, earthquake magnitude (Mw) and average co-seismic displacements for three hypothetical fault lengths of 9, 15 and 30 km (± 10%) (sources AF/EBF1 to 3 in ) (e.g. Wells and Coppersmith Citation1994; Stirling et al. Citation2012). In these calculations, the empirical relationships for New Zealand crustal reverse faults were used, the faults were assigned an average dip of 65 ± 15°, the tip of the fault was assigned to the seafloor, and the base of the fault to crustal depths of 15 ± 2 km. We also considered the offshore vertical slip rate data to derive possible recurrence intervals between earthquakes. We used the longest-term (10,000 year) average slip rates that we have data for of 0.6 ± 0.3 mm/yr, constrained by vertical separations of the PGS2/1 surface.
Table 2. Three hypothetical earthquake source scenarios for fault rupture lengths of 9–30 km, based on equations used in the national seismic hazard model (NSHM) (Stirling et al. Citation2012).
The hypothetical scenario AF/EBF1 involves a 9 km-long rupture, such as illustrated for the Aotea Fault on , in which the fault extends from Lambton Harbour to the south coast of Wellington (perhaps via Island Bay, or Lyall Bay as inferred by Begg and Mazengarb Citation1996). This scenario would produce earthquakes of about Mw 6.1–6.4, average co-seismic displacements of ∼0.6–0.7 m, and average recurrence intervals (RI) of ∼1000 years (range ∼600–2300 years) (). Scenario AF/EBF2 involves a 15 km-long rupture, perhaps extending further south to beneath the inner continental shelf off the south coast of Wellington, where little marine geophysical data currently exists. This scenario would produce earthquakes of about Mw 6.4–6.7, average co-seismic displacements of ∼0.9–1.1 m, and average RI of ∼1700 years (range ∼1000–3800 years). Scenario AF/EBF3 involves a hypothetical 30 km-long rupture, representing, for example, an extension of the fault still further south into central Cook Strait, or co-rupture with another local fault. This scenario produces earthquakes of about Mw 6.8–7.1, average co-seismic displacements of ∼1.9–2.3 m, and average RI of ∼3500 years (range ∼2100–7700 years) ().
Scenarios AF/EBF1 and AF/EBF2 are considered unlikely because the earthquake magnitudes are smaller than expected for surface rupture (Nicol et al. Citation2016), and they have relatively short RIs requiring a significantly greater number of earthquakes to account for the total vertical separation that is observed on the marine parts of the faults. The most compelling earthquake source scenario of the three in is AF/EBF3, which produces average co-seismic displacements (∼1.9–2.3 m) and recurrence intervals (average RI ∼3500 years, range ∼2100–7700 years) comparable to our observations, and magnitude sufficiently high to potentially produce surface rupture. In comparison with AF/EBF3, a single co-seismic displacement of ∼4 m (i.e. the vertical separation that accrued between ∼8650 and 6400 years ago on the Aotea Fault, and S9) would require an earthquake of about Mw 7.2–7.5 with rupture length in the order of 60 km. The latter scenario would be comparable to a rupture of the Hutt Valley segment of the Wellington Fault, but remains significantly smaller in magnitude than an earthquake on the southern Hikurangi subduction interface ().
From consideration of these hypothetical earthquake sources and the possible crustal structure of the Aotea and Evans Bay faults (e.g. ), we suggest two possible seismic scenarios. One is that if these faults fail singularly in surface-rupturing earthquakes (i.e. without co-seismic rupture of any other faults nearby), they must extend significantly (> 20 km) to the north and/or south compared to their mapped marine traces and inferred on land extensions. A second possibility, and the option we favour, is that that their repeated multi-metre displacements are likely associated with more complex earthquakes involving multiple faults, potentially including the Wellington Fault and/or the Hikurangi subduction interface (e.g. Beavan et al. Citation2012; Meng et al. Citation2012; Fletcher et al. Citation2014; Hamling et al. Citation2017). This latter option would be consistent with potential inter-connectedness of the Wellington fault network at a crustal scale. For example, we note that although the basement dips on the Aotea and Evans Bay faults are not constrained, the narrow separation of their surface traces across the strike of Mount Victoria (i.e. ∼2.6 km apart) suggests that if the faults have opposing dip, they possibly intersect at upper crustal depths of c. < 5–8 km.
The Aotea and Evans Bay faults both represent unrecognised seismic hazards in Wellington City. Not only are they expected to generate large-magnitude, surface-rupturing earthquakes (M ≥ 7) that will generate strong ground-shaking throughout the Wellington region, their proximity will likely deliver significant high frequency ground motions that will impact on specific engineering structures (e.g. Holden et al. Citation2013; Bradley et al., Citation2017). Both faults are inferred to extend on land beneath the built environment of the city. To mitigate potential ground rupture damage in future earthquakes associated with these faults, we therefore consider it important that future research efforts, including geophysical surveys and borehole logging, are directed at locating their onshore and possible southern offshore locations, and further characterising their past earthquake histories.
Conclusions
The active Aotea and Evans Bay faults underlie the western part of Wellington Harbour, and are inferred to extend beneath Wellington City and its eastern suburbs. The Aotea Fault, mapped offshore for 2.5 km, strikes SW-NE and is downthrown to the west. The fault appears to dip to the east, implying a reverse component of displacement. The maximum Holocene vertical separation rate is ∼0.6 ± 0.3 mm/yr. There is no constraint on whether lateral displacement has occurred on the fault. To the north, there is no indication from surface deformation for direct linkage with the Wellington Fault trace, but a possible deeper connection of the two is likely. To the south, traces of the Aotea Fault are inferred to continue onshore beneath the eastern side of Te Aro and the western lower flank of Mount Victoria/Matairangi where an unnamed basement fault has been previously inferred from borehole data. The Aotea Fault has likely contributed to the uplift of Mount Victoria. From its episodic vertical separation history at least two earthquakes are inferred on the fault since 10,000 years BP with surface displacements of up to 2 m and potentially up to 4 m, respectively. These earthquakes occurred at approximately 6380 ± 940 yr BP (EQ1) and 8650 ± 1300 yr BP (EQ2), indicating a possible recurrence interval ranging from 2200 years to > 6400 years.
The Evans Bay Fault is mapped offshore for 3.6 km, strikes SW-NE, similar to the Aotea Fault, and is downthrown to the east. The fault possibly dips west implying a reverse component of displacement, and is inferred to extend south beneath the Rongotai isthmus. Given their possible opposing dips and narrow surface separation (i.e. ∼2.6 km) we speculate that the Aotea and Evans Bay faults may intersect at a depth of < 5–8 km beneath Mount Victoria. As with the Aotea Fault, there are no constraints on whether lateral displacement has occurred on the Evans Bay Fault. The maximum Holocene vertical separation rate is estimated at ∼0.6 ± 0.3 mm/yr. Although the vertical separation history cannot be determined with the same resolution as the Aotea Fault, we infer at least one earthquake on the fault during the Holocene.
Considering the evidence for Holocene surface displacement on the Aotea and Evans Bay faults, together with previously published empirical relationships and surface rupture statistics for active New Zealand faults and historical earthquakes, it is likely that surface rupture on the faults occurred during earthquakes of magnitude ≥ Mw7. This would require total rupture lengths of the order of 30 km or greater, much longer than their currently mapped extents. We consider that if the Aotea and Evans Bay faults fail singularly in surface-rupturing earthquakes (i.e. without co-seismic rupture of any other faults nearby), they must extend significantly (> 20 km) to the north and/or south compared to their mapped marine traces and inferred on land extensions. Alternatively, surface rupture on these faults may be associated with more complex earthquakes involving multiple faults, potentially including the Wellington Fault and/or the Hikurangi subduction interface. The Aotea and Evans Bay faults should therefore be considered in future seismic hazard assessments of the Wellington region.
Supplemental Material
Download MS Word (8.9 MB)Acknowledgements
Thanks to Adam Darling and Neil MacDonald (Applied Acoustics Engineering Ltd) for providing the raw data from Ikatere survey IKA1012. Claire Castellazzi (formerly NIWA) and Steve Wilcox (NIWA) assisted with this survey. We also thank Ikatere skipper Andrew James, Steve Wilcox and Will Quinn for their help with geophysical survey IKA1303. Christoff Mueller (GNS Science) provided advice during our processing of the geophysical data, including his algorithm for deconvolution. The officers and crew of RV Tangaroa and the NIWA scientific party on TAN1103 are acknowledged for their assistance in recovering the three gravity cores from offshore Kaiwharawhara, as are Lisa Northcote for micro-fossil picking for radiocarbon dating and Helen Neil for advice on 14C reservoir ages. Scott Widness and Bob Waugh (Fugro International Ltd) and Matt Brown (FMG Pacific) provided us with the opportunity to recover the Kaiwharawhara-1 borehole sediment core. The officers and crew of the Brandywine are also acknowledged for the platform they provided for the sonic drilling rig. Alan Beu (GNS Science) undertook the macro-fossil shell identifications prior to radiocarbon dating, and John Begg (GNS Science) provided some insights into the onshore mapping of the surficial geology and fault structures in the Wellington region. We thank Hannah Brackley and Russ Van Dissen (GNS Science) for their support, advice, and discussion during the It’s Our Fault project, which co-funded this work. Additional funding was provided by Iain Dawe (Greater Wellington Regional Council), NIWA SSIF Core Project ‘Submarine Geological Hazards’, and NIWA SSIF Core Programme ‘Marine Resources and Physical Processes’. We appreciate the thorough reviews of the manuscript by John Begg and Richard Kellet, both of which led to significant improvements in the final paper.
Disclosure statement
No potential conflict of interest was reported by the authors.
ORCID
Philip M. Barnes http://orcid.org/0000-0002-1050-9498
Scott D. Nodder http://orcid.org/0000-0002-1963-8907
Susi Woelz http://orcid.org/0000-0003-3646-8169
Alan R. Orpin http://orcid.org/0000-0003-2054-7081
Additional information
Funding
Related Research Data
References
- Barnes PM, Pondard N. 2010. Derivation of direct on-fault submarine paleoearthquake records from high-resolution seismic reflection profiles: Wairau Fault, New Zealand. Geochem Geophys Geosys. 11:Q11013. doi:10.1029/2010GC003254.
- Beanland S, Haines J. 1998. The kinematics of active deformation in the North Island, New Zealand, determined from geological strain rates. New Zeal J Geol Geophys. 41:311–323. doi:10.1080/00288306.1998.9514813.
- Beavan J, Motagh M, Fielding EJ, Donnelly N, Collett D. 2012. Fault slip models of the 2010–2011 Canterbury, New Zealand, earthquakes from geodetic data and observations of postseismic ground deformation. New Zeal J Geol Geophys. 55:207–221. doi:10.1080/00288306.2012.697472.
- Beavan J, Tregoning P, Bevis B, Kato T, Meertens C. 2002. Motion and rigidity of the pacific plate and implications for plate boundary deformation. J Geophys Res. 107(B10):ETG 19-1–ETG 19-15. doi:10.1029/2001JB000282.
- Begg JG, Johnston MR. 2000. Geology of the Wellington area. Institute of Geological & Nuclear Sciences, 1:250 000 geological map 10. Lower Hutt, New Zealand: Institute of Geological & Nuclear Sciences Ltd (now GNS Science Ltd). 64 p.
- Begg J, Langridge R, Van Dissen R, Little T. 2008. Field Trip 1. Wellington Fault: Neotectonics and earthquake geology of the Wellington-Hutt Valley Segment. Geosciences 2008 Field Trip Guides. Geosciences Society of New Zealand. 67 p.
- Begg JG, Mazengarb C. 1996. Geology of the Wellington area. Institute of Geological & Nuclear Sciences, 1:50 000 geological map 22. Lower Hutt, New Zealand: Institute of Geological & Nuclear Sciences Ltd (now GNS Science Ltd). 128 p.
- Begg J, McSaveney M. 2005. Wairarapa Fault rupture–vertical deformation in 1855 and a history of similar events from Turakirae head. In: Langridge R, Townend J, Jones A, compilers. The 1855 wairarapa earthquake symposium, 150 years of thinking about magnitude 8+ earthquakes and tsunami hazard in New Zealand. Wellington (New Zealand): Greater Wellington Regional Council; p. 21–30.
- Begg JG, Van Dissen RJ. 1998. Whitemans Valley Fault: a newly discovered active second order fault near Wellington, New Zealand–implications for regional seismic hazard. New Zeal J Geol Geophys. 41:441–448. doi: 10.1080/00288306.1998.9514821
- Best E. 1923. Miramar Island and its history: How Motu-kairangi was discovered and settled by Polynesians, and how, in times long past, it became Miramar Peninsula. Trans New Zeal Inst. 54:779–791.
- Bradley BA, Wotherspoon LM, Kaiser AE. 2017. Ground motion and site effect observations in the Wellington region from the 2016 Mw7. 8 Kaikoura, New Zealand earthquake. Bull New Zeal Soc Earthquake Eng. 50(2):94–105.
- Brothers D, Kilb D, Luttrell K, Driscoll N, Kent G. 2011. Loading of the San Andreas fault by flood-induced rupture of faults beneath the Salton Sea. Nature Geosci. 4(7):486–492. (26 June 2011). doi:10.1038/NGEO1184.
- Calais E, Freed A, Mattioli G, Amelung F, Jónsson S, Jansma P, Hong SH, Dixon T, Prépetit C, Momplaisir R. 2010. Transpressional rupture of an unmapped fault during the 2010 Haiti earthquake. Nature Geosci. 3(11):794–799. (24 October 2010). doi:10.1038/NGEO992.
- Cartwright J, Bouroullec R, James D, Johnson H. 1998. Polycyclic motion history of some Gulf Coast growth faults from high-resolution displacement analysis. Geology. 26:819–822. doi: 10.1130/0091-7613(1998)026<0819:PMHOSG>2.3.CO;2
- Cheng C-T, Chiou SJ, Lee C-T, Tsai Y-B. 2007. Study on probabilistic seismic hazard maps of Taiwan after Chi-chi earthquake. J GeoEng. 2:9–28.
- Childs C, Nicol A, Walsh JJ, Watterson J. 2003. The growth and propagation of synsedimentary faults. J Struct Geol. 25:633–648. doi: 10.1016/S0191-8141(02)00054-8
- Davy BW, Wood RA. 1993. Seismic reflection surveying in Wellington Harbour. Contract Report No. 553904. Institute of Geological & Nuclear Sciences (now GNS Science). 21 p.
- Dunbar GB, Barrett PJ, Goff JR, Harper MA, Irwin SL. 1997b. Estimating vertical tectonic movement using sediment texture. Holocene. 7:213–221. doi: 10.1177/095968369700700209
- Dunbar GB, McLea B, Goff JR. 1997a. Holocene pollen stratigraphy and sedimentation, Wellington Harbour, New Zealand. New Zeal J Geol Geophys. 40:325–333. doi:10.1080/00288306.1997.9514765.
- Fletcher JM, Teran OJ, Rockwell TK, Oskin ME, Hudnut KW, Mueller KJ, Spelz RM, Akciz SO, Masana E, Faneros G. 2014. Assembly of a large earthquake from a complex fault system: surface rupture kinematics of the 4 April 2010 El Mayor-Cucapah (Mexico) Mw 7.2 earthquake. Geosphere. 10:797–827. doi: 10.1130/GES00933.1
- Goff JR. 1997. A chronology of natural and anthropogenic influences on coastal sedimentation, New Zealand. Mar Geol. 138:105–117. doi: 10.1016/S0025-3227(97)00018-2
- Goff JR, Whitehead NE, Ditchburn RG. 1998. 210Pb chronology from Wellington Harbour, New Zealand. New Zealand Journal of Marine and Freshwater Research. 32(2):181–186. doi:10.1080/00288330.1998.9516818.
- Hamling IJ, D’Anastasio E, Wallace LM, Ellis S, Motagh M, Samsonov S, Palmer N, Hreinsdóttir S. 2014. Crustal deformation and stress transfer during a propagating earthquake sequence: The 2013 cook strait sequence, central New Zealand. J Geophys Res. 119:6080–6092. doi:10.1002/2014JB011084.
- Hamling IJ, Hreinsdóttir S, Clark K, Elliott J, Liang C, Fielding E, Litchfield N, Villamor P, Wallace L, Wright TJ, et al. 2017. Complex multi-fault rupture during the 2016 Mw 7.8 kaikōura earthquake, New Zealand. Science. 356(6334). doi:10.1126/science.aam7194.
- Hauksson E, Jones LM, Hutton K. 1995. The 1994 Northridge earthquake sequence in California: seismological and tectonic aspects. J Geophys Res. 100:12335–12355. doi: 10.1029/95JB00865
- Henrys S, Wech A, Sutherland R, Stern T, Savage M, Sato H, Mochizuki K, Iwasaki T, Okaya D, Seward A, et al. 2013. SAHKE geophysical transect reveals crustal and subduction zone structure at the southern Hikurangi margin, New Zealand. Geochem Geophys Geosys. 14:2063–2083. doi:10.1002/ggge.20136.
- Heron D, Van Dissen RJ, Sawa M. 1998. Late Quaternary movement on the Ohariu Fault, Tongue Point to MacKays Crossing, North Island, New Zealand. New Zeal J Geol Geophys. 41:419–439. doi: 10.1080/00288306.1998.9514820
- Holden C, Kaiser A, Van Dissen R, Jury R. 2013. Sources, ground motion and structural response characteristics in Wellington of the 2013 cook strait earthquakes. Bull New Zeal Soc Earthquake Eng. 46:188–195.
- Huber PH. 1992. Late Quaternary stratigraphy and neotectonics of Miramar Peninsula and Rongotai Isthmus, Wellington, New Zealand [MSc thesis (with Honours) in Geology]. Wellington (New Zealand): Victoria University of Wellington. Victoria University of Wellington. 473 p., plus 3 enclosures.
- Lamarche G, Barnes PM, Bull JM. 2006. Faulting and extension rate over the last 20,000 years in the offshore Whakatane Graben, New Zealand continental shelf. Tectonics. 25:TC4005. doi:10.1029/2005TC001886.
- Langridge RM, Berryman KR, Van Dissen RJ. 2005. Defining the geometric segmentation and Holocene slip rate of the Wellington Fault, New Zealand: the Pahiatua section. New Zeal J Geol Geophys. 48:591–607. doi: 10.1080/00288306.2005.9515136
- Langridge R, Van Dissen R, Rhoades D, Villamor P, Little T, Litchfield N, Clark K, Clark D. 2011. Five thousand years of surface ruptures on the Wellington Fault, New Zealand: implications for recurrence and fault segmentation. Bull Seismol Soc Amer. 101:2088–2107. doi:10.1785/0120100340.
- Lewis KB. 1989. A reversal of throw and change of trend on the Wellington Fault in Wellington Harbour. New Zeal J Geol Geophys. 32(2):293–298. doi:10.1080/00288306.1989.10427590.
- Lewis KB, Carter L. 1976. Depths, sediments and faulting on each side of the Rongotai isthmus, Wellington. New Zealand Oceanographic Institute (NZOI) Oceanographic Summary 11. Wellington (New Zealand): NZOI (now National Institute of Water & Atmospheric Research (NIWA) Ltd). 31 p.
- Lewis KB, Mildenhall DC. 1985. The late Quaternary seismic, sedimentary and palynological stratigraphy beneath Evans Bay, Wellington Harbour. New Zeal J Geol Geophys. 28:129–152. doi:10.1080/00288306.1985.10422281.
- Lewis SE, Sloss CR, Murray-Wallace CV, Woodroffe CD, Smithers SG. 2013. Post-glacial sea-level changes around the Australian margin: a review. Quat Sci Rev. 74:115–138. doi: 10.1016/j.quascirev.2012.09.006
- Litchfield NJ, Van Dissen R, Sutherland R, Barnes PM, Cox SC, Norris R, Beavan RJ, Langridge R, Villamor P, Berryman K, et al. 2013. A model of active faulting in New Zealand. New Zeal J Geol Geophys. 57(1):32–56. doi:10.1080/00288306.2013.854256.
- Litchfield N, Villamor P, Van Dissen R, Nicol A, Barnes P, Barrell D, Pettinga J, Langridge R, Little T, Mountjoy J, et al. 2018. Surface rupture of multiple crustal faults in the 2016 Mw 7.8 kaikōura, New Zealand, earthquake. Bull of the Seismol Soc Am. 108(3B):1496–1520. doi:10.1785/0120170300.
- Little TA, Van Dissen RJ, Schermer E, Carne R. 2009. Late Holocene surface ruptures on the southern Wairarapa Fault, New Zealand: link between earthquakes and the uplifting of beach ridges on a rocky coast. Lithosphere. 1(1):4–28. doi:10.1130/L7.1.
- Meng L, Ampuero J-P, Stock J, Duputel Z, Luo Y, Tsai VC. 2012. Earthquake in a maze: compressional rupture branching during the 2012 Mw 8.6 sumatra earthquake. Science. 337:724–726. doi: 10.1126/science.1224030
- Michettia AM, Audemard FA, Marco S. 2005. Future trends in paleoseismology: integrated study of the seismic landscape as a vital tool in seismic hazard analyses. Tectonophysics. 408:3–21. doi: 10.1016/j.tecto.2005.05.035
- Mildenhall DC. 1994. Palynostratigraphy and paleoenvironments of Wellington, New Zealand during the last 80 ka, based on palynology of drillholes. New Zeal J Geol Geophys. 37:421–436. doi: 10.1080/00288306.1994.9514631
- Nicol A, Van Dissen RJ, Stirling MW, Gerstenberger MC. 2016. Completeness of the paleoseismic active-fault record in New Zealand. Seismol Res Lett. 87(6):1299–1310. doi:10.1785/0220160088.
- Nicol A, Wallace LM. 2007. Temporal stability of deformation rates: comparison of geological and geodetic observations, Hikurangi subduction margin, New Zealand. Earth Planet Sci Lett. 258:397–413. doi:10.1016/j.epsl.2007.03.039.
- Nicol A, Walsh JJ, Mouslopoulou V, Villamor P. 2009. Earthquake histories and Holocene acceleration of fault displacement rates. Geology. 37:911–914. doi: 10.1130/G25765A.1
- Ota Y, Williams DN, Berryman KR. 1981. Parts sheets 027, B27 & R28–Wellington 1st ed., Late Quaternary tectonic map of New Zealand 1:50 000 with notes, New Zealand Department of Scientific and Industrial Research, Wellington, New Zealand.
- Pallentin A, Verdier A-L, Mitchell JS. 2009. Beneath the waves: Wellington Harbour. NIWA Chart, Misc Ser. 87.
- Pillans B, Huber P. 1995. Interpreting coseismic deformation using Holocene coastal deposits, Wellington, New Zealand. Quat Int. 26:87–95. doi: 10.1016/1040-6182(94)00049-B
- Pondard N, Barnes PM. 2010. Structure and paleoearthquake records of active submarine faults, Cook Strait, New Zealand: implications for fault interactions, stress loading, and seismic hazard. J Geophys Res. 115:B12320. doi:10.1029/2010JB007781.
- Quigley M, Van Dissen R, Litchfield N, Villamor P, Duffy B, Barrell D, Furlong K, Stahl T, Bilderback E, Noble D. 2012. Surface rupture during the 2010 Mw 7.1 Darfield (Canterbury) earthquake: implications for fault rupture dynamics and seismic-hazard analysis. Geology. 40:55–58. doi: 10.1130/G32528.1
- Riddolls BW, Lewis KB. 1979. Wellington airport runway extensions, Evans Bay: engineering geological investigations. New Zealand Geological Survey (NZGS) Engineering Geology report EG324. Lower Hutt (New Zealand): NZGS, Department of Scientific & Industrial Research (now GNS Science Ltd). 14 p.
- Semmens, S. 2010. An engineering geological investigation of the seismic subsoil classes in the central Wellington commercial area [MSc thesis submitted in partial fulfilment of the requirements for the Degree of Master of Science in Engineering Geology]. University of Canterbury. 188 p.
- Stein RS, King GCP. 1984. Seismic potential revealed by surface folding: 1983 Coalinga, California, earthquake. Science. 224:869–872. doi: 10.1126/science.224.4651.869
- Stevens GR. 1956. The stratigraphy of the Hutt Valley, New Zealand. New Zeal J Sci Tech. B38:201–235.
- Stevens GR. 1990. Rugged landscape: the geology of central New Zealand, including Wellington, wairarapa, manawatu, and the marlborough sounds. Wellington (New Zealand): DSIR Publishing. 1974 edition reprinted. 286 p.
- Stirling MW, Litchfield NJ, Villamor P, Van Dissen RJ, Nicol A, Pettinga J, Barnes P, Langridge RM, Little T, Barrell DJA, et al. 2017. The Mw 7.8 2016 kaikōura earthquake: surface fault rupture, and seismic hazard context. Bull New Zeal Soc Earthquake Eng. 50:73–84.
- Stirling M, McVerry G, Gerstenberger M, Litchfield N, Van Dissen R, Berryman K, Barnes P, Wallace L, Villamor P, Langridge R, et al. 2012. National seismic hazard model for New Zealand: 2010 update. Bull Seismol Soc Amer. 102:1514–1542. doi:10.1785/0120110170.
- Van Dissen RJ, Begg JG, Robinson R. 2001. The Akatarawa Fault: a newly discovered active fault in the Wellington region, and implications for increased hazard on the Wellington Fault. New Zealand society of earthquake engineers 2001 conference. Paper 4.06.01. 9 p.
- Van Dissen RJ, Berryman KR. 1996. Surface rupture earthquakes over the last ∼1000 years in the Wellington region, New Zealand, and implications for ground shaking hazard. J Geophys Res. 101(B3):5999–6019. doi: 10.1029/95JB02391
- Wallace LM, Barnes P, Beavan RJ, Van Dissen RJ, Litchfield NJ, Mountjoy J, Langridge RM, Lamarche G, Pondard N. 2012. The kinematics of a transition from subduction to strike-slip: an example from the central New Zealand plate boundary. J Geophys Res. 117:B02405. doi:10.1029/2011JB008640.
- Wallace LM, Beavan J, McCaffrey R, Darby D. 2004. Subduction zone coupling and tectonic block rotations in the North Island. New Zeal J Geol Geophys. 109:B12406. doi:10.1029/2004JB003241.
- Wells DL, Coppersmith KJ. 1994. New empirical relationships among magnitude, rupture length, rupture width, rupture area, and surface displacement. Bull Seismol Soc Amer. 84:974–1002.
- Wesnousky SG, Scholz CH, Shimazaki K, Matsuda T. 1984. Integration of geological and seismological data for the analysis of seismic hazard: A case study of Japan. Bull Seismol Soc Amer. 74:687–708.
- Willoughby G, Macdonald N, Darling A, Hiller T. 2012. Applying novel sub-bottom boomer technology to the submerged Wellington Fault. Paper presented at shallow survey 2012 conference; Wellington, New Zealand. http://www.conference.co.nz/files/docs/shallow%20survey/fullpapers/willoughby_et_al_ss2012_s2p3_x.pdf.
- Wood RA, Davy BW. 1992. Interpretation of geophysical data collected in Wellington Harbour. Institute of Geological and Nuclear Sciences (now GNS Science) client report 1992/78.