
ABSTRACT
New Zealand has a large and geologically complex marine Exclusive Economic Zone (EEZ) and extended continental shelf (ECS). Data from ∼150 published, unpublished, national and international collections covering >30,000 sediment analyses and observations were compiled and integrated to produce a database (nzSEABED) and series of maps characterising the surficial sediments of the entire New Zealand EEZ-ECS. Sediment grainsize/texture and carbonate distributions show distinct spatial patterns, which can be explained by past and present climate, sea level fluctuations, terrigenous (from the land) sediment flux, tectonics and volcanism, complex bathymetry, oceanography, and diagenesis. The results are compared with previous literature, providing a comprehensive review of the distribution of surficial marine sediments for the New Zealand EEZ-ECS.
Introduction
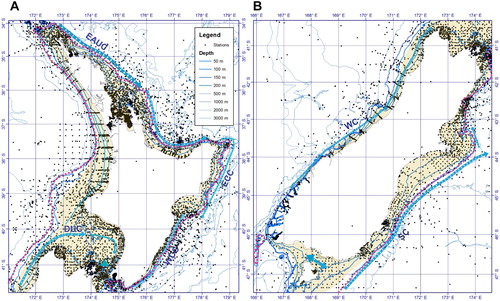
Globally, New Zealand/Aotearoa has stewardship over the 5th largest Exclusive Economic Zone (EEZ) and extended continental shelf (ECS) that encompasses a geologically complex and oceanographically dynamic submarine environment. The submarine environment is composed of a number of distinct bathymetric features, including: a highly variable continental slope, plateaux, rises, volcanic ridges, seamounts, deep troughs, submarine canyons and channels, and abyssal basin plains ((A); Mitchell et al., Citation2012). The name “Zealandia” has been proposed in the argument for this largely submerged 4.9 million km2 geological feature to be regarded as the 7th continent on Earth (Mortimer et al., Citation2017). It is a geologically active region with the obliquely converging Pacific/Australian plate boundary bisecting the present-day Zealandia. The main terrestrial landmass sits at temperate latitudes between 35 and 47°S (not including the subtropical (∼30°S) and subantarctic (∼47–53°S) islands), and lies athwart the vigorous westerly wind belt that produces high orographic rainfall on the west coasts of the South Island, resulting in some of the highest erosion rates measured in the world (Hicks et al., Citation2011; Larsen et al., Citation2014). Zealandia also sits in a region of dynamic oceanographic currents, straddling subtropical and subantarctic surface water masses combined with extremely strong tidal currents and vigorous wave regime at certain locations, with deep-water western-boundary currents around the margins of Zealandia which influence bathyal sediment dispersal ((A); Chiswell et al., Citation2015; Stevens et al., in review). This combination of factors results in a diverse and heterogeneous seafloor environment.
Figure 1. (A) Bathymetric map of the New Zealand region. The isobaths are at 150 m, 500 m, 1,000 m, 2,000 m, 3,000 m and 4,000 m. The main bathymetric features mentioned in the text are labelled. Abbreviated locations are: C Is. – Campbell Island/Motu Ihupuku, B Is. – Bounty Islands, A Is. – Auckland Islands, Ch Is. – Chatham Island, An Is. – Antipodes Islands, M Is. – Macquarie Island, CS – Cristable Seamount, BS – Bollons Seamount, HC – Hokitika Canyon, PT – Puysegur Trench, OC – Otago Canyons, MS – Mernoo Saddle, TVZ – Taupo Volcanic Zone, STF – Subtropical Front, ACC – Antarctic Circumpolar Current, DWBC – Deep Western Boundary Current. The area shaded in orange (depths >4000 m) is the below the CCD (carbonate compensation depth; Bostock et al., Citation2011). (B) Location of all the stations used in this study, within and just beyond the New Zealand’s Exclusive Economic Zone (EEZ) and outer limit of the Extended Continental Shelf (OLECS).
Understanding the distribution of surficial sediments in the ocean is of key importance for sustainably managing and utilising marine resources. This knowledge underpins the criteria to distinguish potential locations of; economically valuable resources, such as mineral sands and polymetallic authigenic nodules, characterise different physical and biological habitats and regions that may be important for biodiversity and conservation, commercial fishing or aquaculture. In conjunction with bathymetric maps and knowledge of meteorological and oceanographic conditions, such information can also assist in determining suitable locations for offshore infrastructures, such as telecommunication cables, pipelines and oil platforms, or wind, wave and tidal turbines for marine energy. This knowledge might also be important for quantifying the effects of human activities that impact the seafloor, such as bottom trawling and potential seabed mineral exploitation.
While it is likely that Maori were aware of variations in sea floor sediments around the New Zealand coast, the first written marine sediment description in the South Pacific Ocean was by Captain James Cook off Poverty Bay on 13th October 1769 in ∼40 m water depth, describing the seabed as a “fine sandy bottom”. A hundred years later the Challenger expedition from 1872 to 1876 collected a series of deep-sea sediment samples in the New Zealand region in 1874. This was followed by a Russian expedition in 1898 to 1906 and later the Danish Galathea expedition (1950–1952). During the International Geophysical Year from 1957 to 1959 there was a significant effort to sample the global oceans by the Russians, especially the Pacific Ocean (Lisitzin Citation1972). Subsequently American researchers also published maps of the deep-ocean sediments and polymetallic minerals on the sea floor of the global ocean (e.g. Goodell et al., Citation1973; Rawson et al., Citation1978). These maps used ∼3000 data points to map out the main surface substrates in the deep South Pacific. The original collections and maps highlighted the main distribution of sediments in the global ocean. They also determined the predominant factors (geological – tectonic, volcanic, physical – currents, biological – productivity, chemical – diagenetic alteration) that control the spatial distribution of different sediment and rock types. However, few samples were taken from within the New Zealand EEZ and there was little detail provided on the seafloor sediments in this region of the Southwest Pacific Ocean.
The first marine sediment samples collected by the New Zealand Oceanographic Institute (NZOI), a division of the Department of Scientific and Industrial Research, and now part of the National Institute of Water and Atmospheric Research (NIWA), were obtained in January 1955 during the Barrier expedition on RV Endeavour. Over the next four decades NZOI systematically collected and analysed hundreds of sediment samples that resulted in numerous publications (compiled in Lewis, Citation1977) and the production of a fifteen coastal sediment charts at a scale of 1:200,000, three oceanic sediment charts at a scale of 1:1,000,000, and a New Zealand regional sediment chart at a scale of 1:6,000,000 (; ). While sediment samples were collected in other regions, sedimentological charts were never completed (e.g. off Fiordland, southwestern New Zealand). The previous coastal and regional sediment charts were recently digitised and reinterpreted to derive consistent grainsize distribution patterns across most of the New Zealand region to develop substrate maps for EEZ-scale habitat mapping and classification (e.g. Benthic-Optimised Marine Environment Classification, Leathwick et al., Citation2012). But there were still many gaps in regions where charts were never completed and where the sediment information was published in bulletins (e.g. Hawke Bay shelf sediments, Pantin, Citation1966), journal articles and student theses.
Figure 2. Location of previous sediment maps for the New Zealand region ().
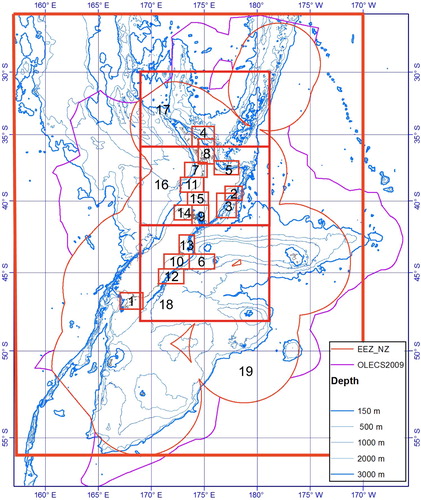
Table 1. Published sediment charts of New Zealand (see for the locations of these charts).
The first overview of marine sediments around New Zealand was by Brodie (Citation1964) who primarily discussed the bathymetry of the region, with a brief reference to sedimentation. The first comprehensive review of the sediments of the continental “terrace” (i.e. the continental shelf and slope), was published by Carter (Citation1975) and in a sister publication these sediment patterns were interpreted in concert with knowledge of the oceanographic currents, waves, tides and storms at that time (Carter and Heath, Citation1975). This was followed by a review of the coastal sediments by Hume et al. (Citation1992). A written review of the marine sediment distributions on the slope and deep basins off the east coast of New Zealand was undertaken by Carter et al. (Citation2000). A schematic map of the sediment distribution and oceanic currents based on Carter et al. (Citation2000) was published by Orpin et al. (Citation2008).
The present study builds on these previous publications. This project has digitised and geospatially compiled a huge body of analogue data, including the sedimentological descriptions and analyses of seafloor sediment samples that have been collected from the oceans around New Zealand over the last 60 years by NZOI and NIWA as well as the Institute of Geological & Nuclear Sciences (GNS Science) and international institutions. This effort has led to the production of a fully electronic database nzSEABED. Using Geographical Information Systems (GIS), we produce maps of the most commonly reported and described sediment physical properties such as grainsize – termed texture (mud, sand and gravel percentages) and carbonate content (which represents the dominant biological component). The distributions of these sedimentary properties are discussed, highlighting new patterns and levels of detail for specific regions around New Zealand and compared to previous work in these regions. These sediment distribution patterns are then related to potential sediment sources, bathymetry, ocean currents, and other factors, such as mass transport processes and chemical precipitation and dissolution to identify the likely drivers of these sediment patterns. In Part A, of two-companion papers, we focus on a description of the surficial sediment distribution on the continental slope (>150 m water depth) and deep basins around New Zealand within the 200 nautical mile Exclusive Economic Zone (EEZ) and the extended continental shelf (ECS). Part B will focus on the sediment distribution patterns on the continental shelf (∼<150 m).
Data and methods
Data were compiled for the area from latitude 25 to 57°S, and longitude 155°E to 165°W. The NIWA sediment archives provided around 10,000 individual sample descriptions and analyses, which are complemented by sediment data from ∼150 publicly available international databases, published reports and university theses. A total of >30,000 data points were entered in to a database (nzSEABED) for this study. While we have outlined some of the early historical data collections in the introduction, the majority of these sediment samples have been collected by expeditions in the last 30 years. The actual collection date of some of the samples is not always straightforward as some data are drawn from early charts or publications, that have compiled data from many surveys over many years, and the original raw data were not available.
The sediment samples and data were collected using a range of methods. The most common methods for sampling surface sediments from the NIWA samples (n = 10,000) were grabs (20%), dredges (30%) and corers (25%). Other methods included trawls, sleds, diver samples and underwater camera observations and some methods were not recorded. A range of different types grabs, dredges and corers have been used over the last 60 years. For example for cores; gravity, piston, kasten, trigger, vibra-, multi- and box corers have all been used. All these methods may yield a biased sample. For example, cores struggle to admit shell, pebble and cobbles (Ferguson and Paola, Citation1997), dredges will usually not sample unconsolidated mud, and video does not discriminate the fine fractions. Grabs and dredges bite approximately 5 cm into the seabed, video and photo are strictly surficial, and cores sample through layers. Where multiple types of corers were used at one site the trigger, multicore or box core data were used preferentially to characterise the surface sediment. This is because large gravity and piston cores disturb the top few centimetres of surficial sediment with the “bow wave” (Lotter et al., Citation1997). Visual seabed descriptions (divers, submersibles, deep water cameras) are often more useful in some areas. We have used any data or descriptions from the top 10 cm of all types of corer to characterise the surface sediment. Undoubtedly as samplings and observations continue to be taken in coming years the density of the sample coverage will improve. The nzSEABED database will be updated with new datasets as they become available.
As well as a wide range of sampling equipment, the analytical methods used to determine detailed sediment properties have also evolved over time. In the 1950s grainsize fractions (texture) were typically determined by passing sediment samples through sieve stacks and weighing the dry weight of the fraction in each sieve (van der Linden, Citation1968). However, data from other methods includes pipettes, settling tubes and more recently x-ray attenuation and laser grainsize analysers. While modern grainsize methods provide significantly more detail and information, for consistency, here we are limited by the older methods, and we use the basic size classes of percent mud, sand and gravel. Where mud is defined as having a grainsize of <63 μm, sand is defined as 63 μm to <2 mm and granule gravel >2 mm to 4 mm (in accordance with an amalgamation of the Udden (Citation1914) and Wentworth (Citation1922) grade scales). Similarly carbonate content have also been estimated using a wide range of different methods, from visual observations, weighing before and after acid-digestion, titration and the carbonate bomb method (Jones and Kaiteris, Citation1983). However, most of the sediment data are available in the form of qualitative written sample descriptions, either from first-hand observations, initial shipboard deck notes, or laboratory logs. The descriptive data amounts to about 85% of the total data available and are essential for closing the vast spatial gaps between analytical data.
The dbSEABED software (Jenkins et al. Citation2008; http://instaar.colorado.edu/~jenkinsc/dbseabed/) was used to integrate the diverse, heterogeneous collated data. All the data are quality controlled. For analytical quantitative data the values are tested for plausibility. For word-based data, descriptions are parsed and meanings and values are attached to the essential terms. For example, a description of “muddy sand” will be assigned as 40% mud and 60% sand. A sample which is described as “pelagic ooze” (a sample made up of carbonate plankton skeletons), a carbonate content of 90% is attributed. Details are described in |Jenkins (Citation1997, Citation2002) and Buczkowski et al. (Citation2006). The character values are based on calibrations from datasets where both descriptions and analyses are present on thousands of samples (Harff et al., Citation1997; McMullen et al., Citation2014).
The dbSEABED system produces a unified mappable database from a multitude of datasets; for the New Zealand region this is called nzSEABED. The primary objective is to produce integrated, harmonised data that can be mapped, analysed, and visualised as one dataset. Legacy and modern data from samplings, visual inspections and electronic sensings are all included. The data may have been originally disparate in purpose, format, and collection or analytical technique. The transformations of units are performed in the dbSEABED software, to preserve the information audit trail. While this translation of the sedimentological description into quantitative data significantly increases the coverage of data across the region, it must also be treated carefully as it may introduce unwanted biases and errors. The accuracy of these different methods also varies significantly, but by combining large numbers of datasets and looking at spatial patterns over large regions, small errors on an individual sample is likely to be inconsequential in well sampled regions.
The coverage of the surface sediment samples around the New Zealand region in nzSEABED is highly variable ((B)). There is generally a high density of samples around the coast and across the continental shelf (n = 23,000 samples, 76% of the total database). Data coverage is greater in some regions, especially those where there were previous sediment charts and scientific interest, such as the Hawke Bay shelf (Pantin, Citation1966), Canterbury shelf (Herzer, Citation1977) and Cook Strait (Carter, Citation1992; Lucieer and Lamarche, Citation2011). Further offshore the sample density declines rapidly on the continental slope, rises and plateaux, although there are some regions that have experienced significantly more sampling than others, such as the Chatham Rise (Cullen Citation1980, Citation1989). Samples are even more sparse (n = 2150, 7%) in the abyssal ocean (>3000 m) around New Zealand. In some deep-water regions there are insufficient data to characterise the seafloor sediment distribution, such as to the southeast off the Campbell Plateau, northeast in the south Pacific, and southwest from the South Island in the deep Tasman Basin ((B)). Nevertheless, insights into deep-ocean sediments have also been gained though the acoustic mapping of seafloor features using geophysical methods (e.g. deep-sea channels and fans) and verification by a few direct samples, such as on the Bounty Fan (Carter et al., Citation1990), Macquarie Ridge and the Solander Trough (Schuur et al., Citation1998).
Processed and integrated sediment data from nzSEABED were imported in to ArcGIS using a Mercator projection in order to allow for seamless interpolations across the 180° meridian. A number of different geostatistical techniques were trialled to interpolate the data between samples. These included the “inverse distance weighting”, “natural neighbour” and “kriging”. All of the methods produced similar spatial patterns. All interpolation techniques have their issues and biases (Diesing et al., Citation2014). We have chosen ordinary kriging based on using the 12 nearest points with a restricted distance of 100 km, and plotted the data on a 1 × 1 km grid. Ordinary kriging provides the mathematically least biased interpolation as the other 2 methods exhibit “bullseye” effects. Changing the distance limit (50 km or 20 km) of the interpolation had little effect on the well-sampled continental shelf (Part B). The predicted standard error (standard deviation for any point) for percent mud for the kriging interpolation is low in well sampled regions such as the continental shelf and Chatham Rise (8–16%), and increases in the sparsely sampled deep waters (20–24% at >3000 m). There is no correlation between the percent mud and the water depth in this region, unlike other global margins (e.g Li et al., Citation2011), therefore we have not used water depth as a secondary predictor of grainsize using a co-kriging method. We also did not use oceanographic currents to guide the interpolation as in some regions the sediments are relict (deposited under different oceanographic conditions). It should be noted that we have not included rocks in this database, thus the interpolated sediments will superimpose over rock outcrops. However, the focus of the present paper is not on differentiating the best interpolation technique, as this has been covered by others (e.g. Li et al., Citation2011; Diesing et al., Citation2014; Stephens and Diesing, Citation2014). The intention in these interpolated maps is to show the large-scale sedimentary patterns in the New Zealand region and to provide a seamless dataset for use by other researchers and policy makers.
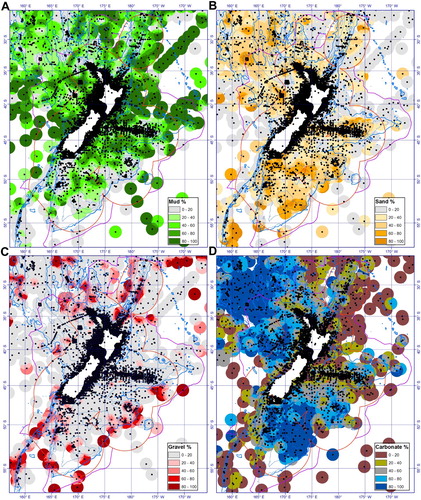
The maps produced from the nzSEABED database show the textural patterns (percent mud, sand and gravel = total 100%) and carbonate content, (percent carbonate; versus non carbonate; ). The latter provides information about the source of the sediments with the carbonate providing information about the amount of biological material is produced in the water column by plankton, or on the seafloor by marine organisms and is typically carbonate-rich, while the non-carbonate component it primarily derived from the land, termed terrigenous material, due to reworking by wind and water (rainfall and rivers) into the oceans. In some regions of the seafloor authigenic material is also present. Authigenic minerals are precipitated at the sea floor, under specific environmental conditions and typically over long periods of time and include phosphate nodules, glauconite and polymetallic nodules. The sediments are referred to as modern, which indicates that they have been deposited under modern environmental conditions over the last ∼7000 years when sea level (Clement et al., Citation2013) and ocean currents have been similar to today. In other regions sediments are referred to as relict, which implies they were deposited >7000 years ago when sea level was lower and or other environmental conditions were different. Sea level fluctuates over glacial/interglacial cycles due to changes in the global ice volume. During the last glacial at ∼20,000 years ago, sea level was ∼120 m lower than the present (Lambeck et al., Citation2014) and vast areas of the continental shelf were subaerially exposed. This had a significant influence on the sediment transport across and along the continental shelf, and how much terrigenous sediment was transported to the deep ocean via submarine canyon systems (e.g. Carter and Carter, Citation1996; Carter et al., Citation2004).
Figure 3. (A) Mud % interpolated across the EEZ and OLECS of New Zealand. (B) Sand %, (C) Gravel %, (D) Carbonate %. Using Kriging method in ArcGIS with a maximum range of 100 km. We have used the dbSEABED colour legends for the representation of the different sediment properties (http://instaar.colorado.edu/~jenkinsc/dbseabed/helpful/index.html).
A glossary of some of the sedimentological terms that may not be familiar for a more general audience is included. It should also be noted that all locations referred to in the text are official or recognised unofficial names according to the New Zealand gazetteer (https://gazetteer.linz.govt.nz/).
Distribution of sediments in the deep ocean
The following sections describe the bathymetric setting and distribution of surficial sediments derived from nzSEABED on the slope and in the deep ocean (>150 m) around New Zealand (). We also review the previous literature for each region and compare with oceanographic, diagenetic, volcanic influences. Detailed supplementary figures (S1–S7) displaying the % mud, % sand, % gravel, % CaCO3 are provided for each of the regions. The dominant sediment type and the prevailing influences for each region are summarised in and .
Figure 4. The main sedimentary regions and their predominant sediment types and influences (see for more details).
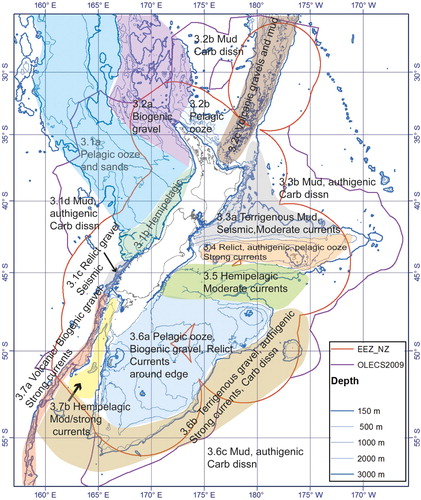
Table 2. Characterisation of the continental slope and basins around New Zealand.
Tasman Basin and Challenger Plateau
This region, east of 155°E, is characterised by a large bathymetric ridge west of central New Zealand that continues north to merge with Lord Howe Rise. To the north of Challenger Plateau lies the New Caledonia Trough, which is bordered by West Norfolk Ridge and Norfolk Ridge ((A)). Seamounts are found across this region, some of which are very large massifs that are basement-related features, such as the 14,760 km2 Gilbert Seamount which rises 2,378 m. Others are substantially smaller volcanic edifices.
The seabed of the continental slope and deep basins of this region are blanketed by mud ((A); S1A), most of which is terrigenous (from the land) sediment from the rivers along the west coast of the South Island (Stoffers et al., Citation1984) and to a lesser extent from the North Island, while further west the deep-sea muds and clays in the Tasman Basin contain a component of Australian dust (Hesse, Citation1994). Manganese crusts and nodules have been found on the in the deep Tasman Basin (Glasby et al., Citation1986). The presence of these crusts and nodules suggest that these regions have either very low sedimentation rates, or sufficient flow speeds to winnow fine-grained sediment (Davies, Citation2018). The latter is unlikely in this region as the deep-water flows are weak in the eastern Tasman Basin (Chiswell et al., Citation2015). On the continental slope the terrigenous muds are mixed with carbonate to produce hemipelagic (see glossary) sediments, the carbonate content increases with depth on the slope as the sediment become increasingly pelagic ((D); S1D). The carbonate content is high on the Challenger Plateau and various rises (40–100%; (D); S1D), which are dominated by sand-sized sediment (40–80%; (B); S1B) and described as pelagic ooze (Nelson et al., Citation1986; McDougall, Citation1975). There are some regions of with very high sand and minor gravel on the Challenger Plateau and New Caledonia Trough ((C); S1C), which may also be influenced by carbonate from benthic organisms such as deep-sea corals (Tracey et al., Citation2011; Bostock et al., Citation2015) or the occasional manganese crust (Nodder unpublished Ocean Survey 2020 observations, research voyage TAN0707). Sediment carbonate contents rapidly decline below 3,700 m water depth in the Tasman Basin due to dissolution and diagenesis (Eade and van der Linden, Citation1970; Martinez Citation1994), although insufficient samples have been taken to define the depth of the carbonate compensation depth (CCD) in this basin, where the CCD is defined as the depth where CaCO3% <20% (Bostock et al., Citation2011).
To the south, a series of large submarine canyons cut across the southern flank of the Challenger Plateau from the edge of the continental shelf to the deep Tasman Basin abyssal plain. The heads of some of these canyons have eroded into the continental shelf and are associated with large South Island rivers, such as the Hokitika River, which flowed out at the edge of the continental shelf during lower glacial sea-levels (∼120–150 m below present sea-level; Norris, Citation1978; Proust et al., Citation2006; Ryan et al., Citation2012). The Hokitika Canyon is not connected directly with the Hokitika River during the modern high sea-level, but some of the northward alongshore-transported sediment is intercepted by the canyon heads, resulting in small amounts of terrigenous-dominated, modern sediment cascading down the canyons (Radford, Citation2012; Part B section 3.12). These deeply incised canyons, which coalesce in water depths >3,000 m, continue out onto the Tasman Basin abyssal plain (>4,000 m depth), with bathymetry data suggesting a small relict sediment fan at the end of the ∼1250 km-long Hokitika-Cook Canyon system, which likely formed during lower sea-levels when large quantities of sediment were transported down the Hokitika Canyon (Neil, Citation2005, Citation2007, Citation2008; Mitchell et al., Citation2012).
Further south, off Fiordland the submarine extension of the Alpine Fault has resulted in a series of ridges and pull-apart basins, with drainage channels and glacial moraines offset by the lateral movement of the fault, which marks the Australian-Pacific plate boundary (Barnes, Citation2009). There have been few sediment samples collected from offshore Fiordland, but the region has been extensively mapped by multibeam echosounder (Barnes et al., Citation2005). The sediment on the continental slope is sandy (20–60%) and with some mud (20–60%; (A); S1A). The lower mud than the rest of the west coast margin is because very little modern mud is transported to the continental shelf and slope with most of it trapped inside the fiords (Pickrill, Citation1987; Part B, section 3.12). Small amounts of modern sand and silt sediment are transported into the small basins adjacent to the steep continental slope, triggered by tectonic (earthquakes) activity or large storms (Barnes et al., Citation2013; Strachan et al., Citation2016). That said, most of the surface sediments in this offshore Fiordland region are relict coarse gravel glacial outwash fans from glacial periods of lower sea-levels (Barnes, Citation2009; Barnes et al., Citation2013). Carbonate content on the slope is low to moderate (0–40%), although there are very few samples ((D); S1D). The mud content increases to 60–100% at water depths >3,000 m in the Fiordland Basin ((A); S1A), although there are limited samples from the abyssal plain.
Northern North Island and Kermadec Ridge
This region north of New Zealand has highly complex bathymetry comprising a continental plateau in the west made up of the Norfolk and Three Kings ridges, the deep South Fiji Basin in the centre, and the Colville (relict) and Kermadec back arc volcanic chains to the east (Gamble and Wright, Citation1995; Mortimer et al., Citation2007, Citation2010; Mitchell et al., Citation2012; Wysoczanski and Clark, Citation2012). The Norfolk and Three Kings ridges are regarded as part of the submerged continent of Zealandia (Mortimer et al., Citation2017). The Colville and Kermadec ridges are part of the relict volcanic Colville Arc, and strike northeast from the onshore Taupo Volcanic Zone (TVZ). These ridges are separated by the opening of the Harve Trough back-arc basin system (Wysoczanski et al., Citation2010). The present day active Kermadec Arc volcanic chain lies westward of the Kermadec Ridge in the south, and on the Kermadec Ridge in the north, where several marine volcanoes breach the sea surface to form the Kermadec Islands. The continental slope of the Bay of Plenty region is complex with submarine volcanic cones, fault-controlled ridges and troughs and several submarine canyons that provide a route for terrigenous material to be transported down to the deep South Fiji Basin (Wright, Citation1990).
There are significant concentrations of sand (20–100%) and carbonate (20–100%) on the continental slope immediately offshore Northland, becoming increasingly carbonate-rich muds (hemipelagic) by 3,000 m in the deep South Fiji Basin ((A, D); S2A; S2D). High carbonate is the result of very low terrigenous run off in this region of Northland (Hicks et al., Citation2011). However, carbonate content rapidly declines below 4,000 m due to dissolution in the deep ocean with the CCD at ∼4,400 m (Bostock et al., Citation2011). On the Three Kings Ridge, coarse sand and gravel seafloor sediments are carbonate-rich (20–80%) ((B, C); S2B; S2C) and there is evidence for authigenic glauconite (Nelson et al., Citation1982). This suggests that this region is relict, with the biogenic gravel formed at shallower sea-level, with very low sedimentation rates.
Hemipelagic mud on the continental slope of the Bay of Plenty is regularly interlayered with local volcanic tephra layers from (Mayor Island/Tuhua) and the TVZ (Pillans and Wright, Citation1992; Shane et al., Citation2006). However, the Colville and Kermadec ridges are predominantly covered by volcanic “gravel”, with patchy distributions of volcanogenic mud ((A, C); S2A; S2C; Kohn and Glasby, Citation1978; Gamble and Wright, Citation1995; Shane et al., Citation2006). Large and small pumice clasts (gravel) are distributed widely, floating long distances before finally sinking, as evident after the recent 2012 Harve Volcano submarine eruption (Carey et al., Citation2018; Wysoczanski, unpublished observations). Sand and carbonate content along the Colville and Kermadec ridges are typically low to moderate (<40%), although there are patches of higher carbonate on shallow seamounts and slopes inhabited by carbonate organisms ((B, D); S2B; S2D). There is a paucity of samples in this bathymetrically complex region and improved spatial coverage of samples will likely identify other areas of higher carbonate content. Polymetallic crusts have also been observed along the Colville, Kermadec, Three Kings and Norfolk ridges (Glasby and Wright, Citation1990), formed through a combination of low sedimentation rates, volcanic activity, and extensive hydrothermal activity in these regions (e.g. De Ronde et al., Citation2007).
Eastern North Island
East of the North Island is the Hikurangi Subduction Margin, marking the plate boundary between the subducting Pacific Plate and the overlying Australian Plate. The morphology of the slope is dominated by the accretionary prism and associated deformation over the past 25 My (Cole and Lewis, Citation1981; Lewis and Pettinga, Citation1993; Barnes et al., Citation2010). The slope comprises a series of en-echelon, imbricate ridges and basins, dissected by submarine canyons and arcuate scars left by vast submarine landslides (Collot et al., Citation2001; Mountjoy et al., Citation2009a; Mitchell et al., Citation2012). Off shore from the slope is the deep, sediment-filled Hikurangi Trough, the associated Hikurangi Channel (Lewis, Citation1994) and the accreted Hikurangi Plateau (Wood and Davy, Citation1994; Davy et al., Citation2008). To the north is the Kermadec Trough (Ballance et al., Citation1999) and further east the abyssal plain of the Southwest Pacific Basin.
From the continental slope to the abyssal plains this region is completely dominated by terrigenous mud (>60%; (A); S3A). The mud is dominated by silt (size range 4–63 μm, a component of mud) and covers all the slope basins along the length of the Hikurangi margin (e.g. Carter et al., Citation2002). The high mud content across the slope and trough is due to the high flux of terrigenous sediment into this region from the east coast of the North Island from the local rivers with a total of 83 Mtyr−1, although the majority of this flux (69 Mtyr−1) is from the northern rivers (Hicks et al., Citation2011; Part B section 3.4). While some of this terrigenous mud is deposited on the shelf (e.g. Gerber et al., Citation2010), a significant component is transported seaward across the wider margin via current and wave activity to nourish the outer shelf and slope (Carter et al., Citation2002; Orpin et al., Citation2006; Alexander et al., Citation2010; Kuehl et al., Citation2016). There is also a significant amount of Holocene volcanic ash in the marine sediments on the slope and basin, typically occurring as discrete tephra beds and blebs in cores, transported directly by winds from the TVZ eruptions, but also reworked and washed in by the rivers (Stewart and Neall, Citation1984; Lewis, Citation1985; Carter et al., Citation1995, Citation2002, Citation2003, Citation2004, Citation2008; Allan et al., Citation2008; Pouderoux, Lamarche et al., Citation2012,Pouderoux, Proust et al. Citation2012).
There are occasional small patches of higher sand, gravel and carbonate content (<40%; (B, C, D); S3B; S3C; S3D) along this margin. Some of these gravel patches along the continental slope are related to volcanic/terrigenous material or rock exposures on uplifted ridges isolated by faulting (Lewis and Gibb, Citation1970; McDougall, Citation1975, Citation1982; Lewis, Citation1985; Lewis and Pettinga, Citation1993). There is also evidence on many of these uplifted ridges for active or past hydrocarbon seeps, with unique marine fauna cemented by muddy carbonate (Lewis and Marshall, Citation1996; Greinert et al., Citation2010).
There are a large number of canyons and gullies at a range of scales along this margin. At the southern end of this margin there are the large Kaikoura (and Pegasus) and Cook Strait canyons, that feed the Hikurangi Channel (Lewis, Citation1994; Lewis and Barnes, Citation1999; Herzer, Citation1979a; Lewis and Pantin, Citation2002). The floors of several canyons (e.g. Kaikoura, Kowhai Seavalleys, Cook Strait, Pāhaoa canyons) are gravel-boulder dominated in the lower reaches with a very thin mud drape (Lewis et al., Citation1998; Lewis and Barnes, Citation1999). The Hikurangi Channel axis is sand dominated along much of its length, and rapidly disperses large quantities of terrigenous mud and sand from the North and South islands down to the Southwest Pacific abyssal plain via gravity turbidity currents, primarily triggered by earthquakes (Pantin, Citation1972; Herzer, Citation1979b; Lewis, Citation1994; Lewis and Pantin, Citation2002; Jeromson, Citation2014; Mountjoy et al., Citation2018). Channel spill-over and overbank deposition from the Hikurangi Channel has produced a thick sequence of terrigenous mud across the Hikurangi Plateau, culminating in deep-sea fan-drift deposit at the terminus of the channel at depths of >4000 m, the Hikurangi Fan (Carter et al., Citation2000; McCave and Carter, Citation1997).
Many of the smaller canyons and gullies along the continental slope of the east coast are confined to the upper and middle slope, restricted by emergent tectonic ridges that act as baffles to form a cascading series of slope basins (Carter et al., Citation2002). Along the length of the Hikurangi Margin submarine landslides transport substantial volumes of sediment across the slope into slope basins and the Hikurangi Trough (Lewis et al., Citation1998; Mountjoy, Barnes et al., Citation2009; Mountjoy, McKean et al. Citation2009; Mountjoy and Micallef, Citation2012; Micallef et al., Citation2012). North of 41°S, only the Poverty Canyon traverses the lower continental slope, and potentially transported terrigenous mud directly to the deep ocean via gravity flows processes during periods of lowered sea-level (Lewis et al., Citation1998; Orpin, Citation2004).
The main deep-water bottom currents in this region are northwest-flowing along the base of the Hikurangi Plateau at a depth of >3,000 m (McCave and Carter, Citation1997; Chiswell et al., Citation2015). This is the end of the Deep Western Boundary Current (DWBC; (A)) that enters the Southwest Pacific Basin from the Southern Ocean (Chiswell et al., Citation2015). Further north at 32°S this current has a maximum mean velocity of >6 cm s−1 at depths >4,000 m north along the Kermadec Ridge (Whitworth et al., Citation1999). The DWBC is responsible for a series of scours at ∼3,000 m water depth and drift deposits, including reworking the Hikurangi Fan, between 3,000–5,000 m water depth in this region (Carter and McCave, Citation1997; McCave and Carter, Citation1997; Carter et al., Citation2000), with evidence that some of the sediment particles have been transported from south of the Chatham Rise (Carter and Mitchell, Citation1987; Crundwell et al., Citation2008; Stickley et al., Citation2001). There are also polymetallic nodules in the deep abyssal plain around the edge of the Hikurangi Plateau, likely related to the DWBC, which removes, or inhibits deposition, of the fine sediments in its path providing suitable conditions for nodule formation (McCave and Carter, Citation1997).
The low carbonate content in this region is unrelated to the biological productivity, which is relatively high (Carter et al., Citation2000), and is primarily a result of the dilution effect from the vast quantities of terrigenous mud entering this deep-water region (McDougall, Citation1975; Lewis, Citation1994; Carter and McCave Citation1997). Carbonate content is affected by dissolution below the CCD at 4,000 m water depth (McCave and Carter, Citation1997; Bostock et al., Citation2011).
Chatham Rise
The Chatham Rise is a west–east topographic high that rises up to depths of 400–500 m from the deep (>3,000 m) Hikurangi Plateau and Bounty Trough (Nodder et al., Citation2012; Mitchell et al., Citation2012). There are several topographic highs along Chatham Rise (up to 200 m water depth), including the subaerially exposed Chatham Islands at the far eastern end of the rise. At the western end and in the central part of the rise there are a number of relict, late Neogene volcanic seamounts (Wood et al., Citation1989; Herzer et al., Citation1989; Mackay et al., Citation2005; Collins et al., Citation2011). The rise has a high density of sediment samples due to previous and ongoing interest in the area as a potential mining resource, focussing on phosphorite nodules found on the crest of the rise (e.g. Cullen, Citation1980, Citation1987, Citation1989; Nielsen et al., Citation2015).
This region displays a complex sedimentation pattern (Figure S4). The rise is dominated by sand (20–100%), with low mud (<40%), especially on the topographic highs and at the western end of the rise ((A); S4A). The sediment chart by McDougall (Citation1982) suggested that terrigenous sediment was present on the rise as far east as 179°E. This is surprising as there is a significant topographic gap – the Mernoo Saddle ((A)) – at the western end of the rise, which separates the continental shelf of the South Island from the Chatham Rise. Scoured sediment in the Mernoo Saddle suggest strong currents, while on the lower slope there is a complex of coalescing sediment waves (Barnes, Citation1992). The low amounts of mud on the western rise and the presence of authigenic nodules on the central rise suggest that terrigenous influx from the continental shelf of the South Island is minimal, or that the strong currents along the top of the rise (Chiswell, Citation1994) remove the fine sediments and transport them east along the rise where there are higher amounts of mud, or down the flanks (>60%; (A); S4A). Multibeam mapping of the southwest flank of Chatham Rise at depths of 600–1100 m displays large numbers of pockmarks, ranging in diameter from 150 m to 10 km (Davy et al., Citation2010). These have been suggested to be the result of explosive gas hydrate, or at least fluid release, due to underlying faults (Davy et al., Citation2010; Waghorn et al., Citation2018). These fluid release structures have been subsequently altered by strong currents along the flank of the rise, forming contourite drift deposits, scour structures (Hillman et al., Citation2018; Klaucke et al., Citation2018) and a trough feature at 1200 m (Collins et al., Citation2011), due to strong intermediate depth currents in this region (Morris et al., Citation2001; Bostock et al., Citation2013). Fine sediment has accumulated in some of these depressions (Hillman et al., Citation2017, Citation2018; Klaucke et al., Citation2018).
There are several patches of gravel (20–60%), especially towards the centre and eastern end of the rise (Figure S4C). The patches of gravel (and larger) size sediment on the top (and occasionally on the flanks) of the Chatham Rise are the result of large concentrations of glauconite sand and glauconised phosphorite nodules (Glasby and Summerhayes, Citation1975; Cullen, Citation1989; Nielsen et al., Citation2015). The phosphorites are relict, thought to have formed from the erosion and phosphatisation of Lower and Middle Miocene limestones about 15-5 Ma (Cullen, Citation1980, Citation1989), and some have subsequently been coated with the glauconite that has been forming along the top of the rise over the last 7 Ma (late Miocene) (Norris, Citation1964; Cullen, Citation1967; Lawless, Citation2012). Carter et al. (Citation2000) suggested the entire crest of the Chatham Rise is relict, including relict glacial erratic rocks from Antarctica deposited on top of the rise by icebergs (Cullen, Citation1962). Nodder (Citation2013) considers the surficial sediments on the rise to represent a “condensed” sequence, suggesting that sedimentation rates are low. The presence of these authigenic/diagenetic (phosphorite nodules) and (glauconite) minerals is related to the low sedimentation rates, and a vigorous tidal and current regime (Chiswell, Citation1994) that scour and resuspend the fine sediment from the top of the rise with modern sediment only accumulating in a few small pockets (Cullen and Singleton, Citation1977; Wood et al., Citation1989; Nodder, Citation2013).
Along the top of the rise there is low to moderate carbonate (<40%), but there are two regions of high carbonate around Mernoo Bank and Chatham Islands at the western and eastern ends of the rise, respectively. The carbonate content also increases with depth along the flanks (40–60%; (D); S4D). The rise topographically controls the position of the Subtropical Front, which is the boundary between relatively warm, saline and low-nutrient Subtropical Water that flows into the region from the north, and the relatively cool, fresh and high-nutrient Subantarctic Water that flows into the region from the Southern Ocean in the south (Chiswell et al., Citation2015). The meeting of these two different water masses results in significant primary biological productivity in this region (Murphy et al., Citation2001; Chiswell et al., Citation2013), with relatively elevated fluxes of organic matter to the seabed (Nodder and Northcote, Citation2001). Primary productivity in the surface waters in turn supports diverse pelagic and benthic ecosystems (e.g. Robertson et al., Citation1978; Bradford-Grieve et al., Citation1999; Nodder et al., Citation2003; Clark and Rowden, Citation2009; Nodder et al., Citation2012). The high carbonate regions on the rise are related to local benthic ecosystems on volcanic seamounts or phosphorite nodule fields, which provide important hard substrates for benthic organisms such as deep-sea corals to attach (Dawson, Citation1984; Clark and Rowden, Citation2009; Tracey et al., Citation2011).
Bounty Trough
The Bounty Trough is a failed Cretaceous rift (Carter and Carter, Citation1993; Davy, Citation1993; Carter et al., Citation1994) that forms a ∼350 km-wide structural trough, bounded to the north by the Chatham Rise, to the west of the South Island, and to the south by the Campbell and Bounty plateaux. To the east the Bounty Trough opens out into the abyssal plain of the Southwest Pacific Basin ((A)). The trough has been subdivided into three distinct physiographic units, separated by two sills which display steeper slopes, controlled by the underlying Cenozoic outcrops (Carter and Carter, Citation1993; Davy, Citation1993). In the upper part of the trough there are a series of canyons that incise the Otago shelf and slope, known as the Otago Canyon complex ((A)), which coalesce to form a main Bounty Channel through the centre of the trough at the inner sill (46°S, 173° 23′E; Carter and Carter, Citation1986). Downstream of the confluence the channel is incised by 300–350 m and is 2–3 km wide and exhibits a wide left bank levee in response to Southern Hemispheric Coriolis deflection of channel overspill possibly aided by local currents (Carter and Carter, Citation1988). At 177° 30′W the channel turns sharply south, which is likely structurally controlled (Carter and Carter, Citation1996). The Bounty Channel then meanders ∼1000 km east downslope to ultimately terminate at the Bounty Fan at 4300–4950 m water depth (Carter and Carter, Citation1988; Carter and Carter, Citation1996; Carter et al., Citation1990; Neil, Citation1991).
The trough is dominated by mud (>80%; (A); S5A), with a small amount of sand (<20%; (B); S5B). The mud is predominantly present on the northern side of the Bounty Channel and out on the fan (Neil, Citation1991). Samples taken from within the channel display a mix of sand and mud (Figure S5A; S5B). The carbonate content shows a latitudinal gradient with higher values (40–100%) on the southern side of the trough bordering the Campbell Plateau and low values (20–60%) on the northern side adjacent to the Chatham Rise ((D); S5D). The region is described as being covered by a hemipelagic drape (Carter et al., Citation2000), but with a higher proportion of “pelagic” material compared to east of the North Island (section 3.3). The higher carbonate content on the southern side of the trough may be due to transport of pelagic ooze from the Campbell Plateau via strong intermediate depth currents flowing through the Pūkākī Saddle (Bostock et al., Citation2013). Alternatively, increased terrigenous material could be transported along the southern flank of the Chatham Rise (section 3.4) as strong bottom currents are observed in this area (Nodder and Northcote, Citation2001). The Bounty Channel is considered to be inactive during high modern sea-level, but at lower sea-level, during the glacials, significant volumes of glacially-derived, micaceous-rich terrigenous sediment is transported down the channel by turbidity currents (Griggs et al., Citation1982; Carter and Mitchell, Citation1987; Carter and Carter, Citation1988; Neil, Citation1991; Carter et al., Citation1994; Carter et al., Citation2000; Osterberg, Citation2006). Large sediment fluxes have contributed to large levee systems festooned with well-developed sediment wave fields especially on the preferred left bank facing down-channel (Carter and Carter, Citation1986, Citation1988; Carter et al., Citation1990). There is some evidence for the deposition of modern terrigenous material on the Otago upper slope during interglacials forming a veneer of mud over the upper slope as a series of sediment drifts, most likely fed by the Southland Current transporting sediment off the edge of the continental shelf (Carter and Carter, Citation1988; Lu et al., Citation2003). Some of this mud is contributing to the modern terrigenous sediments within the trough today.
The Bounty Fan is found at the end of the trough at 4300 m. It is a channelised fan complex that is controlled by basement-controlled bathymetry (Carter and Carter, Citation1996, Neil, Citation1991). The fan has built up over many glacial/interglacial cycles with evidence of terrigenous material from turbidity currents (glacial) interleaved with pelagic ooze (interglacial; Griggs et al., Citation1982; Carter et al., Citation1994; Carter and Carter Citation1996). Several regions of the outer fan are currently being eroded by the DWBC which is flows along the edge of the Southwest Pacific abyssal plain (Carter and Carter, Citation1996).
Campbell and Bounty plateaux and Southwest Pacific Basin
The Campbell and Bounty plateaux are large areas of submerged continental crust, separated by the Pūkākī Saddle. The average depth of the Campbell Plateau is ∼500 m, but with several bathymetric highs, including several volcanic subantarctic islands (Campbell/Motu Ihupuku, Auckland, Bounty, Antipodes; (A)). The western and southeastern edges of the plateau are very steep, dropping down to >3,000 m to the Solander Trough and the subantarctic slope and abyssal plain (4,500–5,000 m) of the Southwest Pacific Basin, respectively ((A)).
The sediment maps show that the Campbell Plateau is dominated by mud-sized sediments (80%), but the bathymetric highs are composed of sand (>40%), with localised areas of minor gravel ((A, B, C); S6A; S6B; S6C). The Bounty Plateau is covered by sand and gravel, with minimal mud (Figure S6B; S6C). Both plateaux have limited terrigenous influx and are predominantly covered with carbonate-rich sediments (40–100%; (D); S6D) primarily made up of pelagic oozes (Summerhayes Citation1969; Carter et al., Citation2000; Neil et al., Citation2004, McDougall, Citation1982), but with considerable contributions from benthic carbonate organisms (such as deep-sea corals) on bathymetric highs and on the shelves around the subantarctic islands (Hayward et al., Citation2007). This is probably due to higher primary productivity around these regions, which is evident from satellite images showing chlorophyll a concentrations (Murphy et al., Citation2001; Chiswell et al., Citation2013). Few sediment samples are available from the plateaux margins, but bathymetric and seismic data suggest the seafloor is rocky (Carter et al., Citation2000) with sediment removed by the strong Antarctic Circumpolar Currents (ACC) that sweep along the flanks (Morris et al., Citation2001; Neil et al., Citation2004). Deep-sea corals are also found along the edge of the plateau in these regions of strong ocean currents (Morris et al., Citation2001), probably due to availability and delivery of food to these sessile organisms (Northcote and Neil, Citation2005; Tracey et al., Citation2011; Mackay et al., Citation2014; Bostock et al., Citation2015).
Polymetallic nodules have been observed around the southeastern edge of the Bounty and Campbell plateaux at the base of the deep Subantarctic slope (Carter and McCave, Citation1997; Wright et al., Citation2005) and in Pūkākī Saddle (Summerhayes, Citation1967; Glasby, Citation1976; Glasby and Wright, Citation1990), but also on top of the plateaux (Summerhayes, Citation1967). Authigenic glauconite is also present in sediments on the western side of the plateau and on Pūkākī Rise (Summerhayes, Citation1967; ). The large field of polymetallic nodules found along the southeastern edge of Campbell Plateau in water depths >4,000 m is evident by the significant gravel concentrations in this location ((C); S6C). These deposits lie in the path of the strong DWBC, which removes the fine sediments (Carter and McCave, Citation1997; Davies, Citation2018). The polymetallic nodule field extends as far north as 49°S, curtailed by the presence of the Bounty Fan (Carter, Citation1989; Wright et al., Citation2005; section 3.5). The top of Bollons Seamount also appears to be covered by a mixture of phosphorite and polymetallic nodules (Frontin-Rollet, Citation2017).
The abyssal plain of the Southwest Pacific Basin is poorly sampled, but has some mud, and occasional sand and gravel, and low carbonate contents ((A–D); S6A-D), the latter due to the CCD sitting at 4,500 m water depth (Bostock et al., Citation2011). Based on the descriptions of the sediments from historic records in this region, the sediments from the Southwest Pacific Basin are a combination of deep-sea clays and siliceous sediments with polymetallic nodules (and micronodules) (Carter and McCave, Citation1997).
Puysegur Trench -Macquarie Ridge and Solander Trough
The Puysegur Trench-Macquarie Ridge complex marks the southern part of the plate boundary between the Australian and Pacific plates ((A)). Previously, the ridge was an extensional basaltic mid-ocean ridge (Conway et al., Citation2012) that has undergone considerable convergence and strike slip movement and consequent uplift since the Eocene-Oligocene (Lamarche et al., Citation1997; Sutherland et al., Citation2006). The 1600 km-long ridge is made up of several distinct sections averaging 1,000 m depth, (but exposed at Macquarie Island), separated by deep bathymetric gaps down to depths >3,000 m (Schuur et al., Citation1998). Solander Trough is 80 km wide in the north and 150 km wide in the south and sits between Macquarie Ridge and Campbell Plateau. Down the centre of the trough is the Solander Channel, which originates as a series of canyons in the northern trough and can be traced down to ∼4,000 m water depth in the south, flowing to the west of Christable Seamount (Schuur et al., Citation1998).
There are few sediments on the Macquarie Ridge, which is dominated by basaltic rocks and biogenic organisms such as deep-sea corals, barnacles and sponges (Conway et al., Citation2012). There is also evidence for polymetallic crusts, especially at the southern end of the ridge (Summerhayes, Citation1967). In contrast the northern Solander Trough is dominated by sand and some mud ((A, B); S7A; S7B). The carbonate content of the sediments in the trough increases with increasing water depth and distance from the South Island, but starts to decrease below 4,000 m due to dissolution (Bostock et al., Citation2011). Solander Channel is inactive at modern sea-levels (Carter et al., Citation1996; Bostock et al., Citation2015). South of Christobel Seamount ((A)), a rifted piece of the Campbell Plateau, there is little sediment due to the strong currents of the northern jets of the ACC ((A)), which are forced through a gap in Macquarie Ridge at 53.5°S (Carter and McCave, Citation1997; Sokolov et al., Citation2006; Rintoul et al., Citation2014). The seafloor under the strong ACC is covered in polymetallic nodules (Carter and McCave, Citation1997; Schuur et al., Citation1998). Further south in the Emerald Basin there is more mud and sand present and thick sequences of sediment (Carter and McCave, Citation1997). These sediments are primarily made up of biosiliceous material, formed by silicate producing plankton along the highly productive polar front (Schuur et al., Citation1998; Sturm, Citation2003; Crosta et al., Citation2004; Liston, Citation2018).
Discussion and Conclusion
The combination of bathymetry, geological activity, terrigenous flux, dynamic oceanography, and biological productivity, produces distinct spatial patterns in the surface sediments of the New Zealand EEZ-ECS. Different regions are influenced by different processes () and these regions and influences are summarised in .
Some regions are strongly influenced by the local geological activity, such as the Colville and Kermadec ridges, which are dominated by volcanic gravels and muds. Other regions are inundated with modern terrigenous muds, such as the north east coast of the North Island with some of the highest river suspended sediment discharge rates in the world (Kuehl et al., Citation2016), as well as being influenced by regular tectonic activity, which drives more sediment offshore down the slope via gravity mass transport processes (i.e. submarine landslides, debris flows and turbidity currents). Other regions exhibit relict sands and gravels due to limited modern sedimentological influences, such as the parts of the Campbell Plateau and the Fiordland slope. In some regions there is little terrigenous influx or strong currents over many millions of years, which foster the formation of very slow-forming authigenic minerals (polymetallic nodules, phosphorite and glauconite) such as on the deep abyssal plains, or at the base of the Campbell Plateau slope and along the top of Chatham Rise.
The sediment maps derived by the present study are the product of six decades of work from a large number of researchers and ships collecting deep-seafloor samples. Here for the first time we have brought all the data together to produce systematic texture and carbonate maps for the entire New Zealand EEZ-ECS. While we have not managed to capture all the historical data that has ever been collected, it is clear from these maps that there are still large areas of the New Zealand region that are under-sampled and thus poorly resolved, especially the deep abyssal plains of the Tasman and the Southwest Pacific basins, and Macquarie Ridge and the Solander Trough. The compilation of the sediment data across many decades into one database assumes that there has been no change in the sediments over time. This may be acceptable for most regions of the deep ocean around New Zealand, although there may be some more dynamic regions of the continental slope that have changed due to large earthquakes, volcanic eruptions or intense human activities that affect the seafloor sediments. For example, the large M7.8 November 2016 Kaikoura earthquake, which devastated the highly productive benthic communities in the Kaikoura Canyon, instigated upper slope failures in the canyon and a turbidity current that transported vast quantities of sediment down the Hikurangi Trough and Channel to the deep-sea (Mountjoy et al., Citation2018).
These new surficial sediment maps will provide useful datasets that will assist benthic habitat modelling efforts and the future location of offshore marine infrastructure, such as oil and gas drilling and production platforms and telecommunication cables. The new maps also provide essential background information for future research on the marine sediments in this region. Further work should integrate the geophysical methods, such as multibeam echosounder bathymetric and backscatter data (or other technological advances in satellite mapping of the bathymetry, e.g. Ramillien and Wright (Citation2000)) and sub-bottom profiler data (e.g. Carter, Citation1992), with the sediment data to improve the extent and interpolation of the sediment data as we are unable to discretely sample every metre of seafloor, but also provide detailed outline of the presence of rocks and reefs, which are not currently included in nzSEABED. Another area of future research should be the coupling of the sediment data with hydrological current data and hydrodynamic models to explore the main sediment transport pathways around the region (e.g. Carter and Wilkin, Citation1999). Previous work has also only looked at sediment chemistry and provenance of a few deep-sea sediment samples, or in discrete areas (e.g. Glasby, Citation1979; Churchman et al., Citation1988; Radford, Citation2012), therefore a more comprehensive mineralogy and geochemistry dataset would help to understand the sediment sources and primary distribution pathways of terrigenous sediment to the deep ocean. It is also unclear how the geochemistry of the surficial sediments may affect the chemistry of the overlying water masses and biological productivity, such as in iron-limited subantarctic waters (Croot and Hunter, Citation1998; Boyd et al., Citation2004).
Glossary
| Abyssal | = | Ocean depths below 3,000 m |
| Authigenic | = | Minerals and nodules that form in the ocean via precipitation of chemical elements directly out of the ocean water under specific environmental conditions. |
| Biogenic | = | Produced by marine organisms e.g. shells or skeletal remains. Most commonly this is composed of calcium carbonate, but may be composed of biogenic silica. Mud sized biogenic shells are commonly dominated by phytoplankton such as coccolithophore, while sand sized biogenic material is produced by planktonic and benthic foraminifera, gravel sized material is from shells, corals and bryozoans. |
| Biosiliceous | = | Sediments formed by plankton that produce biogenic silicate skeletons e.g. diatoms or some sponges |
| CaCO3 | = | Calcium carbonate, the mineral used by most marine organisms to produce their shells and skeletons |
| Carbonate | = | Calcium carbonate or CaCO3, see CaCO3 definition |
| CCD | = | Carbonate compensation depth (CCD) depth at which carbonate shells have dissolved in the oceans due to the increasing solubility of calcium carbonate with depth due to lower temperatures and higher pressures. |
| Continental shelf | = | A relatively flat plain from the shore to the slope, where the edge of the shelf is Defined by an significant increase in the slope gradient, typically at water depths >150 m |
| Diagenesis | = | Alteration of the sediments in the water column or sediments, e.g. due to dissolution via fluids, or pressure changes, or heat |
| Hemipelagic | = | A mixture of the terrestrial sediments and pelagic sediments, the exact proportions of each vary |
| Modern | = | Sediments transported and deposited under modern environmental conditions covering the last 7,000 years, when sea level and the modern currents were established. |
| Ooze | = | Carbonate-rich sediments primarily made up of plankton, grainsizes ranging from sand to mud |
| Pelagic | = | Biological plankton shells or tests formed in the water column that fall to the bottom of the ocean to contribute to the sediment |
| Polymetallic | = | Authigenic nodules made up of a range of metal elements, typically manganese (Mn) and iron (Fe), but also containing many others |
| Relict | = | Sediments that are not forming under modern environmental conditions |
| Tephra | = | Volcanic ash that is expelled during volcanic eruptions in a large plume that is transported via wind and rivers into the ocean |
| Terrestrial | = | Sediment that is derived from weathering of rocks on land and then transported via rivers or wind to the ocean |
| Turbidites | = | Distinct sediment deposit formed by the transport of sediments in a gravity driven turbidity current |
| Turbidity current | = | Gravity current of rapidly moving, sediment-laden water, which transports large amounts of mud and sand downslopes, producing distinct sediment deposits called turbidites. |
S7 – Macquarie Ridge and Solander Trough A) Mud %, B) Sand %, C) Gravel %, D) Carbonate %.
Download JPEG Image (8 MB)
S7 – Macquarie Ridge and Solander Trough A) Mud %, B) Sand %, C) Gravel %, D) Carbonate %.
Download JPEG Image (8 MB)
S5 – Bounty Trough A) Mud %, B) Sand %, C) Gravel %, D) Carbonate %.
Download JPEG Image (8.2 MB)
S4 – Chatham Rise A) Mud %, B) Sand %, C) Gravel %, D) Carbonate %, E) location of authigenic nodules.
Download JPEG Image (8 MB)
S3 – North East North Island A) Mud %, B) Sand %, C) Gravel %, D) Carbonate %.
Download JPEG Image (10.4 MB)
S2 – South Fiji Basin and Kermadec Ridge A) Mud %, B) Sand %, C) Gravel %, D) Carbonate %.
Download JPEG Image (5.1 MB)
S1 – Tasman Basin A) Mud %, B) Sand %, C) Gravel %, D) Carbonate %.
Download JPEG Image (10 MB)
Acknowledgments
The authors would like to acknowledge all the scientists, technicians, students and crew from all the research voyages that have collected, documented and analysed sediment samples from the southwest Pacific Ocean over the past six decades. Digitisation of the NIWA surficial sediment data and the write up of this work was funded by NIWA Core and Strategic Science Investment Fund funding, provided by the Ministry of Business, Innovation and Employment, to the Marine Geological Processes and Resources programme. We would like to acknowledge Steve Chiswell for his review of the oceanography in this series of papers. The sediment layers (% mud, % sand, % gravel and % carbonate) are available as GIS rasters from the New Zealand Ocean Data Portal (https://nzodn.nz/).
Disclosure statement
No potential conflict of interest was reported by the authors.
ORCID
Scott Nodder http://orcid.org/0000-0002-1963-8907
Alan Orpin http://orcid.org/0000-0003-2054-7081
Related Research Data
References
- Alexander CR, Walsh JP, Orpin AR. 2010. Modern sediment dispersal and accumulation on the outer Poverty continental margin. Marine Geology. 270(1):213–226.
- Allan ASR, Baker JA, Carter L, Wysoczanksi RJ. 2008. Reconstructing the Quaternary evolution of the world's most active silicic volcanic system: insights from an ∼1.65 Ma deep ocean tephra record sourced from Taupo Volcanic Zone, New Zealand. Quaternary Science Reviews. 27(25):2341–2360.
- Arron ES. 1986. Oamaru coastal sediments chart (1: 200,000). Wellington, New Zealand: New Zealand Oceanographic Institute, Department of Scientific and Industrial Research.
- Arron ES, Doyle AC. 1983. Mokau coastal sediments chart (1: 200,000). Wellington, New Zealand: New Zealand Oceanographic Institute, Department of Scientific and Industrial Research.
- Ballance PF, Ablaev AG, Pushchin IK, Pletnev SP, Birylina MG, Itaya T, Follas HA, Gibson GW. 1999. Morphology and history of the Kermadec trench–arc–backarc basin–remnant arc system at 30 to 32 S: geophysical profile, microfossil and K–Ar data. Marine Geology. 159(1):35–62.
- Barnes P. 2009. Postglacial (after 20 ka) dextral slip rate of the offshore Alpine Fault, New Zealand. Geology. 37:3–6.
- Barnes PM. 1992. Mid-bathyal current scours and sediment drifts adjacent to the Hikurangi deep-sea turbidite channel, eastern New Zealand: evidence from echo character mapping. Marine Geology. 106:169–187.
- Barnes PM, Bostock HC, Neil HL, Strachan LJ, Gosling M. 2013. A 2300-year paleoearthquake record of the Southern Alpine Fault and Fiordland subduction zone, New Zealand, based on stacked turbidites. Bulletin of the Seismological Society of America. 103:2424–2446.
- Barnes PM, Lamarche G, Bialas J, Henrys S, Pecher I, Netzeband GL, Greinert J, Mountjoy JJ, Pedley K, Crutchley G. 2010. Tectonic and geological framework for gas hydrates and cold seeps on the Hikurangi subduction margin, New Zealand. Marine Geology. 272(1):26–48.
- Barnes PM, Sutherland R, Delteil J. 2005. Strike-slip structure and sedimentary basins of the southern Alpine Fault, Fiordland, New Zealand. Geological Society of America Bulletin. 117:411–435.
- Bostock HC, Hayward BW, Neil HL, Currie KI, Dunbar GB. 2011. Deep-water carbonate concentrations in the southwest Pacific. Deep-Sea Research I. 58:72–85.
- Bostock HC, Hayward BW, Neil HL, Sabaa AT, Scott GH. 2015. Changes in the position of the Subtropical Front south of New Zealand since the last glacial period. Paleoceanography. 30. doi:10.1002/2014PA002652.
- Bostock HC, Sutton PJ, Williams MJM, Opdyke BN. 2013. Reviewing the circulation and mixing of Antarctic intermediate water in the South Pacific using evidence from geochemical tracers and Argo float trajectories. Deep Sea Research I. 73:84–98.
- Boyd PW, McTainsh G, Sherlock V, Richardson K, Nichol S, Ellwood M, Frew R. 2004. Episodic enhancement of phytoplankton stocks in New Zealand subantarctic waters: contribution of atmospheric and oceanic iron supply. Global Biogeochemical Cycles. 18(1):GB1029. doi:10.1029/2002GB002020.
- Bradford-Grieve JM, Boyd PW, Chang FH, Chiswell S, Hadfield M, Hall JA, James MR, Nodder SD, Shushkina EA. 1999. Pelagic ecosystem structure and functioning in the Subtropical Front region east of New Zealand in austral winter and spring 1993. Journal of Plankton Research. 21(3):405–428.
- Brodie JW. 1964. Bathymetry of the New Zealand region. Memoirs New Zealand Oceanographic Institute. 11:55. (Bulletin of the New Zealand Department of Scientific and Industrial Research, 161), p. 55.
- Buczkowski BJ, Reid JA, Jenkins CJ, Reid JM, Williams SJ, Flocks JG. 2006. usSEABED: Gulf of Mexico and Caribbean (Puerto Rico and U.S. Virgin Islands) offshore surficial sediment data release: U.S. Geological Survey Data Series 146, version 1.0. Online at https://pubs.usgs.gov/ds/2006/146/.
- Carey R, Soule SA, Manga M, White JDL, McPhie J, Wysoczanski R, Jutzeler M, Tani K, Yoerger D, Fornari D, et al. 2018. The largest deep-ocean silicic volcanic eruption of the past century. Science Advances. 4:e1701121. doi:10.1126/sciadv.1701121.
- Carter L. 1975. Sedimentation on the continental terrace around New Zealand: A review. Marine Geology. 19:209–237.
- Carter L. 1989. New occurrences of manganese nodules in the South-western Pacific Basin, east of New Zealand. New Zealand Journal of Marine and Freshwater Research. 23:247–253.
- Carter L. 1992. Acoustical characterisation of seafloor sediments and its relationship to active sedimentary processes in Cook Strait, New Zealand. New Zealand Journal of Geology and Geophysics. 35:289–300.
- Carter L, Alloway B, Shane P, Westgate J. 2004. Deep-ocean record of major late Cenozoic rhyolitic eruptions from New Zealand. New Zealand Journal of Geology and Geophysics. 47(3):481–500.
- Carter L, Carter RM. 1988. Late Quaternary development of left bank levees in the Bounty Trough, New Zealand. Marine Geology. 78:185–197.
- Carter L, Carter RM. 1993. Sedimentary evolution of the Bounty Trough: a Cretaceous rift basin, southwestern Pacific Ocean. In: Ballance PF, editor. South Pacific sedimentary Basins. Vol. 2. Amsterdam: Elsevier; p. 51–67.
- Carter L, Carter RM, McCave IN, Gamble J. 1996. Regional sediment recycling in the abyssal Southwest Pacific Ocean. Geology. 24:735–738.
- Carter L, Carter RM, Nelson CS, Fulthorpe CS, Neil HL. 1990. Evolution of Pliocene to recent abyssal sediment waves on Bounty Channel levees, New Zealand. Marine Geology. 95:97–109.
- Carter L, Eade JV. 1980. Hauraki coastal sediments chart (1: 200,000). Wellington, New Zealand: New Zealand Oceanographic Institute, Department of Scientific and Industrial Research.
- Carter L, Heath RA. 1975. Role of mean circulation, tides, and waves in the transport of bottom sediment on the New Zealand continental shelf. New Zealand Journal of Marine and Freshwater Research. 9(4):423–448. doi:10.1080/00288330.1975.9515579.
- Carter L, Herzer RH. 1986. Pegasus coastal sediments chart (1: 200,000), 2nd ed. Wellington, New Zealand: New Zealand Oceanographic Institute, Department of Scientific and Industrial Research.
- Carter L, Manighetti B, Elliot M, Trustrum N, Gomez B. 2002. Source, sea level and circulation effects on the sediment flux to the deep ocean over the past 15 ka off eastern New Zealand. Global Planetary Change. 33:339–355.
- Carter L, Manighetti B, Ganssen G, Northcote L. 2008. Southwest Pacific modulation of abrupt climate change during the Antarctic Cold reversal–Younger Dryas. Palaeogeography, Palaeoclimatology, Palaeoecology. 260(1):284–298.
- Carter L, McCave IN. 1997. The sedimentary regime beneath the deep western boundary current inflow to the southwest Pacific Ocean. Journal of Sedimentary Research. 67(6):1005–1017.
- Carter L, Mitchell JS. 1987. Late Quaternary sediment pathways through the deep ocean, east of New Zealand. Paleoceanography. 2:409–422.
- Carter L, Neil HL, McCave IN. 2000. Glacial to interglacial changes in non-carbonate and carbonate accumulation in the SW Pacific Ocean, New Zealand. Palaeogeography, Palaeoclimatology, Palaeoecology. 162:333–356.
- Carter L, Nelson CS, Neil HL, Froggatt PC. 1995. Correlation, dispersal, and preservation of the Kawakawa Tephra and other late Quaternary tephra layers in the Southwest Pacific Ocean. New Zealand Journal of Geology and Geophysics. 38:29–46.
- Carter L, Shane PA, Alloway BAV, Hall IR, Harris S, Westgate J. 2003. Demise of one volcanic zone and birth of another - a 12 Ma marine record of major rhyolitic eruptions from New Zealand. Geology. 31:493–496.
- Carter L, Wilkin J. 1999. Abyssal circulation around New Zealand—A comparison between observations and a global circulation model. Marine Geology. 159(1–4):221–239.
- Carter RM, Carter L. 1996. The abyssal bounty Fan and lower bounty channel: evolution of a rifted-margin sedimentary system. Marine Geology. 130(3–4):181–202.
- Carter RM, Carter L, Davy B. 1994. Seismic stratigraphy of the bounty trough, S.W. Pacific Ocean. Marine and Petroleum Geology. 11:79–93.
- Chiswell SM. 1994. Acoustic Doppler current profiler measurements over the Chatham Rise. New Zealand Journal of Marine and Freshwater Research. 28:167–178.
- Chiswell SM, Bostock HC, Sutton PJH, Williams MJM. 2015. Physical oceanography of the deep seas around New Zealand: a review, New Zealand. Journal of Marine and Freshwater Research. doi:10.1080/00288330.2014.992918.
- Chiswell SM, Bradford-Grieve J, Hadfield MG, Kennan SC. 2013. Climatology of surface chlorophyll a, autumn-winter and spring blooms in the southwest Pacific Ocean. Journal of Geophysical Research: Oceans. 118:1003–1018. doi:10.1002/jgrc.20088.
- Churchman GJ, Hunt JL, Glasby GP, Renner RM, Griffiths GA. 1988. Input of river-derived sediment to the New Zealand continental shelf: II mineralogy and composition. Estuarine, Coastal and Shelf Science. 27(4):397–411.
- Clark MR, Rowden AA. 2009. Effect of deepwater trawling on the macro-invertebrate assemblages of seamounts on the Chatham Rise, New Zealand. Deep Sea Research Part I: Oceanographic Research Papers. 56(9):1540–1554.
- Clement AJH, Whitehouse PL, Sloss CR. 2013. An examination of spatial variability in the timing and magnitude of Holocene relative sea-level changes in the New Zealand archipelago. Quaternary Science Reviews. 131:73–101.
- Cole J, Lewis K. 1981. Evolution of the Taupo-Hikurangi subduction system. Tectonophysics. 72(1–2):1–21.
- Collins JA, Molnar P, Sheehan AF. 2011. Multibeam bathymetric surveys of submarine volcanoes and mega-pockmarks on the Chatham Rise, New Zealand. New Zealand Journal of Geology and Geophysics. 54(3):329–339. doi:10.1080/00288306.2011.589860.
- Collot J-Y, Lewis K, Lamarche G, Lallemand S. 2001. The giant Ruatoria debris avalanche on the northern Hikurangi margin New Zealand: result of oblique seamount subduction. Journal of Geophysical Research. 106(B9):19271–19297.
- Conway CE, Bostock HC, Baker JA, Wysoczanski RJ, Verdier A-L. 2012. Evolution of Macquarie Ridge complex seamounts: implications for volcanic and tectonic processes at the Australia-Pacific plate boundary south of New Zealand. Marine Geology. 295–298:34–50.
- Croot PL, Hunter KA. 1998. Trace metal distributions across the continental shelf near Otago Peninsula, New Zealand. Marine Chemistry. 62(3):185–201.
- Crosta X, Sturm A, Armand L, Pichon JJ. 2004. Late Quaternary sea ice history in the Indian sector of the Southern Ocean as recorded by diatom assemblages. Marine Micropaleontology. 50:209–223.
- Crundwell M, Scott G, Naish T, Carter L. 2008. Glacial-interglacial ocean climate variability from planktonic forminifera during the Mid-Pleistocene transition in the temperate Southwest Pacific, ODP site 1123. Palaeogeography, Palaeoclimatology, Palaeoecology. 260:202–229.
- Cullen DJ. 1962. The significance of a glacial erratic from the Chatham Rise, east of New Zealand. New Zealand Journal of Geology and Geophysics. 5(2):309–313. doi:10.1080/00288306.1962.10423119.
- Cullen DJ. 1967. The age of glauconite from the Chatham rise, east of New Zealand. New Zealand Journal of Marine and Freshwater Research. 1(4):399–406. doi:10.1080/00288330.1967.9515214.
- Cullen DJ. 1980. Distribution composition and age of submarine phosphorites on Chatham Rise east of New Zealand. SEPM Special Publication. 28:139–148.
- Cullen DJ. 1987. The submarine phosphate resource on central Chatham Rise. Vol 2. Wellington, New Zealand: New Zealand Division of Marine and Freshwater Science (DSIR) report; 22pp.
- Cullen DJ. 1989. The Chatham Rise phosphorites of New Zealand. Phosphorite deposits of the world. Cambridge: Cambridge University Press; p. 528–532.
- Cullen DJ, Gibb JG. 1965. Foveaux coastal sediments chart (1: 200,000). Wellington, New Zealand: New Zealand Oceanographic Institute, Department of Scientific and Industrial Research.
- Cullen DJ, Singleton RJ. 1977. The distribution of submarine phosphorite deposits on central Chatham Rise, east of New Zealand. New Zealand Oceanographic Institute DSIR.
- Davies AML. 2018. Trace elements in New Zealand ferromanganese nodules: implications for deep sea environments [MSc thesis]. University of Victoria, Wellington.
- Davy B. 1993. The bounty trough—basement structure influences on sedimentary basin evolution. In: Ballance PF, editor. South Pacific sedimentary basins. Sedimentary basins of the world. Vol. 2. Elsevier Amsterdam; p. 69–92.
- Davy B, Hoernle K, Werner R. 2008. Hikurangi plateau: crustal structure, rifted formation, and Gondwana subduction history. Geochemistry, Geophysics, Geosystems. 9(7):Q07004. doi:10.1029/2007GC001855.
- Davy B, Pecher I, Wood R, Carter L, Gohl K. 2010. Gas escape features off New Zealand: evidence of massive release of methane from hydrates. Geophysical Research Letters. 37:21.
- Dawson E. 1984. The benthic fauna of the Chatham Rise: an assessment relative to possible effects of phosphorite mining. Geologisches Jahrbuch. D65:209–231.
- De Ronde CEJ, Baker ET, Massoth GJ, Lupton JE, Wright IC, Sparks RJ, Bannister SC, Reyners ME, Walker SL, Greene RR, et al. 2007. Submarine hydrothermal activity along the mid-Kermadec Arc, New Zealand: large-scale effects on venting. Geochemistry, Geophysics, Geosystems. 8:Q07007. doi:10.1029/2006GC001495.
- Diesing M, Green SL, Stephens D, Lark RM, Stewart HA, Dove D. 2014. Mapping seabed sediments: comparison of manual, geostatistical object-based image analysis and machine learning approaches. Continental Shelf Research. 84:107–119.
- Doyle AC, Arron ES. 1982. Raglan coastal sediments chart (1: 200,000). Wellington, New Zealand: New Zealand Oceanographic Institute, Department of Scientific and Industrial Research.
- Doyle AC, Carter L, Glasby GP, Lewis KB. 1979. Bay of Plenty coastal sediments chart (1: 200,000). Wellington, New Zealand: New Zealand Oceanographic Institute, Department of Scientific and Industrial Research.
- Eade JV. 1974. Poor Knights coastal sediments chart (1: 200,000). Wellington, New Zealand: New Zealand Oceanographic Institute, Department of Scientific and Industrial Research.
- Eade JV, van der Linden WJM. 1970. Sediments and stratigraphy of deep-sea cores from the Tasman Basin. New Zealand Journal of Geology and Geophysics. 13(1):228–268.
- Ferguson RI, Paola C. 1997. Bias and precision of percentiles of bulk grain size distributions. Earth Surface Processes and Landforms. 22(11):1061–1077.
- Frontin-Rollet GE. 2017. The geochemistry and ecotoxicity of offshore New Zealand phosphorites [MSc thesis]. University of Victoria, Wellington.
- Gamble JA, Wright IC. 1995. The southern Havre Trough: geological structure and magma petrogenesis of an active backarc rift complex. In Taylor B, editor, Backarc basins: tectonics and magmatism. New York: Plenum; pp. 29–62.
- Gerber TP, Pratson LF, Kuehl S, Walsh JP, Alexander C, Palmer A. 2010. The influence of sea level and tectonics on late Pleistocene through Holocene sediment storage along the high-sediment supply Waipaoa continental shelf. Marine Geology. 270:139–159.
- Glasby GP. 1976. Manganese nodules in the South Pacific: A review. New Zealand Journal of Geology and Geophysics. 19(5):707–736. doi:10.1080/00288306.1976.10426315.
- Glasby GP. 1979. Major element analyses of marine sediments from the Southwest Pacific. Lower Hutt, Wellington: Department of Scientific and Industrial Research.
- Glasby GP, Stoffers P, Grapes RH, Plüger WL, McKnight DG, Main W. 1986. Manganese nodule occurrence in the Tasman Sea. New Zealand Journal of Marine and Freshwater Research. 20(3):489–494.
- Glasby GP, Summerhayes CP. 1975. Sequential deposition of authigenic marine minerals around New Zealand: paleoenvironmental significance. New Zealand Journal of Geology and Geophysics. 18(3):477–490. doi:10.1080/00288306.1975.10421548.
- Glasby GP, Wright IC. 1990. Marine mineral potential in New Zealand's Exclusive Economic Zone. Marine Mining. 9:403–427.
- Goodell HG, Houtz R, Ewing M, Hayes D, Naini B, Echols RJ, Kennett JP, Donahue JG. 1973. Marine sediments of the Southern Oceans: Antarctic Map Folio Series, 17.
- Greinert J, Lewis KB, Bialas J, Pecher IA, Rowden A, Bowden DA, De Batist M, Linke P. 2010. Methane seepage along the Hikurangi Margin, New Zealand: overview of studies in 2006 and 2007 and new evidence from visual, bathymetric and hydroacoustic investigations. Marine Geology. 272:6–25.
- Griggs GB, Carter L, Kennett JP, Carter RM. 1982. Late Quaternary marine stratigraphy southeast of New Zealand. Geological Society of America Bulletin. 94:791–797.
- Harff J, Bliesener A, Leipe T, Lemke W, Reimer C, Tauber F, Olea RA. 1997. Zusammenstellung und wissenschaftliche Interpretation von Daten über den Meeresboden der westlichen Ostsee aus den Jahren 1953–1985 (Schlussbericht). Universität Rostock/Institut für Ostseeforschung, Warnemünde (Germany), BMBF03F0079A, 192 pp, hdl:10013/epic.34456.d001.
- Hayward BW, Grenfell HR, Sabaa AT, Neil HL. 2007. Factors influencing the distribution of Subatnarctic deep-sea benthic foraminifera, Campbell and Bounty Plateaux, New Zealand. Marine Micropaleontology. 62:141–166.
- Herzer RH. 1977. Late Quaternary geology of the Canterbury continental terrace [PhD Thesis]. Victoria University, Wellington. http://hdl.handle.net/10063/2102
- Herzer RH. 1979a. Submarine slides and submarine canyons on the continental slope off Canterbury, New Zealand. New Zealand Journal of Geology and Geophysics. 22(3):391–406. doi:10.1080/00288306.1979.10424107.
- Herzer RH. 1979b. Banks coastal sediments chart (1: 200,000). Wellington, New Zealand: New Zealand Oceanographic Institute, Department of Scientific and Industrial Research.
- Herzer RH. 1981. Ellesmere Coastal Sediments chart (1: 200 000). New Zealand Oceanographic Institute, Department of Scientific and Industrial Research, Wellington, New Zealand.
- Herzer RH, Challis GA, Christie RHK, Scott GH, Watters WA. 1989. The Urry Knolls, late Neogene alkaline basalt extrusives, southwestern Chatham rise. Journal of the Royal Society of New Zealand. 19(2):181–193.
- Hesse PP. 1994. The record of continental dust from Australia in Tasman Sea sediments. Quaternary Science Reviews. 13:257–272.
- Hicks DM, Shankar U, McKerchar AI, Basher L, Lynn I, Page M, Jessen M. 2011. Suspended sediment yields from New Zealand rivers. Journal of Hydrology (New Zealand. 50:81–142.
- Hillman JI, Klaucke I, Pecher IA, Gorman AR, von Deimling J S, Bialas J. 2018. The influence of submarine currents associated with the Subtropical Front upon seafloor depression morphologies on the eastern passive margin of South Island, New Zealand. New Zealand Journal of Geology and Geophysics. 61(1):112–125. doi:10.1080/00288306.2018.1434801.
- Hillman JI, Lamarche G, Pallentin A, Pecher IA, Gorman AR, von Deimling JS. 2017. Validation of automated supervised segmentation of multibeam backscatter data from the Chatham Rise, New Zealand. Marine Geophysical Research. 39(1–2):205–227.
- Hume TM, Bell RG, de Lange WP, Healy TR, Hicks DM, Kirk RM. 1992. Coastal oceanography and sedimentology in New Zealand, 1967–1991. New Zealand Journal of Marine and Freshwater Research. 26:1–36.
- Jenkins C, Bethel M, Penland S, Mixon D. 2008. A marine substrates geodatabase of the Northern Gulf of Mexico, for Benthic and Fisheries Habitats. http://citeseerx.ist.psu.edu/viewdoc/download?doi=10.1.1.603.2886&rep=rep1&type=pdf.
- Jenkins CJ. 1997. Building offshore soils databases. Sea Technology. 38(12):25–28.
- Jenkins CJ. 2002. Automated digital mapping of sediment colour descriptions. Geo-Marine Letters. 22(4):181–187.
- Jeromson MR. 2014. The distribution and characteristics of turbidites in the Solander Trough, South of New Zealand [MSc Thesis]. University of Auckland.
- Jones GA, Kaiteris P. 1983. A vacuum-gasometric technique for rapid and precise analysis of calcium carbonate in sediments and soils: research method paper. Journal of Sedimentary Petrology. 53:655–660.
- Klaucke I, Sarkar S, Bialas J, Berndt C, Dannowski A, Dumke I, Hillman J, Koch S, Nodder SD, Papenberg C, Schneider von Deimling J. 2018. Giant depressions on the Chatham Rise offshore New Zealand – Morphology, structure and possible relation to fluid expulsion and bottom currents. Marine Geology. 399:158–169. https://doi.org/10.1016/j.margeo.2018.02.011
- Kuehl SA, Alexander CR, Blair NE, Harris CK, Marsaglia KM, Ogston AS, Orpin AR, Roering JJ, Bever AJ, Bilderback EL, et al. 2016. A source-to-sink perspective of the Waipaoa River margin. Earth-Science Reviews. 153:301–334.
- Kohn BP, Glasby GP. 1978. Tephra distribution and sedimentation rates in the Bay of Plenty, New Zealand. New Zealand Journal of Geology and Geophysics. 21(1):49–70.
- Lamarche G, Collot JY, Wood RA, Sosson M, Sutherland R, Delteil J. 1997. The Oligo-Miocene Pacific-Australia plate boundary, south of New Zealand: evolution from oceanic spreading to strike-slip faulting. Earth and Planetary Science Letters. 148:129–139.
- Lambeck K, Rouby H, Purcell A, Sun Y, Sambridge M. 2014. Sea level and global ice volumes from the last glacial maximum to the Holocene. Proceedings of the National Academy of Science. 111:15296–15303.
- Larsen IJ, Almond PC, Eger A, Stone JO, Montgomery DR, Malcolm B. 2014. Rapid soil production and weathering in the outhern Alps, New Zealand. Science. 343:637–640.
- Lawless AS. 2012. Nature, Distribution, Origin and Economics of Glauconite in Carbonate-Phosphate-Glauconite Surficial Deposits on Central Chatham Rise, Southwest Pacific, University of Waikato, Hamilton, New Zealand. Master of Science in Earth and Ocean Sciences; 279p.
- Leathwick JR, Rowden A, Nodder S, Gorman R, Bardsley S, Pinkerton M, Baird S, Hadfield M, Currie K, Goh A. 2012. Development of a benthic-optimised marine environment classification for New Zealand waters. New Zealand Aquatic Environment and Biodiversity Report 88, Final Research Report prepared as part completion of Objective 5 of BEN200601 for the Ministry of Fisheries (now Ministry for Primary Industries), Wellington, New Zealand, 54pp.
- Lewis VJ. 1977. Bibliography of New Zealand Submarine Geology 1866–1969. (New Zealand Oceanographic Institute Memoir No. 64). Wellington, DSIR, NZ Oceanographic Institute; p. 32.
- Lewis K. 1994. The 1500-km-long Hikurangi Channel: trench-axis channel that escapes its trench, crosses a plateau, and feeds a fan drift. Geo-Marine Letters. 14(1):19–28.
- Lewis K, Marshall BA. 1996. Seep faunas and other indicators of methane-rich dewatering on New Zealand convergent margins. New Zealand Journal of Geology and Geophysics. 39(2):181–200. doi:10.1080/00288306.1996.9514704.
- Lewis K, Pettinga J. 1993. The emerging, imbricate frontal wedge of the Hikurangi margin. Sedimentary Basins of the World. 2:225–250.
- Lewis KB. (editor). 1985. New seismic profiles, cores, and dated rocks from Hikurangi Margin, New Zealand. NZOI Oceanographic Field Report 22. DSIR, Division of Marine and Freshwater Science, Wellington, New Zealand.
- Lewis KB, Barnes PM. 1999. Kaikoura Canyon, New Zealand: active conduit from near-shore sediment zones to trench-axis channel. Marine Geology. 162(1):39–69.
- Lewis KB, Collot J-Y, Lallemand SE. 1998. The dammed Hikurangi Trough: a channel-fed trench blocked by subducting seamounts and their wake avalanches (New Zealand–France GeodyNZ Project). Basin Research. 10(4):441–468.
- Lewis KB, Gibb JG. 1970. Turnagain coastal sediments chart (1: 200,000). Wellington, New Zealand: New Zealand Oceanographic Institute, Department of Scientific and Industrial Research.
- Lewis KB, Mitchell JS. 1980. Cook Strait coastal sediments chart (1: 200,000). Wellington, New Zealand: New Zealand Oceanographic Institute, Department of Scientific and Industrial Research.
- Lewis KB, Pantin HM. 2002. Channel-axis, overbank and drift sediment waves in the southern Hikurangi Trough, New Zealand. Marine Geology. 192:123–151.
- Li J, Heap AD, Potter A, Huang Z, Daniell JJ. 2011. Can we improve the spatial predictions of seabed sediments? A case study of spatial interpolation of mud content across the southwest Australian margin. Continental Shelf Research. 31:1365–1376.
- Lisitzin AP. 1972. Sedimentation in the World Ocean. Society of Economic Paleontologists and Mineralogists, Spec Pub 17:217–238.
- Liston MA. 2018. Glacial-interglacial productivity in the polar frontal zone, southwest Pacific Ocean. [Unpublished MSc thesis] Victoria University, Wellington, New Zealand.
- Lotter AF, Merkt J, Sturm M. 1997. Differential sedimentation versus coring artifacts: a comparison of two widely used piston-coring methods. Journal of Paleolimnology. 18(1):75–85.
- Lu H, Fulthorpe CS, Mann P. 2003. Three-dimensional architecture of shelf-building sediment drifts in the offshore Canterbury Basin, New Zealand. Marine Geology. 193:19–47.
- Lucieer V, Lamarche G. 2011. Unsupervised fuzzy classification and object-based image analysis of multibeam data to map deep water substrates, Cook Strait, New Zealand. Continental Shelf Research. 31:1236–1247.
- Mackay KA, Rowden AA, Bostock HC, Tracey DM. 2014. Revisiting squires’ coral coppice, Campbell Plateau, New Zealand. New Zealand Journal of Marine and Freshwater Research. http://doi.org/10.1080/00288330.2014.897635.
- Mackay KA, Wood BA, Clark MR. 2005. Chatham Rise Bathymetry. Wellington, New Zealand: National Institute of Water and Atmospheric Research Ltd. NIWA Miscellaneous Chart Series 82.
- Martinez I. 1994. Late Pleistocene carbonate dissolution patterns in the Tasman Sea. In: van der Linden GJ, Swanson KM, Muir RJAA, editor(s), Evolution of the Tasman Sea Basin. Rotterdam, Netherlands: Balkema; pp. 215–228.
- McCave IN, Carter L. 1997. Recent sedimentation beneath the deep Western Boundary Current off northern New Zealand. Deep Sea Research Part I: Oceanographic Research Papers. 44(7):1203–1237.
- McDougall JC. 1975. Cook oceanic sediments chart (1:1,000,000). Wellington, New Zealand: New Zealand Oceanographic Institute (now NIWA), Department of Scientific and Industrial Research.
- McDougall JC. 1979. Three Kings oceanic sediments chart (1: 1,000,000). Wellington, New Zealand: New Zealand Oceanographic Institute (now NIWA), Department of Scientific and Industrial Research.
- McDougall JC. 1982. Bounty oceanic sediments chart (1:1,000,000). Wellington, New Zealand: New Zealand Oceanographic Institute (now NIWA), Department of Scientific and Industrial Research.
- McMullen KY, Paskevich VF, Poppe LJ. 2014. GIS data catalog (ver. 3.0, November 2014), in Poppe LJ, McMullen KY, Williams SJ, Paskevich VF, eds., USGS east-coast sediment analysis: Procedures, database, and GIS data, U.S. Geological Survey Open-File Report 2005-1001, available online at http://pubs.usgs.gov/of/2005/1001/.
- Micallef A, Mountjoy JJ, Canals M, Lastras G. 2012. Deep-seated bedrock landslides and submarine canyon evolution in an active tectonic margin: Cook Strait, New Zealand. In: Yamada Y, Kawamura K, Ikehara K et al., Submarine mass movements and their consequences. Vol 31. Dordrecht: Springer; p. 201–212.
- Mitchell JS. 1987. Tasman coastal sediments chart (1: 200,000). Wellington, New Zealand: New Zealand Oceanographic Institute (now NIWA), Department of Scientific and Industrial Research.
- Mitchell JS, Carter L, McDougall JC. 1989. New Zealand regional sediments (1:6,000,000). Wellington, New Zealand: New Zealand Oceanographic Institute (now NIWA), Department of Scientific and Industrial Research. NZOI Miscellaneous Chart Series 67.
- Mitchell JS, Mackay KA, Neil HL, Mackay EJ, Pallentin A, Notman P. 2012. Undersea New Zealand. 1:5,000,000. NIWA Chart, Miscellaneous Series No. 92.
- Morris M, Stanton B, Neil H. 2001. Subantarctic oceanography around NewZealand: preliminary results from an ongoing survey. New Zealand Journal of Marine and Freshwater Research. 35:499–519.
- Mortimer N, Campbell HJ, Tulloch AJ, King PR, Stagpoole VM, Wood RA, Rattenbury MS, Sutherland R, Adams CJ, Collot J. 2017. Zealandia: Earth’s hidden continent. GSA Today. 27(3):27–35. doi:10.1130/GSATG321A.1.
- Mortimer N, Gans PB, Palin JM, Meffre S, Herzer RH, Skinner DNB. 2010. Location and migration of Miocene–Quaternary volcanic arcs in the SW Pacific region. Journal of Volcanology and Geothermal Research. 190:1–10.
- Mortimer N, Herzer RH, Gans PB, Laporte-Magoni C, Calvert AT, Bosch D. 2007. Oligocene–Miocene tectonic evolution of the South Fiji Basin and Northland Plateau, SW Pacific Ocean: evidence from petrology and dating of dredged rocks. Marine Geology. 237:1–24.
- Mountjoy JJ, Barnes PM, Pettinga JR. 2009. Morphostructure and evolution of submarine canyons across an active margin: Cook Strait sector of the Hikurangi Margin, New Zealand. Marine Geology. 260(1):45–68.
- Mountjoy JJ, Howarth JD, Orpin AR, Barnes PM, Bowden DA, Rowden AA, Schimel ACG, Holden C, Horgan HJ, Nodder SD, et al. 2018. Earthquakes drive large-scale submarine canyon development and sediment supply to deep-ocean basins. Science Advances. 4:eaar3748.
- Mountjoy JJ, McKean J, Barnes PM, Pettinga JR. 2009. Terrestrial-style slow-moving earthflow kinematics in a submarine landslide complex. Marine Geology. 267:114–127.
- Mountjoy JJ, Micallef A. 2012. Polyphase emplacement of a 30 km3 blocky debris avalanche and its role in slope-gully development. In: Y. Yamada, K. Kawamura, K. Ikehara et al., editor(s). Submarine mass movements and their consequences. Vol 31. Wellington: Springer; p. 213–222.
- Murphy RJ, Pinkerton MH, Bradford-Grieve JM, Boyd PW. 2001. Phytoplankton distributions around New Zealand derived from SeaWiFS remotely-sensed ocean colour data. New Zealand Journal of Marine and Freshwater Research. 35:343–362.
- Neil HL. 1991. Late Quaternary stratigraphy, sedimentology and evolution of Bounty Fan system, bounty trough, Southwest Pacific. Department of Earth Sciences [MSc Degree Thesis] University of Waikato, Hamilton, New Zealand.
- Neil HL, 2005. TAN0512 – West coast canyons. Unpublished NIWA voyage report.
- Neil HL. 2007. TAN0712 – West coast canyons 2. Unpublished NIWA voyage report.
- Neil HL. 2008. TAN0808 - West coast canyons 2A. Unpublished NIWA voyage report.
- Neil HL, Carter L, Morris MY. 2004. Thermal isolation of Campbell Plateau, New Zealand, by the Antarctic circumpolar current over the past 130 kyr. Paleoceanography. 19:PA4008. doi:10.1029/2003PA000975.
- Nelson CS, Hendy CH, Dudley WC. 1986. Quaternary isotope stratitgraphy of hole 593, Challenger Plateau, south Tasman Sea: preliminary observations based on foraminifers and calcareous nannofossils. Initial Reports of the Deep Sea Drilling Project. 90:1413–1424.
- Nelson CS, Hancock GE, Kamp PJJ. 1982. Shelf to Basin, temperate skeletal carbonate sediments, Three Kings Plateau, New Zealand. Journal of Sedimentary Petrology. 52:717–732.
- Nielsen SH, McKenzie C, Miller A, Partington G, Payne C, Puccioni E, Stokes M, Wildman C, Falconer R KH, Wood R. 2015. Chatham Rise nodular phosphate—modelling the prospectivity of a lag deposit (off-shore New Zealand): A critical tool for use in resource development and deep sea mining. Ore Geology Reviews. 71:545–557.
- Nodder SD. 2012, revised in 2013. Natural Sedimentation on the Chatham Rise. NIWA Client Report prepared for Chatham Rock Phosphate Ltd, NIWA Client Report WLG2012-42. Also available as Expert Witness testimony (http://www.epa.govt.nz/EEZ/EEZ000006/EEZ000006_08AppEvidence_Nodder_Scott_Seabed_morphology_and_natural_sedimentation.pdf): 33p.
- Nodder SD, Bowden DA, Pallentin A, Mackay K. 2012. Seafloor habitats and benthos of a continental ridge: Chatham Rise, New Zealand (chapter 56). In: Harris PT, Baker EK, editor(s). Seafloor geomorphology as benthic habitat: GeoHab atlas of seafloor geomorphic features and benthic habitats. Amsterdam: Elsevier; p. 763–776.
- Nodder SD, Edwards NA, Burrows MW. 1992. Patea coastal sediments chart (1: 200,000), 2nd ed. Wellington, New Zealand: New Zealand Oceanographic Institute (now NIWA), Department of Scientific and Industrial Research.
- Nodder SD, Northcote LC. 2001. Episodic particulate fluxes at southern temperate mid-latitudes (42–45°S) in the subtropical front region, east of New Zealand. Deep-Sea Research I. 48:833–864.
- Nodder SD, Pilditch CA, Probert PK, Hall JA. 2003. Variability in benthic biomass and activity beneath the subtropical front, Chatham Rise, SW Pacific Ocean. Deep-Sea Research I. 50(8):959–985.
- Norris RM. 1964. Sediments of Chatham Rise. Memoir of the New Zealand Oceanographic Institute No. 24; Bulletin of the Department of Science and Industrial Research No. 159. New Zealand Government Printer: 39p.
- Norris RM. 1978. Late Cenozoic geology of the West Coast shelf between Karamea and the Waiho River, South Island, New Zealand. Department of Scientific and Industrial Research, New Zealand Oceanographic Institute Memoir 81. 28p.
- Northcote LC, Neil HL. 2005. Seasonal variations in foraminiferal flux in the Southern Ocean, Campbell Plateau, New Zealand. Marine Micropaleontology. 56(3):122–137.
- Orpin A, Carter L, Goh A, Mackay E, Pallentin A, Verdier A-L, Chiswell S, Sutton P. 2008. New Zealand’s diverse seafloor sediments. NIWA Chart. Miscellaneous Series No. 86.
- Orpin AR. 2004. Holocene sediment deposition on the Poverty-slope margin by the muddy Waipaoa River, East Coast New Zealand. Marine Geology. 209(1–4):69–90.
- Orpin AR, Alexander C, Carter L, Kuehl S, Walsh JP. 2006. Temporal and spatial complexity in post-glacial sedimentation on the tectonically active, Poverty Bay continental margin of New Zealand. Continental Shelf Research. 26:2205–2224.
- Osterberg EC. 2006. Late Quaternary (marine isotope stages 6-1) seismic sequence stratigraphic evolution of the Otago continental shelf, New Zealand. Marine Geology. 229(3):159–178. http://doi.org/10.1016/j.margeo.2006.03.005.
- Pantin HM. 1966. Sedimentation in Hawke Bay. Bulletin: New Zealand Department Scientific and Industrial Research 171, pp. 70.
- Pantin HM. 1972. Internal structure in marine shelf, slope, and abyssal sediments east of New Zealand. New Zealand Oceanographic Institute Memoir. 60. New Zealand Department of Scientific and Industrial Research Bulletin. 208:1–56.
- Pantin HM, Gibb JG. 1968. Mahia coastal sediments chart (1:200,000). Wellington, New Zealand: New Zealand Oceanographic Institute (now NIWA), Department of Scientific and Industrial Research.
- Pickrill RA. 1987. Circulation and sedimentation of suspended particulate matter in New Zealand fjords. Marine Geology. 74(1–2):21–39.
- Pillans B, Wright I. 1992. Late Quaternary tephrostratigraphy from the southern Havre Trough - Bay of Plenty, Northeast New Zealand. New Zealand Journal of Geology and Geophysics. 35(2):129–143. doi:10.1080/00288306.1992.9514507.
- Pouderoux H, Lamarche G, Proust JN. 2012. Building an 18,000 year long paleo-earthquake record from detailed deep-sea turbidite characterisation in Poverty Bay, New Zealand. Natural Hazards Earth Systems Science. 12:2077–2101. doi:10.5194/nhess-12-2077-2012.
- Pouderoux H, Proust J-N, Lamarche G, Orpin A, Neil H. 2012. Postglacial (after 18 ka) deep-sea sedimentation along the Hikurangi subduction margin (New Zealand): characterisation and timing and origin of turbidites. Marine Geology. 295–298:51–76.
- Proust JN, Lamarche G, Migeon S, Neil HL. 2006. MD152 – MATACORE Voyage, RV Marion Dufresne. Tectonic and climatic controls on sediment budgets. Unpublished voyage report.
- Radford J. 2012. Shelf to canyon sedimentation on the South Westland continental margin, Westland, New Zealand [MSc Thesis]. University of Canterbury.
- Ramillien G, Wright IC. 2000. Predicted seafloor topography of the New Zealand region: A nonlinear least squares inversion of satellite altimetry data. Journal of Geophysical Research: Solid Earth. 105(B7):16577–16590.
- Rawson MD, Berann HC, Heezen BC, Ryan WBF, Sotiropoulos A, Tharp M. 1978. Ocean floor sediment and polymetallic nodules. Lamont-Doherty Geological Observatory of Columbia University.
- Rintoul SR, Sokolov S, Williams MJM, Peña Molino B, Rosenberg M, Bindoff NL. 2014. Antarctic circumpolar current transport and barotropic transition at Macquarie Ridge. Geophysical Research Letters. 41, doi:10.1002/2014GL061880.
- Robertson DA, Roberts PE, Wilson JB. 1978. Mesopelagic faunal transition across the subtropical convergence east of New Zealand. New Zealand Journal of Marine and Freshwater Research. 12(4):295–312.
- Ryan MT, Dunbar GB, Vandergoes MJ, Neil HL, Hannah MJ, Newnham RM, Bostock H, Alloway BV. 2012. Vegetation and climate in Southern Hemisphere mid-latitudes since 210ka: new insights from marine and terrestrial pollen records from New Zealand. Quaternary Science Reviews. 48:80–98.
- Schuur CL, Coffin MF, Frohlich C, Massell CG, Kamer GD, Ramsay D, Caress D. 1998. Sedimentary regimes at the Macquarie Ridge complex: interaction of Southern Ocean circulation and plate boundary bathymetry. Paleoceanography. 13:646–670.
- Shane P, Sikes EL, Guilderson TP. 2006. Tephra beds in deep-sea cores off northern New Zealand: implication for the history of the Taupo Volcanic Zone, Mayor Island and White Island volcanoes. Journal of Volcanology and Geothermal Research. 154:276–290.
- Sokolov S, Rintoul S, Wienecke B. 2006. Tracking the Polar Front south of New Zealand using penguin dive data. Deep-Sea Research I. 53:591–607.
- Stephens D, Diesing M. 2014. A comparison of supervised classification methods for the predication of substrate type using multibeam acoustic and legacy grainsize data. PLoS ONE. 9(4):e93950. doi:10.1371/journal.pone.0093950.
- Stevens CL, O’Callaghan JM, Chiswell SM, Hadfield M. Submitted. The physical oceanography of New Zealand’s shelf seas – a review. Submitted to New Zealand Journal of Marine and Freshwater Research.
- Stewart RB, Neall VE. 1984. Chronology of palaeoclimatic change at the end of the last glaciation. Nature. 311:47–48.
- Stickley CE, Carter L, McCave N, Weaver PPE. 2001. Lower circumpolar deep water flow through the SW Pacific Gateway for the last 190 ky; evidence from Antarctic diatoms. In: Seidov D, Haupt B, Maslin M, editor(s). The oceans and rapid climate change. Vol. 126. Washington (DC): American Geophysical Monographs; p. 101–116.
- Stoffers P, Plüger W, Walter P. 1984. Geochemistry and mineralogy of continental margin sediments from Westland, New Zealand. New Zealand Journal of Geology and Geophysics. 27(3):351–365.
- Strachan LJ, Bostock HC, Barnes PM, Neil HL, Gosling M. 2016. Non-cohesive silt turbidity current flow processes; insights from proximal sandy-silt and silty sand turbidites, Fiordland, New Zealand. Sedimentary Geology. 342:118–132.
- Sturm A. 2003. Changes in Ocean circulation and carbonate chemistry in the Australian sector of the Southern Ocean during the last 500,000 years [Unpublished PhD dissertation]. Kiel: Christian-Albrechts Universität.
- Summerhayes CP. 1967. Marine environments of economic mineral deposition around New Zealand: A review. New Zealand Journal of Marine and Freshwater Research. 1:267–282. doi:10.1080/00288330.1967.9515204.
- Summerhayes CP. 1969. Marine geology of the New Zealand subantarctic sea floor. Memoir of the New Zealand Oceanographic Institute No. 50; Bulletin of the Department of Science and Industrial Research No. 190. New Zealand Government Printer: 92p.
- Sutherland R, Barnes P, Uruski C. 2006. Miocene-recent deformation, surface elevation, and volcanic intrusion of the overriding plate during subduction initiation, offshore southern Fiordland, Puysegur margin, southwest New Zealand. New Zealand Journal of Geology and Geophysics. 49(1):131–149.
- Tracey DM, Rowden AA, Mackay KA, Compton T. 2011. Habitat-forming cold-water corals show affinity for seamounts in the New Zealand region. Marine Ecology Progress Series. 430:1–22. doi:10.3354/meps09164.
- Udden JA. 1914. Mechanical composition of clastic sediments. Bulletin of the Geological Society of America. 25:655–744.
- Van der Linden WJM. 1968. Textural, chemical and mineralogical analyses of marine sediments. Miscellaneous Publication, NZ Oceanographic Institute. 39:37.
- Waghorn KA, Pecher I, Strachan LJ, Crutchley G, Bialas J, Coffin R, Davy B, Koch S, Kroeger KF, Papenberg C, Sarkar S. 2018. Paleo-fluid expulsion and contouritic drift formation on the Chatham Rise, New Zealand. Basin Research. 30(1):5–19.
- Wentworth CK. 1922. A scale of grade and class terms for clastic sediments. Journal of Geology. 30:377–392.
- Whitworth T III, Warren BA, Nowlin WD Jr, Rutz SB, Pillsbury RD, Moore MI. 1999. On the deep western-boundary current in the Southwest Pacific Basin. Progress in Oceanography. 43:1–54.
- Wood R, Davy B. 1994. The Hikurangi Plateau. Marine Geology. 118(1–2):153–173.
- Wood RA, Andrews PB, Herzer RH. 1989. Cretaceous and Cenozoic geology of the Chatham Rise region, South Island, New Zealand. New Zealand Geological Survey Basin Studies 3. Lower Hutt, New Zealand, New Zealand Geological Survey (now GNS Science). 2: 75p.
- Wright IC. 1990. Late Quaternary faulting of the offshore Whakatane Graben, Taupo volcanic zone, New Zealand. New Zealand Journal of Geology and Geophysics. 33(2):245–256. doi:10.1080/00288306.1990.10425682.
- Wright IC, Graham IJ, Chang SW, Choi H, Lee SR. 2005. Occurrence and physical setting of ferromanganese nodules beneath the Deep Western Boundary Current, Southwest Pacific Ocean. New Zealand Journal of Geology and Geophysics. 48(1):27–41. doi:10.1080/00288306.2005.9515096.
- Wysoczanski RJ, Clark M. 2012. Southern Kermadec Arc – Havre Trough geohabitats and biological communities. In: Harris P, Baker E, editor(s). Seafloor geomorphology as benthic habitat: GeoHab Atlas of seafloor geomorphic features and benthic habitat. Amsterdam: Elsevier; p. 853–867.
- Wysoczanski RJ, Todd E, Wright IC, Leybourne MI, Hergt JM, Adam C, Mackay K. 2010. Backarc rifting, constructional volcanism and possible nascent spreading in the southern Havre Trough backarc rifts (SW Pacific). Journal of Volcanology and Geothermal Research. 190:39–57.