
 ?Mathematical formulae have been encoded as MathML and are displayed in this HTML version using MathJax in order to improve their display. Uncheck the box to turn MathJax off. This feature requires Javascript. Click on a formula to zoom.
ABSTRACT
Double Benioff Zones (DBZ) are ubiquitous in subduction systems worldwide, but the stress systems that give rise to them are not well known. We characterise stress orientations in the upper and lower bands of a DBZ in the dipping subducted Pacific plate beneath the southern Hikurangi margin, New Zealand. Stress orientations were calculated from focal mechanisms with 10 or more polarity picks, using a Bayesian stress inversion technique. The stress orientations in the upper band of seismicity are consistent with a down-dip extensional stress regime, whereas stress orientations within the lower band of seismicity are consistent with a down-dip compressional stress regime. This demonstrates that bending stresses are dominant within the Pacific plate beneath the southern North Island, possibly due to subduction beneath thickened mantle lithosphere of the Australian plate.
Introduction
Benioff zones are the most direct evidence for the existence of subducting slabs. The nature and distribution of seismicity within Benioff zones provide constraints on the rheology and stresses in a subducting slab, enhancing our understanding of deformation, strain partitioning, and the generation of megathrust subduction earthquakes. Hasegawa et al. (Citation1978) were first to characterize two distinct bands of seismicity within a Benioff zone, referred to as a Double Benioff Zone (DBZ), located in northeastern region of Honshu, Japan. DBZs are ubiquitous within subduction zone systems worldwide (Brudzinski et al. Citation2007). The upper band of seismicity has been interpreted as the faulting of dehydrated and/or metamorphosed upper oceanic crust, whereas the lower band is thought to be faulting in dehydrating lower oceanic crust and/or upper mantle (i.e. serpentinized peridotite and antigorite) (Kirby et al. Citation1996; Peacock Citation2001; Yamasaki and Seno Citation2003; Zhang et al. Citation2004; Brudzinski et al. Citation2007).
The stresses acting within the subducting plate that result in a DBZ are not well understood. Some DBZ studies show down-dip extension (DDE) in the upper and down-dip compression in the lower band (Engdahl and Scholz Citation1977; Hasegawa et al. Citation1978; Kawakatsu Citation1985; Kao and Chen Citation1994; Brudzinski et al. Citation2007). In contrast, other researchers observed DDE in both the upper and lower bands of seismicity within various DBZs (Abers Citation1992; Ratchkovsky et al. Citation1997; Slancová et al. Citation2000; Christova and Scholz Citation2003; Rietbrock and Waldhauser Citation2004; and Brudzinski and Chen Citation2005).
New Zealand provides a favourable opportunity to investigate DBZs because deep seismicity can be studied from land-based seismic arrays. This study takes advantage of a dense land-based temporary and permanent deployment, in order to characterise the stresses present within the southern Hikurangi DBZ using clusters of earthquake focal mechanisms.
Southern Hikurangi Margin
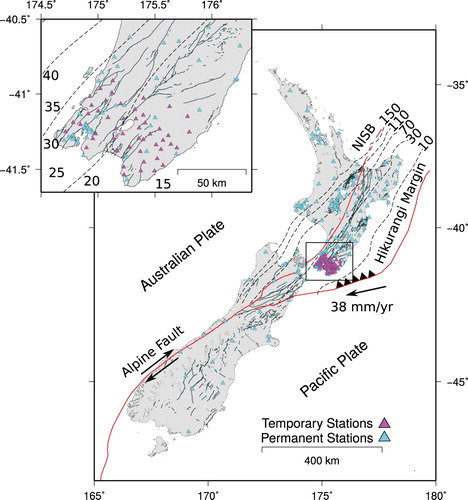
In the central New Zealand region, the Australian and Pacific plates converge at 38 mm/yr (; Beavan and Haines Citation2001; Beavan et al. Citation2002). Convergence results in the westward oblique subduction of the Pacific plate under the Australian plate. Langridge et al. (Citation2005) calculated that 60–90% of margin-parallel motion is accommodated by faults in the Australian plate, while Wallace et al. (Citation2009) proposed that most of the margin-perpendicular motion is accommodated by episodic slip (100s to 1000s of years) on the subduction thrust. The rate of subduction along the length of North Island is not uniform (Walcott Citation1984; Reyners Citation1998; Wallace et al. Citation2004, Citation2009, Citation2012). Contemporary geodetic measurements show a slip deficit of 20–30 mm/yr along the plate interface beneath the southern North Island (Wallace et al. Citation2004). The slip deficit region is thought to represent where the overriding Australian plate and the subducting Pacific plate are ‘partially locked’ or ‘coupled’ at the plate interface. Darby and Beavan (Citation2001) calculated the depth of the maximum-coupled zone to be between 15 and 24 km, using about 7 years of campaign GPS data. Lamb and Smith (Citation2013) using cGPS (up to 2009) data calculated a similar maximum coupling depth at 25 km.
Figure 1. Tectonic overview, permanent (cyan), and temporary (magenta) seismic station locations used to relocate earthquakes. Red lines indicate plate/major tectonic boundaries, including North Island Seismic Belt (NISB) (Coffin et al., Citation1998). Grey lines show active faults (https://data.gns.cri.nz/af/). Dashed lines show depth (km) of subduction plate interface (Williams et al., Citation2013). Black arrow shows relative plate motion between the Australian and Pacific Plates (DeMets et al., Citation1994). Inset: zoomed view of southern North Island, New Zealand, showing density of seismic stations in study area.
Previous studies
Relocated earthquakes from Eberhart-Phillips and Reyners (Citation1997) and Du et al. (Citation2004) highlighted the existence of a DBZ at the southern end of the Hikurangi margin. The DBZ is also weakly visible in seismicity cross-sections in later papers (e.g. F-F’ of Reyners et al., Citation2011; Figure 9a of Eberhart-Phillips and Bannister, Citation2010 and Figure 11a of Eberhart-Phillips et al., Citation2014). The discreteness of the two bands of seismicity varies along the strike of the subduction margin. In the northern South Island the bands are clearly distinguishable, while in the southern North Island, the two bands coalesce, becoming harder to discern (see in Du et al. Citation2004). McGinty et al. (Citation2000), using 48 focal mechanisms from the upper band of seismicity, and 12 focal mechanisms from the lower band, deduced stress orientations consistent with DDE throughout the northern South Island and southern North Island.
Reyners et al. (1997) interpreted the absence of low-angle thrust faulting on the plate interface below the southern North Island to indicate a strong coupling between the Pacific and Australian plate on the plate interface. Reyners et al. (1998) expanded on the previous work by relating the thickness of the seismically active subducted slab to the degree of coupling. Townend et al. (2012), as part of a New Zealand-wide study of focal mechanisms and stress orientations, observed a stress regime indicative of a mix between extensional and shear forces, with down-dip tension in the four stress inversions below the southern North Island.
Evanzia et al. (Citation2017) calculated stress orientations in the southern North Island, using earthquakes detected between November 2009 and March 2010 at up to 69 seismic stations and with hypocentral depths less than 50 km. They only examined earthquakes in the upper part of the subducting Pacific Plate. The current study expands on that work by examining earthquakes detected from September 2009 to May 2010 at up to 149 seismic stations, for hypocentral depths between 25 and 200 km. This makes it possible to examine stress orientations throughout the entire subducting Pacific plate below the southern North Island down to a depth of about 200 km.
Seismic data
Seismic data were recorded on the permanent New Zealand-wide GeoNet array (up to 171 stations) and the temporary SAHKE I array (48 short-period and 2 broadband stations) that was deployed from November 2009 to March 2010 (; Seward et al. Citation2010). During a nine-month period (September 2009 to May 2010) GeoNet detected 678 earthquakes (M2+ to M5+) in the subducted Pacific plate with hypocentral depths between 25 and 200 km.
Methods
Earthquake relocations
P- and S-wave phase arrivals and first motion polarities were manually picked and located using the Seisan Earthquake Analysis Software (SEISAN) package (Figure S1; Havskov and Ottemoller Citation1999). Initial hypocentre locations were calculated using HYPOCENTRE (Lienert et al. Citation1986; Lienert and Havskov Citation1995) and a southern North Island 1D velocity model (Henrys et al. Citation2013). Final hypocentre locations were determined using NonLinLoc (Lomax et al. Citation2000), a non-linear location package, and a New Zealand-wide 3D velocity model (Eberhart-Phillips et al. Citation2010).
Bayesian Focal Mechanism and Stress Inversion
Focal mechanisms are calculated using a Bayesian approach (Walsh et al. Citation2009). The Walsh et al. (Citation2009) Bayesian method treats all hypocentre locations as probabilistic, allowing for errors in hypocentre locations, and consequently focal mechanism uncertainties, to be propagated into the final stress inversion.
The stress inversion of focal mechanism data is done using the Bayesian method outlined in Arnold and Townend (Citation2007). This method performs a stress inversion calculation on predetermined clusters of earthquake data, returning the maximum (S1), intermediate (S2), and minimum (S3) compressive stress orientations as posterior density functions (PDFs). The maximum horizontal compressive stress orientation (azSHmax) is calculated using the Lund and Townend (Citation2007) method.
Focal mechanism clustering
Four clusters of earthquakes using focal mechanisms calculated with 10 or more polarity picks were classified based upon location within the subducting plate. We define a convenient reference plane, referred to as the neutral plane (NP), which effectively separates upper and lower bands of seismicity. This way we consider: earthquakes located in the upper half of the seismogenic zone (i.e. plate interface to the NP); and earthquakes within the lower half (i.e. NP to bottom of seismogenic zone) of the seismogenic zone (). The seismicity in each band is split into two individual clusters, based on the initiation of reverse faulting at ∼130 km depth (see ). We use the plate interface determined by Williams et al. (Citation2013) from a regional analysis of seismicity. The bottom of the seismogenic zone was identified visually, based on earthquake density, after the final relocation of the earthquakes.
Figure 2. Map view and cross-sections of relocated earthquakes within the subducting Pacific plate, colored by depth, using a 3D (Eberhart-Phillips et al., Citation2010) velocity model and NonLinLoc (Lomax et al., Citation2000). As discussed in the text, only earthquakes with original GeoNet locations between 25 and 200 km are included. Dashed lines indicate plate interface depth (km) between the Australian and Pacific plates. Grey lines show active faults (https://data.gns.cri.nz/af/). Cross-section projected onto X to X′ line. In cross section dashed lines show the plate interface (Williams et al., Citation2013), the NP and the bottom of the seismogenic zone.
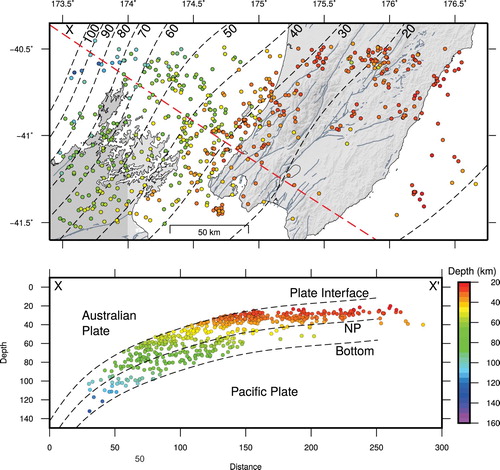
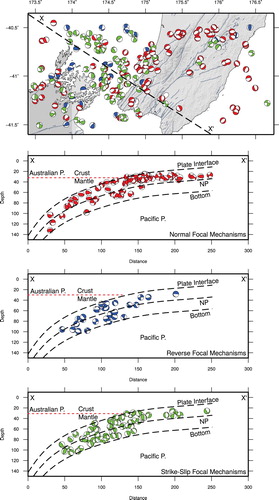
Figure 3. Map view of focal mechanisms solutions with 10 or more polarity picks, derived using the Walsh et al. (Citation2009) Bayesian method. Two hundred and one focal mechanisms (Normal: 104, Reverse: 30, Strike-slip: 67) coloured by style: Normal (30° < rake (R) < 150°) (red); Reverse (−30° < R < −150°) (blue); Strike-slip (−30° < R < 30° and −150° < R < 150°) (green). Cross-sections projected onto X to X′ line, as in previous figures, viewing focal mechanisms from the side.
Results
Final earthquake locations
Six hundred and seveny-five earthquakes were initially located with HYPOCENTRE (Lienert et al. Citation1986; Lienert and Havskov Citation1995) with an average RMS of less than 1 second. After relocating these earthquakes with NonLinLoc, the mean standard deviation for earthquake hypocentres is 1.80 km in an E-W direction, 0.42 km in a N–S direction, and 1.48 km in the vertical direction. Six hundred and fifty-nine of our 675 earthquakes (98%) were determined to be within the subducted Pacific plate, based on the Williams et al. (Citation2013) plate interface (). The DBZ is similar to that defined by McGinty et al. (Citation2000) and Du et al. (Citation2004), with apparent merging of the upper and lower bands of seismicity, possibly due to the difficulty of constraining earthquake depths without seismic stations in the NW and directly above the DBZ ().
Focal mechanism and stress inversion solutions
Earthquakes within the subducted plate (659 events) are used as inputs for the Walsh et al. (Citation2009) Bayesian focal mechanism method; 201 focal mechanisms were calculated using 10 or more polarity picks, based on standard rake convention, defining 104 normal, 30 reverse, and 67 strike-slip focal mechanisms (). This mix of focal mechanisms (normal > strike-slip > reverse) is comparable to that found by Evanzia et al. (Citation2017), who examined earthquakes recorded between November 2009 to March 2010 from depths of 50 km and shallower. Most of the normal faulting is limited to the upper band of seismicity (). There is relatively little reverse faulting in the upper or lower band until the plate interface is at a depth of about 35km (). Strike-slip faulting is diffuse throughout the upper band, however, it is limited in the shallower reaches of the lower band of seismicity (). Reyners and Eberhart-Phillips (Citation2009) attributed the lack of seismicity in shallower reaches of the lower band to the presence of fluids. At plate interface depths greater than about 35 km there are more equal proportions of modes of faulting within the subducting plate. Henrys et al. (Citation2013) used seismic refraction and reflection data to show that in detail the dip of the subducting slab increases from about 5° to 15° at a plate interface depth of about 30 km, which is not observable in the Williams et al. (Citation2013) plate interface model because the final model had smoothing applied. At ∼40 km depth, the subducting plate is juxtaposed with the crust–mantle boundary (Moho) in the Australian plate (Reyners and Eberhart-Phillips Citation2009; Henrys et al. Citation2013). The diverse focal mechanisms at plate interface depths greater than about 35 km indicate a shift in the stress regime within the subducting plate.
Upper band stress orientations within the subducted plate were calculated from 49 focal mechanisms in the down-dip portion, and 100 focal mechanisms in the up-dip portion. Lower band stress orientations were based on 43 focal mechanisms in the down-dip portion, and 11 focal mechanisms in the up-dip portion ( and S4). For these focal mechanisms, the average standard deviation of the azimuth of strike, dip and rake ranged between 5° and 38°, with an overall average of 29°. Focal mechanism solutions, including polarity picks, and probability density functions of the P- and T-axes (ordered by number of polarity picks) can be found in the supplementary material Figures S2 and S3 and Tables S1–S8.
Figure 4. Clusters of focal mechanisms with at least 10 polarity picks used as inputs into the Bayesian stress inversion method from Arnold and Townend (Citation2007). Red-dashed line indicates approximate of the Moho in the Australian Plate (Henrys et al., Citation2013). Down-dip upper cluster (49 focal mechanisms) shown by cyan circles, up-dip upper cluster (100 focal mechanisms) shown by green circles, down-dip lower cluster shown by magenta circles (43 focal mechanisms) and up-dip lower cluster shown by orange circles (11 focal mechanisms), mapped on X to X′ cross-section from previous figures. Stereonets of maximum principle stress (S1, red), intermediate principle stress (S2, green), and minimum principle stress (S3, blue), shown as the contours of the 90th percentile of a posterior probability density functions (PDFs). The best-fitting maximum horizontal stress (SHmax) is shown as a dashed line. Black arrows indicate plate convergence direction. Purple arrows indicate slab dip.
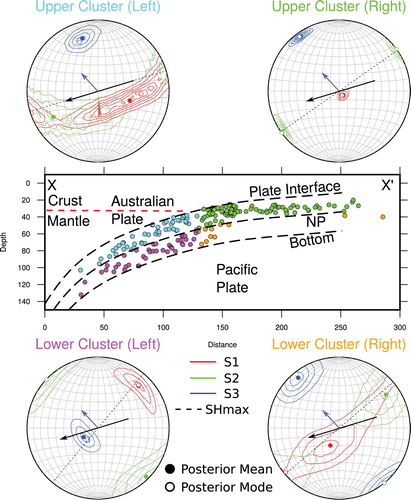
The stress inversion for the down-dip upper band cluster (cyan) yields a vertical S1 and near horizontal S2 and S3, with an azSHmax of ∼073° (). The variability in orientation of S1 and S2 indicates a mix of extensional and strike-slip regimes. S3 is rotated slightly more towards an N–S direction, but is still sub-parallel to the down-dip slab direction. The stress inversion for the up-dip upper band cluster (green) yields a vertical S1 and horizontal S2 and S3, indicating an extensional stress regime (), with an azSHmax of ∼055°. The inversion of the down-dip lower band cluster (magenta) yields a vertical S3 and a horizontal S1 and S2, denoting a compressional stress regime (), with an azSHmax of ∼040°. The inversion of the up-dip lower band cluster (orange) yields a vertical and horizontal mixing of S1 and S2, while S3 is horizontal, indicating an extensional stress regime (), with an azSHmax of ∼050°.
As a test of the robustness of our stress orientations, we generated four other clusters based upon position within the plate, but regardless of polarity pick numbers: (1) a down-dip upper band cluster (170 focal mechanisms), (2) an up-dip upper band cluster (246 focal mechanisms), (3) a down-dip lower band cluster (132 focal mechanism), and (4) an up-dip lower band cluster (93 focal mechanism). Stress inversion results for these clusters show similar results to those based on the best quality focal mechanisms and can be found in supplemental material (Figures S4 and S5). The consistency of all these results indicates that the observed stress orientations are an authentic feature of the DBZ and not an artefact of clustering criteria.
Discussion
Upper band stress orientations
Here, as in previous studies (McGinty et al. Citation2000; Evanzia et al. Citation2017), the stress orientations in the up-dip upper band are indicative of an extensional stress regime with down-dip tension; where S1 is near vertical and S3 is oriented sub-parallel to the direction of the dip (). The down-dip upper band is indicative of extensional and shear stress regime with down-dip tension (). The rotation of S1 and S2 between the up- and down-dip upper clusters indicates a rotation in the stresses acting on the subducting plate. The rotation of S1 and S2 is co-located with the transition from coupled to free slipping on the plate interface (Wallace et al. Citation2004) and where the plate interface intersects the crust-mantle boundary of the Australian plate (Henrys et al., Citation2013). Bending and slab pull forces would both manifest as down-dip tension in the upper band of seismicity, as such it is impossible to distinguish between bending and slab-pull forces without incorporating analysis of the lower band of seismicity.
Lower band stress orientations
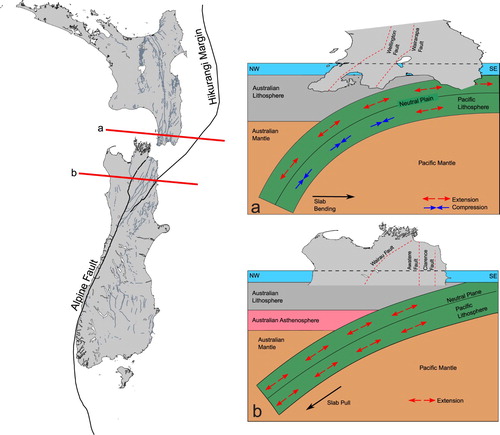
The down-dip tension observed from the up-dip cluster of the lower band seismicity in this study (, lower right) is similar to the down-dip tension observed by McGinty et al. (Citation2000) for their lower band of seismicity. The compressional stress regime calculated from the down-dip cluster of lower band seismicity in this study (, lower left) differs from that calculated by McGinty et al. (Citation2000), who found the lower band of seismicity exhibited a down-dip extensional regime, throughout the southern North and northern South Islands ((b)).
Figure 5. Map with cartoon (not to scale) cross-sections showing the distribution of extensional and compressive stress regimes within the subducting Pacific beneath the southern North Island and beneath the northern South Island, New Zealand. (Left) Red lines indicate cross-section locations. Grey lines give the location of the active faults (https://data.gns.cri.nz/af/) (a): above the neutral plane NP extension is pervasive, whereas below the NP, compression dominates. The stress state within the subducting slab is the result of apparent rollback of Pacific plate (black arrow). (b): Above and below the NP extension is dominant (McGinty et al., Citation2000). The stress state within the subducting slab is the result of slab pull (black arrow). In (a) and (b), red-dashed lines approximate the active faults in the left diagram. Black lines indicate plate/major tectonic boundaries (Coffin et al., Citation1998). Black dashed lines shows cross-section locations.
The differences between observations of this study and McGinty et al. (Citation2000) suggest that the 12 focal mechanisms in McGinty et al. (Citation2000) were insufficient to observe the changes in the stress regime within and along strike of the subduction margin. Such variations in stress regime within the lower band of a DBZ are not unique to the southern Hikurangi margin (e.g. Nazca and Aleutian segments in Table S1 of Brudzinski et al. Citation2007). However, unlike the studies referenced in Brudzinski et al. (Citation2007), the lower band compressional regime in the subducted Pacific plate indicates shortening oblique to the slab dip direction ( and S4). This is likely to be due to stresses as a consequence of oblique subduction of the Pacific plate at the southern Hikurangi margin superposed on those due to bending (e.g. Buffett and Becker Citation2012).
Stress orientation discrepancies
In a global context, subducted slabs that show variation in stress orientations in the lower band of seismicity also have a relatively low subduction dip angle (e.g. Nazca, Aleutian in ; Brudzinski et al. Citation2007). The rate of change of the subduction dip (i.e. curvature) in the southern North Island is greater compared to most of the northern South Island (Figures S6 and S7). Extension in the upper band and compression in the lower band is indicative of bending forces (Buffett and Becker Citation2012).
Table 1. Features of DBZ. Adapted from Brudzinski et al. (Citation2007) Supplemental Figure 1 describing features of DBZ studies for different locations on the same subduction system.
Bending moment (M) is defined as follows (Watts Citation2001), where (E) is Young's modulus, (H) is elastic plate thickness, (ν) is Poisson's ratio, and (R) is the radius of curvature:Based on a Young's modulus (E) of 2 × 10¹¹ N/m2 (Cohen and Darby Citation2003), elastic plate thickness (H) of 4.5 × 10⁴ m, Poisson's ratio (ν) of 0.235 (Eberhart-Phillips et al. Citation2005), and the radius of curvature (R) of 1.49 × 10⁵ m (southern North Island) and 2.25 × 10⁵ m (northern South Island) a bending moment (M) was calculated of −1.079 × 10¹⁹ N/m2 for the southern North Island and −7.415 × 10¹⁸ N/m2 for the northern South Island (Figures S6 and S7). The greater bending moment in the southern North Island, compared to northern South Island, provides support for the conclusion that bending stresses are present, as shown by the stress inversions. Assuming McGinty et al. (Citation2000) accurately characterised the stress orientations in their area of interest (Figure S6), overall slab-pull forces are dominant within the subducting Pacific plate at the southern Hikurangi Margin. Given both the subduction dip variations and the co-located bending stresses observed in this study, it is likely McGinty et al. (Citation2000) had insufficient focal mechanisms to differentiate between areas where bending and slab-pull stresses are dominant.
The key observation is that the DBZ, with its separation into upper and lower bands of contrasting stress patterns, is confined to the Hikurangi margin beneath the southern North Island. We suggest that subduction in southern North Island beneath the 150 km thick lithosphere of the overriding Australian plate, with the absence of an asthenospheric wedge (Stern et al. 2006, Dimech et al. Citation2017), may have promoted stronger bending deeper in the subduction zone by forcing the Pacific Plate more strongly downwards with a smaller radius of curvature. This way, stresses from bending are the dominant stress regime at depth, whereas, in the shallower region of the subduction zone slab pull dominates the stress regime.
Conclusions
The upper band of seismicity within the southern Hikurangi DBZ exhibits a stress regime indicative of DDE, while the lower band shows predominantly a compressional stress regime ( and ). Previously, McGinty et al. (Citation2000), showed DDE in both the upper and lower bands of the DBZ at the southern Hikurangi margin. Several other studies have shown that stresses in a DBZ can vary along a subduction zone margin (Brudzinski et al. Citation2007). We interpret the deeper stress regime found in this study as a result of the slab bending, whereas the shallower stress regime is the result of slab pull on the subducting Pacific plate ( and ). The bending stresses we observe may result from the interaction between the subducting Pacific plate and the overlying thickened Australian lithosphere. Based on the observations of this study and the slab dip geometry (Williams et al., Citation2013), north of the study there should be even greater bending forces. Globally, the magnitude of deformation within subducting plates by bending stress is dependent on the initial dip of the subducting plate and the rate at which the dip angle increases. As subduction dip characteristics are unique to subduction systems globally and can vary within individual subduction zones themselves, the stress regimes controlling DBZ faulting are likely equally variable.
Supp Fig7 Radius Curv mks
Download EPS Image (5.4 MB)Supp Fig6 CompareStudies
Download PDF (231.6 KB)Supp Fig 5 4 Clusters Stress Inversions All FocMech
Download PDF (161.9 KB)Supp Fig4 Clusters Map View
Download PDF (1.1 MB)Supp Fig3d DBSUB pt 169-229 new
Download PDF (445.8 KB)Supp Fig3c DBSUB pt 113-168 new
Download PDF (360.5 KB)Supp Fig3b DBSUB pt 57-112 new
Download PDF (364.3 KB)Supp Fig3a DBSUB pt 01-56 new
Download PDF (291.2 KB)Supp Fig2d DBSUB polarity 169-229 new
Download PDF (725.8 KB)Supp Fig2c DBSUB polarity 113-168 new
Download PDF (780.4 KB)Supp Fig2b DBSUB polarity 57-112 new
Download PDF (848 KB)Supp Fig2a DBSUB polarity 01-56 new
Download PDF (1.1 MB)Supp Fig1 waveform example
Download PDF (294.1 KB)Supporting Information for “Illumination of Deformation by Bending Stresses and Slab Pull within the Southern Hikurangi Double Benioff Zone”
Download MS Word (38.6 KB)Acknowledgments
The SAHKE experiments were possible because of the collaborative efforts of GNS Science, Victoria University of Wellington, University of Tokyo, Japan (Earthquake Research Institute), the University of Southern California, and the Ministry of Economic Development, Crown Minerals. Thank you to EQC for support and GeoNet for use of the seismic data. We wouldd like to thank Richard Arnold, John Townend, David Walsh, and Bjorn Lund for use of their codes. We would also like to thank two anonymous reviewers for their comments and suggestions.
Disclosure statement
No potential conflict of interest was reported by the authors.
ORCID
Dominic Evanzia http://orcid.org/0000-0003-3302-8491
Simon Lamb http://orcid.org/0000-0002-1275-6724
Martha K. Savage http://orcid.org/0000-0002-2080-0676
Tim Stern http://orcid.org/0000-0002-2986-3278
Additional information
Funding
Related Research Data
References
- Abers GA. 1992. Relationship between shallow-and intermediate-depth seismicity in the Eastern Aleutian Subduction Zone. Geophysical Research Letters. 19(20):2019–2022. doi: 10.1029/92GL02060
- Arnold R, Townend J. 2007. A Bayesian approach to estimating tectonic stress from seismological data. Geophysical Journal International. 170(3):1336–1356. doi: 10.1111/j.1365-246X.2007.03485.x
- Beavan J, Haines J. 2001. Contemporary horizontal velocity and strain rate fields of the Pacific-Australian plate boundary zone through New Zealand. Journal of Geophysical Research: Solid Earth. 106(B1):741–770. doi: 10.1029/2000JB900302
- Beavan J, Tregoning P, Bevis M, Kato T, Meertens C. 2002. Motion and rigidity of the pacific plate and implications for plate boundary deformation. Journal of Geophysical Research: Solid Earth. 107(B10):2261. doi:10.1029/2001JB000282.
- Brudzinski MR, Chen W-P. 2005. Earthquakes and strain in subhorizontal slabs. Journal of Geophysical Research: Solid Earth. 110:B08303: doi:10.1029/2004JB003470.
- Brudzinski MR, Thurber CH, Hacker BR, Engdahl ER. 2007. Global prevalence of Double Benioff Zones. Science. 316(5830):1472–1474. doi: 10.1126/science.1139204
- Buffett B, Becker T. 2012. Bending stress and dissipation in subducted lithosphere. Journal of Geophysical Research: Solid Earth. 117:B05413. doi:10.1029/2012JB009205.
- Christova C, Scholz CH. 2003. Stresses in the Vanuatu subducting slab: a test of two hypotheses. Geophysical Research Letters. 30(15):1790. doi:10.1029/2003GL017701.
- Coffin M, Gahagan L, Lawver L. 1998. Present-day plate boundary digital data compilation, University of Texas Institute for geophysics technical report, 174 (5).
- Cohen SC, Darby DJ. 2003. Tectonic plate coupling and elastic thickness derived from the inversion of a steady state viscoelastic model using geodetic data: application to southern North Island, New Zealand. Journal of Geophysical Research: Solid Earth. 108(B3):2164. doi:10.1029/2001JB001687.
- Darby D, Beavan J. 2001. Evidence from GPS measurements for contemporary interplate coupling on the southern hikurangi subduction thrust and for partitioning of strain in the upper plate. Journal of Geophysical Research: Solid Earth. 106(B12):30881–30891. doi: 10.1029/2000JB000023
- DeMets C, Gordon RG, Argus DF, Stein S. 1994. Effect of recent revisions to the geomagnetic reversal time scale on estimates of current plate motions. Geophysical Research Letters. 21(20):2191–2194. doi: 10.1029/94GL02118
- Dimech JL, Stern T, Lamb S. 2017. Mantle earthquakes, crustal structure, and gravitational instability beneath western North Island, New Zealand. Geology. 45(2):155–158. doi: 10.1130/G38476.1
- Du W-x, Thurber CH, Reyners M, Eberhart-Phillips D, Zhang H. 2004. New constraints on seismicity in the Wellington region of New Zealand from relocated earthquake hypocentres. Geophysical Journal International. 158(3):1088–1102. doi: 10.1111/j.1365-246X.2004.02366.x
- Eberhart-Phillips D, Bannister S. 2010. 3-D imaging of Marlborough, New Zealand, subducted plate and strike-slip fault sytsems. Geophysical Journal International. 182:73–96.
- Eberhart-Phillips D, Bannister S, Ellis S. 2014. Imaging P and S attenuation in the termination region of the Hikurangi subduction zone, New Zealand. Geophysical Journal International. doi:10.1093/gji/ggu151.
- Eberhart-Phillips D, Reyners M. 1997. Continental subduction and three-dimensional crustal structure: The northern South Island, New Zealand. Journal of Geophysical Research: Solid Earth. 102(B6):11843–11861. doi: 10.1029/96JB03555
- Eberhart-Phillips D, Reyners M, Bannister S, Chadwick M, Ellis S. 2010. Establishing a versatile 3-D seismic velocity model for New Zealand. Seismological Research Letters. 81(6):992–1000. doi: 10.1785/gssrl.81.6.992
- Eberhart-Phillips D, Reyners M, Chadwick M, Chiu J-M. 2005. Crustal heterogeneity and subduction processes: 3-D Vp, Vp/Vs and Q in the southern North Island, New Zealand. Geophysical Journal International. 162(1):270–288. doi: 10.1111/j.1365-246X.2005.02530.x
- Engdahl E, Scholz C. 1977. A double Benioff zone beneath the central Aleutians: An unbending of the lithosphere. Geophysical Research Letters. 4(10):473–476. doi: 10.1029/GL004i010p00473
- Evanzia D, Wilson T, Savage MK, Lamb S, Hirschberg H. 2017. Stress orientations in a locked subduction zone at the southern Hikurangi margin, New Zealand. Journal of Geophysical Research: Solid Earth. 122(10):7895–7911.
- Hasegawa A, Umino N, Takagi A. 1978. Double-planed deep seismic zone and upper-mantle structure in the northeastern Japan Arc. Geophysical Journal International. 54(2):281–296. doi: 10.1111/j.1365-246X.1978.tb04260.x
- Havskov J, Ottemoller L. 1999. SEISAN earthquake analysis software. Seismological Research Letters. 70(5):532–534. doi: 10.1785/gssrl.70.5.532
- Henrys S, Wech A, Sutherland R, Stern T, Savage M, Sato H, Mochizuki K, Iwasaki T, Okaya D, Seward A, et al. 2013. SAHKE geophysical transect reveals crustal and subduction zone structure at the southern Hikurangi margin, New Zealand, geochemistry, geophysics. Geosystems. 14(7):2063–2083.
- Kao H, Chen W-P. 1994. The double seismic zone in Kuril-Kamchatka: the tale of two overlapping single zones. Journal of Geophysical Research: Solid Earth. 99(B4):6913–6930. doi: 10.1029/93JB03409
- Kawakatsu H. 1985. Double seismic zone in Tonga. Nature. 316(6023):53–55. doi: 10.1038/316053a0
- Kirby S, Engdahl RE, Denlinger R. 1996. Intermediate-depth intraslab earthquakes and arc volcanism as physical expressions of crustal and uppermost mantle metamorphism in subducting slabs. Subduction Top to Bottom. 96:195–214.
- Lamb S, Smith E. 2013. The nature of the plate interface and driving force of interseismic deformation in the New Zealand plate-boundary zone, revealed by the continuous GPS velocity field. Journal of Geophysical Research: Solid Earth. 118(6):3160–3189.
- Langridge R, Van Dissen R, Cochran U, Litchfield N, Berryman K, Begg J, Villamor P, Heron D, Nicol A, Townsend D. 2005 Active faulting and paleoearthquakes in the Wairarapa and Wellington regions, in Proceedings volume: The 1855 Wairarapa Fault Symposium: Te papa tongarewa museum of New Zealand, p. 49–65.
- Lienert BR, Havskov J. 1995. A computer program for locating earthquakes both locally and globally. Seismological Research Letters. 66(5):26–36. doi: 10.1785/gssrl.66.5.26
- Lienert BR, Berg E, Frazer LN. 1986. HYPOCENTER: An earthquake location method using centered, scaled, and adaptively damped least squares. Bulletin of the Seismological Society of America. 76(3):771–783.
- Lomax A, Virieux J, Volant P, Berge-Thierry C. 2000. Probabilistic earthquake location in 3D and layered models. In: Advances in seismic event location. Dordrecht: Springer; p. 101–134.
- Lund B, Townend J. 2007. Calculating horizontal stress orientations with full or partial knowledge of the tectonic stress tensor. Geophysical Journal International. 170(3):1328–1335. doi: 10.1111/j.1365-246X.2007.03468.x
- McGinty P, Reyners M, Robinson R. 2000. Stress directions in the shallow part of the Hikurangi subduction zone, New Zealand, from the inversion of earthquake first motions. Geophysical Journal International. 142(2):339–350. doi: 10.1046/j.1365-246x.2000.00155.x
- Peacock SM. 2001. Are the lower planes of double seismic zones caused by serpentine dehydration in subducting oceanic mantle? Geology. 29(4):299–302. doi: 10.1130/0091-7613(2001)029<0299:ATLPOD>2.0.CO;2
- Ratchkovsky NA, Pujol J, Biswas NN. 1997. Relocation of earthquakes in the cook inlet area, south central Alaska, using the joint hypocenter determination method. Bulletin of the Seismological Society of America. 87(3):620–636.
- Reyners M. 1998. Plate coupling and the hazard of large subduction thrust earthquakes at the Hikurangi subduction zone, New Zealand. New Zealand Journal of Geology and Geophysics. 41(4):343–354. doi: 10.1080/00288306.1998.9514815
- Reyners M, Eberhart-Phillips D. 2009. Small earthquakes provide insight into plate coupling and fluid distribution in the Hikurangi subduction zone, New Zealand. Earth and Planetary Science Letters. 282(1):299–305. doi: 10.1016/j.epsl.2009.03.034
- Reyners M, Eberhart-Phillips D, Bannister S. 2011. Tracking repeated subduction of the Hikurangi plateau beneath New Zealand. Earth and Planetary Science Letters. 311:165–171. doi: 10.1016/j.epsl.2011.09.011
- Rietbrock A, Waldhauser F. 2004. A narrowly spaced double-seismic zone in the subducting Nazca plate. Geophysical Research Letters. 31:L10608. doi:10.1029/2004GL019610.
- Seward A, Henrys S, Henderson M, Sutherland R, Stern T, Savage M, Mochizuki K, Sato H, Iwasaki T, Kennedy C, et al. (2010), Seismic array HiKurangi experiment (SAHKE); field acquisition report, GNS Science Report 2010, 48, 62p.
- Slancová A, Špicák A, Hanuš V, Vanek J. 2000. How the state of stress varies in the Wadati–Benioff zone: indications from focal mechanisms in the Wadati–Benioff zone beneath Sumatra and Java. Geophysical Journal International. 143(3):909–930. doi: 10.1046/j.0956-540X.2000.01304.x
- Walcott R. 1984. The kinematics of the plate boundary zone through New Zealand: a comparison of short-and long-term deformations. Geophysical Journal International. 79(2):613–633. doi: 10.1111/j.1365-246X.1984.tb02244.x
- Wallace L, Barnes P, Beavan J, Van Dissen R, Litchfield N, Mountjoy J, Langridge R, Lamarche G, Pondard N. 2012. The kinematics of a transition from subduction to strike-slip: An example from the central New Zealand plate boundary. Journal of Geophysical Research. 117:B02405. doi:10.1029/2011JB008640.
- Wallace LM, Beavan J, McCaffrey R, Darby D. 2004. Subduction zone coupling and tectonic block rotations in the North Island, New Zealand. Journal of Geophysical Research: Solid Earth. 109:B12406. doi:10.1029/2004JB003241.
- Wallace LM, Reyners M, Cochran U, Bannister S, Barnes PM, Berryman K, Downes G, Eberhart-Phillips D, Fagereng A, Ellis S, et al. 2009. Characterizing the seismogenic zone of a major plate boundary subduction thrust: Hikurangi margin, New Zealand. Geochemistry, Geophysics, Geosystems. 10:Q10006. doi:10.1029/2009GC002610.
- Walsh D, Arnold R, Townend J. 2009. A Bayesian approach to determining and parameterizing earthquake focal mechanisms. Geophysical Journal International. 176(1):235–255. doi: 10.1111/j.1365-246X.2008.03979.x
- Watts AB. 2001. Isostasy and flexure of the lithosphere. Cambridge: Cambridge University Press.
- Williams CA, Eberhart-Phillips D, Bannister S, Barker DH, Henrys S, Reyners M, Sutherland R. 2013. Revised interface geometry for the Hikurangi subduction zone, New Zealand. Seismological Research Letters. 84(6):1066–1073. doi: 10.1785/0220130035
- Yamasaki T, Seno T. 2003. Double seismic zone and dehydration embrittlement of the subducting slab. Journal of Geophysical Research: Solid Earth. 108(B4):2212. doi:10.1029/2002JB001918.
- Zhang H, Thurber CH, Shelly D, Ide S, Beroza GC, Hasegawa A. 2004. High resolution subducting-slab structure beneath northern Honshu, Japan, revealed by double difference tomography. Geology. 32(4):361–364. doi: 10.1130/G20261.2