
ABSTRACT
Issues regarding water quality and supply have been raised within the Pourewa catchment, following ongoing landuse change and associated demand for freshwater. Nitrogen loss from farms due to leaching of nitrate into the subsurface has increased in conjunction with landuse intensification. The stream dissects Whanganui Basin fill, including alternating coarse and fine-grained sediments deposited throughout Quaternary climatic cycles, resulting in interbedded aquifers and aquitards in a geologically young landscape. The Rangitikei River dominates the landscape, forming a series of aggradational terraces. Fault lines and basement highs provide a control on both the underlying Plio-Pleistocene strata and modern-day drainage network. A 1:25 000 hydrogeological map and corresponding structural interpretation are presented. Analysis of catchment lithologies demonstrates the importance of grain size, porosity and age in dictating hydraulic conductivity. Organic carbon, illite and glauconite present within the succession indicate attenuation of nitrate within the local groundwater system is taking place.
Introduction
Agriculture constitutes 90% of landuse in the Rangitikei District (Zarour Citation2008), placing pressure on fresh water resources required for ongoing agricultural development and production. Recent concerns around the availability and long-term sustainability of freshwater resources have initiated research into the districts groundwater systems (Roygard and Carlyon Citation2004; Begg et al. Citation2005; McArthur et al. Citation2007; Wilson Citation2007; Collins et al. Citation2017). Limited knowledge and information is currently available on local-scale hydrogeological settings within the Rangitikei District. A sound understanding of local hydrogeology is necessary for improved mapping and quantification of the districts groundwater resources. Furthermore, information on local hydrogeological settings is essential for improving our understanding and ability to map and quantify water and nutrient flow pathways and attenuation from farmlands to receiving waters, informing practices and policies for targeted and effective water quality management. Previous studies have taken a broad approach examining classification, allocation, management and vulnerability of groundwater resources (Roygard and Carlyon Citation2004; McCarron and Zarour Citation2005; McArthur et al. Citation2007; Wilson Citation2007; Zarour Citation2008; Callander and Thomas Citation2013; Morgenstern et al. Citation2015; Singh et al. Citation2017). There is a present knowledge gap concerning the hydrogeochemical characteristics of the various rock types within the Rangitikei District. This study addresses that knowledge gap in a single sub-catchment of the Rangitikei.
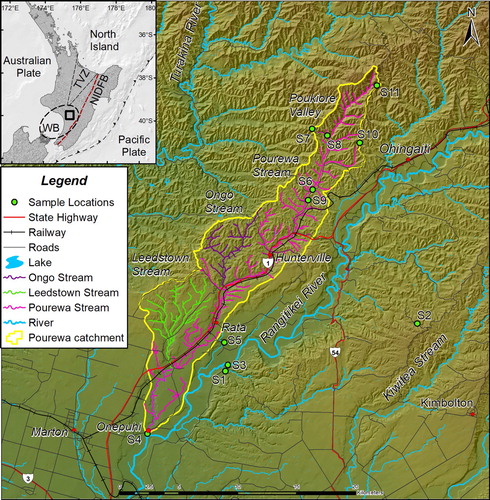
Our approach centres on geological mapping and developing a conceptual understanding of basin history and landscape evolution. This forms the rationale behind our sampling design and targeted hydrogeochemical analysis of representative catchment lithologies. Although the Pourewa catchment is the focus of this study, we consider a wider perspective is required to both effectively explore and document catchment development through time and understand how regional geology and structure influence the local groundwater system. For these reasons, the geological mapping boundary covers a 1,600-km2 portion of the central Rangitikei District centred around the Pourewa Stream (). A particularly important factor considered whilst setting the field area was the need to capture and explore the adjacent Rangitikei River, a feature that has played a significant role during landscape evolution.
Figure 1. Location map of the study area displaying the outline of the Pourewa Stream catchment in yellow and relevant place names along its length. Sample locations: S1–Waitapu Shell Conglomerate, S2-Rewa Pumice, S3-Rangitikei River gravel, S4-Pourewa Stream gravel, S5-Potaka Pumice, S6-Mangamako Shellbed, S7-Mangarere Siltstone, S8-Te Rimu Sandstone, S9-Mangamako Sandstone, S10-Hautawa Shellbed, S11-Mangaweka Mudstone. Inset displays location of the study area within Whanganui Basin (WB) and its location relative to the Taupo Volcanic Zone (TVZ), North Island Dextral Fault Belt (NIDFB) and the Australian–Pacific plate interface.
This paper presents data from a range of analyses, providing information on the ability of local lithologies to store and transmit water. We relate organic carbon together with structural and exchangeable ferrous iron (Fe2+) to environments of deposition, providing evidence for the subsurface reduction of nitrate within the Pourewa catchment. Evolution of the landscape is tied to eastward migration of the Rangitikei River, tectonics and climatically controlled, Late Quaternary aggradation. The occurrence of freshwater springs are related to geological structure, paleo-channels within the Late Quaternary valley fill and basin architecture, providing evidence for confined aquifers within the study area.
The Pourewa Stream is a c. 35 km long tributary of the Rangitikei River, located in the central Rangitikei District, Lower North Island, New Zealand (). The stream drains a 170-km2 catchment that begins in steep hill country northeast of Hunterville forming a shallow gradient stream channel before meandering out onto the Rangitikei terrace country at Rata. The stream then continues in a SE direction adjacent to the Rangitikei River before eventually cutting down through the underlying Plio-Pleistocene sediments to its confluence at Onepuhi ().
Study area
The islands of New Zealand are but the surface expression of a large submerged subcontinent named ‘Zealandia’. This subcontinent sits astride the convergent margin between the Pacific and Australian lithospheric plates (). Tectonic convergence is accommodated by subduction of the Pacific Plate and deformation of the overriding Australian Plate, resulting in active uplift of the North Island (Eberhart-Phillips et al. Citation2008). Uplift is concentrated along the North Island Dextral Fault Belt (NIDFB) trending roughly parallel to the Hikurangi subduction zone. Uplift along the NIDFB has resulted in the formation of the North Island’s main axial ranges, separating the forearc region from the back-arc and volcanic-arc regions. The Whanganui Basin (WB) is situated in the back-arc region behind the plate interface, southwest of the Taupo Volcanic Zone (TVZ) ().
The WB is an approximately 200 × 200 km sedimentary basin located in the south-western North Island of New Zealand (Anderton Citation1981) containing a c. 4.5 km thick Late Miocene-Pleistocene fill. Basin formation is attributed to lithospheric loading in combination with compressional downwarping driven by coupling of the overriding and subducting plates (Stern et al. Citation1992, Citation1993; Tozer Citation2013). Southward migration of the basin depocentre through the Plio-Pleistocene occurred in combination with uplift along the northern and eastern margins, resulting in present day onland exposures of gently dipping marine to marginal marine strata. Well-preserved fossil Mollusca, foraminifera and nannofossils are used to subdivide and date the basin succession and provide important paleo-environmental information (Beu et al. Citation2004; Beu Citation2006). Proximity to the TVZ has resulted in periodic influxes of volcanic products over the last c. 2 Ma (Houghton et al. Citation1995; Briggs et al. Citation2005). These volcanic beds establish isochrons used to date and correlate between basin successions (Naish et al. Citation1996; Pillans et al. Citation2005).
The most complete sequence of river terraces within the WB occurs in the Rangitikei Valley (Te Punga Citation1952; Milne Citation1973b). Te Punga (Citation1952) recognised seven episodes of terrace formation within the Rangitikei, matching heights of terrace treads on either side of the present day river channel and linking these episodes to changes in relative base level. Milne (Citation1973b) mapped the Rangitikei river terraces in detail, subdividing them into aggradational and degradational and recognising nine major terrace sets (). Aggradational terraces are associated with glacial and stadial periods during the Quaternary, predicted as a response to increased sediment yields from deforested highlands during cold periods (Milne Citation1973b; Pillans Citation1994). The correlation between glacial/stadial periods and river aggradation is based on dating of Ohakean terrace alluvium (Milne Citation1973b; Marden and Neall Citation1990; Pillans et al. Citation1993; Pillans et al. Citation1996; Vandergoes et al. Citation2013; Lowe et al. Citation2015) and the occurrence of subalpine pollen assemblages in Marton terrace alluvium south of Levin (Barnett Citation1984; Palmer et al. Citation1988).
Table 1. Major aggradational terraces in Rangitikei Valley. Ages from Milne (Citation1973b), Pillans et al. (Citation1993) and Pillans et al. (Citation1996).
The Rangitikei District is characterised by moderate temperatures without great extremes including warm summers (15–22°C) and mild winters (1–10°C) (Radcliffe Citation1976; Cowie and Rijkse Citation1977; Chappell Citation2015). The climate supports a range of land uses with sheep and beef farming dominating in the Rangitikei River and Pourewa Stream catchments. The threat of drought is present during some summers, particularly towards the coast where it can be drier (Heerdegen and Shepherd Citation1992). Average temperatures range from a high of around 18°C in February to a low of around 9°C in July (Chappell Citation2015). On average rainfall does not show a strong seasonal trend; the catchment receives between 1000 and 1100 mm per year. Evapotranspiration follows a seasonal pattern leading to potential soil moisture deficits in summer, depending on the soil type and its ability to retain water (Cowie and Rijkse Citation1977). Soil moisture deficits occur on average 10–15 days in both January and February and commonly into March and April, with irrigation used to offset the difference (Burgess Citation1988; Hedley and Yule Citation2009). The Rangitikei District is exposed to prevailing west to northwest winds that occur 30–50 percent of the time.
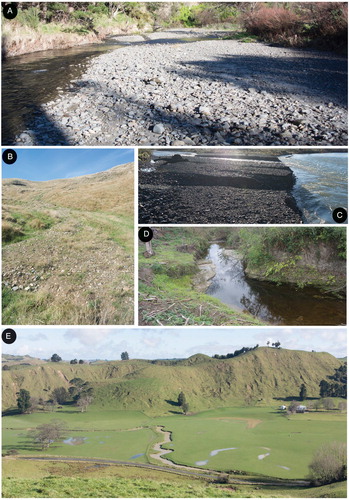
The physiography of the Pourewa Valley has been influenced by the same set of processes and forcing mechanisms as the Rangitikei River valley, with the Rangitikei River itself also playing an influential role during landscape development. The Pourewa Stream differs substantially from the Rangitikei River in that its headwaters are located within the soft Plio-Pleistocene sediments of the WB, in contrast to the considerably harder Torlesse greywacke and volcanic rock comprising the headwaters of the Rangitikei River. The Pourewa stream has a shallow gradient, meandering planform with a sandy mud bed until near Hunterville where large quantities of reworked gravel enter the stream from tributaries draining the Rangitikei River terraces (). The terraces form extensive cropping and grazing land on the eastern interfluve c. 100 m above the bed of the Pourewa Stream. From this point onward, the Pourewa Stream displays a wandering planform (Neill Citation1973; Ferguson and Werritty Citation1983; Fuller Citation2008) similar to the Rangitikei River albeit on a much smaller scale. Flood control works installed from the 1950s onward have played an important role in constraining the lower Rangitikei River and Pourewa Stream, limiting substantial natural avulsion processes evident from geomorphological mapping (Te Punga Citation1952; Fleming Citation1953; Richardson and Fuller Citation2010; Rees et al. Citation2018b).
Figure 2. (A) Wandering channel morphology within the lower reach of the Pourewa Stream (NZGD2000 -40.046606 S, 175.456338 E). (B) Influx of Late Quaternary gravels from uplifted Rangitikei terraces capping hills within the central Pourewa catchment 2 km east of Hunterville (NZGD2000 -39.944884 S, 175.581436 E). (C) Confluence between Pourewa Stream and the Rangitikei River displaying a gravel fan, note this fluvial interface undergoes rapid change (NZGD2000 -40.079352 S, 175.452476 E). (D) Pourewa Stream cutting overtop of ‘basement’ composed of carbonaceous siltstone containing the estuarine dwelling cockle Austrovenus stutchburyi, Okehu Group (c. 1.58 – 0.99 Ma) (NZGD2000 -39.953241 S, 175.563025 E). (E) Typical meandering bed form of the Pourewa Stream within its upper reach, note photograph taken following moderate rain, which has led to surface water pooling within paleo-channels across Poukiore Valley (NZGD2000 -39.886163 S, 175.609932 E).
Major tributaries, Ongo Stream and the informally named Leedstown Stream () drain the western side of the Pourewa catchment providing large contributions to the catchment’s otherwise narrow area. The Pourewa Stream sits high in the landscape, flowing SW across its Late Pleistocene–Holocene valley fill. The stream pattern is unusually linear, running approximately parallel to the more deeply incised Rangitikei River for c. 30 km.
The Manawatu plains in the eastern Whanganui Basin contain a series of NE-SW trending anticlines, including the Pohangina, Feilding, Marton, Mt Stewart-Halcombe, and Oroua anticlines (Feldmeyer et al. Citation1943; Te Punga Citation1952, Citation1957). They are bounded on their eastern side by westward dipping reverse faults that only rarely reach the surface (Melhuish et al. Citation1996; Jackson et al. Citation1998; Begg et al. Citation2005). The anticlines are asymmetric, characterised by gentle western slopes (c. 2°) and steep eastern slopes (up to 70°), a geometry interpreted to reflect the underlying reverse faults (Jackson et al. Citation1998).
Feldmeyer et al. (Citation1943) and Te Punga, (Citation1957) both suggested that these anticlines were formed by ridges of basement rock trending approximately parallel with the main axial range. Structural interpretation of the Whanganui-Manawatu area indicates that these folds are long lived structures that are still actively growing (Jackli, Citation1957; Lensen, Citation1976; Te Punga, Citation1957). Preservation of the 310 ka Brunswick marine terrace tread (Pillans Citation1983, Citation1990, Citation1994) on the anticline crests suggests a majority of the present day topography has formed over the last c. 300 ka.
The Pourewa Stream extends across several different physiographic zones, originating in steep mudstone hill country of the upper Poukiore Valley () to Rata where the stream meanders out over a broad flight of Rangitikei River terraces before finally becoming deeply entrenched as it grades to the Rangitikei River.
Methods
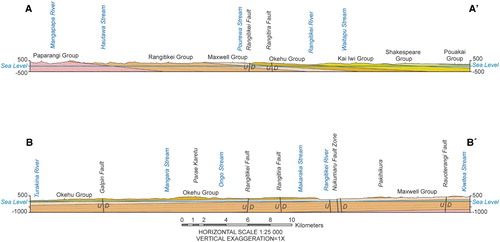
During this study, we compiled a 1:25 000 geological map of the central Rangitikei District, a simplified version of which is displayed in , presenting the main geological groups and important regional structures. This map compilation incorporated studies by Feldmeyer et al. (Citation1943), Te Punga (Citation1952), Fleming (Citation1953), Naish and Kamp (Citation1995), Journeaux et al. (Citation1996), Van Der Neut (Citation1996), Potter (Citation1984) and Bussell (Citation1984). We constructed geological cross sections trending east-west and north-south across the study area to aid with structural interpretation (). Details of the new 1:25 000 geological map and corresponding geological cross sections of the Central Rangitikei District are described in Rees et al. (Citation2018b). This work was the result of an extensive field campaign from 2016 to 2018.
Figure 3. Simplified geological map of the study area showing the location of the Pourewa Stream catchment outlined in black in relation to major regional structures and lithological groups.
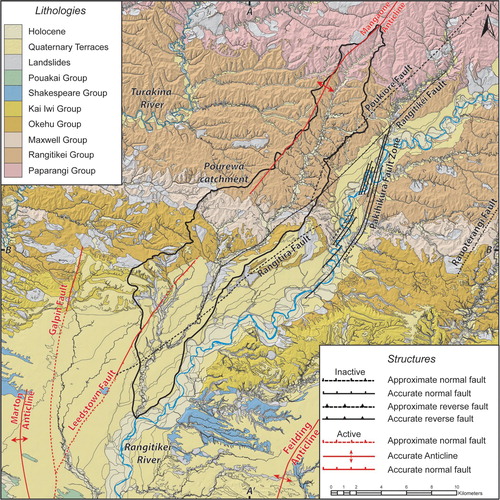
Figure 4. Simplified cross sections A to A’ and B to B’ trending N-S and E-W respectively, displaying the main geological structures of the Rangitikei District. Geological units have been ordered into their respective groups.
During the fieldwork phase of this study, particular focus was placed on observing the movement of water in the landscape and exploring relationships between water flow and the local geology. Springs, seeps and water bearing layers were noted with GPS ( and ) and all available stratigraphic sections logged. Particular lithologies were targeted for sediment sampling and analysis, selected to be representative of key elements within the large suite of sediments encompassed by the mapping area. Samples were taken with a percussion corer to a depth of typically 1–2 m and with stainless steel rings able to be driven into an outcrop by hammer to take smaller 50–150 mm long cores.
Figure 5. (A) Groundwater seeps at the contact between Tuha Sandstone and underlying siltstone of the Tikapu Formation, Rangitikei Group, exposed in cliffs in the Rangitikei River valley (NZGD2000 -39.877205 S, 175.721254 E). (B) Groundwater seeps at a particularly coarse sandstone overtop of a hard well consolidated siltstone forming the ledge in the lower part of the section, Vinegar Hill Formation, Rangitikei Group (NZGD2000 -39.92932 S, 175.642462 E). (C) Groundwater seeps within Mangaonoho Formation, Rangitikei Group at contact with laminated sandstone over massive siltstone (NZGD2000 -39.911645 S, 175.620189 E). (D) Groundwater seeps along the contact between a sandstone and underlying siltstone unit within Rewa Formation, Okehu Group (NZGD2000 -40.008355 S, 175.589676 E).
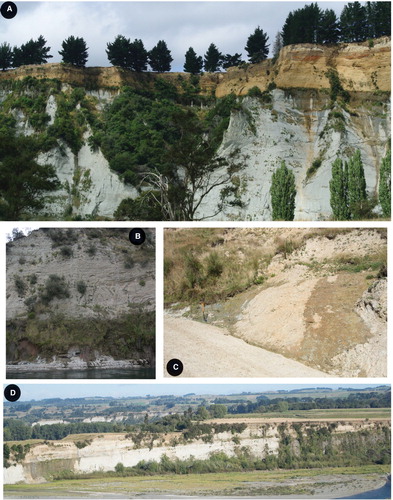
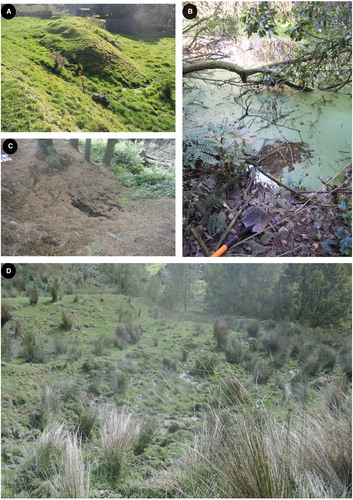
Figure 6. (A) Small spring flowing out of Holocene gravels at the base of Leedstown Valley (NZGD2000 -40.019826 S, 175.471315 E). (B) Large set of springs along contact between Ratan Gravels and underlying siltstone of Waiomio Formation, Kai Iwi Group on the immediate up thrown side of Rangitira Fault (NZGD2000 -40.023638 S, 175.479813 E). (C) Large set of springs emerging mid to top slope beneath the tread of the Greatford Terrace (MIS 5) (NZD2000 -39.989024 S, 175.511184 E). (D) Medium to small spring emerging from coarse pumiceous sediments overlying fine-grained Coutts Creek Horizon, Okehu Group. Note the typical landform of hummocky landslip topography with water logged soil tolerant species such as rushes and tussock prevalent, typical of a spring site (NZGD2000 -39.940442 S, 175.432777 E).
Due to the wide range of sedimentary deposits within the c. 2000 m of WB strata that the Pourewa Stream cuts through and time constraints on field work, it was necessary to adopt a simplified approach to sediment sampling and analysis. We subdivided the lithologies into broad groups based on grain size and petrography, initially selecting a set of representative sandstone, siltstone, shellbed, pumiceous and conglomerate units. Following initial sediment sampling and analysis, other samples from the main categories outlined above were collected in order to measure some of the variability observed in outcrop. Three samples were also taken from a modern day gravel bed of the Pourewa Stream in three locations moving away from the stream, allowing for collection of samples containing low, moderate and high percentage of fines for later comparison. A single sample from a modern day Rangitikei River gravel bed was also sampled for comparison. The goal of the sampling regime was to provide a preliminary overview of the study areas hydrogeological units by outlining their modal characteristics.
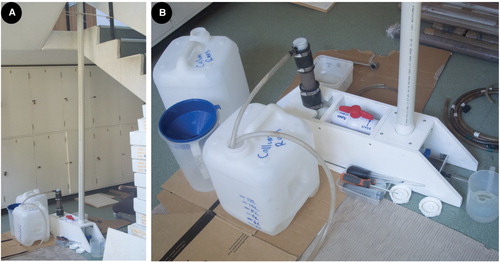
Three 50 × 46 mm sub-samples were taken for triplicate dry bulk density, gravimetric and volumetric water content, total and effective porosity and particle density determinations using methods outlined in Gradwell and Birrell (Citation1979), Claydon (Citation1997) and Rayment and Lyons (Citation2011). Three 150 × 46 mm sub-samples were taken for triplicate measurements of hydraulic conductivity using a falling head permeameter (). The falling head permeameter consisted of a 6 m long standpipe with an inside diameter of 50 mm. The standpipe then enters a series of 90° bends before connecting to a sample chamber consisting of a 150 mm length of core with a 46 mm inside diameter. Filter cloth is placed above and below the sample chamber to stop debris falling into the pipe then clamped into place using a combination of hose clamps and rubber sleeves. Samples were first allowed to saturate and reach a steady state of flow before the test was run. Incremental measurements were made of the head in the stand pipe using a water level sounder over time as the head reduced. The timing of measurements was based on the rate of flow for the particular sample; for example coarse grained units required more frequent minute to hourly measurement intervals whilst siltstone and mudstone units were measured twice daily. Hydraulic conductivities were calculated using Darcy’s equation as outlined in Landon et al. (Citation2001).
Figure 7. (A) Photo of the falling head permeameter setup at Massey University, Palmerston North, consisting of a 6 m standpipe tied to the railing within the stair well. (B) Close up of the base where the standpipe enters two 90-degree bends and a main shut off valve before entering the 150 × 4.6 mm sample housed in piping attached by rubber sleeves and hose clamps. The outlet at the top of the sample is epoxied into a plug allowing the outflow of water to enter the 20L water container. Note a second valve on the far right, positioned low to allow the water to be drained from the system following a run.
Three subsamples of typically 100 g were taken for grain size analysis. Grain size analysis was undertaken by dry sieving the >63 micron fraction using a set of sieves at half phi increments. The <63 micron fraction was determined in solution using a Horiba Partica LA-950V2 laser particle analyser, a refractive index of 1.52 and an absorption value of 0.1 was used for the sample material, based on a mixed mineral assemblage of dominantly marine sediments (Rothwell et al. Citation2006).
Grain mounts were made from the 125–250 μm fraction in each representative lithology and 400 grains were counted to determine the general mineralogy of the sediments. All samples were analysed for major and trace elements by X-ray fluorescence spectroscopy (XRF) at Massey University following procedures and analytical techniques outlined in Kimura and Yamada (Citation1996) and Lee et al. (Citation1997) using a Bruker S8 TIGER with Bruker SPECTRA-plus software. H2O and loss on ignition (LOI) were calculated from the weighed samples.
The general clay mineralogy of samples was determined from suspension-oriented x-ray diffraction (XRD) samples using the sample preparation techniques outlined in Whitton and Churchman (Citation1987). Measurements were made using a GBC Scientific EMMA diffractometer operating at 35 kV and 20 mA, using monochromatic Co Kα radiation and a scanning rate of 2° 2θ/minute, scanning from 5° to 40° 2θ. Triplicate suspensions for each sample were prepared including non-saturated, K saturated and Mg saturated. Following initial XRD runs, Mg saturated samples were sprayed with glycerol and analysed until complete expansion of smectites was achieved, followed by heating to 550°C and repeat analysis. Resulting XRD patterns were compared with the International Centre for Diffraction Data (ICDD) library to aid with identification of clay minerals.
Total carbon, nitrogen, hydrogen and sulfur concentrations were determined using the elementar® (vario MICRO cube) at Massey University. Inorganic carbon was determined by digestion of samples with hydrochloric acid within a vacuum chamber following the methods outlined by Bundy and Bremner (Citation1972) and Tiessen et al. (Citation1983). Inorganic carbon and total carbon determinations were used to calculate organic carbon content of each sample.
Results
Geology
The geology of the Central Rangitikei District has been mapped at 1:25 000, a simplified version of which is presented in with accompanying structural interpretation (). This mapping resulted in the fusion of several formal and informal stratigraphic nomenclatures introduced in the literature over the last 75 years, including work by Feldmeyer et al. (Citation1943), Te Punga (Citation1952), Fleming (Citation1953), Milne (Citation1973b), Seward (Citation1976), Potter (Citation1984), Bussell (Citation1984), Abbott (Citation1992), Naish and Kamp (Citation1995) and Van Der Neut (Citation1996). New regional structures including the Poukiore Fault and a southern extension of the Mangaone Anticline (Feldmeyer et al. Citation1943) have been identified during the field survey. Major regional reverse faults, the Rangitikei and Rauoterangi faults with maximum-recorded throws of 100 and 200 m west respectively (Naish and Kamp Citation1995), drive deformation of the Plio-Pleistocene succession, with associated zones of antithetic, normal faulting (Pakihikura and Poukiore faults). In the south of the mapping area the actively growing Marton and Feilding anticlines are observed, related to faulting at depth (Melhuish et al. Citation1996; Jackson et al. Citation1998; Begg et al. Citation2005).
The distribution of the Pouakai to Paparangi group succession (c. 3–0.3 Ma) is related to the depositional history and stratigraphic architecture of the WB through the Plio-Pleistocene. A general east-west alignment reflects the gentle dip (2–10°) of the succession toward the basin depocentre, located to the south. Quaternary terraces represent climatically controlled aggradational episodes preserved by ongoing regional uplift over the last c. 370 ka (Pillans Citation1994). The terraces fan out in the lower Rangitikei Valley where they dominate the southern portion of the mapping area. Holocene valley fill is restricted to the main valleys where the rivers have incised through the Plio-Pleistocene marine succession.
An important relationship observed in the field is the general increase in level of compaction and cementation with age, reflecting progressively greater depth of burial and level of diagenesis. Mudstones and siltstones typically have a higher level of cohesion and consolidation due to a greater proportion of silt to clay sized particles and tight grain fabric, imbuing them with higher average strength (45–180 KPa) relative to their sandstone counterparts (9–90 KPa) (Ker Citation1973; Thompson Citation1982; Ker Citation1991). For instance, Thompson (Citation1982) reports an average strength determined by point load tests of 156 KPa for Mangaweka Mudstone and conversely 7 to 68 KPa for sandstones of the Rangitikei Group, relating this change to relative levels of consolidation. Conglomerate and gravel units are frequently cemented by iron oxide; typically, these deposits are <1.6 Ma and are dominated by greywacke clasts, with the level of cementation observed to increase with age (Te Punga Citation1952; Fleming Citation1953; Milne Citation1973b). Locally, shell and sandstone beds are cemented by calcite, dramatically increasing their strength (upto 2,857 KPa); however, these deposits form a small proportion of the entire succession (Thompson Citation1982). Hydraulic conductivity gradually decreases with increasing age (Begg et al. Citation2005), reflecting an increase in compaction, consolidation and cementation as a function of diagenesis (Houseknecht Citation1987).
Analyses
Grain size statistics were calculated using the Folk and Ward method (Folk and Ward Citation1957) and compared with the hydraulic conductivity measurements (, ). Increasing hydraulic conductivity is associated with an increase in mean grain size and a reduction in the presence of a fine tail fraction. The samples are typically poorly to very poorly sorted; however, the sample with the highest hydraulic conductivity is moderately well sorted. Overall the hydraulic conductivity measurements range from 5 to 20379 m/day. Coarse grained gravel, shellbed and pumice deposits obtain the highest hydraulic conductivities of between 351 and 20379 m/day, consistent with gravel to granular sediment values documented by Freeze and Cherry (Citation1979), Domenico and Schwartz (Citation1998), Fetter (Citation2001) and New Zealand based studies (White Citation1986; Thorpe Citation1992; Davidson and Wilson Citation2011). Mudstone and siltstone hydraulic conductivities were fairly high at between 5 and 6 m/day, falling between a fine sandstone to silty sandstone range relative to published values (Freeze and Cherry Citation1979; Fetter Citation2001). Sandstone units ranged from 18 to 39 m/day, falling within a typical sandstone range when compared with published datasets (Chapuis et al. Citation1989; Wang et al. Citation2008).
Figure 8. Graphs demonstrating key relationships between grain size statistics and hydraulic conductivity. (A) Percentage fines content vs hydraulic conductivity (m/day, log scale). (B) Mean grain size (μm, log scale) vs hydraulic conductivity (m/day, log scale).
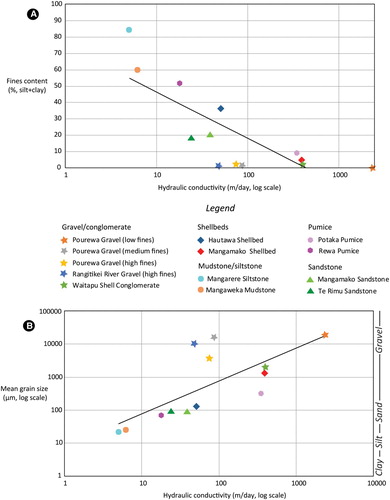
Table 2. Average grain size, hydraulic conductivity (K), bulk density, total porosity and effective porosity measurements from the representative lithologies of the study area, in order of increasing hydraulic conductivity.
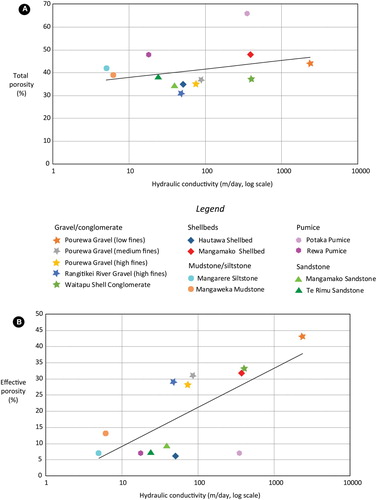
Average bulk densities of the samples range from 1.37 to 1.81 g/cm3 with particularly low values for pumiceous units (). The sedimentary units measured in this study plotted within similar ranges as unconsolidated Holocene (Avnimelech et al. Citation2001; Rose and Kuehl Citation2010) to weakly and moderately lithified Pleistocene sediments (Jakobsson et al. Citation2001; Bahr et al. Citation2005; Lamb et al. Citation2007; O'Regan et al. Citation2008) in the literature. The particle densities of the stratigraphic units were calculated to be around 2.6 to 2.8 g/cm3, apart from the pumiceous rich sediments, which were calculated to be around 2.4 g/cm3. Total porosities ranged from 34% to 66%, with the highest porosities occurring within very pumiceous sediments and coarse shellbed material. Total porosity values obtained in this study are similar to values presented by Halley and Schmoker (Citation1983) and Boving and Grathwohl (Citation2001) for a comparable range of sediments and sedimentary rocks (). Effective porosity values range from 43% to 7% (), comparable to values presented in Dong et al. (Citation2010) and Medina et al. (Citation2011). The siltstone, mudstone and sandstone samples with relatively high total porosity values of 39%–42%, have much lower effective porosity values of 7%–13%, reflecting the presence of small and intermediate sized pores and therefore, low macro-porosity (Dewhurst and Aplin Citation1998).
Figure 9. Graphs displaying the relationships between porosity and hydraulic conductivity. (A) Total porosity (%) vs hydraulic conductivity (m/day, log scale). (B) Effective porosity (%) vs hydraulic conductivity (m/day, log scale).
Clay mineralogy of the sediments is dominated by illite with lesser amounts of glauconite, kandite and minor smectite. Detrital glauconite grains were also observed as a minor constituent in the 125–250 μm fraction of 80% of samples during point counts. The mineralogy determined by point counts was dominated by quartz and highly altered minerals including some chlorite, with lesser amounts of feldspar and minor pyroxene and hornblende. Moderate lithic and opaque grains were also present in several coarse grained samples including Mangamako Shellbed, Te Rimu Sandstone, Rangitikei River gravel and Mangamako Sandstone. Weathered clear rhyolitic glass shards dominated the pumiceous deposits while lithic shell material dominated the shellbeds including minor quantities of foraminifera.
Major element chemistry () determined by XRF displays changes in geochemistry consistent with the measured suites of minerals. Sandstones show an enrichment in silica and relative depletion in aluminum, iron, and magnesium compared with mudstone and siltstone samples, representing a relative dominance of quartz within sandstone units and higher proportion of altered clay minerals within the siltstone and mudstone. The siltstone and mudstone units also have slightly elevated levels of titanium and potassium compared with the sandstone units suggesting an increase relative to quartz of potassium feldspar (orthoclase and microcline) and minerals such as pyroxene and mica where titanium can occur as an accessory or substituted element (Murray Citation2006). Calcium values are highest within the shellbed and shell hash conglomerate units at between 7.4% and 30%, due to the presence of abundant detrital shell material within these samples. Correspondingly, these samples display the highest loss on ignition due to carbonate volatilisation during combustion. Samples containing a strong greywacke and/or volcanic provenance namely the shell hash conglomerate, Holocene gravels and pumiceous units display relatively high sodium at between 3.5% and 4.4%, attributed to higher proportions of plagioclase feldspar and vitric rhyolitic glass shards within their respective mineral assemblages.
Table 3. Major element geochemistry (% weight) of respective samples grouped by lithology. Hu – Huatawa Shellbed; Mm – Mangamako Shellbed; Ma – Mangamako Sandstone; Tr – Te Rimu Sandstone; Mw – Mangaweka Mudstone; Mg – Mangarere Siltstone; P – Rewa Pumice; Rg – Rangitikei Gravel; Pg – Pourewa Gravel.
Carbon (C) determinations show high amounts of inorganic carbon within the shellbed and shell hash conglomerate units, Mangamako Shellbed being the highest outlier at 60.7 g of C per kg (). The majority of other samples display inorganic carbon values >2 g of C per kg. Pumiceous and shellbed sediments also display the highest organic carbon contents of up to 8.6 g per kg. Sandstones contain less organic carbon at 0.5 to 0.6 g per kg, compared to mudstones and siltstones with higher values of 0.9 to 1.6 g per kg.
Table 4. Average organic and inorganic carbon contents and clay minerals identified during analysis of respective lithologies, in order of increasing organic carbon content.
Hydrostratigraphy
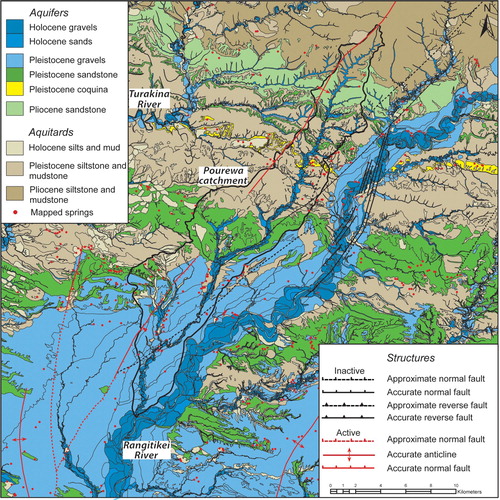
displays a map of potential aquifers in the central Rangitikei District, separating different geological units into hydrostratigraphic groups based on their age and dominant lithology. Aquifer and aquitard units were determined by assigning average hydraulic conductivity, porosity, grain size and bulk density measurements to each geological unit. Given the sampling regime used in this study It was necessary to assign values derived from a units’ dominant lithology. For instance, Tikapu Formation, Rangitikei Group (Naish and Kamp Citation1995) contains shellbed and siltstone members yet was assigned average properties from its dominant lithology siltstone, resulting in an aquitard classification. also plots the springs observed during the fieldwork in the study area. The spring data represents only a small portion of total springs and seeps in the study area. The grouping of sedimentary units into aquifer and aquitard layers is very broad and serves only to show general regional trends as opposed to detailed local scale aquifer spatial patterns.
Figure 10. Simplified hydrostratigraphic map of the study area showing the location of the Pourewa Stream catchment outlined in black in relation to the local geology. Geological units subdivided based on average grain size, hydraulic properties, age and depositional regime into respective hydrostratigraphic units. Major regional structures are also shown alongside mapped spring locations; note the mapped springs only present a small proportion of the total springs in the area, a majority of which are minor seeps and small springs.
Discussion
Landscape evolution
The widespread aggradational terraces of the Rangitikei are prominent features in the present day physiography of the Pourewa Stream catchment ( and ). Exceptionally thick and widespread Ratan terraces (30–50 ka) occur near Rata () where the Pourewa Stream emerges onto the open, lower Rangitikei River valley. These gravels are derived from the paleo-Rangitikei River and pre-50 ka Rangitikei valley fills, filling areas of the Pourewa valley to depths of up to 10 m. The confluence of Leedstown Stream and Pourewa Stream is interpreted to have been subjected to major scouring post 50 ka given the occurrence of particularly thick Ratan gravels overlain by rare dunes formed by wind-blown silt off an aggrading fluvial floodplain during the last glacial maximum (LGM) (Milne Citation1973a; Palmer and Pillans Citation1996). These local areas of fluvial scour and fill are observed in the present study to host important shallow ground water reserves, related to large freshwater springs.
The course of the Rangitikei River has obviously been located much further west of its present position within the structural low of the Pakihikura Fault Zone. A series of progressively younger terrace treads stepping down from the land immediately north of Marton to the present day flood plain of the Rangitikei River suggest the river has tracked eastward over the last 370 ka, likely in response to offset along major NE-SW trending faults and increasing confinement by the growing Marton and Mt Stewart-Halcombe anticlines (). Fifty thousand years ago, it is likely the Pourewa stream was substantially shorter than present day, exiting its valley carved through the Plio-Pleistocene rocks of the WB at Rata into the paleo-Rangitikei River ().
Figure 11. Schematic palinspastic diagram of the lower Pourewa Stream displaying the relatively rapid landscape changes that have occurred over the last 50 ka. Outlines of the modern day Rangitikei River terrace treads are displayed representing the maximum preserved extent of the Rangitikei River for each approximate period of time. These lines indicate the boundary between the terrace tread (age annotated) and the terrace riser of the next (older) terrace. In the case of the Aldworth line, this indicates the maximum preserved extent of the tread before it gives way to hill country. The modern day confluence between the Rangitikei River and Pourewa Stream is indicated by a red star illustrating the amount of eastward migration the Rangitikei River has undergone in the last 50 ka contemporaneous with development of the lower Pourewa Stream. Data sourced from Te Punga (Citation1952), Milne (Citation1973b), Hellstrom (Citation1993), Pillans (Citation1994) and this study.
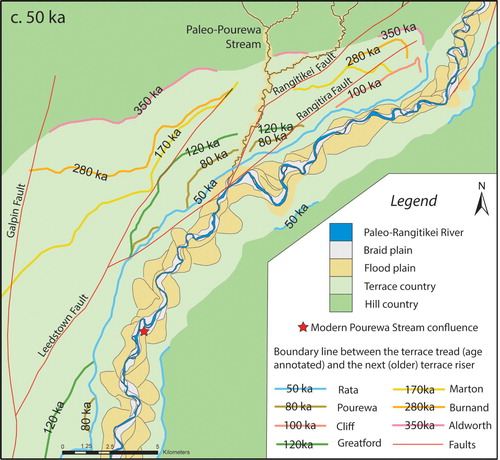
Since 50 ka ongoing uplift manifested as offset along regional faults has led to further eastward migration of the Rangitikei River through the LGM aggradation and multiple Holocene degradation episodes. Contemporaneous fluvial development has resulted in a fault controlled extension of the Pourewa Stream to the SW, extending from Rata parallel to the Rangitira Fault. We infer the Pourewa Stream has preferentially exploited this fault zone as the path of least resistance during its natural inclination of cutting down to meet the Rangitikei River. Another line of thought is that the Rangitikei River itself could have produced the substantial fluvial scouring at the confluence of the modern day Pourewa and Leedstown streams, so that the Pourewa Stream is exploiting a topographic low carved into the Pleistocene marine sediments by a paleo-channel of the Rangitikei River.
The Poukiore Valley () at the headwaters of the Pourewa Stream has been influenced by a broad structure in the underlying Plio-Pleistocene sediments. The Mangaone Anticline () forms the western watershed boundary of the Pourewa Stream, defining a marked change in dip direction within the Plio-Pleistocene sediments. Sediments on the eastern side of the structure dip to the SE while equivalent sediments to the west dip W to SWW into a structural low occupied by the Turakina River. Sediments along the western watershed of the Pourewa Stream typically dip to the SE and as a result springs and seeps outcrop extensively on the southern and eastern slopes of this hill country, some providing domestic drinking water.
Hydrostratigraphic map
The hydrostratigraphic map () displays two key relationships that highlight important factors influencing the hydraulic properties of the areas lithologies. Firstly, the age of the sedimentary units is a controlling factor, determining the amount of diagenesis and resulting cementation and compaction a unit has undergone (Larsen and Chilingar Citation1983; Bjorlykke Citation2014). Holocene fluvial deposits formed over the last c. 11 ka (Holocene gravels and sands on ) represent the least consolidated units in the mapping area with little to no cementation and low compaction, forming the most productive shallow unconfined aquifer within the study area (Begg et al. Citation2005). In contrast, Te Rimu Sandstone (Pliocene sandstone on ), including the basal sandy Mangarere Formation (Naish and Kamp Citation1995) represents a succession of locally cemented coarse to fine siliciclastic sandstone that has undergone diagenesis since deposition c. 2.58–2.8 Ma (Wilson and Roberts Citation1999). Because of a relatively high level of compaction and local cementation, this unit contains substantially lower hydraulic conductivity than contemporary Holocene gravelly sands, illustrated by a change from 24 to 75 m/day respectively ().
The second key relationship observed from is the difference in depositional setting within the hydrostratigraphic units. Clearly, the Late Quaternary and Holocene gravels and sands fill the modern day drainage network of the Rangitikei Valley, formed over the last 370 ka, throughout a series of climatically controlled aggradational and degradational episodes (Milne Citation1973b; Pillans Citation1994). The abundance of greywacke and andesite gravel within these deposits imparts high hydraulic conductivity.
The increasingly common occurrence of greywacke gravel within the Late Quaternary hydrostratigraphic units of the study area reflects substantial changes in the paleogeography and sediment transport pathways of the lower North Island (Te Punga Citation1952; Fleming Citation1953; Beu et al. Citation1981; Melhuish et al. Citation1996; Rees et al. Citation2018a). Notably, the onset of volcanic activity within the Tongairiro Volcanic Centre (c. 350 ka) (Shane et al. Citation2017) providing a new provenance for volcaniclastic sediment, delivered by rivers draining the central volcanic plateau. Simultaneous uplift along the main axial range front (Beanland Citation1995; Jiao et al. Citation2015) has provided a source of abundant greywacke detritus, as the modern day topography formed. Localised uplift along a series of regional anticlines (Te Punga Citation1957) has acted to shape and constrain the emerging fluvial drainage network, funnelling a series of high permeability sediments between bounding basement highs.
In contrast, the linear nature of the Plio-Pleistocene marine sediments exposed along depositional strike, record the paleogeography and depositional setting at their time of formation, characterised by shallow marine deposition within a southward migrating marine depocentre adjacent to the uplifting paleo-axial range (Anderton Citation1981; Rees et al. Citation2018b). A key difference distinguishing this older marine basin fill from the overlying Late Quaternary sediments, is the occurrence of relatively thick (c. 10–60 m) (Abbott Citation1994), massive, blue grey, siltstone units representing high stand deposition within inner to mid shelf depths (Carter and Naish Citation1998). We suggest these units attain enough lateral persistence to act as local confining layers and as such form an important constituent of the hydrostratigraphy.
Physical and hydrogeochemical attributes
The most important factors related to a sample’s hydraulic conductivity were the presence of a fine tail fraction followed closely by mean grain size. This correlation is consistent with known relationships between grain size and hydraulic conductivity determined by experimental evidence (Krumbein Citation1934; Hazen Citation1983; Alyamani and Sen Citation1993; Song et al. Citation2009; Sen Citation2015) and field studies (Fogg et al. Citation1998; Odong Citation2008; Vienken and Dietrich Citation2011). The general reduction of hydraulic conductivity with a corresponding increase in fine content () has been well documented by Schalchli (Citation1992), Benson and Trast (Citation1995) and Boadu (Citation2000). For example, the three gravel samples taken from Pourewa Stream show an increase in hydraulic conductivity from 75 to 20379 m/day, corresponding to a decrease in fines content from high to no fines (). This marked change occurs despite the gravel component (size, shape) being similar within all three samples.
While the mean grain size is important, it does not show a 1:1 relationship with hydraulic conductivity. For instance, the Pourewa Stream gravel samples with moderate to high fine content have a larger mean grain size (3640 to 15924 μm) yet have lower hydraulic conductivity than Potaka Pumice (mean grain size 316 μm) (). This could be attributed to the difference in the amount of fines which act to fill voids between the pore spaces, affecting the hydraulic conductivity (Koltermann and Gorelick Citation1995). Almost all of the samples displayed poor to very poor sorting; however, the sample with the highest hydraulic conductivity (i.e. Pourewa Stream gravels with no fines) was moderately well sorted, demonstrating that sorting is likely another important contributing factor. A wider sampling coverage and increased sampling rate of the sedimentary units within the study area would likely highlight this third key factor.
The siltstone and mudstone units tested in this study exhibited relatively high hydraulic conductivity (5 to 6 m/day) relative to examples from the literature (Freeze and Cherry Citation1979; Dewhurst and Alpin Citation1999; Fetter Citation2001) attaining a closer fit to sandy mudstone and siltstone mixtures documented by Revil and Cathles (Citation1999) and Belcher et al. (Citation2001). This is attributed to a significant component of sand within the mudstone tested, a coarse silt grain size for tested siltstone lithologies and the generally weakly lithified and cemented nature of the WB sediments (Thompson Citation1982; Ker Citation1991; Kamp et al. Citation2004). It is also possible an undetermined amount of bypass flow occurred during permeameter tests, potentially affecting the results and leading to unusually high hydraulic conductivities within the fine-grained sediments measured; however, we consider this error be negligible in our analyses. Methods to combat bypass flow included allowing significant time for the fine sediments to saturate and swell against the sample chamber and the installation of epoxy around the outside of the lower filter cloth covering the bottom of the sample chamber to channel flow toward the centre of the chamber.
Bulk density values typically range between 1.6 and 1.8 g/cm3. Particularly low bulk density values are associated with shellbed and pumiceous units, which correspondingly display the highest total porosity of between 48% and 66%. Generally, total porosity values are high (>30%) and display a weak relationship with hydraulic conductivity indicated by a slight trend of increasing hydraulic conductivity with increasing total porosity (). Units containing high total fines e.g. Mangarere Siltstone exhibit high total porosity (42%), a large portion of which is made up of small to intermediate pores with low interconnected macro-porosity (Stephens et al. Citation1998).
Effective porosity displays a stronger positive correlation with hydraulic conductivity (). However, Potaka Pumice, a granular, pure, pumice with high hydraulic conductivity displays unusually low effective porosity. It has proven difficult to determine the correct effective porosity of highly pumiceous sediment during this study. In the laboratory, pumiceous units demonstrate very high water holding capacity, resulting in low calculated macroporosity and therefore, effective porosity. However, from our field experience, pumiceous sediments and soils are very well drained and prone to drought, rapidly drying in the summer and demonstrating low water holding capacity. The effective porosity values of Potaka Pumice are considered erroneous in this study, due to the difficulties encountered in attaining an accurate, representative measurement in the lab.
Another strange outlier ( B) is Mangaweka Mudstone, displaying a higher effective porosity (13%) than the two sandstone samples; Te Rimu (7%) and Mangamako sandstone (9%). This discrepancy is likely the result of a relatively high sand content within the Mangaweka Mudstone sample, classified as a sandy mudstone during grain size analysis. Potential error within the effective porosity results may also have contributed to this difference. Hautawa Shellbed displays an unusually low effective porosity (6%) considering its relatively high hydraulic conductivity (51 m/day), considered to be a result of the fine-grained matrix including illite, kandite and smectite clays that provide small to intermediate sized pores and result in high water holding capacity.
Pumiceous units displayed lower bulk density, particle density and higher total porosity than any other sediment type analysed in this study. They also contained low inorganic carbon, but relatively high amounts of organic carbon. This is interpreted to reflect the nature of their depositional environment, typically characterised by rapid fluvial aggradation resulting in potential for organic matter preservation (Gastaldo and Demko Citation2010), clearly illustrated by the abundance of lignite, charcoal and logs exposed within the volcaniclastic units of the WB (Te Punga Citation1952; Fleming Citation1953; Shane Citation1991; Rees et al. Citation2018b). Very rich pumiceous units in the WB are the result of episodic ignimbrite emplacement in the central North Island (Shane Citation1991), rapid erosion of the distal unwelded portion of an ignimbrite sheet results in paleo-fluvial systems becoming chocked with volcaniclastic debris (Manville et al. Citation2009a; Manville et al. Citation2009b). Drastically increased sedimentation rates following ignimbrite emplacement (von Lichtan et al. Citation2016) are interpreted to have led to coastal progradation (Lewis Citation2007) and the formation of extensive coastal plain and marginal marine deposits in the WB succession (Te Punga Citation1952; Abbott Citation1994; Shane Citation1994; Pillans et al. Citation2005; Rees et al. Citation2018b). These deposits are often found in close relation with lignite’s, carbonaceous mudstone and stunted Austrovenus stutchburyi shellbeds in the Rangitikei District, representing high rates of sedimentation within marginal marine to coastal plain environments (Te Punga Citation1952; Rees et al. Citation2018b).
The depositional environments of the pumiceous units in the WB imbues them with an inherent lateral variability, which we suggest here to be mirrored by associated variations in hydraulic conductivity of between 18 and 351 m/day. Pockets of high porosity clean pumice such as Potaka Pumice are able to store and transmit significant amounts of water; however, it is extremely difficult to predict their lateral extent from outcrop given rapid facies changes. Groundwater from Maxwell Group sediments in which several volcanic/volcaniclastic units occur together with associated lignite and carbonaceous mudstone are used locally for water supply; however, the water is often stained and considered unpotable (Fleming Citation1953).
The relationship between a fluvial depositional regime and rapid lateral variations in hydraulic conductivity is also relevant to the Late Quaternary terrace and modern floodplain hydrostratigraphic units, which demonstrate a similar variation in hydraulic conductivity including a change of between 48 and 20379 m/day (Pourewa and Rangitikei gravel samples, ). Seams of well-washed gravels are interpreted to occur along both paleo and modern fluvial channels forming pockets of highly permeable sediment with high hydraulic conductivity surrounded by overbank and alluvial flood plain deposits of mixed grain size with considerably lower hydraulic conductivity, despite considerable gravel content.
Water preferentially flows along the channels of modern day rivers largely as a function of gravity and topography (Helton et al. Citation2014; Blume and van Meerveld Citation2015), moving through the landscape eroding, sorting and re-depositing sediment (Kondolf and Piegay Citation2003). As a result, braided to wandering rivers with highly indurated source rock catchments, such as those occurring across the Canterbury Plains and draining the North Island main axial range contain riverbeds lined with highly permeable gravels, allowing streams to retreat into their beds during periods of low flow (McHugh et al. Citation2015). We observe this phenomenon in the gravel bedded streams of the Rangitikei District including the Pourewa Stream, through the summer months.
Denitrification
Nitrogen loss from farms due to rapid leaching of nitrate through the soil profile into the subsurface is an increasingly important environmental issue in rural New Zealand, due to increased use of nitrogen fertiliser and land use intensification (Houlbrooke et al. Citation2004; Parfitt et al. Citation2006). Subsurface denitrification can result in attenuation of nitrate leaching from agricultural lands (Elwan et al. Citation2015; Rivas et al. Citation2015; Collins et al. Citation2017; Rivas et al. Citation2017). Natural attenuation of excess nitrate leached from farmland has flow on effects for aquatic systems, reducing water quality impacts and promoting healthy ecosystem functions (Quinn et al. Citation2009).
The clay mineralogy reported from stratigraphic units in this study are similar to modern day sediments described on the Whanganui shelf (Hume and Nelson Citation1986; Gillespie Citation1992; Gillespie and Nelson Citation1996). Illite imparts natural attenuation within groundwater systems facilitating the adsorption and oxidation/reduction of heavy metal contaminants such as arsenic, cadmium and chromium (Palmer and Puls Citation1994; Wang and Mulligan Citation2006; Longe and Enekwechi Citation2007).
The common occurrence of illite, glauconite and organic matter within the WB sedimentary units and the reworked modern day fluvial deposits of the Pourewa Stream provides evidence for potential electron donors in the subsurface environment (Puckett Citation2004; Cundy et al. Citation2008; Debernardi et al. Citation2008; Rissmann Citation2011). Glauconite and illite contain structural and exchangeable ferrous iron (Fe2+) that can facilitate reduction of nitrate (NO3-) in the subsurface to N2O and then N2 gas during the microbially mediated process of denitrification (Korom Citation1992; Ernstsen Citation1996). Organic carbon within the pumiceous (8 g C per kg) and shellbed (8.6 g C per kg) members of the WB succession could also act as a source of electron donors, supporting the denitrification potential of local aquifers. Even the lower quantities of organic carbon measured within the finer grained siltstones and mudstones (0.8–1.6 g C per kg) could be important if long ground water residence times (years) along flow paths allow sufficient time for redox reactions to occur, leading to reduction of nitrate in the subsurface environment (Seitzinger et al. Citation2006). Organic carbon preserved within the shellbeds of the WB is interpreted here to be a result of bypassing of siliciclastic sediment on the areas of sea floor allowing for stratigraphic condensation and preservation of moderately low amounts of organic matter.
Inherent limitations incorporated due to the sparseness of sampling within a texturally complex marine basin and modern day fluvial basin must be acknowledged in this study. Continued research is underway into the groundwater systems of the Rangitikei District, aiming to develop an understanding of the role rock type plays in nitrogen attenuation in the subsurface. This work involves sampling of a wider array of sediments within the WB through the application of rapid in situ testing and application of the ideas and concepts developed during this work at a wider regional scale.
Springs
Local residents of the Rangitikei District have made observations of changing rates in spring flow corresponding to changes in atmospheric pressure, with a distinct increase in spring flow occurring during incoming low pressure systems, typically preceding a rainstorm event. Some springs we observed show a visibly higher flow rate following a period of heavy rainfall while others appear to flow at the same rate despite heavy rain, maintaining a constant flow through winter and summer. These two sets of observations lead us to believe there is some evidence for confined aquifer springs within the study area. Unconfined aquifer springs typically are not immediately affected by changes in atmospheric pressure due to a delay in transmitting atmospheric pressure through the vadose zone (Rasmussen and Crawford Citation1997; Spane Citation2002); their flow rates are also more likely to be affected by seasonal variations in rainfall due to generally faster recharge times and a higher level of connectivity with surface water (Scanlon et al. Citation2002). Springs being immediately affected by atmospheric pressure and flowing at similar rates through winter and summer provide anecdotal evidence of confined aquifer flow.
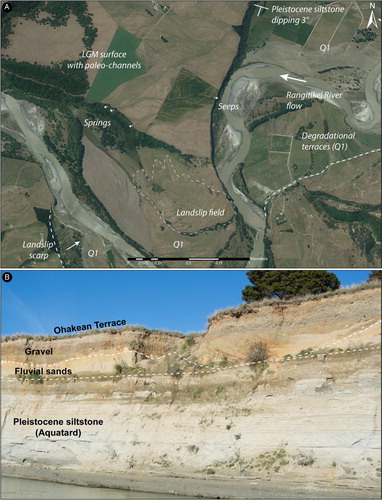
Springs have been related to paleo-channels within the Late Quaternary gravels intercepted by a marine cliff in the Horowhenua District (Kampman and Caldwell Citation1985; Reynolds Citation1992; Cussins Citation1994). Here, we document similar relationships in the Rangitikei District where several springs observed on the Ohakean terraces are related to paleo-channels within the terrace gravels (). These channels are only obvious on the LGM aggradational surfaces and younger degradational terraces, due to a thick blanketing of cover beds which mask the micro-topography of pre LGM aggradation terraces (Milne Citation1973a, Citation1973b). We interpret the channels to be composed of coarse gravels with high hydraulic conductivity effectively funnelling the shallow groundwater, which flows along the path of least resistance in the landscape. Underlying Pleistocene siltstone forms a less permeable base promoting horizontal groundwater flow on the interface between the gravel and siltstone units. Where terrace risers or cliffs cut by modern day streams intercept the paleo-channels, springs emerge at the contact between the gravel and underlying siltstone (). These springs are typically utlised by farmers who dam one end of the receiving tributary creating a pond, which can then be used to supply water to animal toughs; or alternatively dig out the head of the spring and line the hole to create a small reservoir, which can then be piped by gravity to a tank.
Figure 12. A) Aerial photograph of paleo-channels observable as micro-topography on the Last Glacial Maximum surface (LGM) (NZGD2000 -40.006514 S, 175.576372 E). These channels are related to shallow groundwater springs and seeps where interception occurs by the modern day fluvial erosion of the Rangitikei River and its tributaries. Underlying Pleistocene siltstone dipping gently to the SW creates a sloping aquitard surface beneath the more permeable Late Quaternary gravels. B) Example of the undulating surface of erosion beneath an Ohakean Terrace (LGM surface) (NZGD2000 -40.081486 S, 175.466938 E); fine to medium grained fluvial sand is intermixed with gravel within channel cut and fill overlain by further gravels. This photo is included to illustrate some of the variability within Late Quaternary Terraces. Terrace deposits have been observed with incorporated logs and boulders highlighting the inherent danger of overgeneralising these highly variable hydrostratigraphic units.
Conclusion
The Pourewa catchment lies within the WB and its geology is dominated by alternating coarse and fine-grained sedimentary units deposited during cyclic eustatic sea level fluctuations spanning the entire Quaternary Period. Regional fault zones and related basement highs trending approximately NE-SW exert control on the structure of the Plio-Pleistocene sedimentary units and the development of the modern day fluvial system in the Rangitikei and Pourewa catchments.
Climatically controlled Late Quaternary aggradational episodes have played an important role in the formation of the present day physiography of the Pourewa Stream catchment. At c. 50 ka the Pourewa Stream was substantially shorter than at present day, entering the paleo-Rangitikei River near Rata. Since c. 50 ka ongoing uplift manifested as offset along regional fault systems has led to eastward migration of the Rangitikei River. Contemporaneous fluvial development has resulted in a fault controlled extension of the Pourewa Stream before its eventual decent to Onepuhi and confluence with the Rangitikei River.
Hydraulic conductivity of the main representative lithologies appears to be governed primarily by presence of a fine tail fraction, mean grain size, effective porosity, sorting and level of cementation and compaction as a function of diagenesis and age. Rapid lateral facies variations in the Pleistocene succession are interpreted to be reflected by corresponding changes in hydraulic conductivity, porosity and geochemistry.
Clay mineralogy of the sediments is dominated by illite with lesser amounts of glauconite, kandite and minor smectite, similar to modern day sediments on the Whanganui shelf. Geochemical data display changes consistent with the observed mineral assemblages. Organic carbon is highest within pumiceous and shellbed deposits, interpreted to reflect environments of deposition. Common glauconite, illite and moderately low organic carbon are present within the hydrostratigraphic succession facilitating microbially mediated denitrification in the subsurface through provision of electrons. Ongoing research into these subsurface processes aims to capture a wider proportion of the textural variability in the WB, applying the ideas and concepts developed herein at a regional scale.
Some spring flows in the Rangitikei District have been noted to change with season and atmospheric pressure while others remain relatively constant. We interpret this as evidence for confined aquifers within the study area. Several springs observed on LGM terraces are related to paleo-channels on the overlying terrace treads. We suggest paleo-channels contain coarse gravels with high hydraulic conductivity, funnelling the shallow groundwater, which flows along the path of least resistance in the landscape.
Acknowledgments
We thank the residents in the Central Rangitikei District for granting land access. Special thanks to Massey University staff and laboratory technicians including Ian Furkert, Glenys Wallace, Bob Toes, Ross Wallace, David Feek, Dr Roberto Calvelo-Pereira, Dr Qinhua Shen, Dr Anja Mobis, Dr Gabor Kereszturi and Dr Mike Bretherton. This manuscript has been improved tremendously by helpful reviews from Dr Martin Brook and an anonymous referee.
This paper uses the spelling ‘Whanganui’ rather than ‘Wanganui’ as recommended by the New Zealand Geographic Board (Ngā Pou Taunaha o Aotearoa). The spelling of ‘Pourewa’ rather than ‘Porewa’ is used as recommended by Ngāti Hauiti.
Disclosure statement
No potential conflict of interest was reported by the authors.
Additional information
Funding
References
- Abbott ST. 1992. The Mid Pleistocene Waiomio Shellbed New Zealand the Mid Pleistocene Waiomio Shellbed (Castleclif- fian, c . 550-600 ky), Wanganui Basin, New Zealand. Alcheringa: An Australasian Journal of Palaeontology. 16(2):171–180.
- Abbott ST. 1994. Sequence Stratigraphy, Sedimentology and Paleoecology of Pleistocene Cyclothems in the Castlecliff Section, Wanganui Basin, New Zealand. Unpublished PhD thesis, James Cook University of Northern Queensland, Queensland, Australia. 297 p.
- Alyamani MS, Sen Z. 1993. Determination of hydraulic conductivity from grain-size distribution curves. Ground Water. 31(4):551–555.
- Anderton PW. 1981. Structure and evolution of the south wanganui basin, New Zealand. New Zealand Journal of Geology and Geophysics. 24(1):39–63.
- Avnimelech Y, Ritvo G, Meijer LE, Kochba M. 2001. Water content, organic carbon and dry bulk density in flooded sediments. Aquacultural Engineering. 25:25–33.
- Bahr A, Wong HK, Yim W-S, Huang G, Ludmann T, Chan LS, Ridley Thomas WN. 2005. Stratigraphy of Quaternary inner-shelf sediments in Tai O Bay, Hong Kong, based on ground-truthed seismic profiles. Geo-Marine Letters. 25:20–33.
- Barnett R. 1984. Upper quaternary stratigraphy in the Otaki district, Unpublished B.Sc. (Hons) thesis. Unpublished thesis. 112 p.
- Beanland S. 1995. The North Island Dextral Fault Belt, Hikurangi subduction margin, New Zealand. Unpublished PhD thesis, Victoria University, Wellington, New Zealand. 360 p.
- Begg JG, Palmer A, Gyopari M. 2005. Geological synopsis of the Manawatu-Horowhenua area for a review of the region’s hydrogeology. Institue of Geological and Nucelar Sciences Client Report 2005/172. 22 p.
- Belcher WR, Elliott PE, Geldon AL. 2001. Hydraulic-propoerty estimates for use with a transient fround-water flow model of the Death Valley regional ground-water flow system, Nevada and California. US Department of the Interior, US Geological Survery, Water-Resources Investigations Report 01-4120, Nevada, USA: 1-27.
- Benson CH, Trast JM. 1995. Hydraulic conductivity of thirteen compacted clays. Clays and Clay Minerals. 43(6):669–681.
- Beu AG. 2006. Marine Mollusca of oxygen isotope stages of the last 2 million years in New Zealand. Part 2. biostratigraphically useful and new Pliocene to recent bivalves. Journal of the Royal Society of New Zealand. 36(4):151–338.
- Beu AG, Alloway BV, Pillans BJ, Naish TR, Westgate JA. 2004. Marine Mollusca of oxygen isotope stages of the last 2 million years in New Zealand. Part 1: revised generic positions and recognition of warm-water and cool-water migrants. Journal of the Royal Society of New Zealand. 34(2):111–265.
- Beu AG, Browne GH, Grant-Taylor TL. 1981. New chlamys delicatula localities in the central North Island and uplift of the Ruahine range. New Zealand Journal of Geology and Geophysics. 24(1):127–132.
- Bjorlykke K. 2014. Relationships between depositional environments, burial history and rock properties. some principal aspects of diagenetic process in sedimentary basins. Sedimentary Geology. 301:1–14.
- Blume T, van Meerveld HJ. 2015. From hillslope to stream: methods to investigate subsurface connectivity. Wiley Interdisciplinary Reviews: Water. 2(3):177–198.
- Boadu FK. 2000. Hydraulic conductivity of soils from grain-size distribution: new models. Journal of Geotechnical and Geoenvironmental Engineering. 126(8):739–746.
- Boving TB, Grathwohl P. 2001. Tracer diffusion coefficients in sedimentary rocks: correlation to porosity and hydraulic conductivity. Journal of Contaminant Hydrology. 53:85–100.
- Briggs RM, Houghton BF, McWilliams M, Wilson CJN. 2005. 40 ar/ 39 Ar ages of silicic volcanic rocks in the Tauranga Kaimai area, New Zealand: dating the transition between volcanism in the coromandel arc and the Taupo volcanic zone. New Zealand Journal of Geology and Geophysics. 48(3):459–469.
- Bundy LG, Bremner JM. 1972. A simple titrimetric method for determination of inorganic carbon in soils. Soil Science Society of America Journal. 36:273–275.
- Burgess SM. 1988. The climate and weather of Manawatu and Horowhenua. New Zealand Meteorological Serivce Miscellaneous Publications. 115(18):1–47.
- Bussell MR. 1984. Geology and Paleobotany of the Rangitawa Stream area, Southeast Wanganui Basin. Unpublished thesis, Victoria University of Wellington, Wellington, New Zealand. 181 p.
- Callander P, Thomas N. 2013. Report on Horizons Groundwater Level Monitoring Network and Groundwater Quantity Management Issues. Horizons Report 2013/EXT/1319: 1-55.
- Carter RM, Naish TR. 1998. A review of Wanganui basin, New Zealand: global reference section for shallow marine, Plio-Pleistocene (2.5-0 Ma) cyclostratigraphy. Sedimentary Geology. 122(1-4):37–52.
- Chappell PR. 2015. The Climate and Weather of Manawatu-Wanganui. 1-38 p.
- Chapuis RP, Gill DE, Baass K. 1989. Laboratory Permeability Tests on Sand: Influence of Compaction Method on Anisotropy. Canadian Geotechnical Journal. 26(4):614–622.
- Claydon JJ. 1997. Labratory methods for water release and solid/void characterisation of soils. Unpublished Report, Landcare Research, Hamilton, New Zealand: 1-18.
- Collins S, Singh R, Rivas A, Palmers A, Horne D, Manderson A, Roygard J. 2017. Transport and potential attenuation of nitrogen in shallow groundwaters in the lower Rangitikei catchment, New Zealand. Journal of Contaminant Hydrology. 206:55–66.
- Cowie JD, Rijkse VIC. 1977. Soils of Manawatu County, North Island, New Zealand. New Zealand Soil Survey Report 30, New Zealand Soil Bureau, Department of Scientific and Industrial Research, Wellington, New Zealand: 1-33.
- Cundy AB, Hopkinson L, Whitby RLD. 2008. Use of iron-based technologies in contaminated land and groundwater remediation: A review. Science of the Total Environment. 400:42–51.
- Cussins AP. 1994. Hydrology and hydraulic characteristics of the unconfined aquifers of the Otaki-Te Horo area. Unpublished thesis, Unpublished MSc Thesis, Victoria University, Wellington, New Zealand. 136 p.
- Davidson P, Wilson S. 2011. Groundwaters of Marlborough, Marlborough District Council, Marlborough, New Zealand. 302 p.
- Debernardi L, De Luca DA, Lasagna M. 2008. Correlation between nitrate concentration in groundwater and parameters affecting aquifer intrinsic vulnerability. Environmental Geology. 55:539–558.
- Dewhurst DN, Aplin AC. 1998. Compaction-driven evolution of porosity and permeability in natural mudstones: An experimental study. Journal of Geophysical Research: Solid Earth. 103(B1):651–661.
- Dewhurst DN, Alpin AC. 1999. Influence of clay fraction on pore-scale properties and hydraulic conductivity of experimentally compacted mudstones. Journal of Geophysical Research: Solid Earth. 104(B12):29261–29274.
- Domenico PA, Schwartz FW. 1998. Physical and chemical hydrogeology. New York, USA: Wiley and Sons; p. 689–689.
- Dong J-J, Hsu J-Y, Wu W-J, Shimamoto T, Hung J-H, Yeh E-C, Wu Y-H, Sone H. 2010. Stress-dependence of the permeability and porosity of sandstone and shale from TCDP hole-A. International Journal of Rock Mechanics and Mining Sciences. 47:1141–1157.
- Eberhart-Phillips D, Reyners M, Chadwick M, Stuart G. 2008. Three-dimensional attenuation structure of the Hikurangi subduction zone in the central North Island, New Zealand. Geophysical Journal International. 174(1):418–434.
- Elwan A, Singh R, Horne D, Roygard J, Clothier B. 2015. Nitrogen attenuation factor: can it tell a story about the journey of nutrients in different subsurface environments. In: Currie LD, Burkitt LL, editor. Moving farm systems to improved attenuation, Occassional Report No 28, fertilizer and lime research centre. Palmerston North: Massey University; p. 1–12.
- Ernstsen V. 1996. Reduction of nitrate by Fe2+ in clay minerals. Clays and Clay Minerals. 44(5):599–608.
- Feldmeyer AE, Jones BC, Firth CW, Knight J. 1943. The geology of the Palmerston- Wanganui Basin, “West side”, North Island, New Zealand. Unpublished Report of the Superior Oil Company of New Zealand, Petroleum Report Series 171, Ministry of Economic Development, Wellington, New Zealand. 46 p.
- Ferguson RI, Werritty A. 1983. Bar development and channel changes in the gravelly River Feshie. In: Collinson JD, Lewin J, editor. Modern and ancient fluvial systems. Oxford, UK: International Association of Sedimentologists Speical Publication 6; p. 133–143.
- Fetter CW. 2001. Applied hydrogeology. 4th ed. Upper Saddle River, NJ, USA: Prentice Hall; p. 588–588.
- Fleming CA 1953. The geology of Wanganui subdivision. New Zealand Geological Survey Bulletin 52: 48–313.
- Fogg GE, Noyes CD, Carle SF 1998. Geologically based model of heterogeneous hydraulic conductivity in an alluvial setting. Hydrogeology Journal 6(1):131–143.
- Folk RL, Ward WC. 1957. Brazos river bar [texas]; a study in the significance of grain size parameters. Journal of Sedimentary Research. 27(1):3–26.
- Freeze RA, Cherry JA. 1979. Groundwater. Englewood Cliffs, NJ: Prentice-Hall; p. 604–604.
- Fuller IC. 2008. Geomorphic impacts of a 100-year flood: Kiwitea stream, Manawatu catchment. New Zealand. Geomorphology. 98:84–95.
- Gastaldo RA, Demko TM. 2010. The relationship between continental landscape evolution and the plant-fossil record: long term hydrologic controls on preservation. In: Allison PA, Bottjer DJ, editor. Taphonomy: process and bias through time, topics in geobiology 32. 2nd ed. Dordrecht: Springer Science and Business Media; p. 249–285.
- Gillespie JL. 1992. Late Quaternary carbonate-clastic sedimentation on a temperate shelf, offshore Wanganui, New Zealand [Unpublished MSc thesis]. Hamilton: University of Waikato.
- Gillespie JL, Nelson CS. 1996. Distribution and control of mixed terrigenous-carbonate surficial sediment facies, Wanganui shelf, New Zealand. New Zealand Journal of Geology and Geophysics. 39(4):533–549.
- Gradwell MW, Birrell KS. 1979. Methods for physical analysis of soils. New Zealand Soil Bureau Scientific Report 10C. DSIR Soil Bureau, Lower Hutt, New Zealand: 1-22.
- Halley RB, Schmoker JW. 1983. High-porosity Cenozoic carbonate rocks of south Florida: progressive loss of porosity with depth. American Association of Petroleum Geologists Bulletin. 67(2):191–200.
- Hazen A. 1983 . Some physical Properties of Sand and Gravels, with Special Reference to Their Use in Filtration. Twenty Fourth Annual Report, State Board of Health of Massachusetts. United States of America. 541–556.
- Hedley CB, Yule IJ. 2009. A method for spatial prediction of daily soil water status for precise irrigation scheduling. Agricultural Water Management. 96:1737–1745.
- Heerdegen RG, Shepherd MJ. 1992. Manawatu landforms: product of tectonism, climate change and process. In: Soons JM, Selby MJ, editors. Landforms of New Zealand. 2nd ed. Auckland, New Zealand: Longman; p. 33–308.
- Hellstrom JC. 1993. An investigation of the Galpin Fault, Marton, Rangitikei [Unpublished BSc Hons thesis]. Wellington: Victoria University of Wellington.
- Helton AM, Poole GC, Payn RA, Izurieta C, Stanford JA. 2014. Relative influences of the river channel, floodplain surface, and alluvial aquifer on simulated hydrologic residence time in a montane river floodplain. Geomorphology. 205:17–26.
- Houghton BF, Wilson CJN, McWilliams MO, Lanphere MA, Weaver SD, Briggs RM, Pringles MS. 1995. Chronology and dynamics of a large silicic magmatic system: central Taupo volcanic zone, New Zealand. Geology. 23(1):13–16.
- Houlbrooke DJ, Horne DJ, Hedley MJ, Hanly JA, Snow VO. 2004. A review of literature on the land treatment of farm-dairy effluent in New Zealand and its impact on water quality. New Zealand Journal of Agricultural Research. 47(4):499–511.
- Houseknecht DW. 1987. Assessing the relative importance of compaction processes and cementation to reduction of porosity in sandstones. American Association of Petroleum Geologists Bulletin. 71(6):633–642.
- Hume TM, Nelson CS. 1986. Distribution and origin of clay minerals in surficial shelf sediments, western North Island, New Zealand. Marine Geology. 69(3–4):289–308.
- Jackli R. 1957. Review of the Superior Oil Company report on the Rangitikei area. Shell, D'Arcy and Todd Oil Services geological report 7. Unpublished, held as open-file petroleum report 410 by GNS Science, Lower Hutt, New Zealand.
- Jackson J, van Dissen R, Berryman KR. 1998. Tilting of active folds and faults in the Manawatu region, New Zealand: evidence from surface drainage patterns. New Zealand Journal of Geology and Geophysics. 41(4):377–385.
- Jakobsson M, Lovlie R, Arnold EM, Backman J, Polyak L, Knutsen J-O, Musatov E. 2001. Pleistocene stratigraphy and paleoenvironmental variation from Lomonosov ridge sediments, central Arctic ocean. Global and Planetary Change. 31:1–22.
- Jiao R, Seward D, Little TA, Kohn BP. 2015. Unroofing of fore-arc ranges along the Hikurangi margin, New Zealand: constraints from low-temperature thermochronology. Tectonophysics. 656:39–51.
- Journeaux TD, Kamp PJJ, Naish TR. 1996. Middle Pliocene cyclothems, Mangaweka region, Wanganui Basin, New Zealand : A lithostratigraphic framework. New Zealand Journal of Geology and Geophysics. 39(1):135–149.
- Kamp PJJ, Vonk AJ, Bland KJ, Hansen RJ, Hendy AJW, McIntyre AP, Ngatai M, Cartwright SJ, Hayton S, Nelson CS. 2004. Neogene stratigraphic architecture and tectonic evolution of Wanganui, king country, and eastern Taranaki basins, New Zealand. New Zealand Journal of Geology and Geophysics. 47(4):625–644.
- Kampman I, Caldwell KJ. 1985. Groundwater Resources of the Waitohu, Otaki and Mangaone. Manawatu Catchment Board Report No 65: 1-22.
- Ker DS. 1973. Stratigraphy and engineering geology of the lower Wanganui valley, Koriniti to Parakino. New Zealand Journal of Geology and Geophysics. 16(2):189–208.
- Ker DS. 1991. Provisional geological map of 1:50 000 sheet T21AC (Hautapu). New Zealand Geological Survery Report G144, Lower Hutt, New Zealand: 1-19.
- Kimura J-I, Yamada Y. 1996. Evaluation of major and trace element XRF analyses using a flux to sample ratio of two to one glass beads. Journal of Mineralogy Petrology and Economic Geology. 91:92–72.
- Koltermann CE, Gorelick SM. 1995. Fractional packing model for hydraulic conductivity derived from sediment mixtures. Water Resources Research. 31(12):3283–3297.
- Kondolf GM, Piegay H. 2003. Tools in fluvial geomorphology. West Sussex, England, John Wiley and Sons Ltd; p. 661.
- Korom SF. 1992. Natural denitrification in the saturated zone: a reivew. Water Resources Research. 28(6):1657–1668.
- Krumbein WC. 1934. Size frequency distribution of sediments. Journal of Sedimentary Geology. 4:65–77.
- Lamb HF, Bates CR, Coombes PV, Marshall MH, Umer M, Davies SJ, Dejen E. 2007. Late Pleistocene desiccation of lake tana, source of the blue Nile. Quaternary Science Reviews. 26:287–299.
- Landon MK, Rus DL, Harvey FE. 2001. Comparison of instream methods for measuring hydraulic conductivity in sandy streambeds. Groundwater. 39(6):870–885.
- Larsen G, Chilingar GV. 1983. Diagenesis in sediments and sedimentary rocks, 2. Amsterdam, The Netherlands, Elsevier Scientific Publishing Company; p. 563.
- Lee CY, Tsai JH, Ho HH, Yang TF, Chung SL, Chen C-H. 1997. Quantitative analysis in rock samples by an x-ray fluroscence spectrometer (I) major elements. Annual Meeting of the Geological Society of China, Taipei, Taiwan: 418-420.
- Lensen GJ. 1976. Late Quaternary tectonic map of New Zealand, Hillersden & Renwick sheets. Wellington: Department of Scientific and Industrial Research.
- Lewis B. 2007. Eruptive source and depositional characteristics of the Potaka Tephra, Wanganui Basin, New Zealand. Unpublished thesis, University of Otago, Dunedin, New Zealand, Unpublished. 304 p.
- Longe EO, Enekwechi LO. 2007. Investigation on potential groundwater impacts and influence of local hydrogeology on natural attenuation of leachate at a municipal landfill. Internation Journal of Environmental Science and Technology. 4(1):133–140.
- Lowe DJ, Alloway BV, Shane PAR. 2015. Far-flown markers. In: Graham IJ, editor. A continent on the move: New Zealand Geoscience into the 21st century. The geological society of New Zealand in association with GNS science. 2nd ed. Wellington, New Zealand. p.172–175.
- Manville V, Nemeth K, Kano K. 2009a. Source to sink: A review of three decades of progress in the understanding of volcaniclastic processes, deposits, and hazards. Sedimentary Geology. 220:136–161.
- Manville V, Segschneider B, Newton E, White JDL, Houghton BF, Wilson CJN. 2009b. Environmental impact of the 1.8 ka Taupo eruption, New Zealand: landscape responses to a large-scale explosive rhyolite eruption. Sedimentary Geology. 220:318–336.
- Marden M, Neall VE. 1990. Dated ohakean terraces offset by the Wellington fault, near woodville, New Zealand. New Zealand Journal of Geology and Geophysics. 33(3):449–453.
- McArthur K, Roygard J, Ausseil O, Clark M 2007. Development of Water Management Zones in the Manawatu-Wanganui Region: Technical Report to Support Policy Development. 120–120.
- McCarron C, Zarour H. 2005. State of the environment of the Manawatu-Wanganui Region – 2005. Horizons Regional Council Technical report five – groundwater, 2004/EXT/609. 1-67.
- McHugh PA, Thompson RM, Greig HS, Warburton HJ, McIntosh AR. 2015. Habitat size influences food web structure in drying streams. Ecography. 38(7):700–712.
- Medina CR, Rupp JA, Barnes DA. 2011. Effects of reduction in porosity and permeability with depth on storage capacity and injectivity in deep saline aquifers: A case study from the mount Simon sandstone aquifer. International Journal of Greenhouse Gas Control. 5:146–156.
- Melhuish A, van Dissen R, Berryman KR. 1996. Mount Stewart-Halcombe anticline: A look inside a growing fold in the Manawatu region, New Zealand. New Zealand Journal of Geology and Geophysics. 39:123–133.
- Milne JDG. 1973a. Map and sections of river terraces in the Rangitikei Basin, North Island, New Zealand. 4 sheets. New Zealand Soil Survery Report. 4.
- Milne JDG. 1973b. Upper Quaternary geology of the Rangitikei drainage basin, North Island, New Zealand [Unpublished PhD thesis]. Wellington: Victoria University of Wellington.
- Morgenstern U, Stewart M, Daughney C, Townend D 2015. Transit times of baseflow in New Zealand rivers. European Geosciences Union General Assembly 2015, Vienna, Austria 17: 1–2.
- Murray MH. 2006. Structure and composition of the clay minerals and their physical and chemical properties. Developments in Clay Science. 2:7–31.
- Naish TR, Kamp PJJ. 1995. Pliocene-Pleistocene marine cyclothems, wanganui basin, New Zealand: A lithostratigraphic framework. New Zealand Journal of Geology and Geophysics. 38:223–243.
- Naish TR, Kamp PJJ, Alloway BV, Pillans BJ, Wilson GS, Westgate JA. 1996. Integrated tephrochronology and magnetostratigraphy for cyclothemic marine strata, Wanganui basin: implications for the Pliocene-Pleistocene boundary in New Zealand. Quaternary International. 34-36(95):29–48.
- Neill CR. 1973. Hydraulic and morphologic characteristics of Athabasca River near Forth Assiniboine-the anatomy of a wandering gravel bed river. Report REH/73/8. Alberta Research Council, Highways and River Engineering Division, Edmonton: 1-23.
- Odong J. 2008. Evaluation of empirical formulae for determination of hydraulic conductivity based on grain-size analysis. The Journal of American Science. 4(1):1–6.
- O'Regan M, Kind J, Backman J, Jakobsson M, Palike H, Moran K, Heil C, Sakamoto T, Cronin TM, Jordan RW. 2008. Constraints on the Pleistocene chronology of sediments from the Lomonosov ridge. Paleoceanography. 23:1–18.
- Palmer AS, Barnett R, Piltans BJ, Wilde RH 1988. Loess, river aggradation terraces and marine benches at otaki, southern north island, New Zealand. In: Eden DN, Furkert RJ editors, Balkema, Rotterdam; p. 163–174.
- Palmer AS, Pillans BJ. 1996. Record of climatic fluctuations from CA. 500 Ka loess deposits And Paleosols near Wanganui, New Zealand. Quaternary International. 34-36:155–162.
- Palmer CD, Puls RW. 1994. Natural attenuation of hexavalent chromium in groundwater and soils. In: Boulding JR, editor. Epa environmental assessment sourcebook. Michigan, USA: Arbor Press; p. 57–72.
- Parfitt RL, Schipper LA, Baisden WT, Elliott AH. 2006. Nitrogen inputs and outputs for New Zealand in 2001 at national and regional scales. Biogeochemistry. 80(1):71–88.
- Pillans BJ. 1983. Upper Quaternary marine terrace chronology and deformation, South Taranaki. New Zealand. Geology May: 292–297.
- Pillans BJ. 1990. Pleistocene marine terraces in New Zealand: A review. New Zealand Journal of Geology and Geophysics. 33(2):219–231.
- Pillans BJ. 1994. Direct marine-terrestrial correlations, Wanganui basin, New Zealand: The last 1 million years. Quaternary Science Reviews. 13(3):189–200.
- Pillans BJ, Alloway B, Naish TR, Westgate J, Abbott S, Palmer AS. 2005. Silicic tephras in Pleistocene shallow-marine sediments of Wanganui basin, New Zealand. Journal of the Royal Society of New Zealand. 35(1-2):43–90.
- Pillans BJ, Kohn BP, Berger G. 1996. Multi-method dating comparison for Mid-Pleistocene Rangitawa tephra, New Zealand. Quaternary Science Reviews. 15:641–653.
- Pillans BJ, McGlone M, Palmer A, Mildenhall D, Alloway B, Berger G. 1993. The last glacial maximum in central and southern north island, New Zealand: a paleoenvironmental reconstruction using the kawakawa tephra formation as a chronostratigraphic marker. Palaeogeography, Palaeoclimatology, Palaeoecology. 101(3):283–304.
- Potter WD. 1984. Upper quaternary geology of part of the lower Rangitikei Valley. Unpublished thesis, Victoria University of Wellington, Wellington, New Zealand. 84 p.
- Puckett LJ. 2004. Hydrogeological controls on the transport and fate of nitrate in ground water beneath riparian buffer zones: results from thirteen studies across the United States. Water Science and Technology. 49(3):47–53.
- Quinn JM, Wilcock RJ, Monaghan RM, McDowell RW, Journeaux PR 2009. Grassland farming and water quality in New Zealand. Tearmann: Irish Journal of Agricultural-Environmental Research. 7:69–88.
- Radcliffe JE. 1976. Seasonal distribution of pasture production in New Zealand, X. Rangitikei district. New Zealand Journal of Experimental Agriculture. 4(2):163–170.
- Rasmussen TC, Crawford LA. 1997. Identifying and removing barometric pressure effects in confined and unconfined aquifers. Ground Water. 35(3):502–511.
- Rayment GE, Lyons DJ. 2011. Soil chemical methods: australasia. Coolingwood, Vic, Australia, CSIRO Publishing; p. 330.
- Rees CJ, Palmer JA, Palmer AS. 2018a. Plio-Pleistocene geology of the lower pohangina valley, New Zealand. New Zealand Journal of Geology and Geophysics. 61(1):44–63.
- Rees CJ, Palmer JA, Palmer AS. 2018b. Geology of the Central Rangitikei District, Whanganui Basin, Lower North Island, New Zealand. Paper in press: 1–43.
- Revil A, Cathles LM. 1999. Permeability of shaly sands. Water Resources Research. 35(3):651–662.
- Reynolds TI. 1992. Kapiti Coast sub-region - Groundwater review. Wellington Regional Council Publication No WRC/CI-T-92/44: 1-44.
- Richardson JM, Fuller IC. 2010. Quantification of channel planform change on the lower Rangitikei River, New Zealand, 1949–2007: response to management? GeoScience: A Working Paper Series in Physical Geography 2009/1 2: 3-26.
- Rissmann C. 2011. Regional mapping of groundwater denitrification potential and aquifer sensitivity regional mapping of groundwater denitrification potential and aquifer sensitivity, Technical Report. Environment Southland Publication No 2011-12: 1-38.
- Rivas A, Singh R, Horne D, Roygard J, Matthews A. 2017. Denitrification potential in the subsurface environment in the Manawatu river catchment, New Zealand: indications from oxidation-reduction conditions, hydrogeological factors, and implications for nutrient management. Journal of Environmental Management. 197:476–489.
- Rivas A, Singh R, Horne D, Roygard J, Matthews A, Hedley M. 2015. An assessment of the denitrification potential in shallow groundwaters of the Manawatu river catchment. In: Currie LD, Burkitt LL editor Moving farm systems to improved attenuation, fertilizer and lime research centre, Massey University, Palmerston North, Occassional Report No 28.; p. 1–15.
- Rose LE, Kuehl SA. 2010. Recent sedimentation patterns and facies distribution on the poverty shelf, New Zealand. Marine Geology. 270:160–174.
- Rothwell RG, Hoogakker B, Thomson J, Croudace IW, Frenz M. 2006. Turbidite emplacement on the southern balearic abyssal plain (western Mediterranean Sea) during marine isotope stages 1–3: an application of ITRAX XRF scanning of sediment cores to lithostratigraphic analysis. Geological Society, London, Special Publications. 267:79–98.
- Roygard J, Carlyon G. 2004. Water Allocation Project Rangitikei River, Water Resource Assessment – Allocation Limits and Minimum Flows. Technical Report 2004/EXT/606. Horizons Regional Council, Palmerston North, New Zealand. 178. 178–178 p.
- Scanlon BR, Healy RW, Cook PG. 2002. Choosing appropriate techniques for quantifying groundwater recharge. Hydrogeology Journal. 10:18–39.
- Schalchli U. 1992. The Clogging of Coarse Gravel River Beds by Fine Sediment. Hydrobiologia. 235/236:189–197.
- Seitzinger S, Harrison JA, VBohlke JK, Bouwman AF, Lowrance R, Peterson B, Tobias C, Van Drecht G. 2006. Denitrification across landscapes and waterscapes: A synthesis. Ecological Applications. 16(6):2064–2090.
- Sen Z. 2015. Practical and applied hydrogeology, 1st ed. Oxford, UK: Elsevier.
- Seward D. 1976. Tephrostratigraphy of the marine sediments in the Wanganui basin, New Zealand. New Zealand Journal of Geology and Geophysics. 19(1):9–20.
- Shane P, Maas R, Lindsay J. 2017. History of Red crater volcano, Tongariro volcanic centre (New Zealand): abrupt shift in magmatism following recharge and contrasting evolution between neighboring volcanoes. Journal of Volcanology and Geothermal Research. 340:1–15.
- Shane PAR. 1991. Remobilised silicic tuffs in middle Pleistocene fluvial sediments, southern north island, New Zealand. New Zealand Journal of Geology and Geophysics. 34(4):489–499.
- Shane PAR. 1994. A widespread , early Pleistocene tephra (Potaka tephra, 1 Ma) in New Zealand: character, distribution, and implications. New Zealand Journal of Geology and Geophysics. 37(1):25–35.
- Singh R, Elwan A, Horne D, Manderson A, Patterson M, Roygard J. 2017. Predicting land-based nirtogen loads and attenuation in the Rangitikei river catchment - The model development. In: Currie LD, Hedley MJ editor Science and policy: nutrient management challenges for the next generation. Fertilizer and Lime Research Center Occassional Report No 30, Massey University, Palmerston North, New Zealand; p. 1–13.
- Song J, Chen X, Cheng C, Wang D, Lackey S, Xu Z. 2009. Feasibility of grain-size analysis methods for determination of vertical hydraulic conductivity of streambeds. Journal of Hydrology. 375:428–437.
- Spane FA. 2002. Considering barometric pressure in groundwater flow investigations. Water Resources Research. 38(6):14-1–14-18.
- Stephens DB, Hsu K-C, Priksat MA, Ankeny MD, Blandford N, Roth TL, Kelsey JA, Whitworth JR. 1998. A comparison of estimated and calculated effective porosity. Hydrogeology Journal. 6:156–165.
- Stern TA, Quinlan GM, Holt WE. 1992. Basin formation behind an active subduction zone: three-dimensional flexural modelling of wanganui basin, New Zealand. Basin Research. 4(3-4):197–214.
- Stern TA, Quinlan GM, Holt WE. 1993. Crustal dynamics associated with the formation of Wanganui basin, New Zealand. In: Ballance PF, editor. South Pacific sedimentary basins. Sedimentary basins of the world 2. Amsterdam: Elsevier. p. 213–223.
- Te Punga MT. 1952. The geology of Rangitikei Valley. New Zealand Geological Survey Memoir 8, Wellington, New Zealand. 46 p.
- Te Punga MT. 1957. Live anticlines in western Wellington. New Zealand Journal of Science and Technology. 38:433–466.
- Thompson RC. 1982. Relationship of geology to slope failures in soft rocks of the Taihape-Mangaweka area, central North Island, New Zealand. Unpublished thesis, Unpublished PhD Thesis, University of Auckland, Auckland, New Zealand. 1-330 p.
- Thorpe HR. 1992. The hidden resource. In: Rosen MR, White PA, editor. Groundwaters of New Zealand. Wellington, New Zealand: New Zealand Hydrological Society Incorporated; p. 161–183.
- Tiessen H, Roberts T, Stewart J. 1983. Carbonate analysis in soils and minerals by acid digestion and two-endpoint titration. Communications in Soil Science and Plant Analysis. 14:161–166.
- Tozer B. 2013. Crustal Structure of Wanganui Basin: Implications for Back-Arc Formation. Unpublished thesis. 276-276 p.
- Vandergoes MJ, Hogg AG, Lowe DJ, Newnham RM, Denton GH, Southon J, Barrell DJA, Wilson CJN, McGlone MS, Allan ASR and others 2013. A revised age for the kawakawa / oruanui tephra, a key marker for the last glacial maximum in New Zealand. Quaternary Science Reviews 74: 195–201.
- Van Der Neut M. 1996. Sequence Stratigraphy of Plio-Pleistocene Sediments in Lower Turakina Valley, Wanganui Basin, New Zealand. Unpublished MSc Thesis. Unpublished thesis. 149-149 p.
- Vienken T, Dietrich P. 2011. Field evaluation of methods for determining hydraulic conductivity from grain size data. Journal of Hydrology. 400:58–71.
- von Lichtan IJ, White JDL, Manville V, Ohneiser C. 2016. Giant rafted pumice blocks from the most recent eruption of Taupo volcano, New Zealand: insights from palaeomagnetic and textural data. Journal of Volcanology and Geothermal Research. 318:73–88.
- Wang S, Mulligan CN. 2006. Natural attenuation processes for remediation of arsenic contaminated soils and groundwater. Journal of Hazardous Materials. 138:459–470.
- Wang T, Zlotnik VA, Wedin D, Wally KD. 2008. Spatial trends in saturated hydraulic conductivity of vegetated dunes in the Nebraska sand hills: effects of depth and topography. Journal of Hydrology. 349:88–97.
- White P. 1986. Shallow groundwater flow direction and velocity at the Renwick refuse tip, Marlborough. Report No WS1109, Water and Soil Science Centre Christchurch, Ministry of Works and Development for the National Water and Soil Conservation Organisation: 1-42.
- Whitton JS, Churchman GJ. 1987. Standard methods for mineral analysis of soil sruvery samples for characterisation and classification in NZ soil bureau. NZ Soil Bureau Scientific Report. 79:1–27.
- Wilson GS, Roberts AP. 1999. Diagenesis of magnetic mineral assemblages in multiply redeposited siliciclastic marine sediments, Wanganui basin, New Zealand. In: Tarling DH, Turner P editor. Palaeomagnetism and diagenesis in sediments. London: Geological Society of London, Special Publication; p. 95–108.
- Wilson S. 2007. Reconnaissance vertical electrical sounding survey of the Rangitikei-Manawatu- Horowhenua area. Horizons Regional Council Report No: 2007/EXT/852, Palmerston North, New Zealand: 1-47.
- Zarour H. 2008. Groundwater Resources in the Manawatu – Wanganui Region Technical Report 2008/ET/948. Horizons Regional Council, Palmerston North, New Zealand. 262. 262–262 p.