
ABSTRACT
Understanding the in-situ stress field in the subsurface provides insights on the tectonic processes and seismic hazards of a basin. This paper presents observations and interpretations of present day maximum horizontal stress (SHmax) orientation from well Ranui-2 located in the onshore southern East Coast Basin. Fractures identified in the Ranui-2 image log have been divided into distinct subsets based on fracture orientation. These subsets correspond in a general sense, to changes in lithology in the well, which are associated with changes in formations. Analysis of the image log shows the present day SHmax in the borehole has two primary stress directions, W–E and NW–SE, and most of the fractures strike NE–SW. The change in SHmax occurs at a depth of circa. 1130 m measured depth (918 m true vertical depth subsea), below the depth at which the borehole changes from vertical to ≥10° deviation. When these data are compared to the regional stress field obtained using other stress indicators such as earthquake focal mechanisms, the results are consistent with each other. This study shows that shallow subsurface indications of present-day SHmax in southeastern North Island reflect SHmax orientations from deeper within the subsurface.
Introduction
Petroleum exploration wells have been drilled in the East Coast Basin since the late nineteenth century (). Most of the geological information obtained from these wells has consisted of cuttings and conventional wireline log data (e.g. natural gamma, resistivity, sonic, and density logs can provide information on the lithology in the well) (e.g. BP Shell Aquitaine Todd Petroleum Developments Ltd Citation1976; Biros et al. Citation1995; Tap Oil Limited Citation2004). In recent decades, borehole imaging tools have been used in many wells overseas, providing an opportunity to compensate or complement information obtained from cuttings, core, and traditional wireline data sets taken in the well (e.g. Bell and Gough Citation1979; Prioul and Jocker Citation2009; Nie et al. Citation2013). Using image logs has in the past been considered an added expense, so are often not used in this country. Some recent wells however, including some in the Taranaki and East Coast basins, and the Taupo Volcanic Zone, have had borehole televiewer (BHTV) or resistivity imaging tools run in them and the data acquired from these imaging tools can provide valuable new information on the subsurface geology and structure (e.g. NZEC Citation2012a, Citation2012b; Rajabi et al. Citation2016; McNamara et al. Citation2017; Griffin Citation2018).
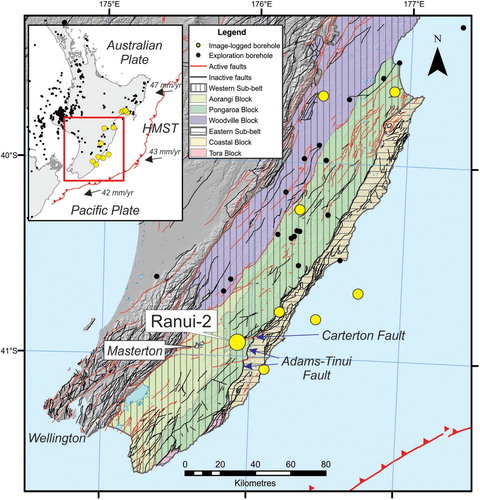
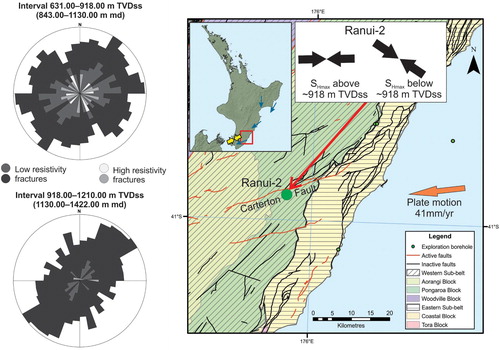
Figure 1. Map showing the location of the Ranui-2 borehole and other imaged wells in the southern onshore East Coast Basin, the active and inactive faults present in the area, and the sub-belts and structural blocks of Moore (Citation1988a). The inset map shows the present plate margin boundary (HMST – Hikurangi Margin subduction thrust) and the relative plate motion vectors from Nicol et al. (Citation2007). Boundaries are approximate.
Borehole image logs provide an oriented image of the inside of the borehole at resolutions of ≤1 cm (Lagraba et al. Citation2010). Image logs are best used for adjusting core depths to log depths, identifying bed contacts, bedding dips, and structural and sedimentary features. Image log interpretation can measure in-situ bedding, fractures, and in-situ stress in the borehole, which are features that cannot be obtained from the conventional wireline log suite or conventional core (e.g. Plumb and Hickman Citation1985; Prensky Citation1999).
Understanding the in-situ stress field in the subsurface from borehole image log data provides valuable observations and constraints for models of tectonic processes and the driving mechanism of plate motion that are not easily obtained from other methods, for example, in Iran (Rajabi et al. Citation2010), north China (Nie et al. Citation2013), and New Zealand (Rajabi et al. Citation2016). These data can be compared with surface geology observations and together, can assist in assessments of long-term seismic hazards (Hickman et al. Citation1985; Finkbeiner et al. Citation1997; Prensky Citation1999; Rajabi et al. Citation2010). In-situ stress data from borehole image logs when used in conjunction with the natural fracture distribution also obtained from the image logs, enables the relationship between fracture formation, the current stress field, and the regional tectonic history to be established (Hickman et al. Citation1985; McNamara et al. Citation2015; Massiot et al. Citation2017). Fractures interpreted from borehole image logs, that are most prone to tensile or shear failure in the present-day stress, typically those striking approximately parallel or within 30° of the maximum principal stress orientation, are often observed to transmit the largest volumes of fluids (Barton et al. Citation1995; Sibson Citation1996). This may allow enhanced fluid flow within the rock, making it a suitable candidate for unconventional resources.
Since the 1990s, image logs have been acquired in several onshore and offshore petroleum wells in the southern East Coast Basin, eastern North Island (Biros et al. Citation1995; Tap Oil Ltd Citation2004; ECEV III Ltd Citation2012; NZEC Citation2012a, Citation2012b). One of these wells Ranui-2, located near Masterton (location 40.94231667°S, 175.91781944°E; ), was drilled as a stratigraphic borehole in 2012 by East Coast Energy Ventures (ECEV III Ltd), a subsidiary of New Zealand Energy Corporation (NZEC), mainly to assess the unconventional petroleum potential of the area. This paper presents observations and interpretations of the image log dataset from this well, and details the in-situ stress features and fractures present, and compares them to the present-day subsurface stress and nearby active faults at the surface within the southern onshore East Coast Basin.
Geological setting
The Wairarapa region occupies a now-uplifted part of a late Neogene forearc basin and associated inboard margin of an accretionary wedge, which are all collectively part of the actively deforming Hikurangi subduction margin (e.g. Wallace et al. Citation2004; Nicol et al. Citation2007; Bailleul et al. Citation2013) (). The ‘Hikurangi margin’ presently accommodates oblique subduction of the Pacific plate beneath the Australian plate in New Zealand's North Island (De Mets et al. Citation1990, Citation1994) (). The margin forms the transition from subduction of the Pacific plate along the Tonga-Kermadec trench (and associated back-arc extension in the Lau-Havre Trough) to continental collision and strike-slip movement along the Alpine Fault (Nicol et al. Citation2007). Subduction along the Hikurangi margin is inferred to have commenced about 24–40 Ma (Ballance Citation1976; Rait et al. Citation1991; Kamp Citation1999; Stern et al. Citation2006; Mortimer Citation2018) and currently accommodates a relative plate-motion vector of 42–48 mm/yr trending at c. 50° to the trend of the margin (Nicol et al. Citation2007) (). Plate convergence (i.e. margin-normal motion) is principally accommodated on the subduction interface, while the remainder of the margin-normal motion and most of the margin-parallel motion (>50%) are accommodated in the upper plate through a combination of reverse faulting, strike-slip faulting, and vertical-axis clockwise rotations (Walcott Citation1989; Cashman et al. Citation1992; Beanland Citation1995; Barnes and Mercier de Lépinay Citation1997; Beanland and Haines Citation1998; Nicol and Beavan Citation2003; Wallace et al. Citation2004; Nicol et al. Citation2007; Lamb Citation2011).
Moore (Citation1988a) divided the onshore East Coast Basin into two structural sub-belts (the Western and Eastern sub-belts) and seven structural blocks (), based on the Cretaceous–early Paleocene succession. Each sub-belt and block is characterised by differing basement rocks, sedimentary fill, geological histories, and structural styles (Moore Citation1988a). Borehole Ranui-2 was drilled within the southern part of the Pongaroa Block of the Western Sub-belt (). This block is bounded along its eastern side by the Adams-Tinui Fault complex, and comprises a gently-folded structure (at least within the Miocene succession), with a relatively complete succession of Early Cretaceous to Late Cretaceous-Paleogene age, unconformably overlain by middle–late Miocene and Pliocene strata (ECEV III Ltd Citation2012). Basement rocks comprise Early Cretaceous metasedimentary strata of the Pahau Terrane, although these were not intersected in borehole Ranui-2. The area around the Ranui-2 borehole is also bisected by several WSW–ENE-trending active strike-slip faults, such as the Carterton Fault (Langridge et al. Citation2016) (). The strike of many of these faults is near-parallel to the strike of the Pacific-Australian plate convergence direction.
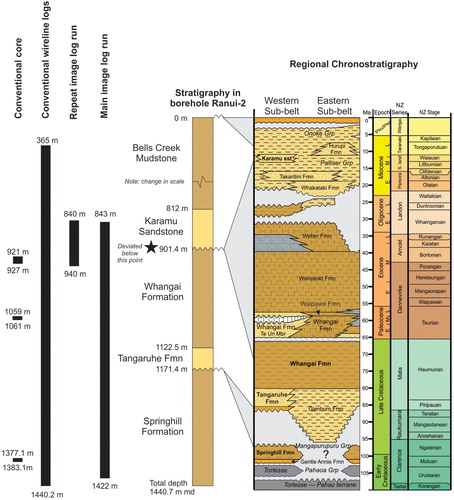
Within Ranui-2, the main imaged interval (between 843 and 1422 metres) intersected the middle Miocene Karamu Sandstone, latest Cretaceous–Paleocene Whangai Formation (Haumurian to early Teurian), Late Cretaceous Tangaruhe Formation, and the late-Early Cretaceous to early-Late Cretaceous Springhill Formation (Motuan to Ngaterian) (, ECEV III Ltd Citation2012). Three intervals were cored, at 921–927 m, 1059–1061 m, and 1377.10–1383.10 metres measured depth (m md). The Whangai Formation, a highly fractured siliceous mudstone, is considered to be a possible unconventional reservoir unit in East Coast Basin (IGNS Citation2005). The formation, typically a 300–500 m-thick non-calcareous to calcareous mudstone to fine sandstone, was deposited over virtually the entire East Coast region during the Late Cretaceous to Middle Paleocene (Moore Citation1988b).
Figure 2. Schematic diagram showing the stratigraphy encountered in borehole Ranui-2, and the different data and depths at which they were acquired in the borehole. A schematic regional chronostratigraphic panel is to the right, illustrating the relationship between the stratigraphy in the borehole and the regional stratigraphy of the Western and Eastern Sub-belts. All depths are in metres measured depth (md). Borehole data from ECEV III Ltd (Citation2012). Chronostratigraphy adapted from Bland et al. (Citation2015). Stratigraphy not to scale.
Data and Methodology
Image and wireline log acquisition
Ranui-2 was planned as a vertical borehole, but the borehole deviated to a maximum of 25° to the southeast at 1420 metres measured depth (m md) (ECEV III Ltd Citation2012). Total depth drilled in the borehole was 1440.70 m md. A conventional wireline log suite was run in the borehole, along with a resistivity-based imaging tool (FMITM), with data acquisition over most of the well. The main image logged interval was between 843 and 1422 m md (631–1210 metres true vertical depth relative to sea level, m TVDss), with a repeat run logged over 840–940 m md (, ECEV III Ltd Citation2012).
The conventional suite of wireline logs included gamma ray, calliper, acoustic, density, array resistivity, and neutron porosity. Most of the suite covered the interval 395.00–1440.18 m md (, ECEV III Ltd Citation2012). The borehole image data were acquired using Schlumberger's FMITM resistivity imaging tool, a four-arm, eight-pad-based resistivity measurement device (for details see Schlumberger Citation1986). The pads are pressed against the borehole wall, which enables the array of electrodes organised in rows on each pad to record changes in micro-resistivity of the formation as the tool is slowly pulled up the borehole. The tool is sensitive to any spalling at the borehole wall (Zoback Citation2007), which makes the resulting dataset useful for determining any borehole breakout directions. The thin grey areas in A and B represent the gaps between the electrode arrays on the pads of the tool where no data were collected.
Figure 3. Borehole breakouts (white boxes) from A, Above and B, below the change in deviation at c. 940 m md in the FMI resistivity image log from borehole Ranui-2. A low confidence DITF (dashed white line) has been interpreted at c. 1009.50 m. The breakout orientation does not coincide with the high side of the borehole (indicated by the red ‘H’ on the images), eliminating the possibility that the breakouts are keyseats. Sinusoidal features in the images have been interpreted as fractures. The grey lines represent the space between the pads on the FMI imaging tool. C, Schematic cross-sections of borehole breakout and DITF formation (adapted from Hillis and Reynolds Citation2000). Borehole breakouts form when circumferential stress around the borehole exceeds the compressive rock strength and thus are oriented parallel to Shmin (σh). DITFs form when the circumferential stress exceeds the tensile strength of the borehole wall, thus are oriented parallel to SHmax (σH).
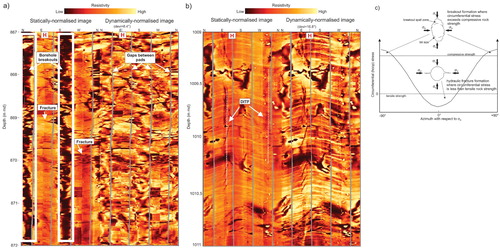
Image log processing and quality control
The raw acquisition imaging data from the borehole were loaded into Landmark RecallTM 5.4 software, and rigorous quality control, including but not limited to, assessment of tool acquisition parameters and orientation data, speed corrections to account for tool stick, and static and dynamic image normalisation, was undertaken to assess the suitability of the raw data for processing and interpretation (see online supplementary material). Once this was completed, the images were processed using RecallTM, which included: (1) standardising the image data, (2) applying a speed correction to remove speed irregularities induced as the tool was pulled up the borehole, (3) normalising the data statically to illustrate the gross variations throughout the imaged interval, and (4) re-normalising the data dynamically using a sliding window (1.0 m), to highlight more detailed features (Hansen and Buczak Citation2010; García-Carballido et al. Citation2010). The resulting images were displayed unwrapped with 0° (North, ‘N’) at the left-hand edge, 180° (South, ‘S’) in the centre, and 360° (N) at the right-hand edge (). The reader is referred to Griffin (Citation2018) or the online supplementary material for more detail on the image data acquisition and processing procedures used in this study.
Processed image log data provide information from inside the borehole including lithology, structural features (e.g. fractures, fault orientation, width and fill), and in-situ horizontal stress orientations (from induced features) (Lagraba et al. Citation2010).
Image quality
In this study, image log data quality was deemed good where >75% of the image was interpretable, moderate where 50%–75% was interpretable, poor where <50% was interpretable, and bad where the image quality precluded any attempt at interpretation. Image quality is generally moderate to good in the borehole, however poor hole conditions (indicated by the four-arm callipers) in the borehole has affected the image quality throughout the imaged interval (e.g. between 998–999.50 m, 1016–1017 m, 1025–1032 m, 1120–1127 m, and 1169–1380 m md) (see the Ranui-2 structural summary plot in the online supplementary material for the image quality log). Just under half (43%) of the imaged interval in borehole Ranui-2 has moderate (24%) to good (19%) image quality, and of the remainder, 47% is of poor quality. Where the image is interpretable (e.g. between 843–998 m, 1032–1120 m, 1127–1169 m, and 1380–1405 m md), confidence in the interpretation is high. Determining the quality of the images is important, as it gives confidence in the identification of features and subsequent interpretation.
Feature identification
Borehole image logs provide 360° coverage of the borehole wall based on rock property contrasts, allowing both natural (bedding, fractures, faults) and induced features (borehole breakouts, drilling induced tensile fractures (DITFs)) to be identified (Rider Citation1996). The image logs represent contrasts in resistivity between borehole lithology and the identified feature (Rider Citation1996). Features that appear dark on the processed images are of low resistivity (i.e. are conductive), whereas bright features are resistive.
Borehole breakouts appear as broad, parallel, dark (conductive/low resistivity), vertical, locally irregular features that occur 180° apart (i.e. opposite sides of the borehole) (A and B). DITFs appear on resistivity image logs as paired or singular (depending on the gaps between the pads) narrow, well-defined dark (conductive) fractures that are vertical to sub-vertical, occurring 180° apart (B). In this study, the breakouts and DITFs were more visible on the statically-normalised images (A and B), however many of the DITFs are of low confidence due to the singular appearance and/or poor image quality at the depths they were identified at (e.g. 879, 966.50, 1067, 1086, 1149, 1153, 1169, and 1185 m) (see structural summary plot in the online supplementary material). Borehole breakouts and DITFs are orthogonal to one another (C).
For this study, borehole breakouts and DITFs have been interpreted from the higher resolution image log alone, rather than the four-arm calliper tool run in the borehole. By analysing the logging run parameters, it appears that the calliper tool did not rotate in the borehole, meaning that the callipers did not encounter breakouts in the borehole.
Natural fractures and faults were also observed on the image logs (). These features were picked by matching sinusoids to observed geological features on the images (Rider Citation1996). Sinusoids were only picked where geological features could be recognised with confidence (A and B). Both full and partial sinusoids have been included in the fracture strike orientations in the borehole. A full sinusoid is picked on a feature that can be correlated for more than >75% of the borehole circumference, whereas partial sinusoids are used for features that can be traced for less than 75% around the borehole. Details of the different features (both natural and induced), and their associated dip-type definitions can be found in the online supplementary material (Table S1) and in Griffin (Citation2018).
Table 1. Summary of fracture and in-situ stress feature counts by formation, for the Ranui-2 borehole.
Determination of the SHmax orientation from drilling-induced tensile fractures and borehole breakouts
Bell and Gough (Citation1979) first recognised the possibility of determining in-situ stress orientation from failures in borehole walls using four-arm dipmeter data acquired in oil wells. The data showed that many boreholes in Alberta, Canada, had intervals that were non-circular as a result of caving of the borehole walls. They demonstrated that this was the result of stresses around the borehole exceeding the strength of the rock, causing pieces of the borehole wall to spall off. The cavings, or breakouts, elongated the boreholes in a consistent direction both within the holes, and field wide.
The concentration of stress around a borehole can lead to compressive failures known as borehole breakouts and/or drilling-induced tensile fractures (Zoback Citation2007). Assuming that the vertical stress (Sv) is one of the principal stresses, borehole breakouts are indicators of the minimum horizontal stress (Shmin) orientation in a vertical borehole. The breakouts form by compressional failure at azimuths where the concentrated stress in the borehole is most compressive (C, Bell and Gough Citation1979; Barton et al. Citation2009). The maximum horizontal stress direction (SHmax) is perpendicular to Shmin (C), and forms when the minimum circumferential (hoop) stress around the borehole wall is smaller than the tensile strength of the rock (Zoback et al. Citation1985; Aadnoy Citation1990; Bell Citation1990; Barton et al. Citation1997; Hillis and Reynolds Citation2000; Barton and Moos Citation2010). DITFs occur in the borehole wall where the circumferential (hoop) stress is negative (extensional) and exceeds the tensile strength of the rock (C, Hillis and Reynolds Citation2000; Barton et al. Citation2009). DITFs can be interpreted from image logs, where they appear as a set of conductive (dark) and sub-vertical fractures on opposite sides of the borehole, however they cannot be interpreted from oriented calliper logs (Rajabi et al. Citation2016).
In deviated wells, it can be difficult to identify borehole breakouts from oriented calliper logs, as they need to be differentiated from other borehole enlargements that are non-stress-related, such as key seats and washouts (Plumb and Hickman Citation1985; Zoback Citation2007; Heidbach Citation2016a). In addition to this, breakout occurrence, width, and depth can be a function of the rock strength, remote stress state, mud weight relative to formation fluid pressure, and borehole orientation relative to the principal stresses in an inclined borehole (Zoback Citation2007; Barton et al. Citation2009; Davatzes and Hickman Citation2010). Therefore, the position of the breakouts depends on the magnitude and orientation of principal stresses, as well as the orientation of the well with respect to the stress field, and do not necessarily align with the geographical orientations of the horizontal stresses (Peška and Zoback Citation1995; Zoback Citation2007; Barton et al. Citation2009). Therefore, Shmin can only be reliably estimated from breakouts in vertical boreholes (with <10° deviation) (Heidbach Citation2016a). Corrections and/or errors to the stress orientations determined from induced features can be done for wells deviated >10° (Peška and Zoback Citation1995; Zoback et al. Citation2003). Determining the stress magnitudes of the three principal stresses (i.e. Sv, SHmax, and Shmin) is beyond the scope of this study, therefore the weighted average in-situ stress feature orientations and standard deviations used in this study have not been corrected for well deviation. However, modelling has been used to determine the direction of borehole breakouts in a deviated well, based on different principal stress magnitudes (see Results section below).
This study has inferred the SHmax orientation in Ranui-2 from borehole breakouts observed in the image logs. Due to the few reliable DITFs identified in the well, estimates of present day SHmax direction in the borehole have been assumed to be perpendicular to the observed Shmin orientation. Due to the shallowness of the borehole (circa 1440 m md), it has been assumed that in the deviated section, one of the principal stresses is vertical. As such, the findings in the lower deviated part of Ranui-2 are preliminary and may be less reliable indicators of SHmax. Further work is needed to understand the Sv, SHmax, and Shmin magnitudes of well Ranui-2.
World stress map
The World Stress Map (WSM) allows comparison between different indicators of stress orientation (e.g. focal mechanism solutions, borehole image logs, four-arm calliper logs) on a global scale, using a quality ranking scheme (A–E), with A being the highest quality and E the lowest (Heidbach Citation2016a). The ranking scheme is based mainly on the number, accuracy, and the depth of the measurements, and has undergone many refinements over the years since it was introduced by Zoback and Zoback in Citation1989 (Heidbach Citation2016a). Data in this study is compared to existing stress orientation data in the WSM (e.g. Townend et al. Citation2012; Heidbach et al. Citation2016b), and using the WSM ranking criteria allows reliability and global comparability of stress data, to further refine the stress regime of the East Coast Basin.
Borehole breakouts and DITFs provide two stress orientations for a borehole, so each needs to have its own quality ranking. A circular statistical method, detailed in Heidbach (Citation2016a), was used to calculate the mean SHmax azimuths and standard deviations for both the identified breakouts and DITFs from Ranui-2, with the results compared against the WSM quality rankings.
In this study, the length (L), rather than the number, of the individual in-situ stress features has been used to determine the quality ranking of Ranui-2. The standard deviation of the Length method has been used to classify the mean SHmax, following the borehole breakout classifications in Heidbach (Citation2016a).
Results
SHmax
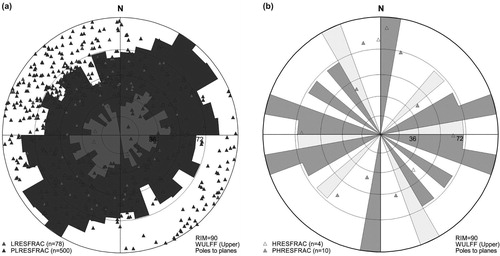
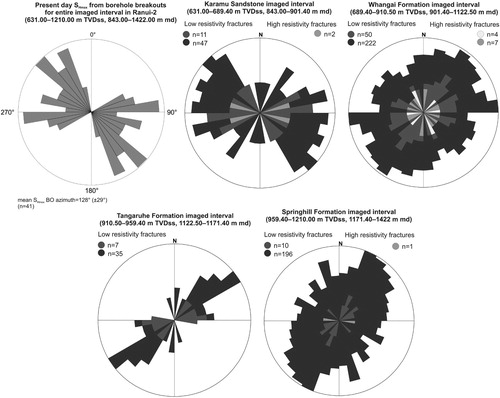
The observed in-situ stress data obtained from the image logged interval in Ranui-2 is shown in A, prior to applying the circular statistical method of Heidbach (Citation2016a) to the data. The breakouts (n = 41) have a general N–S to NE–SW orientation, while the two DITFs are oriented W–E. These orientations are similar to the breakout and DITF interpretations in ECEV III Ltd (Citation2012), with strikes of NNE–SSW (n = 52) and WNW–ESE (n = 7), respectively. As indicated above, mean SHmax azimuths were inferred from the borehole breakout data so all numbers of data points and statistics from herein refer to the breakouts. The mean SHmax azimuth (uncorrected for well deviation) for the entire imaged interval 843–1422 m md in Ranui-2 is 128° (±29° standard deviation, n = 41, combined length of features = 177 metres) (B, ). This equates to a quality ranking of D (based on the standard deviation), using the WSM quality ranking method of Heidbach (Citation2016a). However, the inclinometry data in the well suggests that the borehole is deviated ≥10° below ∼940.00 m md (728 m TVDss). Therefore, the breakouts below this depth need to be corrected for the effect of wellbore deviation.
Figure 4. Rose diagram showing the A, all the observed in-situ stress features in the entire imaged interval, prior to applying the circular statistical analysis of Heidbach (Citation2016a). Borehole breakouts are in black (n = 41), while DITFs are in grey (n = 2). B, C, and D, Scaled rose diagrams showing the mean SHmax azimuth directions determined from borehole breakouts identified from the imaged interval in borehole Ranui-2, using the circular statistical method. B, The entire imaged interval (843–1422 m md). C, The interval above the change in deviation (843–c. 940 m md). D, The lower deviated (≥10°) interval (c. 940–1422 m md) in the borehole. N = number of data points. The standard deviation is given in the brackets for each interval. The quality ranking follows the World Stress Map criteria of Heidbach (Citation2016a).
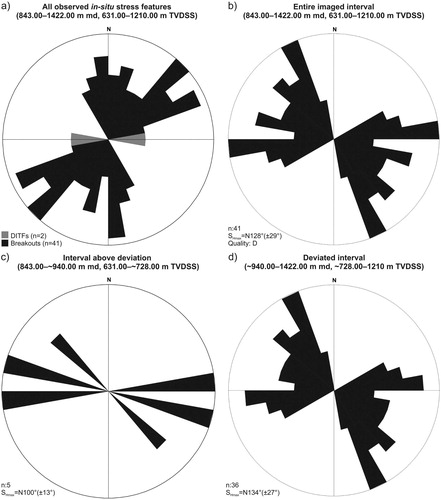
Table 2. Stress indicators from the analysed resistivity borehole image in Ranui-2, based on the changes in mean SHmax azimuth (shallow and deep) and deviation in the borehole (shlwdev and deepdev).
When the SHmax is classified as being either above or below circa 940 m md, based on the change in deviation, two distinct trends can be seen, although there is a general W–E orientation in both intervals (C and D, ). The vertical interval 843–940 m md has a mean SHmax azimuth of 100° (±13°, combined length = 24 m), although it has few data points (n = 5, C). Below 940 m, where the borehole starts to deviate ≥10°, the mean SHmax azimuth is 134° (±27°, n = 36, combined length = 152 m, D). The two DITFs identified in the imaged interval have been assigned an E-quality due to the small sample size (), and have not been used to determine the SHmax orientation in this study.
Few onshore orientational data exist in and around Ranui-2 in the WSM. This study's mean SHmax azimuth from breakouts, (128° ± 29°, n = 41) is similar to that obtained from nearby earthquake focal mechanism (SHmax 115°–119°) and offshore well (Tawatawa-1 breakouts mean SHmax = 111° ± 6°, n = 48) data (Heidbach et al. Citation2016b). The Ranui-2 breakouts in the WSM have had their orientation corrected based on the wellbore deviation. These breakouts have a mean SHmax azimuth of 114° (±20°, n = 78), and have been assigned a B-quality ranking. The DITFs have a mean SHmax azimuth of 100° (±8°, n = 3), and are of D-quality (Heidbach et al. Citation2016b).
Confidence in determined SHmax orientation from borehole breakouts
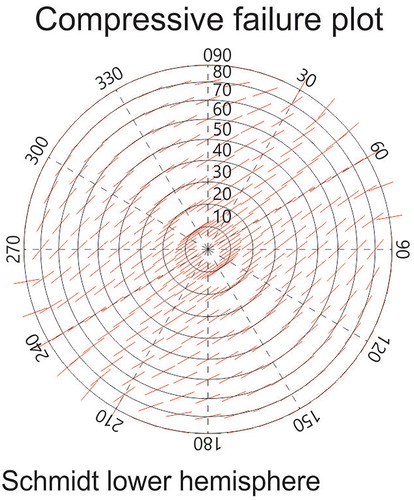
The deviation from vertical in Ranui-2 potentially introduces error into the determination of in-situ horizontal stress field orientations from observations of induced features on a borehole surface. Determining the three principal stress magnitudes was not part of this study, however a range of estimated magnitudes were used in the Landmark RecallTM Sigma module for a range of given depths, to test whether the vertical stress affected the borehole breakout azimuths observed in the deviated section of the well (see online supplementary material, including Table S2). The resulting compressional failure model () shows that the borehole breakouts should have a SHmax strike azimuth of ∼50°–60° even with a borehole deviation of 25°, which is similar to that observed in the imaged interval (A). This suggests that in Ranui-2, the vertical stress has little or no effect on the borehole breakout azimuths. Hence, high confidence can be placed on the in-situ stress orientations obtained from the borehole breakouts in the FMI imaged interval.
Figure 5. Compressional failure plot for Ranui-2, modelled using the Landmark RecallTM Sigma module. Input parameters are given in in the supplementary material. The plot shows that for a borehole with 25° deviation, borehole breakouts should have a strike azimuth of ∼50°–60°. The observed borehole breakout azimuths from the imaged interval in Ranui-2 strike at ∼55°. The compressional failure plot confirms that the borehole deviation is not affecting the borehole breakouts in Ranui-2. Plot is in Schmidt lower hemisphere.
SHmax versus depth
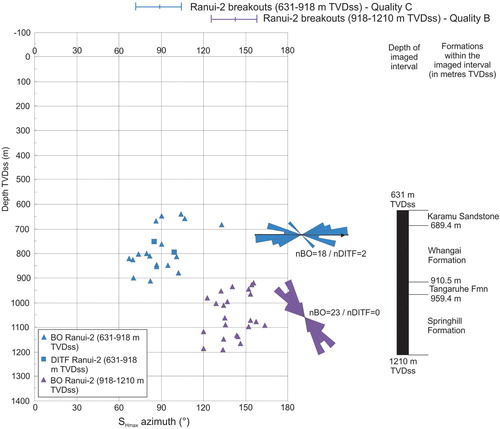
When the SHmax azimuths obtained in this study are plotted against true vertical depth subsea (TVDss), there is a sharp change in the mean SHmax azimuth at c. 918 m TVDss (c.1130 m md), near the top of the Tangaruhe Formation (, ). Above c. 918 m TVDss, the mean SHmax azimuth is 089° (±14°) (n = 18), with an overall length of 59 m, whereas below this depth, the mean SHmax azimuth is 142° (±11°, n = 23), with an overall length of 117 m.
Figure 6. Depth partitioning of the mean SHmax azimuth direction in borehole Ranui-2. Borehole breakouts (BO) above c. 918 m TVDss (c. 1130 m md) indicate an azimuth of 089°–269° (blue), while below c. 918 m TVDss, the borehole breakouts show a 142°–322° azimuth direction (purple). The black arrow indicates the mean SHmax azimuth obtained from the DITFs identified in the interval above c. 918 m TVDss (n = 2). SHmax is calculated using the World Stress Map circular statistics calculations in Heidbach (Citation2016a). Triangles are derived from borehole breakouts, while squares depict the DITFs identified in the imaged interval of the borehole. Errors on SHmax azimuth are 1 standard deviation, calculated using circular statistics, borehole breakouts (BO) weighted by the BO number, quality ranking from the World Stress Map. nBO = number of BO; nDITF = number of drilling-induced tensile fractures. The black bar on the right indicates the depths of the imaged interval in borehole Ranui-2, in metres TVDss.
The borehole starts to deviate greater than 10° at c. 940 m (c. 728 m TVDss), which is above the depth at which the mean SHmax azimuth changes direction. This suggests that the rotation in the stress field (change in mean SHmax azimuth) has not affected the change in deviation in the borehole. The hole azimuth of the borehole itself starts to rotate at c. 900 m md (c. 688 m TVDss, ECEV III Ltd Citation2012), with the mean azimuth 095° rotating towards 119° below this depth.
Despite a c.230 m depth difference between the change in well deviation at 728 m TVDss, and the sharp change in mean SHmax azimuth downhole at 918 m TVDss, the mean SHmax azimuthal directions calculated from breakouts are generally similar to each other down the well (C and D, , ). The intervals above 728 m TVDss (change in well deviation, ‘shlwdev’ in ) and 918 m TVDss (change in mean SHmax downhole, ‘shallow’ in ) have mean SHmax azimuths of 100° (±13°) and 089° (±14°), with overall lengths of 24 and 59 m, respectively. Below these changes in depth, the mean SHmax azimuths are 134° (±27°, change in well deviation, ‘deepdev’ in ) and 142° (±11°, change in mean SHmax downhole, ‘deep’ in ), with overall lengths of 152 and 117 m, respectively. The higher standard deviations suggest higher variability of the SHmax direction.
Fractures
A total of 592 fractures were identified in the imaged interval in Ranui-2, with the majority (98%, n = 578) being of low resistivity (conductive) (). Partial (i.e. discontinuous) low-resistivity fractures (A) are the most numerous (n = 500, or 84%), with ‘full’ continuous low-resistivity fractures being the next dominant (n = 78, 13%). The remainder of the fractures are non-conductive (high resistivity) (). In Ranui-2, low resistivity (conductive) fractures are appear dark on the image. These fractures are conventionally assumed to be ‘open’ at the borehole well and hydraulically conductive (Barton et al. Citation1995). The resistive fractures appear bright on the image. The mean fracture strike orientation for the entire imaged interval is 045° (NE–SW), with the low-resistivity fracture strike direction also following this trend (A). This NE–SW strike orientation is similar to that reported in ECEV III Ltd (Citation2012), which also shows a subset of the low resistivity fractures (minor conductive fractures, with both continuous and discontinuous traces, and with narrow apertures) having an E–W strike orientation. In this study, fracture apertures were not measured, however there is a minor E–W strike orientation in the low resistivity fractures in A, which may equate to that seen in ECEV III Ltd (Citation2012). There is no obvious dominant fracture strike orientation for the high-resistivity fractures identified in this study (B).
Figure 7. Rose histograms showing proportionally scaled fracture strike orientations, and dip magnitudes and directions for the fractures identified in the entire imaged interval in Ranui-2. A, Low resistivity fractures are in dark grey (full sinusoids, n = 78) and black (partial sinusoids, n = 500). B, High resistivity fractures are in white (full sinusoids, n = 4) and pale grey (partial sinusoids, n = 10).
Fracture strike orientations vary down the well, and change from a W–E to NW–SE direction at the top of the imaged interval, to a more NE–SW direction below c. 920 m md (). This depth is close to the depth at which the well becomes deviated >10° (c. 940 m md, 728 m TVDss), and occurs near the top of the Whangai Formation. Further down the well, in the interval 1060–1120 m md, there is a wide spread in fracture strike orientation direction ().
Figure 8. Rose histograms showing the proportionally scaled fracture strike orientations, and dip magnitudes and directions for the four fracture sets identified in Ranui-2, based on general fracture strike orientation. The formations identified in the imaged interval are shown in the middle, with fracture set (i) corresponding to the Karamu Sandstone, fracture sets (ii) and (iii) to the Whangai Formation, and fracture set (iv) comprising of the Tangaruhe and Springhill formations. The mean SHmax azimuth directions from the borehole breakouts (after circular statistics have been applied, but not corrected for well deviation) above and below c. 1130 m md, are shown on the right. The fractures in fracture set (i) strike in a similar W–E direction to the SHmax above 1130 m, while fracture sets (ii) and (iv) strike oblique to the NW–SE SHmax azimuth direction below 1130 m.
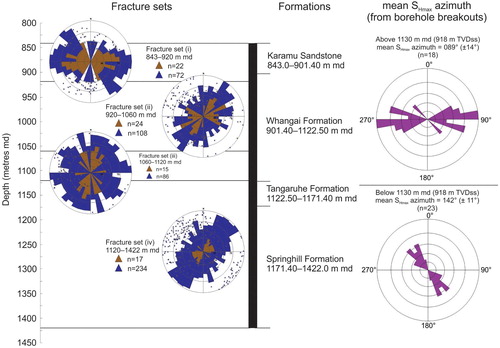
The open (low resistivity) fractures can be classified into four major sets (i): 70°–120°N, set (ii): 30°–60°N, set (iii): 340°–050°N, and set (iv): 20°–60°N (). None of the fracture sets follow the mean SHmax azimuth directions identified above and below c. 1130 m md (089° and 142°, respectively), although fracture set (i) is broadly parallel to the NW–SE mean SHmax azimuth direction for the interval above c. 1130 m md ().
The fracture sets were compared against the mean SHmax direction in the well, to see if there is any connection between the fracture strike orientation, particularly in the low resistivity fractures, and present day in-situ stress in the borehole. Rajabi et al. (Citation2010) suggests that there are two main hypotheses about the relation of in-situ stress and open fractures: (1) ‘stress-sensitive fractures’, in which fractures are hydraulically conductive due to being suitably oriented for failure (shear or tensile) in the present day stress tensor (Barton et al. Citation1995; Sibson Citation1996; Finkbeiner et al. Citation1997), and (2) ‘stress-insensitive fractures’, in which fractures are ‘propped open’ due to partial mineralisation or from fracture wall asperities and thus may be oriented in any direction and have no relation to the present-day stress tensor (Laubach et al. Citation2004). Of the four fracture sets identified in the imaged interval in Ranui-2, only fracture set (i) may be genetically linked to the present-day stress orientation, as it is generally parallel to the mean SHmax azimuth of the well (B and ). Fracture sets (ii) and (iv) are oblique to the mean SHmax azimuth in Ranui-2, suggesting that both stress-sensitive and stress-insensitive fracture sets occur, and may have significant influence on hydraulic conductivity (B and ).
Discussion
Stress on pre-existing faults and fractures affects which fractures will be open to fluid flow (e.g. Barton et al. Citation1995; Finkbeiner et al. Citation1997; Rajabi et al. Citation2010). Understanding fluid flow is of fundamental importance in conventional and unconventional petroleum reservoirs as it provides evidence of where and how fluids have migrated e.g. from source to reservoir rocks (Allis et al. Citation1997; Finkbeiner et al. Citation1997; Moretti Citation1998; Aydin Citation2000; Cartwright et al. Citation2007; Webster et al. Citation2011; Ilg et al. Citation2012). It is also important in relation to seal rocks (‘cap-rocks’) as fracture permeability can affect seal capacity (Cartwright et al. Citation2007). Fluids typically prefer to flow along fractures that are oriented parallel or sub-parallel to the present-day SHmax, or maximum compressive stress (Barton et al. Citation1995; Rajabi et al. Citation2010). This is because such fractures have the lowest normal stress across them, and therefore provide the least resistance to flow, however this may not always be the case. Laubach et al. (Citation2004) show that while open fractures can have any strike relative to SHmax, chemical processes such as cement precipitation while fractures are opening can cause resistance to fracture closure, making the fractures insensitive for changes in effective stress. Processes such as these can affect permeability of the rock. The relationship between SHmax and permeability in Ranui-2 was not assessed as part of this study, and although there may be a correlation, further study is needed.
SHmax versus Depth
Using the length-weighted method, there is a distinct change in the SHmax azimuth direction at c. 1130 m md (918 m TVDss), from 89° ± 14° to 142° ± 11° (, ). To determine if there was any change in SHmax azimuth direction as a result of the well deviation, the SHmax azimuths were calculated, again using the length-weighted method, for above and below c. 940 m md (728 m TVDss), where the well becomes deviated >10°. shows that for these intervals, the SHmax azimuth deviation above c. 940 m is 100° ± 13°, while below c. 940 m md, it is 134° ± 27°.
These rotations in SHmax azimuth within Ranui-2 are ‘fourth order of stresses’ as they occur at wellbore (1–1000 m) scale (Rajabi et al. Citation2017a, Citation2017b). On a worldwide scale, these highly localised stress features have been associated with geological features such as lithological changes, faults, and fractures (e.g. Mount and Suppe Citation1987; Reynolds et al. Citation2005; Heidbach et al. Citation2007; Rajabi et al. Citation2017a, Citation2017b), although in this study, no faults were observed on the image at c. 940 m and c. 1130 m md.
The change from a general W–E direction to a NW–SE direction in present day mean SHmax azimuth at c. 1130 m md (918 m TVDss) occurs near the top of the Late Cretaceous Tangaruhe Formation interval (1122.50–1171.40 m md, 910.50–959.40 m TVDss; ECEV III Ltd Citation2012) in Ranui-2. This change in azimuth may be related to a change in lithology, such as a change in grain size, clay content, or rock strength (Bruno and Winterstein Citation1994). The Tangaruhe Formation is a weakly to moderately indurated, interbedded fine sandstone and mudstone of probable turbidite origin (ECEV III Ltd Citation2012). Underlying this, is the Springhill Formation, a moderately indurated mudstone-dominated formation, with thick sandstone beds (ECEV III Ltd Citation2012). Overlying the Tangaruhe Formation is the Whangai Formation, typically a massive to weakly bedded siliceous siltstone of Late Cretaceous to Paleocene age (ECEV III Ltd Citation2012). It is possible that the comparatively more-indurated nature of the older Tangaruhe and Springhill formations have affected the breakout direction in the borehole.
The mean SHmax azimuth associated with the change in borehole deviation at c. 940 m md, to >10°, occurs within the Whangai Formation (901.40–1122.50 m md, 689.40–910.50 m TVDss) in Ranui-2. There is little change in the siltstone-dominated lithology of the formation down the well (ECEV III Ltd Citation2012), suggesting that the change in the mean SHmax azimuth direction related to the change in deviation at c. 940 m md, is not related to lithology.
Fractures and SHmax
Integrating core with the image log provides a means of ‘ground-truthing’ the image interpretation (Luthi Citation1990; Genter et al. Citation1997; Went and Fisher Citation1999). Most of the fractures in Ranui-2 have been interpreted as being open, based on their low resistivity (conductive) and dark appearance on the image log. Core was obtained over three intervals in the borehole, between 921–927 m md, 1059–1061.07 m md, and 1377.10–1383.10 m md (ECEV III Ltd Citation2012). Analysis of core #1, comprising of siltstone, shows most of the visible fractures are open, are not filled by drilling mud or other sediments, and show no sign of healing mineralisation (ECEV III Ltd Citation2012). Core #2 and most of core #3 are too fractured to be able to determine whether the fractures were open or filled, however photographs of the slabbed core in ECEV III Ltd (Citation2012) suggest that the fractures are open. As the majority of fractures in the borehole have a NE–SW strike, and are oblique to the present day SHmax (), it is possible that other factors such as material anisotropy (e.g. stratigraphic layering of different lithologies) or local stresses and strains (Bruno and Winterstein Citation1994) within or around the borehole are affecting the fractures, although this was not assessed during this study.
Above c. 940 m md (728 m TVDss), where the borehole is vertical, some of the W–E-trending fractures would probably allow fluid flow through the rock, as the fractures are (a) likely to be open, based on image log interpretation and core analysis, and (b) parallel to the mean W–E SHmax azimuth direction above c. 1130 m md, possibly allowing fracture permeability () (Barton et al. Citation1995, Citation2009; Finkbeiner et al. Citation1997).
By comparing fracture set (i) with the mean SHmax azimuth orientation interval above 1130 m md, it appears that most of the fractures are parallel with the mean present-day SHmax orientation. Fracture sets (ii) and (iv) are perpendicular to both (above and below c. 1130 m md) present-day mean SHmax orientations (), which may suggest possible restricted fluid flow, even though the fractures have been interpreted as being open. For fracture set (iii), there is no dominant fracture strike direction, although the full low resistivity fractures display a minor N–S orientation. This N–S fracture orientation is perpendicular to the mean SHmax azimuth obtained for the interval above c. 1130 m md, again suggesting possible restricted fluid flow through the rock. Laubach et al. (Citation2004) found that narrow cement bridges within otherwise open fractures parallel or sub-parallel to SHmax, could account for their resistance to closure, however analysis of the Ranui-2 core does not support this theory (ECEV III Ltd Citation2012). Another possibility is that the nearby active strike-slip Carterton fault is affecting the present day in-situ stress occurring in Ranui-2.
The fractures identified within the individual formations were also compared to the mean SHmax of the borehole, to see if there are any relationships. Fractures within the middle Miocene Karamu Sandstone have a mean W–E to NW–SE strike orientation, similar to the mean present day SHmax of the borehole (128° ± 29°, ). This would suggest that the fractures in the Karamu Sandstone are open, and maybe good conduits for fluid flow. The sandstone lies in the vertical part of the borehole, so the in-situ stress is unlikely to be affected by any deviation effects.
Figure 9. Proportionally scaled rose diagrams showing the present-day mean SHmax azimuth direction and fracture strike orientations for the fractures identified in the formations in the imaged interval in Ranui-2. The mean SHmax was determined from borehole breakouts identified from the imaged interval in borehole Ranui-2, using the circular statistical method of Heidbach (Citation2016a). Low resistivity fractures are in dark grey (full sinusoids) and black (partial sinusoids). High resistivity fractures are in white (full sinusoids) and pale grey (partial sinusoids).
In contrast, fractures within the underlying Late Cretaceous Whangai, and mid-Cretaceous Tangaruhe and Springhill formations all display a general NE–SW strike orientation (), which is almost perpendicular to both the overall mean present day SHmax for the well, and the mean present day SHmax of 142° (±11°) below c. 1130 m md (918 m TVDss; and ). While most of the fractures are thought to be open due to their dark, low-resistive appearance on the image logs, they are not parallel to the SHmax. It is possible that obliqueness to SHmax (Laubach et al. Citation2004), possible clay smear in the fractures (although this was not evident in what little core was obtained), mineralisation within the fractures (again, not evident in the core) (Laubach et al. Citation2004), or that the fractures are the result of episodic changes in fluid pressure in excess of hydrostatic (Laubach Citation1988) may inhibit fluid flow.
In-situ stress and regional tectonics
Patterns in present-day stress in sedimentary basins can provide valuable information on the sources of stress (Heidbach et al. Citation2007; Rajabi et al. Citation2017b).
The East Coast Basin lies within the active Hikurangi subduction margin, where deformation has included shortening, extension, vertical-axis rotation, and strike-slip faulting in the upper plate, all of which occurred over the last ∼24 Myr (Nicol et al. Citation2002, Citation2007; Wallace et al. Citation2004; Townend et al. Citation2012). There is clear evidence that in southeast North Island the present-day plate margin strain partitions into a western strike-slip dominated zone and an eastern zone of compressional deformation, and that the organisation of such partitioning has varied through the Neogene (Cashman et al. Citation1992; Beanland et al. Citation1998; Nicol et al. Citation2002, Citation2007). This may account for the differences in fracture and in-situ stress directions in the Ranui-2 borehole.
The location of Ranui-2 borehole is within a zone of strike-slip dominated faulting, as shown by the nearby active strike-slip Carterton Fault (Lee and Begg Citation2002). The Carterton Fault is one of few faults in the onshore East Coast Basin that are oriented ENE–WSW, parallel to the present-day relative plate motion vector, and oblique to other faults in the basin, which are margin parallel, and align with the NE–SW-trending North Island Dextral Fault Belt (Beanland et al. Citation1998; Lee and Begg Citation2002; Schermer et al. Citation2004). Few studies are published on the origin and timing of the Carterton Fault, which Carne et al. (Citation2011) suggest is a dextral splay fault that has bifurcated off the northern section of the Wairarapa Fault. It is possible that the Carterton Fault may be younger than other faults in the basin, since it is parallel to the relative plate motion vector (Carne et al. Citation2011; Litchfield et al. Citation2014). The Carterton Fault may also account for the differences in fracture and present day in-situ stress directions in the well, due to its associated strain patterns in an otherwise complex structural zone, affecting the borehole (Cashman et al. Citation1992; Nicol et al. Citation2002, Citation2007). In a regional sense, the 128° SHmax direction from borehole breakouts in Ranui-2 is oblique to the strike of the Carterton Fault (). It is unlikely that the fault is affecting SHmax in the upper vertical (<10°) part of the borehole (down to c. 940 m md, c. 728 m TVDss). However, lower down in the borehole, where deviation is >10°, it is possible that either the vertical stress is influencing the locations of the induced features on the borehole wall, and/or nearby strike-slip faults e.g. Carterton, Masterton, and/or Wairarapa faults, are affecting the present day in-situ stress in the lower deviated section of the borehole, due to the complex nature of the nearby North Island Dextral Fault Belt (Darby and Beanland Citation1992; Beanland et al. Citation1998; Nicol et al. Citation2002; Wallace et al. Citation2004; Carne et al. Citation2011; Litchfield et al. Citation2014).
Figure 10. Rose histogram showing the proportionally scaled fracture strike orientations for the fractures above and below c. 918 m TVDss (c. 1130 m md) in borehole Ranui-2, based on the change in SHmax azimuths determined from the borehole breakouts. Note the greater spread in strike orientations for the fractures above c. 918 m TVDss. The in-situ stress directions for the same depth intervals are shown by the black arrows on the map. The active and inactive mapped faults in the Wairarapa area from Lee and Begg (Citation2002). The inset map shows the SHmax direction from focal mechanisms and plate motion data (yellow arrows) from Townend et al. (Citation2012), and the current geodetic direction (blue arrows) of the onshore East Coast Basin from Wallace et al. (Citation2004).
The mean SHmax azimuth from Ranui-2 is generally consistent with the present-day SHmax direction for this sector of the Hikurangi margin, as obtained from the earthquake focal mechanisms and plate motion data of Townsend et al. (Citation2012), shown in Heidbach et al. (Citation2016b) (), and parallel to the regional stress orientation (Townsend et al. Citation2012; Heidbach et al. Citation2016b). Existing stress data in the WSM shows that further north from Ranui-2, the SHmax azimuths obtained from focal mechanisms (e.g. Townend et al. Citation2012) start to rotate, and the stress regimes change from an unknown stress regime at Ranui-2, to normal- and thrust-faulted regimes to the north-west and north, respectively (Heidbach et al. Citation2016b). This difference in the change in mean SHmax azimuth direction from the southern parts to the northern parts of the basin is most likely due to the basin-wide complex plate tectonics occurring in the East Coast Basin (Nicol et al. Citation2002, Citation2007; Wallace et al. Citation2004; Townend et al. Citation2012).
Conclusions
This study highlights the utility of subsurface image log data sets in constraining subsurface in-situ stress conditions, and presenting present-day stress (SHmax azimuth orientation) data for part of the onshore southern East Coast Basin. Borehole breakouts identified in the image logs acquired in Ranui-2 have been used to determine the subsurface mean present day SHmax orientation. The data show that there are two mean SHmax orientations, above and below c. 1130 m md (c. 918 m TVDss), at 089° (±14°) and 142° (±11°), respectively. Fracture sets identified in the imaged interval show different fracture strike directions, with fracture set (i) equating to most of the middle Miocene interval, striking W–E to NW–SE, whereas fracture sets (ii) and (iv), comprising most of the Late and mid-Cretaceous intervals, have a general NE–SW fracture strike orientation. The overall mean present-day SHmax orientation for Ranui-2 fits with the regional SHmax orientation derived from earthquake focal mechanisms and plate motion data for the onshore southern East Coast Basin.
In this study, it was have found that stress directions in Ranui-2 change above and below c. 1130 m md (918 m TVDss). This depth is just below the change in deviation (from vertical to 25°) in the borehole. This change in stress direction could be related to:
Changes in lithology, bedding, structure, etc within the borehole, which can manifest the stress orientation in different ways e.g. changes in stratigraphic layering can reorient the principal stress direction if the rock is anisotropic,
Influence of surface faults which affect the in-situ stress orientation locally within the borehole.
The southern onshore East Coast Basin has experienced a complex deformation history as part of the active Hikurangi subduction margin, which may account for the difference in fracture strike directions and present-day SHmax orientations in Ranui-2. This study illustrates the local conditions and effects in the borehole, whereas first motion studies (e.g. Townend et al. Citation2012) reflect larger scale effects in a more regional setting. Further study is needed to account for the deviation effects, if any, in borehole Ranui-2, including determining the remaining stress tensor components (Sv, SHmax and Shmin magnitudes).
Structural Summary Plot
Download PDF (4.5 MB)Supplementary material
Download MS Word (24.3 KB)Acknowledgements
This study was undertaken as part of the Petroleum Basins Research Programme via Strategic Science Investment Funding from the New Zealand Government (Ministry of Business, Innovation and Employment) to GNS Science. East Coast Energy Ventures are thanked for running the imaging tool in Ranui-2, and making the data publicly available and commenting on an early version of the manuscript. Mark Lawrence, Cécile Massiot, and Kyle Bland (GNS Science) are thanked for their comments and discussion. Cécile is also thanked for her assistance with the Landmark RecallTM Sigma module. Greg Browne and Mark Lawrence (GNS Science) are thanked for reviewing the manuscript. Thanks also go to Mojtaba Rajabi and David McNamara, who critically reviewed the manuscript.
Disclosure statement
No potential conflict of interest was reported by the author.
ORCID
Angela G. Griffin http://orcid.org/0000-0002-1406-6209
Additional information
Funding
Related Research Data
References
- Aadnoy BS. 1990. In-situ stress directions from borehole fracture traces. Journal of Petroleum Science and Engineering. 4:143–153. doi: 10.1016/0920-4105(90)90022-U
- Allis RG, Zhan X, Evans C, Kroopnick P. 1997. Groundwater flow beneath Mt Taranaki, New Zealand, and implications for oil and gas migration. New Zealand Journal of Geology and Geophysics. 40:137–149. doi: 10.1080/00288306.1997.9514748
- Aydin A. 2000. Fractures, faults, and hydrocarbon entrapment, migration and flow. Marine and Petroleum Geology. 17:797–814. doi: 10.1016/S0264-8172(00)00020-9
- Bailleul J, Chanier F, Ferrière J, Robin C, Nicol A, Mahieux G, Gorini C, Caron V. 2013. Neogene evolution of lower trench-slope basins and wedge development in the central Hikurangi subduction margin, New Zealand. Tectonophysics. 591:152–174. doi: 10.1016/j.tecto.2013.01.003
- Ballance PF. 1976. Evolution of the upper Cenozoic magmatic arc and plate boundary in north New Zealand. Earth and Planetary Science Letters. 28:356–370. doi: 10.1016/0012-821X(76)90197-7
- Barnes PM, Mercier de Lépinay BM. 1997. Rates and mechanics of rapid frontal accretion along the very obliquely convergent southern Hikurangi margin, New Zealand. Journal of Geophysical Research: Solid Earth. 102:24931–24952. doi: 10.1029/97JB01384
- Barton CA, Moos D. 2010. Geomechanical wellbore imaging: key to managing the asset life cycle. In: Pöppelreiter M, Carcía-Carballido C, Kraaijveld M, editors. Dipmeter and borehole image log technology. Tulsa, OK: American Association of Petroleum Geologists Memoir 92; p. 81–112.
- Barton CA, Moos D, Peška P, Zoback MD. 1997. Utilizing wellbore image data to determine the complete stress tensor: application to permeability anisotropy and wellbore stability. Log Analyst. 38:21–33.
- Barton CA, Moos D, Tezuka K. 2009. Geomechanical wellbore imaging: implications for reservoir fracture permeability. AAPG Bulletin. 93(11):1551–1569. doi: 10.1306/06180909030
- Barton CA, Zoback MD, Moos D. 1995. Fluid flow along potentially active faults in crystalline rock. Geology. 23(8):683–686. doi: 10.1130/0091-7613(1995)023<0683:FFAPAF>2.3.CO;2
- Beanland S. 1995. The North Island dextral fault belt, Hikurangi subduction margin, New Zealand, Unpublished Ph.D. thesis, Victoria Univ. of Wellington, Wellington New Zealand. 341 p.
- Beanland S, Haines AJ. 1998. The kinematics of active deformation in the North Island, New Zealand, determined from geological strain rates. New Zealand Journal of Geology and Geophysics. 41:311–323. doi: 10.1080/00288306.1998.9514813
- Beanland S, Melhuish A, Nicol A, Ravens J. 1998. Structure and deformational history of the inner forearc region, Hikurangi subduction margin, New Zealand. New Zealand Journal of Geology and Geophysics. 41:325–342. doi: 10.1080/00288306.1998.9514814
- Bell JS. 1990. Investigating stress regimes in sedimentary basins using information from oil industry wireline logs and drilling records. In: Hurst MA, Lovell MA, Morton AC, editors. Geological application of wireline logs. London: Geological Society, Special Publication 48; p. 305–325.
- Bell JS, Gough DI. 1979. Northeast-southwest compressive stress in Alberta evidence from oil wells. Earth and Planetary Science Letters. 45:475–482. doi: 10.1016/0012-821X(79)90146-8
- Biros D, Cuevas R, Moehl B. 1995. Well completion report, Titihaoa-1. PPL 38318. New Zealand Unpublished Openfile Petroleum Report PR 2081. 1096 p + 13 enclosures.
- Bland KJ, Uruski CI, Isaac MJ. 2015. Pegasus Basin, eastern New Zealand: a stratigraphic record of subsidence, subduction, ancient and modern. New Zealand Journal of Geology and Geophysics. 58:319–343. doi: 10.1080/00288306.2015.1076862
- BP Shell Aquitaine Todd Petroleum Developments Ltd. 1976. Well completion report Hawke Bay-1. New Zealand Unpublished Openfile Petroleum Report PR 667. 191 p + 8 enclosures.
- Bruno MS, Winterstein DF. 1994. Some influences of stratigraphy and structure on reservoir stress orientation. Geophysics. 59:954–962. doi: 10.1190/1.1443655
- Carne RC, Little TA, Rieser U. 2011. Using displaced river terraces to determine Late Quaternary slip rate for the central Wairarapa Fault at Waiohine River, New Zealand. New Zealand Journal of Geology and Geophysics. 54:217–236. doi: 10.1080/00288306.2010.532224
- Cartwright J, Huuse M, Aplin A. 2007. Seal bypass systems. AAPG Bulletin. 91(8):1141–1166. doi: 10.1306/04090705181
- Cashman SM, Kelsey HM, Erdman CF, Cutten HNC, Berryman KR. 1992. Strain partitioning between structural domains in the forearc of the Hikurangi subduction zone, New Zealand. Tectonics. 11:242–257. doi: 10.1029/91TC02363
- Darby DJ, Beanland S. 1992. Possible source models for the 1855 Wairarapa Earthquake, New Zealand. Journal of Geophysical Research. 97:12375–12389. doi: 10.1029/92JB00567
- Davatzes NC, Hickman SH. 2010. Stress, fracture, and fluid-flow analysis using acoustic and electrical image logs in hot fractured granites of the Coso geothermal field, California, USA. In: Pöppelreiter M, García-Carballido C, Kraaijveld M, editors. Dipmeter and borehole image log technology. Tulsa, OK: American Association of Petroleum Geologists Memoir 92; p. 259–293.
- DeMets C, Gordon RG, Argus DF, Stein S. 1990. Current plate motions. Geophysical Journal International. 101:425–478. doi: 10.1111/j.1365-246X.1990.tb06579.x
- DeMets C, Gordon RG, Argus DF, Stein S. 1994. Effects of recent revisions to the geomagnetic reversal time scale on estimates of current plate motions. Geophysical Research Letters. 21:2191–2194. doi: 10.1029/94GL02118
- ECEV III Ltd. 2012. Ranui-2 Well Completion Report. New Zealand Unpublished Openfile Petroleum Report PR4548: 265 p, 3 enclosures.
- Finkbeiner T, Barton CA, Zoback MD. 1997. Relationships among in-situ stress, fractures and faults, and fluid flow: Monterey Formation, Santa Maria Basin, California. American Association of Petroleum Geologists Bulletin. 81:1975–1999.
- García-Carballido C, Boon J, Tso N. 2010. Data management and quality control of dipmeter and borehole image log data. In: Pöppelreiter M, García-Carballido C, Kraaijveld M, editors. Dipmeter and borehole image log technology. Tulsa, OK: American Association of Petroleum Geologists Memoir 92; p. 39–49.
- Genter A, Castaing C, Dezayes C, Tenzer H, Traineau H, Villemin T. 1997. Comparative analysis of direct (core) and indirect (borehole imaging tools) collection of fracture data in the Hot Dry Rock Soultz reservoir (France). Journal of Geophysical Research: Solid Earth. 102:15419–15431. doi: 10.1029/97JB00626
- Griffin AG. 2018. Structural interpretation of borehole image logs from onshore southern East Coast Basin wells. GNS Science Report 2017/47. 101 p, 6 enclosures. http://shop.gns.cri.nz/sr_2017-047-pdf/.
- Hansen B, Buczak J. 2010. Making interpretable images from image logs. In: Pöppelreiter M, García-Carballido C, Kraaijveld M, editors. Dipmeter and borehole image log technology. Tulsa, OK: American Association of Petroleum Geologists Memoir 92; p. 51–66.
- Heidbach O, editor. 2016a. World Stress Map Scientific Technical Report 16-01. World Stress Map 2016. 55 p.
- Heidbach O, Rajabi M, Reiter K, Ziegler M, WSM Team. 2016b. World stress map database release 2016. GFZ Data Services. doi:10.5880/WSM.2016.001.
- Heidbach O, Reinecker J, Tingay M, Müller B, Sperner B, Fuchs K, Wenzel F. 2007. Plate boundary forces are not enough: second- and third-order stress patterns highlighted in the World Stress Map database. Tectonics. 26:TC6014: p. 1–19. doi: 10.1029/2007TC002133
- Hickman SH, Healy JH, Zoback MD. 1985. In situ stress, natural fracture distribution, and borehole elongation in the Auburn geothermal well, Auburn, New York. Journal of Geophysical Research: Solid Earth. 90(B7):5497–5512. doi: 10.1029/JB090iB07p05497
- Hillis RR, Reynolds SD. 2000. The Australian stress map. Journal of the Geological Society. 157:915–921. doi: 10.1144/jgs.157.5.915
- [IGNS] Institute of Geological & Nuclear Sciences Ltd. 2005. Reservoir rock potential of the East Coast Basin (central and northern subregions). New Zealand Unpublished Openfile Petroleum Report PR3180: 154 p.
- Ilg BR, Hemmings-Sykes S, Nicol A, Baur J, Fohrmann M, Funnell R, Milner M. 2012. Normal faults and gas migration in an active plate boundary, southern Taranaki Basin, offshore New Zealand. AAPG Bulletin. 96:1733–1756. doi: 10.1306/02011211088
- Kamp PJ. 1999. Tracking crustal processes by FT thermochronology in a forearc high (Hikurangi margin, New Zealand) involving Cretaceous subduction termination and mid-Cenozoic subduction initiation. Tectonophysics. 307:313–343. doi: 10.1016/S0040-1951(99)00102-X
- Lagraba PJO, Hansen SM, Spalburg M, Helmy M. 2010. Borehole image tool design, value of information, and tool selection. In: Pöppelreiter M, Carcía-Carballido C, Kraaijveld M, editors. Dipmeter and borehole image log technology. Tulsa, OK: American Association of Petroleum Geologists Memoir 98; p. 15–38.
- Lamb S. 2011. Cenozoic tectonic evolution of the New Zealand plate-boundary zone: a paleomagnetic perspective. Tectonophysics. 509:135–164. doi: 10.1016/j.tecto.2011.06.005
- Langridge RM, Ries WF, Litchfield NJ, Villamor P, Van Dissen RJ, Barrell DJA, Rattenbury MS, Heron DW, Haubrock S, Townsend DB, et al. 2016. The New Zealand active faults database. New Zealand Journal of Geology and Geophysics. 59:86–96. doi: 10.1080/00288306.2015.1112818
- Laubach SE. 1988. Subsurface fractures and their relationship to stress history in East Texas basin sandstone. Tectonophysics. 156:37–49. doi: 10.1016/0040-1951(88)90281-8
- Laubach SE, Olson JE, Gale JFW. 2004. Are open fractures necessarily aligned with maximum horizontal stress? Earth and Planetary Science Letters. 222:191–195. doi: 10.1016/j.epsl.2004.02.019
- Lee JM, Begg JG. 2002. Geology of the Wairarapa area. Institute of Geological and Nuclear Sciences 1:250 000 geological map, 11. Institute of Geological and Nuclear Sciences Ltd, Lower Hutt, New Zealand. 66 p + 1 map.
- Litchfield NJ, Van Dissen R, Sutherland R, Barnes PM, Cox SC, Norris R, Beavan RJ, Langridge R, Villamor P, Berryman K, et al. 2014. A model of active faulting in New Zealand. New Zealand Journal of Geology and Geophysics. 57:32–56. doi: 10.1080/00288306.2013.854256
- Luthi SM. 1990. Sedimentary structures of clastic rocks identified from electrical borehole images. In: Hurst MA, Lovell MA, Morton AC, editors. Geological application of wireline logs. London: Geological Society, Special Publication 48; p. 3–10.
- Mardia KV. 1972. Statistics of directional data: probability and mathematical statistics. London: Academic Press. 357 p.
- Massiot C, Townend J, Nicol A, McNamara DD. 2017. Statistical methods of fracture characterisation using acoustic borehole televiewer log interpretation. Journal of Geophysical Research: Solid Earth. 122:6836–6852.
- McNamara DD, Massiot C, Lewis B, Wallis IC. 2015. Heterogeneity of structure and stress in the Rotokawa Geothermal Field, New Zealand. Journal of Geophysical Research: Solid Earth. 120:1243–1262.
- McNamara DD, Massiot C, Milicich SM. 2017. Characterizing the subsurface structure and stress of New Zealand’s geothermal fields using borehole images. Energy Procedia. 125:273–282. doi: 10.1016/j.egypro.2017.08.176
- Moore PR. 1988a. Structural divisions of eastern North Island. New Zealand Geological Survey Record 30. 24 p.
- Moore PR. 1988b. Stratigraphy, composition and environment of deposition of the Whangai Formation and associated Late Cretaceous–Paleocene rocks, eastern North Island, New Zealand. New Zealand Geological Survey Bulletin 100. 82 p.
- Moretti I. 1998. The role of faults in hydrocarbon migration. Petroleum Geoscience. 4:81–94. doi: 10.1144/petgeo.4.1.81
- Mortimer N. 2018. Evidence for a pre-Eocene proto-Alpine Fault through Zealandia. New Zealand Journal of Geology and Geophysics. 61:251–259. doi: 10.1080/00288306.2018.1434211
- Mount VS, Suppe J. 1987. State of stress near the San Andreas Fault: implications for wrench tectonics. Geology. 15:1143–1146. doi: 10.1130/0091-7613(1987)15<1143:SOSNTS>2.0.CO;2
- Nicol A, Beavan RJ. 2003. Shortening of an overriding plate and its implications for slip on a subduction thrust, central Hikurangi Margin, New Zealand. Tectonics. 22:1070. doi:10.1029/2003TC001521.
- Nicol A, Mazengarb C, Chanier F, Rait G, Uruski C, Wallace L. 2007. Tectonic evolution of the active Hikurangi subduction margin, New Zealand, since the Oligocene. Tectonics. 26:TC4002. doi:10.1029/2006TC002090.
- Nicol A, van Dissen R, Vella P, Alloway B, Melhuish A. 2002. Growth of contractional structures during the last 10 m.y. at the southern end of the emergent Hikurangi forearc basin, New Zealand. New Zealand Journal of Geology and Geophysics. 45:365–385. doi: 10.1080/00288306.2002.9514979
- Nie X, Zou C, Pan L, Huang Z, Liu D. 2013. Fracture analysis and determination of in-situ stress direction from resistivity and acoustic image logs and core data in the Wenchuan Earthquake Fault Scientific Drilling Borehole-2 (50–1370 m). Tectonophysics. 593:161–171. doi: 10.1016/j.tecto.2013.03.005
- [NZEC] New Zealand Energy Corporation. 2012a. Stratigraphic Wells Orui-1 & 1A Well Completion Report. New Zealand Unpublished Openfile Petroleum Report PR 4657. 249 p + 5 enclosures.
- [NZEC] New Zealand Energy Corporation. 2012b. Stratigraphic Wells Te Mai-1 & 2 Well Completion Report, PEP 52694. New Zealand Unpublished Openfile Petroleum Report PR 4658. 289 p + 4 enclosures.
- Peška P, Zoback MD. 1995. Compressive and tensile failure of inclined well bores and determination of in situ stress and rock strength. Journal of Geophysical Research: Solid Earth. 100(B7):12791–12811. doi: 10.1029/95JB00319
- Plumb RA, Hickman SH. 1985. Stress-induced borehole elongation: a comparison between the four-arm dipmeter and the borehole televiewer in the Auburn geothermal well. Journal of Geophysical Research: Solid Earth. 90(B7):5513–5521. doi: 10.1029/JB090iB07p05513
- Prensky SE. 1999. Advantages in borehole imaging technology and applications. In: Lovell MA, Williamson G, Harvey PK, editors. Borehole imaging: applications and case histories. London: Geological Society, Special Publication 159; p. 1–43.
- Prioul R, Jocker J. 2009. Fracture characterization at multiple scales using borehole images, sonic logs, and walkaround vertical seismic profile. AAPG Bulletin. 93(11):1503–1516. doi: 10.1306/08250909019
- Rait G, Chanier F, Waters DW. 1991. Landward- and seaward-directed thrusting accompanying the onset of subduction beneath New Zealand. Geology. 19:230–233. doi: 10.1130/0091-7613(1991)019<0230:LASDTA>2.3.CO;2
- Rajabi M, Sherkati S, Bohloli B, Tingay M. 2010. Subsurface fracture analysis and determination of in-situ stress direction using FMI logs: an example from the Santonian carbonates (Ilam Formation) in the Abadan Plain, Iran. Tectonophysics. 492:192–200. doi: 10.1016/j.tecto.2010.06.014
- Rajabi M, Tingay M, Heidbach O, Hillis R, Reynolds S. 2017a. The present-day stress field of Australia. Earth-Science Reviews. 168:165–189. doi: 10.1016/j.earscirev.2017.04.003
- Rajabi M, Tingay M, King R, Heidbach O. 2017b. Present-day stress orientation in the Clarence-Moreton Basin of New South Wales, Australia: a new high density dataset reveals local stress rotations. Basin Research. 29:622–640. doi: 10.1111/bre.12175
- Rajabi M, Ziegler M, Tingay M, Heidbach O, Reynolds S. 2016. Contemporary tectonic stress pattern of the Taranaki Basin, New Zealand. Journal of Geophysical Research: Solid Earth. 121:6053–6070.
- Reynolds SD, Mildren SD, Hillis RR, Meyer JJ, Flottman T. 2005. Maximum horizontal stress orientations in the Cooper Basin, Australia: implications for plate-scale tectonics and local stress sources. Geophysical Journal International. 160:331–343.
- Rider M. 1996. The geological interpretation of well logs. Caithness: Whittles Publishing. 280 p.
- Schermer ER, Van Dissen R, Berryman KR, Kelsey HM, Cashman SM. 2004. Active faults, paleoseismology, and historical fault rupture in northern Wairarapa, North Island, New Zealand. New Zealand Journal of Geology and Geophysics. 47:101–122. doi: 10.1080/00288306.2004.9515040
- Schlumberger. 1986. Formation MicroScanner. Marketing Brochure. 8 p.
- Sibson RH. 1996. Structural permeability of fluid-driven fault-fracture meshes. Journal of Structural Geology. 18(8):1031–1042. doi: 10.1016/0191-8141(96)00032-6
- Stern TA, Stratford WR, Salmon ML. 2006. Subduction evolution and mantle dynamics at a continental margin: Central North Island, New Zealand. Reviews of Geophysics. 44(4):36. doi: 10.1029/2005RG000171
- Tap Oil Limited. 2004. Tawatawa-1 well completion report. New Zealand Unpublished Openfile Petroleum Report PR 3067. 873 p.
- Townend J, Sherburn S, Arnold R, Boese C, Woods L. 2012. Three-dimensional variations in present-day tectonic stress along the Australia-Pacific plate boundary in New Zealand. Earth and Planetary Science Letters. 353–354:47–59. doi: 10.1016/j.epsl.2012.08.003
- Walcott RI. 1989. Paleomagnetically observed rotations along the Hikurangi margin of New Zealand. In: Kissel C, Laj C, editors. Paleomagnetic rotations and continental deformation. Dordrecht, Netherlands: Kluwer Academic. NATO ASI series. Series C, Mathematical and Physical Sciences 254; p. 459–471.
- Wallace L, Beavan J, McCaffrey R, Darby D. 2004. Subduction zone coupling and tectonic block rotations in the North Island, New Zealand. Journal of Geophysical Research: Solid Earth. 109:1–21. doi: 10.1029/2003JB002481
- Webster M, O’Connor S, Pindar B, Swarbrick R. 2011. Overpressures in the Taranaki Basin: distribution, causes, and implications for exploration. AAPG Bulletin. 95(3):339–370. doi: 10.1306/06301009149
- Went DJ, Fisher WC. 1999. Stratigraphic relationships in the upper Rotliegend: interpretations from horizontal and vertical well borehole images, core and logs in the Lancelot area, Southern North Sea, UK. In: Lovell MA, Williamson G, Harvey PK, editors. Borehole imaging: applications and case histories. London: Geological Society, Special Publication 159; p. 139–153.
- Zoback MD. 2007. Reservoir geomechanics. Cambridge: Cambridge University Press, 448 p.
- Zoback MD, Barton CA, Brudy M, Castillo DA, Finkbeiner T, Grollimund BR, Moos DB, Peska P, Ward CD, Wiprut DJ. 2003. Determination of stress orientation and magnitude in deep wells. International Journal of Rock Mechanics and Mining Sciences. 40:1049–1076. doi: 10.1016/j.ijrmms.2003.07.001
- Zoback MD, Moos D, Mastin L, Anderson RN. 1985. Well bore breakouts and in situ stress. Journal of Geophysical Research: Solid Earth. 90:5523–5530. doi: 10.1029/JB090iB07p05523
- Zoback ML, Zoback M. 1989. Tectonic stress field of the conterminous United States. In: Pakiser LC, Mooney WD, eds. Geophysical framework of the continental United States. Boulder, CO: Geological Society of America, Memoir 172; p. 523–539.