
ABSTRACT
The Hauraki Goldfield of the Coromandel Volcanic Zone (CVZ) hosts up to 50 adularia-sericite epithermal Au-Ag deposits that young towards the southeast and align within NNE-to-NE trending structural corridors. We jointly interpret regional aeromagnetic data and a compilation of available geological data to identify structures that have influenced mineralisation. Systematic processing of aeromagnetic data and ‘worming’ edge detection provides a means of linking deep-seated aeromagnetic patterns with surface geology. The > 80 km long NNW-trending Whangamata-Coromandel lineament that persists to > 3 km depth and the NW-SE-trending Martha-Thames lineament are spatially linked to zones of hydrothermal alteration and epithermal deposits. Similar correlations are seen with deeply sourced NNE-trending lineaments contiguous with shallow sourced anomalies here interpreted as fault-angle basins. Our results are consistent with a model in which inherited basement fabrics appear to have influenced the late Miocene-to-Present tectonic segmentation of the CVZ, with implications for the localisation of epithermal mineralisation.
Introduction
Crustal-scale tectonic structures such as faults, shear zones and lithostratigraphic boundaries play a fundamental role in the distribution of many hydrothermal deposits (Henley and Admas Citation1992; Groves et al. Citation1998). These structures provide sustained, although potentially episodic, pathways for fluid transport (Hildenbrand et al. Citation2000), most likely because they represent crustal scale weaknesses that remain favourable for reactivation (Sibson Citation1985). They may exist as discrete structures or more distributed deformation zones that have a strike length of up to hundreds, and in some cases, thousands of kilometres (e.g. the New York-Alabama lineament; King and Zietz Citation1978).
Structural inheritance and the reactivation of pre-existing crustal features have long been considered fundamental controls on the evolution of upper-crustal geological structures (Butler et al. Citation2006). Pre-existing fault and shear zones reactivate, with respect to the evolving stress regime (Daly et al. Citation1989), because they possess long-term mechanical weakness relative to the surrounding intact crust or lithosphere (White et al. Citation1986). Such large-scale fabrics, therefore, can play a primary control on location and architecture of structures such as rifted basins (Daly et al. Citation1989), and on heat and mass transfer (Roots and Thompson Citation1989) including the spatial distribution of hydrothermal mineralisation (e.g. Crafford and Grauch Citation2002).
Regional crustal-scale faults and shear zones can be obscured by sedimentary and volcanic cover or are not always apparent from detailed mapping of isolated surface exposures, especially in vegetated terrains (Austin and Blenkinsop Citation2008). Because of their proclivity to reactivate even when not optimally oriented, their geometry may vary from that of shallower crustal structures that form in overlying cover sequences (Butler Citation1989). Therefore, despite the recognition that regional-scale faults are long-lived and prone to reactivation, they may be difficult to recognise. Their spatial and temporal evolution and control on surface processes require comprehensive geological, geophysical and geochemical studies (Holsworth et al. Citation1997).
The Hauraki Goldfield of the Coromandel Volcanic Zone (CVZ) is New Zealand’s premier district for epithermal Au-Ag deposits, hosting >50 known epithermal deposits (Christie et al. Citation2007). Considerable research has been undertaken in the region with the purpose of resolving volcano-magmatic-epithermal evolution (e.g. Mauk et al. Citation2011), tectonic evolution (Spörli Citation1987; King Citation2000) and deposit scale structural controls on mineralisation (Nortje et al. Citation2003; Begbie et al. Citation2007; Mauk et al. Citation2011; Spörli and Cargill Citation2011). Despite these studies, there is a limited understanding of the control of regional-scale structures on the distribution of epithermal deposits of the Hauraki Goldfield. This is partly because of a lack of baseline structural information, due to the paucity of exposure and weathering (Spörli et al. Citation2006), which obscures the relationship that may exist between deposits. The main purpose of this paper, therefore, is to elucidate the control of regional scale structures on the distribution of epithermal mineral deposits in the Hauraki Goldfield.
Magnetic gradients and crustal-scale fabrics
Geophysical methods, in particular, long wavelength magnetic data, have been utilised with good effect to resolve crustal-scale faults and shear zones as sub-linear gradients (Henkel and Guzman Citation1977; Rathore and Hospers Citation1986), which are collectively termed as lineaments. Long wavelength regional anomalies of aeromagnetic data can provide evidence on the abundance and depth continuity of magnetic fabrics to mid-crustal levels, constrained by the Curie temperature (ca. 580°C. for magnetite; Blakely Citation1995) above which minerals lose their magnetisation. Magnetic gradients are caused by changes in magnetic anomalies with varying magnetic susceptibility (or remanence) (Grant Citation1985). Faults and shear zones may juxtapose crustal blocks of contrasting magnetic properties (Gunn et al. Citation1997) or may be associated with enhanced permeability and alteration of rock properties through time (e.g. depletion or concentration of magnetite or silica; Grant Citation1985), which make them identifiable with magnetic data as anomalies or gradients. In some studies, such gradients have shown a spatial coincidence with the distribution of belts or corridors of ore deposits (e.g. O’Driscoll Citation1986; Bierlein et al. Citation2006; Austin and Blenkinsop Citation2008) and volcanic segments (e.g. Petford and Atherton Citation1992). Thus, such magnetic gradients may be plausibly interpreted as magnetic expressions of deep-seated deformation zones that localise upper crustal deformation and processes important to mineralisation.
However, interpretation methodologies are required that allow us to explore the links between deep-seated and shallow geological features. Imaging the correlation between subsurface features and geological phenomenon at the surface enables a better understanding of the genetic relationship, evolution and continuation of geological and structural trends. Vertical and horizontal gradients of magnetic field interpreted from the different crustal levels, using upward continuation techniques (Spector and Grant Citation1970), can be described in terms of lineaments of different magnitude, length, orientation and sinuosity. Comparing and relating these parameters for the lineaments detected at different levels of the crust, that can be automatically picked using worm or edge detection techniques (Holden et al. Citation2000) permits the deduction of regional structures with vertical and horizontal continuity. In addition, overlaying (superimposing) of variously enhanced images of the same magnetic data permits the comparison of features at different crustal levels (Williams and Betts Citation2007). Therefore, through visual inspection and qualitative interpretation of aeromagnetic field response of deep-seated structures, it is possible to link deep structures with the surface or near-surface features such as fault networks, hydrothermal alteration and associated epithermal mineralisation.
Tectonic and geologic setting
Tectonic setting and deformation in northern New Zealand
The North Island of New Zealand has undergone a significant tectonic reorganisation in the last 30 Ma. Several plate reconstruction models have been proposed to explain the possible configuration of the plate boundary since the late Cenozoic (Schellart et al. Citation2006; Mortimer et al. Citation2007). shows a reconstruction model that explain tectonic events from Mid-Miocene to present. The reorganisation of the oblique convergent plate boundary in the North Island, for the most part, was marked by a potential change in the direction of the subducting slab (i.e. from NW-SE to NNE-SSE) and the opening of back-arc basins from ca. 25-to-2 Ma (King Citation2000). The NW-SE oriented convergence at ca. 23 Ma migrated from Northland to the NNE-SSW oriented Colville arc (e.g. Mortimer et al. Citation2007), and then slab rollback (ca. 7 Ma) triggered a rapid SE migration of the arc to the currently active Kermadec Ridge with back-arc rifting in the Havre Trough and its continental extension in the Taupo Volcanic Zone (TVZ) (Wright et al. Citation1996; Wysoczanski et al. Citation2010; Seebeck et al. Citation2014a).
Figure 1. Current tectonic configuration of northern New Zealand annotated with loci of volcanism for three different time periods ± 0.5 Ma (circles: black = 0 Ma; grey = 8 Ma; white = 16 Ma) from Seebeck et al. (Citation2014b), geodetic vectors of extension (double arrows: Wallace et al. Citation2004) and relative plate motion (single arrows: DeMets et al. Citation1994) in mm/year. Dotted line represents a terrane suture in basement rocks as inferred from the Junction Magnetic Anomaly (JMA). Rotation of eastern North Island shown for period 3 Ma to present (Wallace et al., Citation2004). HR = Hauraki Rift; HT = Havre trough; NIFS = North Island Fault System; VMFZ = Vening Meinesz Fracture Zone. TVZ = Taupo Volcanic Zone shown in red, Coromandel Volcanic Zone shown in orange, Northland shown in blue.
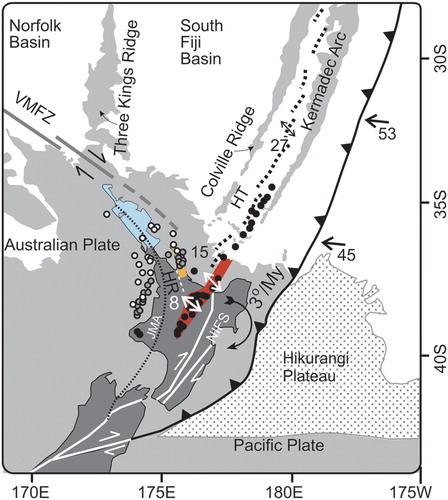
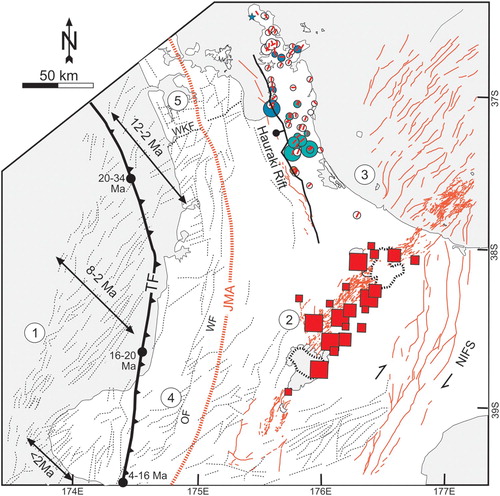
The earlier tectonism, although less well constrained, is critical because it imparts inherited structures (sutures and shear zones) within the Mesozoic basement terranes that may have reactivated (Spörli Citation1987) to localise active deformation and epithermal ore-forming environments in the central North Island, including the CVZ. The NW-to-NNW trending Vening Meinesz Fracture Zone (VMFZ), terrane sutures and crustal boundaries (e.g. the Taranaki Fault and the Hauraki Rift: ) represent the major crustal-scale fabrics that likely reactivate and influence the geometry of the dominant arc-parallel arrays of NE-striking normal faults within the Cenozoic cover sequence that overlies New Zealand’s basement terranes (). This is demonstrated by recent detailed structural studies from the Taranaki Basin (Giba et al. Citation2010), Whakatane Graben (Lamarche et al. Citation2006), and elsewhere in continental North Island (e.g. TVZ; Rowland and Simmons Citation2012), where reactivated NW-trending basement fabrics act as potential transfer zones between discrete fault segments in the younger cover sequence (labelled 1-to 5 in ). Such regional scale inherited structural fabrics are important conduits for fluid flow and appear to control the distribution of hydrothermal mineralisation (e.g. Crafford and Grauch Citation2002). Rowland and Simmons (Citation2012) suggest NW-striking transfer zones in the TVZ coincide with the alignment of some geothermal systems, rhombic caldera structures and young (<61 ka) silicic vents. However, very few studies have investigated the impact of these structures on the localisation of epithermal mineralisation in the CVZ.
Figure 2. Structural architecture of the central North Island showing active faults in red (GNS Science Active Fault database (Lamarche et al. Citation2006), other faults in dashed black lines (Edbrooke Citation2005; Townsend et al. Citation2008; Giba et al. Citation2010), the Taranaki Fault (thick barbed line annotated with position of northern limit of activity through time: Stagpoole and Nicol Citation2008), the Junction Magnetic Anomaly (thick red dashed line). Periods of activity on extensional faults of western North Island are shown after Giba et al. (Citation2010). Position and timing of epithermal mineralisation and geothermal activity shown by green circles and red square polygons respectively. Red lines within green circles are approximate vein directions. Thick black dashed circles are calderas. Locations referred to in the text are numbered in white circles. WKF = Waikato Fault; OF = Ohura Fault, WP = Waipa Fault.
Geologic setting of the CVZ
The geology of the CVZ reflects the punctuated SE-migration of arc volcanism in time and space in response to slab roll-back (Adams et al. Citation1994; Mortimer et al. Citation2010; Booden et al. Citation2012). Andesitic volcanism associated with the Northland arc commenced in the CVZ during the Early Miocene and is preserved in Northern Coromandel. From ca. 16–6.7 Ma (Adams et al. Citation1994), volcanism associated with the Colville Arc manifested onshore within the CVZ and extended discontinuously to continental western North Island along a SW trending Taranaki-Colville-Lau belt (e.g. Mortimer et al. Citation2010). Rhyolitic volcanism commenced ca. 12 Ma coeval with and post-dating andesitic volcanism (Adams et al. Citation1994) and was followed by sporadic basaltic volcanism at ca. 9–7 Ma (Booden et al. Citation2012). Intermittent eruption continued in association with rapid arc migration to the southeast, culminating in a jump to the TVZ ca. 1.95 Ma. Eruptive products from these periods form a volcanic succession that blankets much of the CVZ and thickens to the southeast (Booden et al. Citation2012).
Regional studies have subdivided the late Miocene to early Pleistocene volcanic rocks of CVZ into (1) Early Miocene to Pliocene Coromandel Group andesite, (2) Late Miocene to early Pleistocene Whitianga Group rhyolites, and (3) Late Miocene to early Pliocene Mercury basalts of the Kerikeri Volcanic Group (, ). This volcanic stratigraphy unconformably overlies the Manaia Hill group metasedimentary rocks which were accreted onto the margins of Gondwana during the Mesozoic and which constitute the basement rock in the CVZ. Epithermal ore deposits are predominantly hosted in Coromandel group andesite and dacite, with minor occurrence in Whitianga group rhyolite and meta-sedimentary basement rocks (Christie et al. Citation2007).
Figure 3. Geology of the Hauraki Goldfield and its surrounding areas (scale 1:250,000: Edbrooke Citation2001). Epithermal Au-Ag deposits are indicated by yellow circles, and their size refers to amount of gold production. KOST = Karangahake-Ohui structural trend, TWFZ = Tapu-Whitianga-Fault Zone, THHK = Tairua-Hikuai-Kaueranga Lineament.
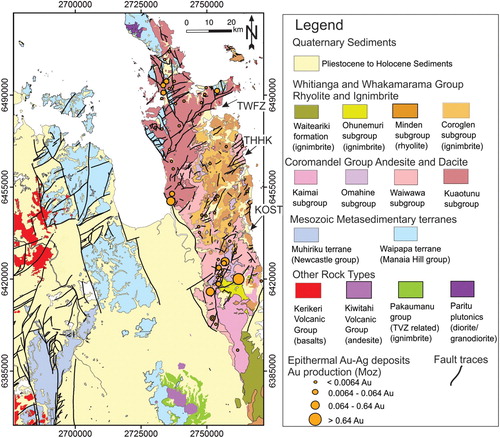
Table 1. Description of major rock types in the CVZ (after, Edbrooke Citation2001).
The CVZ is transected by NNW-to-NW and NNE-to-NE-striking block faults, ranging in scale from fault zones to individual faults of a few hundred metres to several kilometres in length (Skinner Citation1986). These faults are inferred to have developed during amalgamation of basement terranes, with reactivation during subsequent Cretaceous-to-Early Cenozoic rifting (Spörli Citation1987). The NNW-to-NW striking faults are exposed in northern CVZ, and are equally downthrown to the east and west, forming horsts and grabens. In contrast, the NNE-to-NE striking faults mostly downthrow basement to the south, which has resulted in a progressive southward thickening of the Miocene-to-Recent volcanic sequence. NNE-to-NE striking faults are steeply dipping and host most of the Au-Ag epithermal veins in the CVZ (Brathwaite et al. Citation2001). Three major structural corridors have been interpreted to transect the CVZ, which correspond to regions of strong hydrothermal alteration (Skinner Citation1986; Rabone Citation1991; Malengreau et al. Citation2000). These corridors shown in are the Tapu-Whitianga Fault Zone (TWFZ), the Tairua-Hikuai-Hihi-Kaueranga Lineament (THHK), and the Karangahake-Ohui structural trend (KOST).
Alteration and mineralisation in the CVZ
Hydrothermal alteration and mineralisation in the CVZ are widespread and, as may be expected, the latter is spatially related to the former. Several intense hydrothermal alteration zones have been identified from geological and geophysical interpretations (Christie et al. Citation2007; Morrell et al. Citation2011). These hydrothermal alterations zones envelope epithermal deposits and form overlapping alteration haloes around deposits (Christie et al. Citation2007). Deposit-scale structural studies conducted on selected deposits (e.g. Waihi, GoldenCross, Karangahake, Broken Hills) demonstrate that far-field stress at the time of mineralisation was predominantly extensional with mineralised veins hosted by NNE-to-NE trending normal faults (e.g. Spörli and Cargill Citation2011).
The age of Au-Ag deposits in the CVZ ranges from Miocene to Pleistocene (ca. 16.3–1.8 Ma), broadly coeval with regional volcanism (e.g. Mauk et al. Citation2011). Two main pulses of mineralisation are recognised based on isotopic age data determined primarily by direct dating of adularia and molybdenite from mineral deposits (Mauk et al. Citation2011). Deposits >11 My old are related to the Early Miocene pulse of andesitic volcanism in the northern CVZ, whereas those < 8.3 Ma relate to a Late Miocene to Early Pliocene pulse of bimodal andesitic-rhyolitic volcanism and are found in the eastern and southern CVZ. This temporal distribution of mineral occurrence, including the apparent hiatus of mineralisation (11–8.3 Ma), appears to be closely related to the onset of subduction of the Hikurangi Plateau at ca. 10 Ma (Reyners Citation2013). The rapid slab-roll back and associated back-arc extension in the Havre Trough and continental crust of North Island at ca. 7–6 Ma (Schellart et al. Citation2006) broadly overlaps with the second phase of mineralisation in the CVZ. This period of mineralisation particularly coincides with the occurrence of many epithermal deposits along the KOST structure, which together account for more than 80 percent of the known gold endowment within the Hauraki Goldfield (Christie et al. Citation2007).
Datasets
Aeromagnetic data
High-resolution aeromagnetic surveys presented in Kellett and Bromley (Citation2018) were stitched into a low-resolution total force magnetic anomaly map with a contour interval of 100 nT (Stagpoole Citation2001), to generate a single upgraded regional data set. This was a two-step procedure. First, most of the high-resolution surveys which were flown from 60 to 100 m above the ground were upward continued to a common 100 m altitude and then merged with the Stagpoole (Citation2001) compilation. A new gridded database was then established that covered large parts of the CVZ including the Hauraki Rift. Second, the Whitianga Bay survey was added into the regional aeromagnetic data to better constrain our interpretation in the northern CVZ. We analytically upward continued the merged CVZ grid from step 1 upward to 500 m altitude and then merged it with the Whitianga survey to produce our final compilation. Therefore, the aeromagnetic data for regional analysis in this study are derived from a newly upgraded data set of the CVZ, upward continued to 500 m and merged with a 50 by 50 m grid cell size (). This new compiled aeromagnetic dataset offers a good continuity of anomalies across individual survey boundaries and covers a large part of the early Miocene to Pliocene CVZ.
Surface geology and magnetic susceptibility
The geology and stratigraphy of the CVZ () was compiled by Edbrooke (Citation2001) at 1:250 000 and supplemented by digitally compiled geology and mineral exploration data presented in GIS format archived by New Zealand Petroleum and Minerals (Rattenbury and Partington Citation2003).
As part of the GNS Petlab database (Strong et al. Citation2016), rock properties analysed for 224 rock samples collected throughout the CVZ is presented in Kellett and Bromley (Citation2018). The samples were categorised as andesite, dacite, rhyolite, ignimbrite and volcaniclastic sediments but show variable degree of alteration. The field measured magnetic susceptibility and airborne magnetic anomalies are poorly correlated on a regional scale, suggesting the influence of hydrothermal alteration and remanant magnetisation. It is common in epithermal mineralised regions that magnetite and titanomagnetite in the host rock are replaced by pyrrhotite and pyrite during early stage of alteration (Allis Citation1990), implying alteration reduces both induced and remanant magnetisation of rocks in epithermal systems, which has also been suggested in the southern CVZ (Morrell et al. Citation2011).
Method
Aeromagnetic data processing and imaging
Our analysis is based primarily on the Total Magnetic Intensity (TMI) grid. describes a number of data processing and image processing algorithms that have been utilised during our analyses to enhance the shape and edge of magnetic source bodies, and remove or enhance wavelengths in the dataset to highlight different crustal levels. The processing steps were performed using Oasis MontajiTM and INTREPID TM softwares.
Table 2. Nomenclature, definition and use of selected image processing and imaging techniques applied to the aeromagnetic data.
Final processed figures are presented as pseudocolour images where ranges of data are assigned as combination of red, green and blue (RGB) primary colours using a lookup table. In the RGB colour model, the intensity is the energy of the colour and saturation is the spectral purity (relative degree of black or white in the colour). The effect of intensity and saturation values in the processed data is best perceived under sunlight illumination applied at a specific compass direction that invokes shadows. Intensity layer of some images (e.g. tilt derivative) is superimposed onto a differently processed version of the same dataset (e.g. upward continued), which has only colour and lacks the intensity and saturation components. Such techniques can help to establish the link between deep and shallow magnetic anomalies.
Interpretation of magnetic lineaments
Extraction of linear and curvilinear features from remotely sensed data sources has become a crucial step in regional-scale geologic mapping of structures, especially in areas with paucity of bedrock exposures (Austin and Blenkinsop Citation2008). Magnetic lineaments are interpreted both manually from variously enhanced aeromagnetic images based on the widely accepted interpretation criteria (), and automatically using edge detection ‘worming’ technique (see a).
Table 3. Major interpretation criteria to define magnetic lineaments, faults and deformation zones from the regional aeromagnetic data.
Defining the boundaries of discrete rock packages using gradient enhanced components of the magnetic field is a key process in lithological and structural interpretation of magnetic anomalies. The actual magnetic trends (linear, curvilinear and circular) of rocks observed on the TMI data also are apparent on the tilt and vertical derivatives (b and 5c). This indicates that such features can be interpreted with more confidence and derivative grids can be plausibly used to enhance regional magnetic gradients.
The TMI-reduced-to-pole (TMI-RTP) and Analytic Signal (AS) grids are used to manually interpret magnetic-high and magnetic-low regions as a fault or fault zone-related geologic lineament or weakness zone. Analytic Signal, together with radiometric data, has been proved to be a valuable method to map hydrothermal alteration zones in the southern CVZ (Morrell et al. Citation2011). This approach removes the effect of remanant magnetisation, and hence is valuable for defining locations of shallow sourced magnetic (or demagnetised) bodies and for delineating broad magnetic quiet zones. In addition, the TMI-RTP grid can be superimposed onto the AS grid calculated from upward continued TMI-RTP data (c). This creates an overlay between magnetic quiet zones at near-surface and regions of low gradient values at depth, illustrating the physical link between shallow and deep-seated deformation zones. Faults were interpreted from the aeromagnetic data as dislocations (off-sets), abrupt terminations and deflections of dominant magnetic trends observed on both the TMI-RTP and its derivative grids. Fault kinematics were interpreted based on offset and rotation (drag) of identified anomalous features. Moreover, deep crustal scale lineaments that represent the juxtaposition of crustal blocks of contrasted magnetic character are delineated from the long wavelength components of the TMI-RTP data (a, b).
However, interpretation of aeromagnetic data in volcanic terranes is usually difficult, and several possible ambiguities should be kept in mind (Finn and Morgan Citation2002). In this volcanic region magnetic lows can be caused by: (a) reversely magnetised igneous rocks, (b) hydrothermally altered volcanic rocks, and (c) non-magnetic rocks. Moreover, the morphology of magnetic anomalies may be complex as a result of the wide range of magnetic susceptibility even within the same unit, and the effect of dipole sources, which affect their shape and orientation (Roest et al. Citation1992). shows the TMI and its reduction to pole, both showing that in the study area most of the anomalies have a positive peak in the north and a negative peak in the south as we would expect for the interaction of Earth’s magnetic field with a magnetic body at this latitude. The RTP transformation (b) has largely removed the dipole anomaly character of sources related to Coromandel group andesite and dacite rocks, except some anomalies associated with the younger rhyolite flows. Overall, understanding the relation of magnetic anomalies to surficial or buried rocks in the CVZ is accomplished by comparing magnetic anomalies with the extent of mapped geologic units and alteration zones, and using input from rock magnetic property measurements.
Multiscale edge detection (worming) is an automatic edge mapping technique developed by Holden et al. (Citation2000). The method attempts to retrieve the horizontal location of edges and to characterise their continuation with depth by combining total horizontal gradient (THG) and upward continuation (UP) techniques (a). Theoretically, edges detected at lower upward continuations will result in long worms corresponding to shallow sources while edges detected at higher upward continuations (large scale) will result in short worms corresponding to deep sources.
We carried out multiscale edge detection analysis on a regional aeromagnetic grid of the CVZ. The worming process was undertaken by using INTREPIDTM, and like other edge detection software; the analysis involved four major steps: pre-processing, edge detection, edge linking and vectorisation (Middleton et al. Citation2015). Worms were produced from the THG grid at ten steps of upward continuation ranging from 1 to 10 km, but to retain shallow surface edges, worms were also calculated from 500 to 900 m at a 100 m interval (b). To keep consistency throughout processing, we used the Canny algorithm (Canny Citation1986) to calculate points of maximum gradient. Statistical analysis was also conducted by assigning specific worming parameters to assess the length and sinuosity of worm lines. Worm lines with a length greater than 1 km and degree of sinuosity greater than 0.95 were chosen and further evaluated using with the existing geological information (e.g. fault length, tectonic contacts) to derive confidence in the interpretation of subsurface structural patterns.
However, there are possible ambiguities that cause uncertainty in our interpretation. These are (1) inherent non-uniqueness of aeromagnetic data, and (2) presence of residual dipole anomalies due to magnetic remanance that may cause multiscale edges to be misplaced in the wrong position. Effect of the second problem is greatly reduced by careful analysis of shapes and patterns of worms so that any patchy and uneven pattern of worms were assumed to be related to edges of dipole anomalies and hence manually removed from the analysis. Despite the above problems, the multiscale edge detection technique, together with an atlas of idealised synthetic models of geological structures to aid interpretation (Jessell Citation2001), provides a general understanding of the subsurface geometry of magnetic sources and geological structures.
Results
Short wavelength aeromagnetic anomalies: geological and structural interpretations
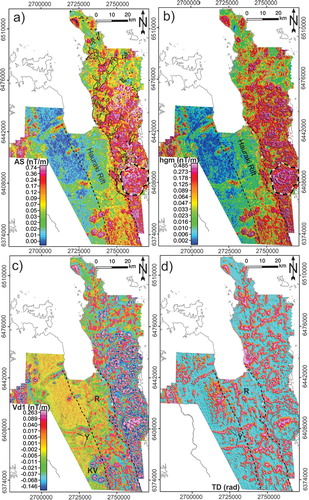
Pseudocolour image of reduced-to-pole TMI image with illumination from the northeast (b) illustrates the distribution of magnetic fabrics, reflecting the general properties of the surface geology. To further facilitate structural interpretation, physical properties of the magnetic anomalies (e.g. shape, edge) are deduced from the enhanced analytical signal, horizontal gradient, and vertical and tilt derivative grids (). These gradient enhanced images emphasise short wavelength anomaly patterns and margins of distinct magnetic anomalies on the RTP as alternating highs and lows that can be correlated with surface geology. On the basis of magnetic signatures, described by anomaly texture and fabrics reflected on the variously enhanced aeromagnetic grids, coupled with the outcropping geology from regional geological maps, several discrete magnetic domains can be distinguished that consistently correlate to the major rock packages in the area. In relevance to this paper, a scrutiny of the CVZ domain is presented.
The CVZ domain
The enhanced aeromagnetic images ( and ) show that the CVZ is characterised by a ca. 30 km wide, elongated and NNW-trending high magnetic anomaly with a highly stippled texture and steeper horizontal and vertical gradients than see to the west (e.g. Hauraki Rift). The continuation of this anomaly westward is truncated by the NNW trending Hauraki Fault. The magnetic anomalies within the CVZ exhibit complex patterns and conspicuously variable magnetic intensities of different wavelengths (labelled a-to-c in b), suggesting superimposition of shallow and deep magnetic anomalies.
Figure 4. (a) Pseudocolour image of the Total Magnetic Intensity (TMI), (b) TMI, reduced to pole (RTP) of the Hauraki Goldfield, intensity layer illuminated from the northeast. DF = Drury fault, HF = Hauraki Fault, KB = Kerikeri basalt, KV = Kiwitahi volcanics, K = Karangahake. Letters a, b, c, and d refers to high-frequency magnetic anomalies. Polygons with a black outline in (a) indicate calderas (Skinner Citation1986; Malengreau et al. Citation2000; Smith et al. Citation2006). Polygons with a black outline in (b) refer to hydrothermal alteration areas (Christie et al. Citation2007; Morrell et al. Citation2011). White cross marks refer to areas with suspected remanant magnetisation, and white lines are rivers and paleochannels. Inset map in (a) refers to different parts of CVZ discussed in the text.
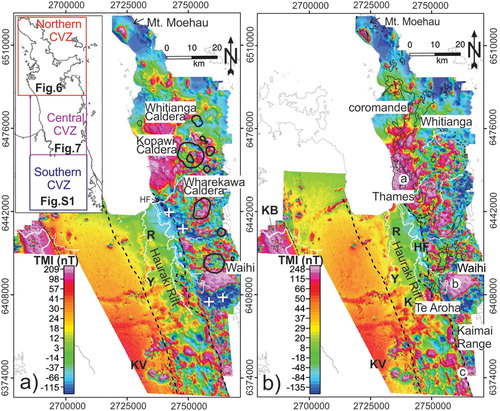
Figure 5. (a) Pseudocolour image of Analytical Signal (AS) showing hydrothermal alterations coinciding with regions of low AS value (black outline polygons: Christie et al. Citation2007). Polygons with white outlines indicate younger andesites and rhyolites that obscure hydrothermal alterations and exhibit high magnetic frequency. (b) Pseudocolour image of Horizontal gradient magnitude. (c) Pseudocolour image of Vertical Derivative (VD). (d) Pseudocolour image of Tilt Derivative (TD) with values greater than 0.0 to show the approximate width and distribution of features with positive susceptibility (Verduzco et al. Citation2004). See text for letters R and Y. KV = Kiwitahi Volcanics. Black/white circular feature refers to a high magnetic anomaly related to a deep intrusive body.
The northern CVZ has regionally low magnetism. It is characterised by quiet areas correlating to outcropping metasedimentary basement, and low amplitude anomalies mainly correlated to mapped hydrothermally altered andesite and dacite rocks (b). We also observe isolated high amplitude (∼1000 nT) and short wavelength (< 1 km) anomalies associated with mapped diorite to granodiorite intrusives and related andesitic rocks (labelled P, R in a). The overall long-wavelength magnetic low anomaly of the northern CVZ appear to be compatible with the regional stratigraphic configuration and structural tilting of the Mania Hill group basement rocks (Skinner Citation1986), where these rocks are exposed and step-down to the southeast beneath the unconformably overlying Cormandel Group igneous rocks.
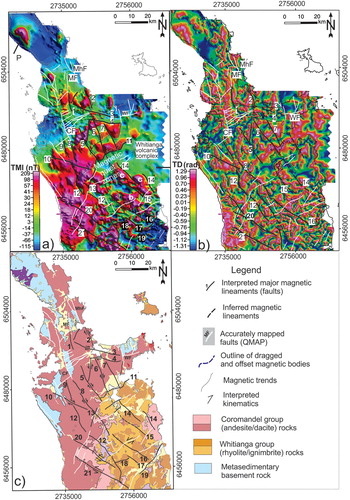
Figure 6. (a) Pseudocolour image of TMI-reduced to pole for the Northern CVZ illuminated from the northeast and annotated with interpreted structures. (b) Composite images of the tilt derivative superimposed onto the intensity layer of the vertical derivative of the reduced to pole TMI data for the same area as (a) and illuminated from the northeast and annotated with interpreted structures. (c) The corresponding geology map overlaid with interpreted structures. Abbreviations are: MF = Mangatu Fault; MhF = Matamata harakeke Fault; WF = Waitaia Fault; CF = Coromandel Fault. Labelled numbers (1–21) refer major interpreted faults and lineaments.
In this part of the CVZ, several faults are interpreted that dextrally offset (ca. 1 km) the prominent NE-SW and N-S trending narrow magnetic anomalies. These faults are straight, longer than 3 km, with dominant orientation NNW–SSE-trend (labelled 5, 6 and 7 in a), and are well correlated with the previously mapped regional basement fault traces. Moving to the south, the continuation of these faults becomes obscured within zones of low magnetic regions (magnetic quiet zones) and young volcanic cover rocks of the Whitianga Group. Magnetic lineaments with NW-SE-trend are also common (labelled 3, 4 and 10 in a) but do not correlate with any mapped faults. Magnetic lineaments associated with linear magnetic lows and strong magnetic gradients correlated with volcanic contacts trend NE-SW (labelled 11, 13 in a).
The central CVZ shows a complex magnetic pattern. The Coromandel group rocks which are exposed on the western side of the Peninsula (a) cause a regionally continuous but undulating, NW-to-SE trending, and lens-shaped high amplitude magnetic anomaly (∼500 nT). Superimposed on this regional anomaly are shorter wavelength undulations where peak amplitudes are up to 1000 nT (labelled a in b). Furthermore, this regional anomaly has been transected across-strike by alternating narrow magnetic highs and lows aligning to NNE-to-SSW trends. The magnetic lows are labelled by letters from a-to-h in (a,b). The magnetic highs correlate to andesite and dacite flows and domes while the lows correlate to ignimbrite and breccia locally covered by Quaternary sediments (c). At many places, the magnetic lows also correlate to hydrothermal alteration, river valleys (e.g. Kauaeranga and Tairua rivers) and sometimes form inner parts of caldera relicts (e.g. Wharekawa caldera in a). The anomalies around Waihi and Karangahake areas are highly variable, dominated by low-intensity anomalies due to hydrothermal alteration and high amplitude anomalies associated with the extensive andesite and dacite flows of late Miocene to late Pliocene age.
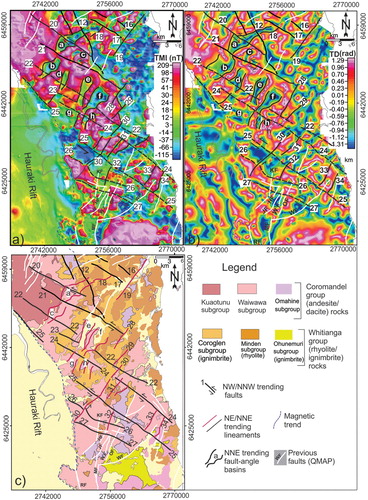
Figure 7. (a) Pseudocolour image of TMI-reduced to pole for the Central CVZ illuminated from the northeast overlaid with interpreted structures. (b) Composite images of the tilt derivative superimposed onto the intensity layer of vertical derivative and annotated with structural interpretations. (c) Corresponding geology map overlaid with interpreted structures. Overlaid lines are interpreted structures. Abbreviations: WF = Waihi Fault; OF = Owharoa Fault; WF = Waitekauri Fault; JF = Jubilee Fault; KF = Komata Fault; RF = Rotokohu Fault; MF = Mangakino Fault. Letters from a-to-g are regions of low magnetic anomaly interpreted as fault-angle basins. Labelled numbers (16–34) refer major interpreted faults and magnetic lineaments.
Close inspection and structural interpretation on the NNW-oriented regional long wavelength anomaly shows the discontinuities, perturbations and minor offsets along the NE-trending narrow belts of magnetic anomalies. On this basis, five major NW-SE trending lineaments (labelled 20–25 in a) with lengths ranging from 2–15 km are interpreted. The continuation of some of these lineaments towards the southeast has been interpreted based on abrupt terminations and minor deflections of the NE-SW trending anomaly patterns on the tilt derivative image (labelled 22, 24, and 25 in b). However, most of these lineaments do not correlate with any mapped faults except lineament 20 that appears to be a south-eastward continuation of a mapped surface fault (a). Some of the northeast trending anomalies also exhibit sigmoidal shapes and terminate against NW-SE trending lineaments. Further south, two major lineaments (labelled 26, 27 in a,b) with length ∼10 km are interpreted transecting the Waitekauri Valley and are cross-cut by several NNE-trending surface faults. In addition, several NE-SW trending lineaments are interpreted associated with sharp magnetic gradients that bound the northeast oriented discrete narrow magnetic quiet zones. However, these lineaments are relatively short in length (< 5 km), and their continuation towards northeast is difficult to define.
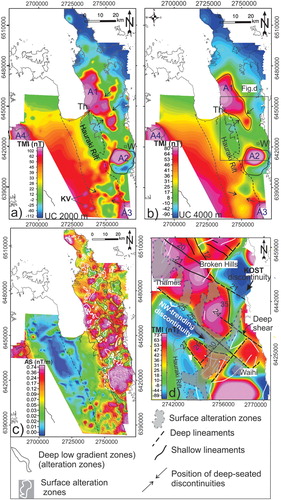
Figure 8. (a) Pseudocolour image of TMI-reduced to pole upward continued to 2 km. (b) Pseudocolour image of TMI-reduced-to-pole upward continued to 4 km. Upward continuation filter calculates the magnetic response of sources that are approximately one-half as deep as the upward continuation distance (Jacobsen Citation1987). This data shows the progressive change in shape and relative depth continuity of magnetic source bodies. (c) Composite image of analytic signal of aeromagnetic data upward continued to 4 km superimposed onto intensity layer of TMI-reduced-to-pole. Mapped surface alteration zones (Christie et al. Citation2007). Polygons of black outlines are deep magnetic quiet zones (interpreted in this study). (d) Zoomed pseudocolour image of TMI-reduced-to-pole for the area shown on Fig. b, and annotated with interpreted deep and shallow magnetic lineaments (labelled numbers 12, 21–27, 30, 32) and surface alteration zones. A1-A4 refers to high magnetic rock packages in the subsurface. Th = Thames, W = Waihi, KV = Kiwitahi Volcanics
As part of the Kaimai Range in the southern CVZ, a relatively long (∼35 km) high amplitude (∼800 nT) and long wavelength (∼1 km) magnetic anomaly runs, with a NNW-SSE trend, from north of Te Aroha to the southern end of the survey (Figure S1), which is broadly correlated to andesite flows and tuff breccia. This anomaly is truncated by Hauraki Fault in the west and Mangakino Fault in the east. However, a detailed inspection of sharp edges associated with this anomaly enhanced on the gradient data exhibits local offsets along northwest trending faults. At least four major faults are interpreted with average length ranging from 5 to 15 km (labelled F1-F4 in Figure S1) and cross-cut anomalies related to the Hauraki fault as well as volcanics of the Kaimai Range.
Long wavelength aeromagnetic anomalies: imaging deep anomalies and structures
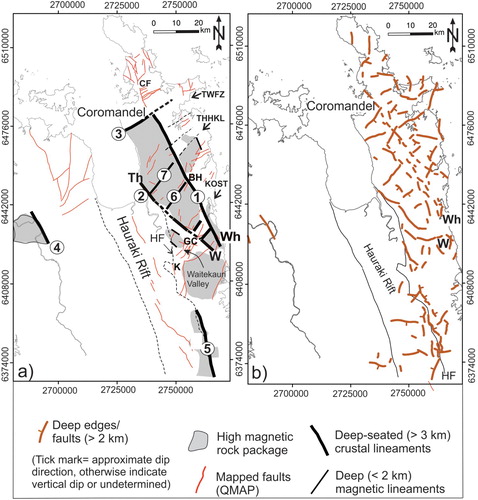
Iterative upward continuations of the RTP transformed aeromagnetic data demonstrated the relative depth persistence and shape of magnetic anomalies and edges. (a,b) show pseudocolour images of the aeromagnetic data upward continued to 2 and 4 km respectively. Magnetic anomalies due to volcanic rocks are mainly disappeared by the 4 km upward continuation, which is equivalent to a relative depth of less than 2 km. This depth estimate of volcanic units is consistent with 2D gravity models in the CVZ (e.g. Malengreau et al. Citation2000). Four regional magnetic anomalies with high depth persistence are interpreted (labelled A1-A4 in a) that likely image the upper-crustal discontinuities reaching to a depth of approximately 5 km. These long wavelength regional anomalies are bounded by crustal-scale lineaments with depth persistence greater than 3 km. A ENE and NNW – trending lineaments bound anomaly A1 to the north and east respectively. The former has a length of less than 20 km (labelled 3 in a), while the latter appears to extend up to 80 km from Whangamata to Coromandel, here called the Whangamata-Coromandel lineament (labelled 1 in a). Similarly, a NW-SE-trending crustal-scale lineament that joins Martha and Thames deposits covers approximately 50 km, and here called the Martha-Thames lineament (labelled 2 in a). Furthermore, two NNE-SSW-trending deep discontinuities of depths up to 2 km are interpreted transecting anomaly A1 (labelled 6, 7 in a), and a deep shear with the sinistral sense that perhaps act as a transfer fault at depth is imaged in the central CVZ (labelled 24 in d).
Previous geological and aeromagnetic studies have identified several areas of near-surface hydrothermal alteration (b). These areas are apparent as magnetic quiet zones on the TMI-reduced-to-pole image and zones of low gradient on the AS (a). Recognition of the extent of hydrothermal alteration is challenging because of a cover of young rhyolite and andesite flows. For example, a ca. 6.7 Ma Whakamoehau andesite flow, characterised by high frequency, irregular and sprawling variation on the TMI-RTP image (a), obscures extensive near-surface hydrothermal alterations within the Waitekauri valley. However, image processing techniques that attenuate anomalies from the shallowly sourced young volcanic cover, thereby enhancing responses of the deeper crustal anomalies, have allowed us to image deep zones of magnetic lows and to ascertain their physical link to near-surface alteration. (c) is a pseudocolour image of AS derived from 4 km upward continued TMI-reduced-to-pole data. This image has a superimposed layer of the TMI-reduced-to-pole data (as an illuminated intensity layer). The purpose of this figure is to identify deep zones of low AS value and link them with magnetic quiet zones emphasised in the overlying textural details of the TMI-RTP image. The figure illustrates a good match between the previously mapped near-surface alteration zones and the interpreted regions of low gradient zones, through which we interpret other similar possibly deep-seated and localised alteration zones with common orientations of NNW-SSE, NNE-SSW and NW-SE trends.
Worm analysis of aeromagnetic data for structural interpretation
The multiscale edge detection analysis applied to the RTP transformed aeromagnetic data shows a complex pattern of magnetic boundaries (b). The resulting worms that highlight gradients in the data derived from different depths have been used for structural interpretation. (b) illustrates the structural interpretation of magnetic gradient worms. The figure shows multiscale edges detected at upward continuation (> 4000 m), worm length (> 1 km), and worm sinuosity (> 0.95). Some of the fundamental observations that confer confidence in the structural interpretation of magnetic worms are: (1) many longer worms in the CVZ appear to persist to high levels of upward continuations, suggesting greater depth persistence, (2) many strong gradient edges have shown relative dip directions fairly consistent throughout their strike length, and (3) trend analysis of worms at shallow and deep crustal levels showed no significant variation with a mean trend NNW-SSE (c), implying strike coherence and connectivity of edges with depth.
Figure 9. (a) Main concepts of edge detection in 2D section of data, apparent dip direction of edged and degree of worm sinuosity (Holden et al. Citation2000). (b) Worms produced using criteria (worm length > 1 km) and (worm sinuosity > 0.95). The degree of sinuosity ranges between 0 and 1; where 1 refers straight and non-sinuous. (c) Trend analysis for shallow and deep worms.
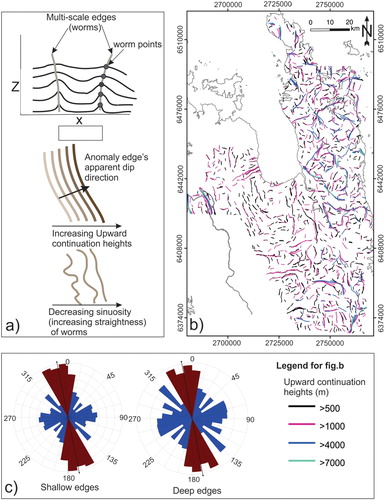
Figure 10. Interpretation of deep structural discontinuities. (a) Crustal-scale lineaments. (b) Deep magnetic worms (depth > 2 km). Wh = Whangamata, W = Waihi, K = Karangahake, GC = Golden Cross, BH = Broken Hills, CF = Coromandel Fault, KOST = Karangahake-Ohui structural trend, TWFZ = Tapu-Whitianga-Fault Zone, THHK = Tairua-Hikuai-Kaueranga Lineament. Labelled numbers (1–5) refer crustal lineaments with depth persistence greater than 3 km. Numbers labelled 6 and 7 refer magnetic lineaments with depth persistence up to 2 km.
Discussion
Interpretation of aeromagnetic data is ambiguous as the causative body size, shape, depth and magnetisation can trade-off to produce the same anomaly. However, the ambiguity can be significantly reduced by integrating with other geological and geophysical data (e.g. Gunn et al. Citation1997). Regional geological data from the Hauraki Goldfield, together with extensive analytical techniques applied on aeromagnetic data, provide useful constraints for our interpretation. In the preceding sections, we have established an interpreted structural framework in the Hauraki Goldfield that has revealed insights into regional-scale subsurface magnetic discontinuities. Having determined significant magnetic lineaments, we now discuss their possible origin within the regional setting and their control on the distribution of epithermal mineralisation in the region.
Depth continuity of magnetic discontinuities and hydrothermal alteration footprints
Manually interpreted deep crustal discontinuities associated with margins of deep magnetic anomalies (a) were compared with multiscale gradient worms (b) and near-surface magnetic discontinuities (a). This has confirmed the physical link (spatial overlay) between deep and shallow-seated structures. However, there might be areas where long wavelength and short wavelength structures have a poor spatial correlation, implying that they are not necessarily contiguous.
Figure 11. (a) Map showing shallow-seated structures interpreted from the short wavelength aeromagnetic anomalies. Overlaid shaded regions and circular features are interpreted discrete fault-angle basins and caldera structures respectively. (b) Map showing a summary of the magnetic fabrics in the Hauraki Goldfield. Surface hydrothermal alteration zones, deep alteration footprints (damage zones at depth) and epithermal deposits are overlaid on deep-seated crustal structures, illustrating the genetic and spatial links between crustal structures and epithermal systems. Surface hydrothermal alteration zones and location of mineral deposits with past gold production in the Hauraki Goldfield (after Christie et al. Citation2007). Abbreviations: WF = Waihi Fault; OF = Owharoa Fault; WF = Waitekauri Fault; JF = Jubilee Fault; KF = Komata Fault; RF = Rotokohu Fault; MF = Mangakino Fault; Wh = Whangamata, W = Waihi, K = Karangahake, GC = Golden Cross, BH = Broken Hills, CF = Coromandel Fault, KOST = Karangahake-Ohui structural trend, TWFZ = Tapu-Whitianga-Fault Zone, THHK = Tairua-Hikuai-Kaueranga Lineament.
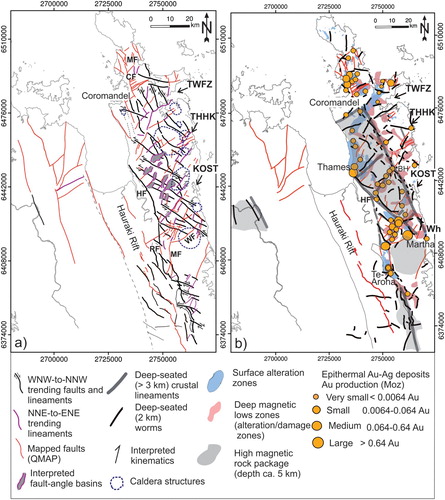
Hydrothermal alteration is prevalent throughout the CVZ. Several deep hydrothermal footprints interpreted from the superimposed AS and TMI-RTP data are closely associated with the interpreted crustal-scale lineaments and deep magnetic worms (b). The two relatively broad (∼4 km wide) zones of magnetic lows which are imaged on the deep component of the TMI-RTP image are associated with discontinuities that coincide to the NNE-oriented KOST structure and NW-trending Martha-Thames lineament (d). Overall, such close spatial relationship between alteration zones and deep lineaments suggests the presence of deep-rooted deformation zones comprised of faults (fault system) that affect the Mesozoic metasedimentary basement and focus fluids to the shallow levels within the volcanic cover sequence (e.g. Waitekauri Valley).
Geological interpretation of magnetic lineaments
Faults and deep magnetic lineaments were interpreted ( and ) from the newly compiled aeromagnetic data based on defined interpretation criteria () and with reference to the regional geological maps. Comparison with these geological maps confirms that many faults and geologic lineaments are commonly associated with short wavelength steep magnetic gradients and offset of elongate magnetic highs. Whereas, long wavelength deep magnetic lineaments can be related to contacts of deep andesitic blocks. Geological interpretation of the prominent magnetic structures is presented in detail in the following subsections.
NNW-trending orocline parallel structures
In addition to the previously mapped normal dip-slip faults, several NNW-SSE striking faults with a right lateral sense are interpreted in the northern CVZ (). Such dextral fault movement together with field structural data (e.g. offset of bedding, apparent and true displacement on faults) at Manaia by Stevens (Citation1980), indicates that a strike-slip regime of faulting dominates in the region. Alternatively, the NNW-SSE striking sub-parallel faults with apparent right-lateral sense of shear could be interpreted as early listrict style extensional structures that have linked at depth to a deep crustal discontinuity that likely reactivated as a strike-slip fault during transtension. Therefore, studies of both mapped and interpreted faults in the northern CVZ suggest that, at least during mid-Miocene, they have behaved as strike-slip faults with limited dextral offset, and likely act as transfer structures at depth accommodating shear strain (hard linkage) between large crustal blocks (cf. Rowland and Sibson Citation2001).
The interpreted NNW-SSE trending and ca. 80 km long Whangamata-Coromandel lineament (a) is in general agreement with the regional interpretation of gravity data (Malengreau et al. Citation2000), where the western andesite/dacite and the eastern rhyolite/ignimbrite blocks of contrasting densities are juxtaposed. Its depth persistence (> 3 km) is thought to be indicative of an overall contrast in magnetic susceptibility between Coromandel group and Whitianga group stratigraphy, hence presumably marks the boundary between deep volcanic rocks within the CVZ. The continuation of Whangamata-Coromandel lineament towards the south appears to be obscured by a broad hydrothermal alteration zone associated with the KOST structure, while its continuation towards the north is correlated with the prominent NNW-striking geologically mapped fault strands (e.g. Coromandel Fault). The existence of Whangamata-Coromandel lineament has also previously been interpreted as gravity expression of depression or graben structures described as a set of elongated basins filled with volcanic rocks and sediments (e.g. Hochstein and Nixon Citation1979). This lineament is also traced by segmented and tightly spaced magnetic worms continuously detected up to a depth of 2 km (b). These characteristics reflect that the Whangamata-Coromandel lineament is a long-lived crustal discontinuity in the Mesozoic basement that is geometrically parallel to other reactivated basement faults (e.g. Taranaki Fault), suture zones and basement terrane boundaries (e.g. JMA) defining the northern portion of the New Zealand orocline (Mortimer Citation2014).
Therefore, given the depth persistence, longer length and close spatial association of hydrothermal alteration, localised basins (deformation zones) and magnetic quiet zones, we interpret that the Whangamata-Coromandel lineament is strongly influenced by the reactivation of large, pre-existing deep-seated structures. In addition, there may be a strain partitioning that has probably occurred along this lineament, whereby a single deformational event has had a varied effect on the crust depending on the changes in the rheological behaviour of the subsurface at different depths (e.g. Williams and Betts Citation2007).
The north-northwest striking Hauraki Fault, which topographically demarcates the sediment-filled Hauraki Rift from the CVZ, has been well pronounced on short wavelength gradient enhanced data (). Between Thames and Te-Aroha, this fault is spatially associated with smooth magnetic texture (b). The recognition of a crustal-scale lineament (labelled 5 in a) and deep worms (b) associated with the Hauraki Fault in the southern Kaimai Range reflects deepening of the juxtaposition of magnetic material as well as younging of volcanic activity towards the southeast. Overall, the Hauraki Fault is recognised as a distinct magnetic discontinuity separating dominant litho-magnetic domains that parallel the orientation of lithostratigraphic terranes in northern New Zealand (Mortimer et al. Citation2007) and hence likely represents a reactivated inherited crustal-scale structure. This may be further supported by the presence of several NNW-SSE striking faults with considerable along strike continuity in the North Island () that have been recognised to have reactivated in extension since Cretaceous, some of them still are considered currently active (e.g. Wairoa Fault: Wise et al. Citation2003).
NE-to-NNE trending extensional fault-angle basins in the CVZ
The NNE-trending relatively broad regions of magnetic lows that locally coincide with previously identified alteration zones are interpreted in the central CVZ (labelled a-to-h in a and 11a). These features are bounded by strong magnetic lineaments some of which correlate to multiscale worms and geologically mapped faults ( and 10b), and are covered by pumice-rich ignimbrite and sediments occupying lower topography that transect by surface drainages (e.g. Kauaeranga river). Further, these regions are underlain by deep-seated magnetic lineaments (labelled 6, 7 in a). Therefore, geological and aeromagnetic evidence suggest that these features may represent fault-angle basins dominated by normal faults that accommodate arc-parallel extension within the cover sequence. Such localised fault-angle basins and previously identified NE-to-NNE-trending structural corridors including KOST and THHK (Malengreau et al. Citation2000; Christie et al. Citation2007), may plausibly represent discrete rift basins defined by arc-parallel array of normal faults (Rowland and Sibson Citation2001; Lamarche et al. Citation2006).
NW-trending transfer structures in the CVZ
Many of the NW-trending left-lateral faults interpreted in the CVZ are shallow-seated as indicated by their association with only the short wavelength anomalies on the TMI-RTP data. A notable exception is the Martha-Thames lineament (labelled 2 in a). The Martha-Thames lineament in the central CVZ and a NW-trending major discontinuity at the southern border of the Moehau massif in the northern CVZ (Spörli Citation1987), indicate the existence of NW-trending crustal-scale structures within the CVZ. At gross scale, these structures are parallel to a Miocene and ca. 170 km long crustal-scale NW-trending right-lateral transform structure, the Vening Meinesz Fracture Zone (Herzer and Mascle Citation1996), that lies north of the CVZ (). Thus, the occurrence of NW–striking faults broadly implies the reactivation of long-lived basement discontinuities (i.e. large-scale transform structures) as strike-slip faults. Such structures likely acted as accommodation zones (soft-linkage) between the near-surface NE-to-NNE trending distinct geologic features (rift segments) within the volcanic sequence (cf. Rowland and Sibson Citation2004). Adding weight to this conjecture, the NE-to-NNE-trending short-wavelength linear trends of magnetic highs commonly terminate against the NW-striking faults or deflect where the NW-trending structures can be interpreted (a,b). Again, as illustrated in (a), the interpreted discrete fault-angle basins defined by arc-parallel arrays of normal faults appear to be accommodated by the NW-trending faults. Furthermore, within the NNE-trending KOST structure, Zuquim et al. (Citation2013) suggested that the NW-trending Martha-Thames lineament has likely accommodated differential displacement between the SW and NE segments of the KOST and their associated hydrothermal alteration zones. The interpreted deep-seated lineament with sinistral movement (labelled 24 in d) may provide a good explanation for such near-surface structural (anomaly) patterns, illustrating the reactivation of a NW-trending long-lived discontinuity. A similar fault architecture has been interpreted within the Taupo Volcanic Zone (TVZ), whereby NW-striking transfer zones are interpreted to coincide with the alignment of some geothermal vents systems, rhombic caldera structures and volcanism young (<61 ka) silicic vents (Rowland and Simmons Citation2012).
Structural controls on epithermal deposits in the CVZ
In the Hauraki Goldfield, a close spatial association has been investigated among epithermal deposits defined along structural corridors, magnetic quite zones and areas of high-density faulting (Rabone Citation1991; Rattenbury and Partington Citation2003; Christie et al. Citation2007; Morrell et al. Citation2011), and imply major basement structures have controlled the location of these features.
In the northern CVZ, interpretation of aeromagnetic data, in conjunction with available geological data, has identified a series of north-northwest trending basement faults ( and ) that localised hydrothermal alteration, several epithermal deposits (older than 10 Ma) and shallow-seated magmatic intrusions. This may be interpreted as being due to the occurrence of larger scale long-lived transform structures that would be basement discontinuities reactivated as strike or oblique-slip faults with apparent right lateral shear sense. As shown in (b), the east-northeast trending crustal lineament (labelled 3 in a) has localised surface alteration zones and several epithermal deposits along the Tapu-Whitianga fault zone. The prominent north-northwest trending Whangamata-Coromandel lineament and a series of subparallel structures that reactivated in extension have appeared to control the distribution of lithology which has had more influence on localisation of alteration zones and associated epithermal mineralisations (e.g. Broken Hills and Kopawi deposits; b). Even though previously identified epithermal deposits do not appear to be well-distributed along the Whangamata-Coromandel lineament, its longer length, deeper depth persistence and overlying wide alteration zones would suggest that it is a prospective feature. Similarly, the NNE-trending deep lineament (labelled 6 in a) that controls shallowly-seated fault-angle basins has localised several hydrothermal alterations footprints and associated epithermal mineralisations (b). The NNE-trending KOST structure that hosts large epithermal deposits with age younger than 7 Ma and the substantial gold endowment is underlain by a deep and broad magnetic discontinuity of the same orientation.
The northwest-trending deep-seated lineaments, including Martha-Thames lineament, appear to have played a significant role in the focusing of epithermal fluids from deeper sources for two reasons. Firstly, the Martha-Thames lineament has localised broad hydrothermal alteration zones (e.g. Golden Cross-Waitekauri alteration zone) along its length to the southwest direction (d). This scenario can be best explained by reactivation of large-scale transform structures as NW-trending strike-slip fault arrays that may have efficiently focused epithermal fluids from the deeper crust. Correlation of deposit ages (ca. 7–6 Ma: Mauk et al. Citation2011) with the initiation of the Hauraki Rift at around 7 Ma (Hochstein and Ballance Citation1993) implies that reactivation in the region may have been dominated by extensional deformation associated to the opening of the Hauraki Rift. Secondly, the Martha-Thames lineament marks the northern end of a hydrothermal alteration zone associated with the KOST structure (d). This scenario may be explained in terms of opportunistic exploitation of the Martha-Thames lineament as transfer structure at depth and that develop a soft-linked accommodation zone between the SW and NE segments of the KOST structure that localised potential deposits (e.g. Golden Cross). Additionally, intersection of the two relatively wider deep-seated discontinuities trending NW and NNE (d) define a region (e.g. Waitekauri valley) where surface hydrothermal alteration zones, deep alteration footprints, and occurrence of large epithermal deposits are closely linked (b). However, we emphasise caution be exercised in interpreting magnetic anomalies in this region because of presence of remanant magnetisation associated with unaltered andesite flows.
Conclusion
The analysis of long wavelength aeromagnetic anomalies combined with regional geological data and new interpretation of multiscale edge detection (worming) support the existence of long-lived crustal scale structures in the Hauraki Goldfield.
The interpreted deep lineaments have provided essential plumbing for focusing epithermal fluids from deeper sources with associated expressions in the near-surface manifested as broad deformation zones that localise hydrothermal alteration zones and epithermal deposits. Particularly, the NNW-SSE-trending Whangamata-Coromandel lineament that interpreted to juxtapose deep volcanic rocks has regarded (in the near surface) as broad deformation zones localising broad hydrothermal alterations and epithermal deposits.
Large-scale transform structures associated with the Martha-Thames lineament reactivated as NW-striking strike-slip faults, and opportunistic exploitation of NW-trending deep transfer structures as soft-linked accommodation zones may have facilitated the localisation of deep epithermal fluids. This may explain the occurrence of large epithermal deposits of less than 7 My old in the central CVZ.
Supplemental Material
Download TIFF Image (11 MB)Acknowledgements
This manuscript has contributed from the input members of the Gold Exploration Models (GEM) team including Tony Christie and Fabio Caratori Tontini. We thank Hellen Williams and Bernhard Sporli for the helpful discussion during the initial phase of the research. Lorance Torckler, Rick Streiff and Rob Theron from OceanaGold and Cath Ranford from Laneway Resources at Waihi are acknowledged for the valuable discussions. New Zealand Petroleum and Minerals, and GNS Science are gratefully acknowledged for providing the high-resolution aeromagnetic data sets. The Ministry of Business Innovation and Employment (MBIE), New Zealand, supplied funding for PhD study and expenses through the ‘Mineral Exploration Models’ Programme. This manuscript has been greately improved by comments from Gustav Nortje and an anonymous reviewer.
Disclosure statement
No potential conflict of interest was reported by the authors.
ORCID
Engdawork A. Bahiru http://orcid.org/0000-0001-8031-6803
Jennifer D. Eccles http://orcid.org/0000-0002-9303-348X
Richard L. Kellett http://orcid.org/0000-0001-6215-8610
Additional information
Funding
Related Research Data
References
- Adams CJ, Graham IJ, Seward D, Skinner DNB, Adams CJ, Skinner DNB, Moore PR. 1994. Geochronological and geochemical evolution of late Cenozoic volcanism in the Coromandel Peninsula, New Zealand. New Zealand Journal of Geology and Geophysics. 37(3):359–379.
- Allis RG. 1990. Geophysical anomalies over epithermal systems. Journal of Geochemical Exploration. 36(1):339–374.
- Austin JR, Blenkinsop TG. 2008. The Cloncurry lineament: geophysical and geological evidence for a deep crustal structure in the eastern succession of the Mount Isa Inlier. Precambrian Research. 163(1-2):50–68.
- Begbie MJ, Spörli KB, Mauk JL. 2007. Structural evolution of the Golden cross epithermal Au-Ag deposit, New Zealand. Economic Geology. 102(5):873–892.
- Bierlein FP, Murphy FC, Weinberg RF, Lees T. 2006. Distribution of orogenic gold deposits in relation to fault zones and gravity gradients: targeting tools applied to the eastern Goldfields, Yilgarn Craton, western Australia. Mineralium Deposita. 41(2):107–126.
- Blakely RJ 1995. Potential theory in gravity and magnetic applications. New York (NY): Cambridge University Press; p. 441.
- Booden MA, Smith IEM, Mauk JL, Black PM. 2012. Geochemical and isotopic development of the Coromandel volcanic Zone, northern New Zealand, since 18Ma. Journal of Volcanology and Geothermal Research. 219–220:15–32.
- Brathwaite RL, Cargill HJ, Christie AB, Swain A. 2001. Lithological and spatial controls on the distribution of quartz veins in andesite and rhyolite-hosted epithermal Au-Ag deposits of the Hauraki goldfield, New Zealand. Mineralium Deposita. 36:1–12.
- Butler RWH. 1989. The influence of pre-existing basin structure on thrust system evolution in the Western Alps. Geological Society Special Publication; p. 105–122.
- Butler RWH, Tavarnelli E, Grasso M. 2006. Structural inheritance in mountain belts: an Alpine-Apennine perspective. Journal of Structural Geology. 28:1893–1908.
- Canny J. 1986. A Computational approach to edge detection. IEEE Transactions on Pattern Analysis and Machine Intelligence. PAMI-8(6):679–698.
- Christie AB, Simpson MP, Brathwaite RL, Mauk JL, Simmons SF. 2007. Epithermal Au-Ag and related deposits of the Hauraki Goldfield, Coromandel volcanic Zone, New Zealand. Economic Geology. 102(5):785–816.
- Cooper GRJ, Cowan DR. 2005. Differential reduction to the pole. Computers & Geosciences. 31(8):989–999.
- Crafford AEJ, Grauch VJS. 2002. Geologic and geophysical evidence for the influence of deep crustal structures on Paleozoic tectonics and the alignment of world-class gold deposits, north-central Nevada, USA. Ore Geology Reviews. 21(3-4):157–184.
- Daly MC, Chorowicz J, Fairhead JD 1989. Rift basin evolution in Africa: the influence of reactivated steep basement shear zones. Geological Society, London, Special Publications, London, Special Publications 44(1): 309–334.
- DeMets C, Gordon RG, Argus DF, Stein S. 1994. Effect of recent revisions to the geomagnetic reversal time scale on estimates of current plate motions. Geophysical Research Letters. 21(20):2191–2194.
- Edbrooke SW. 2001. Geology of the Auckland area. Institute of Geological & Nuclear Sciences 1:250 000 geological map 3. Lower Hutt, New Zealand. GNS Science. 1 sheet + 74 p.
- Edbrooke SW. 2005. Geology of the Waikato area. Institute of Geological & Nuclear Sciences 1:250 000 geological map. 1sheet + 68p. Lower Hutt, New Zealand. Institute of Geological &Nuclear Sceinces Limited.
- Finn CA, Morgan LA. 2002. High-resolution aeromagnetic mapping of volcanic terrain, Yellowstone National Park. Journal of Volcanology and Geothermal Research. 115(1):207–231.
- Giba M, Nicol A, Walsh JJ. 2010. Evolution of faulting and volcanism in a back-arc basin and its implications for subduction processes. Tectonics. 29(4):1–18.
- Gibert D, Galdeano A. 1985. A computer program to perform transformations of gravimetric and aeromagnetic surveys. Computers & Geosciences. 11(5):553–588.
- Grant FS. 1985. Aeromagnetics, geology and ore environments, I. magnetite in igneous, sedimentary and metamorphic rocks: An overview. Geoexploration. 23(3):303–333.
- Groves DI, Goldfarb RJ, Gebre-Mariam M, Hagemann SG, Robert F. 1998. Orogenic gold deposits: a proposed classification in the context of their crustal distribution and relationship to other gold deposit types. Ore Geology Reviews. 13(1-5):7–27.
- Gunn PJ, Milligan P, Mackey T, Liul S, Murray A, Maidment D, Haren R. 1997. Geophysical mapping using the national airborne and gravity datasets: an example focusing on Broken Hill. Journal of Australian Geology & Geophysics. 17(1):127–136.
- Henkel H, Guzman M. 1977. Magnetic features of Fracture zones. Geoexploration. 15:173–181.
- Henley RW, Admas DPM. 1992. Strike-slip fault reactivation as a control on epithermal vein-style gold mineralization. Geology. 20(5):443–446.
- Herzer RH, Mascle J. 1996. Anatomy of a continent-backarc transform — The Vening Meinesz fracture zone northwest of New Zealand. Marine Geophysical Researches. 18(2):401–427.
- Hildenbrand TG, Berger B, Jachens RC, Ludington S. 2000. Regional crustal structures and their relationship to the distribution of Ore deposits in the western United States, based on magnetic and gravity data. Economic Geology. 95(8):1583–1603.
- Hochstein MP, Ballance PF. 1993. Hauraki rift: a young, active, intracontinental rift in a back-arc setting, in south pacific sedimentary basins. Sedimentary Basins of the World. 2:295–305.
- Hochstein MP, Nixon IM. 1979. Geophysical study of the Hauraki depression, north Island, New Zealand. New Zealand Journal of Geology and Geophysics. 22(1):1–19.
- Holden DJ, Archibald NJ, Boschetti F, Jessell MW. 2000. Inferring geological structures using wavelet-based multiscale edge analysis and forward models. Exploration Geophysics. 31:617–621.
- Holsworth RE, Butler CA, Roberts AM. 1997. The recognition of reactivation during continental deformation. Journal of the Geological Society. 154(1):73–78.
- Jacobsen BH. 1987. A case for upward continuation as a standard separation filter for potential-field maps. Geophysics. 52(8):1138–1148.
- Jessell M. 2001. An atlas of structural geophysics II. Journal of the Virtual Explorer. 5:1–90.
- Kellett RL, Bromley CJ. 2018. Geophysical signatures of New Zealand epithermal Au-Ag deposits, and methods for new exploration. New Zealand Journal of Geology and Geophysics. 62(4):442–460. doi:10.1080/00288306.2018.1548494.
- King ER, Zietz I. 1978. The New York-Alabama lineament: geophysical evidence for a major crustal break in the basement beneath the Appalachian basin. Geology. 6:312–318.
- King PR. 2000. Tectonic reconstructions of New Zealand: 40 Ma to the present. New Zealand Journal of Geology and Geophysics. 43:611–638.
- Lamarche G, Barnes PM, Bull JM. 2006. Faulting and extension rate over the last 20,000 years in the offshore Whakatane graben, New Zealand continental shelf. Tectonics. 25(4):1–24.
- Malengreau B, Skinner D, Bromley C, Black P. 2000. Geophysical characterisation of large silicic volcanic structures in the Coromandel Peninsula, New Zealand. New Zealand Journal of Geology and Geophysics. 43(2):171–186.
- Mauk JL, Hall CM, Chesley JT, Barra F. 2011. Punctuated evolution of a large epithermal province: the Hauraki Goldfield, New Zealand. Economic Geology. 106(6):921–943.
- Middleton M, Schnur T, Sorjonen-Ward P, Hyvönen E. 2015. Geological lineament interpretation using the Object-based image analysis approach: results of semi-automated analyses versus visual interpretation. geological survey of Finland. Special Paper. 57:135–154.
- Morrell AE, Locke CA, Cassidy J, Mauk JL. 2011. Geophysical characteristics of adularia-sericite epithermal gold-Silver deposits in the Waihi-Waitekauri region, New Zealand. Economic Geology. 106(6):1031–1041.
- Mortimer N. 2014. The oroclinal bend in the south Island, New Zealand. Journal of Structural Geology. 64:32–38.
- Mortimer N, Gans PB, Palin JM, Meffre S, Herzer RH, Skinner DNB. 2010. Location and migration of Miocene–quaternary volcanic arcs in the SW pacific region. Journal of Volcanology and Geothermal Research. 190(1):1–10.
- Mortimer N, Herzer RH, Gans PB, Laporte-Magoni C, Calvert AT, Bosch D. 2007. Oligocene–miocene tectonic evolution of the south Fiji basin and Northland Plateau, SW Pacific Ocean: evidence from petrology and dating of dredged rocks. Marine Geology. 237(1):1–24.
- Nortje GS, Rowland J, Mauk JL, Rabone SDC. 2003. Structural controls on mineralisation at the Broken Hills epithermal Au-Ag deposit, Coromandel peninsula, New Zealand. New Zealand Branch of the AusIMM Annual Conference, Proceedings; p. 271–280.
- O’Driscoll EST. 1986. Observations of the lineament—ore relation; p. 195–218.
- Petford N, Atherton MP. 1992. Granitoid emplacement and deformation along a major crustal lineament: the Cordillera Blanca, Peru. Tectonophysics. 205(1):171–185.
- Rabone SDC. 1991. Residual total force magnetic anomaly map, Coromandel region: New Zealand Geolgical Survey Report M183.
- Rathore JS, Hospers J. 1986. Alineaments study of southern Norway and adjacent off-shore areas. Tectonophysics. 131:257–285.
- Rattenbury MS, Partington GA. 2003. Prospectivity models and GIS data for the exploration of epithermal gold mineralization in New Zealand, in Epithermal gold in New Zealand: GIS data package and prospectivity modelling: Published jointly by Crown Minerals, Ministry of Economic development and Institute of Geological and Nuclear Sciences (CDROM); p. 68.
- Reyners M. 2013. The central role of the Hikurangi Plateau in the Cenozoic tectonics of New Zealand and the southwest Pacific. Earth and Planetary Science Letters. 361:460–468.
- Roest WR, Verhoef J, Pilkington M. 1992. Magnetic interpretation using the 3-D analytic signal. Geophysics. 57(1):116–125.
- Roots CF, Thompson RI. 1989. Long-lived basement weak zones and their role in extensional magmatism in the Oglivie Mountains, Yukon Territory. International Basement Tectonics. 8:359–372.
- Rowland JV, Sibson RH. 2001. Extensional fault kinematics within the Taupo volcanic Zone, New Zealand: soft-linked segmentation of a continental rift system. New Zealand Journal of Geology and Geophysics. 44(2):271–283.
- Rowland JV, Sibson RH. 2004. Structural controls on hydrothermal flow in a segmented rift system, Taupo volcanic Zone. New Zealand. Geofluids. 4(4):259–283.
- Rowland JV, Simmons SF. 2012. Hydrologic, magmatic, and tectonic controls on hydrothermal flow, Taupo volcanic Zone, New Zealand: implications for the Formation of epithermal Vein deposits. Economic Geology. 107(3):427–457.
- Schellart WP, Lister GS, Toy VG. 2006. A late cretaceous and Cenozoic reconstruction of the southwest Pacific region: tectonics controlled by subduction and slab rollback processes. Earth-Science Reviews. 76(3):191–233.
- Seebeck H, Nicol A, Villamor P, Ristau J, Pettinga JR. 2014a. Structure and kinematics of the Taupo Rift, New Zealand. Tectonics. 33(6):1178–1199.
- Seebeck H, Nicol A, Giba M, Pettinga J, Walsh JJ. 2014b. Geometry of the subducting pacific plate since 20 Ma, Hikurangi margin, New Zealand. Journal of the Geological Society. 171(1):131–143.
- Sibson RH. 1985. A note on fault reactivation. Journal of Structural Geology. 7(6):751–754.
- Skinner DNB. 1986. Neogene volcanism of the Hauraki volcanic region. Royal Society of New Zealand Bulletin. 23:21–47.
- Smith N, Cassidy J, Locke CA, Mauk JL, Christie AB. 2006. The role of regional-scale faults in controlling a trapdoor caldera, Coromandel Peninsula, New Zealand. Journal of Volcanology and Geothermal Research. 149(3):312–328.
- Spector A, Grant FS. 1970. Statistical models for interpreting aeromagnetic data. Geophysics. 35(2):293–302.
- Spörli KB. 1987. Development of the New Zealand Microcontinent. American Geophysical Union. 18:115–132.
- Spörli KB, Begbie MJ, Irwin MR, Rowland JV 2006. Structural processes and tectonic controls on the epithermal Au-Ag deposits of the Hauraki goldfield. Australasian Institute of Mining and Metallurgy Monograph. 25: 85–94.
- Spörli KB, Cargill H. 2011. Structural evolution of a World-Class epithermal Orebody: The Martha Hill deposit, Waihi, New Zealand. Economic Geology. 106(6):975–998.
- Stagpoole V, Nicol A. 2008. Regional structure and kinematic history of a large subduction back thrust: Taranaki fault, New Zealand. Journal of Geophysical Research: Solid Earth. 113(B1):1–19.
- Stagpoole VM. 2001. Aeromagnetic map of the Coromandel region: total force anomalies. Lower Hutt: Institute of Nuclear and Geological Sciences. Institute of Geological & Nuclear Sciences geophysical map 14 1 map.
- Stevens MR. 1980. The geology of a porphyry - copper type deposit at Manaia, Coromandel Peninsula, New Zealand. [Unpublished thesis]. University of Auckland; p. 142.
- Strong DT, Turnbull RE, Haubrock S, Mortimer N. 2016. Petlab: New Zealand’s national rock catalogue and geoanalytical database. New Zealand Journal of Geology and Geophysics. 59(3):475–481.
- Townsend D, Vonk A, Kamp PJJ. 2008. Geology of the Taranaki area. Institute of Geological & Nuclear Sciences 1:250 000 geological map 7. Lower Hutt, New Zealand. GNS Science. 1 sheet + 77 p.
- Verduzco B, Fairhead JD, Green CM, MacKenzie C. 2004. New insights into magnetic derivatives for structural mapping. The Leading Edge. 23(2):116–119.
- Wallace LM, Beavan J, McCaffrey R, Darby D. 2004. Subduction zone coupling and tectonic block rotations in the north Island, New Zealand. Journal of Geophysical Research: Solid Earth. 109(B12):1–21.
- White SH, Bretan PG, Rutter EH. 1986. Fault-zone reactivation: kinematics and mechanisms. Philosophical Transactions of the Royal Society A: Mathematical, Physical and Engineering Sciences. 317(1539):81–97.
- Williams HA, Betts PG. 2007. Imaging links between lithospheric architecture and surface geology in the Proterozoic Curnamona Province. Australia. Journal of Geophysical Research: Solid Earth. 112(B7):1–18.
- Wise DJ, Cassidy J, Locke CA. 2003. Geophysical imaging of the quaternary Wairoa north fault, New Zealand: a case study. Journal of Applied Geophysics. 53(1):1–16.
- Wright IC, Parson LM, Gamble JA. 1996. Evolution and interaction of migrating cross-arc volcanism and backarc rifting: an example from the southern Havre Trough (35°20′–37°S). Journal of Geophysical Research: Solid Earth. 101(B10):22071–22086.
- Wysoczanski RJ, Todd E, Wright IC, Leybourne MI, Hergt JM, Adam C, Mackay K. 2010. Backarc rifting, constructional volcanism and nascent disorganised spreading in the southern Havre Trough backarc rifts (SW Pacific). Journal of Volcanology and Geothermal Research. 190(1):39–57.
- Zuquim MPS, Rowland JV, Theron R, Atkinson P. 2013. Structural controls on the localisation of Au-Ag epithermal deposits within the Karangahake-Ohui structural trend, Hauraki Goldfield, New Zealand. Proceedings of New Zealand Branch, AusIMM Annual Conference; Aug 25–28. Nelson.