
ABSTRACT
Epithermal Au-Ag veins of the Hauraki goldfield are mostly hosted by volcanic rocks and are enclosed by extensive zones of hydrothermal alteration that are generally 6–50 km2 in areal extent. The rocks are altered to a variety of hydrothermal minerals; the most common include quartz, adularia, illite, mixed-layered illite-smectite, chlorite, pyrite, calcite, albite and smectite. Some alteration minerals have zoned distributions. Widespread illite grades successively into overlying and bordering illite-smectite and outlying smectite. Significant quartz veins mainly occur in illite-altered rocks, but some can occur in illite-smectite altered rocks. Adularia commonly surrounds veins and can occur in rocks up to >500 m laterally from veins. Ammonium (NH4) minerals, when present, have a restricted distribution occurring laterally <100–300 m from veins. The significance of alteration minerals can be understood from a geothermal context where the system scale zonation of illite, illite-smectite and smectite outline the broad thermal structure of the former hydrothermal system, with illite formed in the hotter portion. Widespread adularia indicates zones of inferred high permeability and the upflow of boiling hydrothermal fluids. Most significant quartz veins occur in rocks altered to adularia and / or illite, restricting the target area, although both minerals can occur >500 m from veins. Where present, NH4-minerals further restrict the target area.
Introduction
Low to intermediate sulfidation epithermal Au-Ag vein deposits are an important source of precious metals and the host rocks altered by various hydrothermal minerals (e.g. Buchanan Citation1981; Hayba et al. Citation1985; Heald et al. Citation1987; White et al. Citation1995; Hedenquist et al. Citation2000; Simmons et al. Citation2005). Alteration can extend 10’s to 1000's m beyond the veins revealing the much larger footprint of the former hydrothermal system (e.g. Golden Cross, New Zealand, Simpson et al. Citation2001; Comstock, USA, Hudson Citation2003; Gosowong, Indonesia, Gemmell Citation2007). Alteration is commonly characterised and mapped in terms of mineral assemblages (propylitic, argillic, advanced argillic, silicic; Meyers and Hemley 1967), and less commonly for individual minerals (e.g. Simpson and Mauk Citation2011), although individual minerals are commonly mapped for geothermal systems (e.g. Browne Citation1978; Hedenquist and Browne Citation1989; Reyes Citation1990; Simmons and Browne Citation2000; Chambefort et al. Citation2017). Some alteration minerals can be easily identified, but many (i.e. adularia, albite, different clays) can only be reliably determined by using analytical techniques such as hyperspectral short-wave infrared (SWIR) reflectance spectroscopy or by X-ray powder diffraction (XRD). Field portable versions of both instruments are available and used in epithermal exploration, e.g. reflectance spectroscopy at Marianas-San Marcos vein, Argentina (Vidal et al. Citation2016) and portable XRD at Kulumadau, Papua New Guinea (Burkett et al. Citation2015). Mapping individual alteration minerals is useful because based on the occurrences of these same minerals in geothermal systems (e.g. Simmons and Browne Citation2000), they can be used to infer temperatures and thermal gradients, permeability, and formation depths; these inferences combined, can be used to reconstruct the palaeohydrologic anatomy of the former hydrothermal system and changes with time.
The Hauraki goldfield hosts some 50-separate epithermal Au-Ag vein centres () that are enclosed by hydrothermal alteration halos of varying areal extent (Christie et al. Citation2007). Alteration for many prospects and deposits has been mapped and characterised in varying detail by explorationist and researchers (e.g. Bell and Fraser Citation1912; de Ronde and Blattner Citation1988; Jennings et al. Citation1990; Brathwaite and Faure Citation2002, Stuart et al. Citation2005; Simpson and Mauk Citation2007, Citation2011; Simpson et al. Citation2019). In this paper, we present an overview of hydrothermal alteration for deposits and prospects in the goldfield that have been characterised in the most detail, with a focus on Martha and Favona (Waihi vein system), Karangahake, Golden Cross, Waitekauri and Wharekirauponga, which have varying Au endowments. At these deposits and prospects, the occurrence, spatial distribution and temporal relationships of individual alteration minerals have been characterised. They reveal the consistent zonation of key alteration minerals (illite, mixed-layered illite-smectite, smectite, adularia, NH4-minerals / buddingtonite and NH4-illite), that define the footprint of the former hydrothermal system. The process of hydrothermal alteration has resulted in chemical changes to the host rocks in which some elements have been variably added (e.g. K, Rb) and others variably removed (e.g. Na, Sr) (Simpson et al. Citation2003; Mauk and Simpson Citation2007; Booden et al. Citation2011; Hughes and Barker Citation2017). Chemical changes due to alteration are detailed in a complimentary paper by Barker et al. (Citation2019). While we have focused on hydrothermal alteration minerals, the combined investigation of these minerals plus altered rock chemistry provides the best information for understanding and reconstruction of the former hydrothermal system and locating areas most likely to have veins.
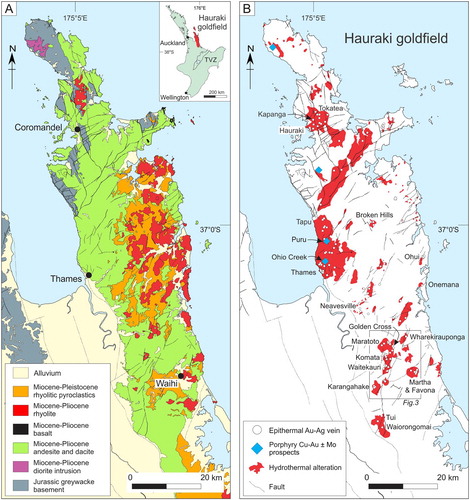
Figure 1. Simplified maps of the Hauraki goldfield showing A, the geology and fault pattern (Skinner Citation1986, Brathwaite et al. Citation1989; Edbrooke Citation2001; Christie et al. Citation2007) and B, alteration zones and epithermal centres (veins). Alteration zones have been determined from field mapping and for some by a combination of mapping and aeromagnetic interpretations (Christie at al. 2001; Stagpoole et al. Citation2001). Inset shows the location of the Hauraki goldfield and the Taupo Volcanic Zone (TVZ), North Island of New Zealand.
Geologic setting
Epithermal Au-Ag deposits of the Hauraki goldfield occur in the Coromandel volcanic zone, a Miocene to Pleistocene (∼18−1.5 Ma) subaerial volcanic arc formed due to convergence along the Pacific-Australian plate boundary (Skinner Citation1986; Mortimer et al. Citation2007). The Coromandel volcanic zone, which follows the length of the Coromandel Peninsula, consists of andesitic, dacitic, rhyolitic, and minor basaltic volcanic rocks that unconformably overlie Jurassic meta-sedimentary rocks (greywacke and argillite) (). Two key features of the volcanism are that the ages of volcanic units become younger southward and eastward, and andesitic volcanic rocks predominate in the western part of the region, and rhyolitic volcanic rocks in the eastern part. Andesitic and dacitic volcanic rocks of the Coromandel Group (18−3.8 Ma) occur as flows, autoclastic breccias, lahars, and tuffs (Skinner Citation1986; Adams et al. Citation1994; Booden et al. Citation2012). Rhyolitic volcanic rocks of the Whitianga Group (11−1.5 Ma) overlie and interfinger with the andesitic and dacitic volcanic rocks, with rhyolitic ignimbrites, tuffs, flow-dome and volcaniclastics rocks related to several calderas (Malengreau et al. Citation2000; Nicholson et al. Citation2004; Briggs et al. Citation2005; Smith et al. Citation2006). The Coromandel volcanic zone is cut by NE- to ENE- and NW- to NNW-striking faults (Skinner Citation1986; Spörli et al. Citation2006). NW- to NNW-striking faults displace rocks downward to the east and west, whereas most NE to ENE-striking faults displace rocks downward to the south resulting in a thick volcanic rock sequence in the south and exposed basement rocks in the north. The presently active NNW-trending Hauraki Rift forms the western margin of the Coromandel volcanic zone (Hochstein et al. Citation1986; Hochstein and Ballance Citation1993).
The Hauraki goldfield contains approximately 50 low to intermediate sulfidation epithermal Au-Ag vein centres and several porphyry Cu-Au-(Mo) occurrences (Brathwaite et al. Citation1989; Christie et al. Citation2007). Total production from 1862 to January 2018 was about 12.3 Moz Au and 54.9 Moz Ag (Christie et al. Citation2007; and OceanaGold unpublished production records). Over 96 percent of the Au has been obtained from deposits in andesite, even though there are deposits in rhyolite and greywacke, and these rocks comprising almost 40 percent of those exposed (Brathwaite et al. Citation2001a; Christie et al. Citation2007). Most orebodies consist of either single or multiple quartz veins that fill high-angle fractures (Spörli et al. Citation2006). Veins typically range from 200 to 1,600 m in strike length and were mined over a 170–330 m vertical interval, but many continue to greater depth with low Au and Ag contents (Brathwaite et al. Citation1989). At Martha and Karangahake, veins have vertical extents of 575 and 700 m, respectively. The veins are typically 0.3–5 m wide, although some veins locally exceed 25 m (e.g. Martha, Waihi vein system; Big Buck reef, Waiorongomai).
The host rocks of quartz veins are hydrothermally altered with widespread alteration typically characterised in terms of macroscopically identified alteration mineral assemblages (e.g. propylitic, argillic, silicic), and for some by individual alteration minerals identified from various analytical techniques (e.g. XRD, reflectance spectroscopy). In this contribution, we mainly describe alteration at Karangahake, Martha and Favona (Waihi vein system), Golden Cross, Waitekauri (Jubilee, Sovereign, Scimitar, Scotia, Teutonic and Jasper Creek), and Wharekirauponga, with brief overviews for each deposit / prospect presented below.
Karangahake
The Karangahake deposit (A) is the third largest gold producer in the Hauraki goldfield, with historic production from 1882 to 1944 of 0.85 Moz Au and 3.16 Moz Ag, (Downey Citation1935; Stevens and Boswell Citation2006; Simpson et al. Citation2016). More recent and on-going exploration has identified a resource of 205,000 oz Au and 799,000 oz Ag (New Talisman Gold Mines Citation2017).
Figure 2. Geology maps of selected epithermal Au-Ag deposits: A, Karangahake (Brathwaite, Citation1989; Stevens and Boswell, Citation2006), B, Martha, Correnso and Favona, Waihi vein system (Torckler et al. Citation2016), C, Golden Cross (Keall et al. Citation1993; Simpson et al. Citation2001), D, Waitekauri (Simpson and Mauk, Citation2011), and E, Wharekirauponga (OceanaGold). Quartz veins are projected to surface except those at Karangahake, which are the surface trace.
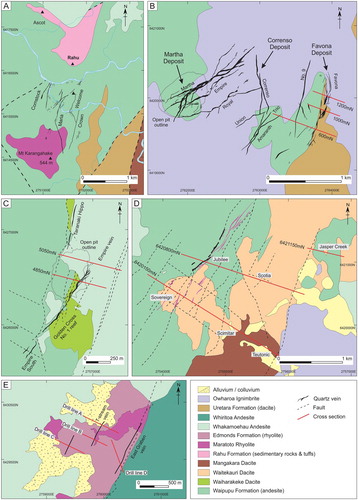
Geologically, the area is dominated by auto-brecciated and lesser jointed andesitic lava flows of the Waipupu Formation that are unconformably overlain by spherulitic and flow banded Maratoto Rhyolite, which forms the summit of Mt Karangahake (Brathwaite Citation1989; Brathwaite and Christie, Citation1996). Post-mineralisation andesitic to dacitic flows of the Uretara Formation occur east of Mt Karangahake and post-mineralisation Whakamoehau Andesite to the north. In the Karangahake area, the main fault trends are NW, N, NNE, and E (Henderson and Bartrum Citation1913; Brathwaite Citation1989).
The main productive veins are the N- to NNE-striking Maria and Welcome/Crown, which are flanked by other veins with small historic production. A sub-economic stockwork of narrow, widely dispersed quartz veins occurs in the summit rhyolite. Approximately 90 percent of Au and Ag produced was extracted from the Maria vein, which has a known strike length of 1300 m, a vertical extent that exceeds 700 m, and an average width of 2–3 m (Brathwaite Citation1989).
Martha and Favona (Waihi vein system)
The Waihi vein system, comprised of the Martha, Correnso, Trio, and Favona (-Moonlight) deposits (B), is the most productive in the goldfield having produced more than 7.9 Moz Au and 45.5 Moz Ag (Torckler et al. Citation2016; and unpublished OceanaGold production records). Martha was worked as an underground mine from 1883 to 1952, and as an open pit since 1988, with underground mining at Favona (2006–2013), Trio (2012–2014) and Correnso (2015–).
Quartz veins are hosted by porphyritic andesite flows of the Waipupu Formation, that at Martha and Union Hill have notable, but minor quartz phenocrysts (<1–2 vol.%) (Brathwaite and McKay Citation1989). Most quartz veins are hosted in andesite with quartz phenocrysts, except for Favona and Moonlight which are hosted in andesite that lacks quartz phenocrysts. The andesite is extensively covered by post-mineralisation dacite of the Uretara Formation and younger Owharoa and Waikino Ignimbrite (Brathwaite and Christie Citation1996). Faults in surface outcrops are poorly exposed due to widespread post-mineralisation cover. Faults mainly seen from mine workings are steeply dipping and have a NE strike, although some trend to the N and NW (Morgan Citation1924; Spörli and Cargill Citation2011).
Quartz veins at Martha form a complex braided pattern in plan and cross section and extend 1.6 km along strike in a zone up to 500 m wide and mined to a depth of 575 m below surface (Morgan Citation1924; Brathwaite and Faure Citation2002). There are four main subparallel NE-striking quartz veins; the Martha vein is up to 25 m wide and dips SE, whereas the Welcome, Empire, and Royal veins dip NW and converge with the Martha vein. The concealed Correnso vein has a strike length of 0.8 km, a vertical extent exceeding 400 m, and is <0.5–15 m wide (Hobbins et al. Citation2012). In contrast to most other veins, it strikes NNW and dips to the E. The Favona vein is also concealed and has a strike length of 1 km, a vertical extent exceeding 400 m, and averages 1–3 m wide; however, portions are up to 25 m wide (Torckler et al. Citation2006, Citation2016). A hydrothermal breccia that fills a funnel-shaped depression occurs above and to the east of the Favona vein.
Golden Cross
Gold and silver at the Golden Cross deposit (C) was first extracted from the underground Golden Cross No. 1 reef (1895–1917) and later from the underground Empire vein and open pit Empire stockwork (1991–1998); these collectively produced 0.75 Moz Au and 2.33 Moz of Ag (Simpson et al. Citation2001). Quartz veins are hosted by andesite flows, an andesite intrusion, and lesser pyroclastic rocks of the Waipupu Formation in fault contact with dacitic flows and breccia of the Waiharakeke Dacite. These are partly covered by post-mineralisation Whakamoehau Andesite (Hay Citation1989; Keall et al. Citation1993; Brathwaite and Christie Citation1996). Prominent faults in the mine area are the N-NE- and N-striking Empire and Western Boundary faults. The steeply W-dipping Empire Fault has over 300 m of displacement, whereas the amount of movement for the E-dipping Western Boundary Fault that forms the western limit to stockwork veins is unknown (Keall et al. Citation1993).
The Empire vein occurs along part of the Empire Fault. The Empire vein is comprised of the steeply west dipping main hanging-wall vein that ranges from 2 m to greater than 10 m in width, and gently dipping footwall veins that are up to 2 m wide (Keall et al. Citation1993; David and Barber Citation1997; Begbie et al. Citation2007). Structural reconstruction suggests that the deposit was rotated during formation and that the footwall veins formed in a more steeply dipping configuration than their current orientation (Begbie et al. Citation2007).
Waitekauri
The Waitekauri deposits and prospects are comprised of the historic mined Sovereign, Jubilee and Scotia deposits and the Jasper Creek, Scimitar and Teutonic prospects (D). Intermittent mining between 1875–1929 and 1934–1941 produced approximately 17,000 oz of Au and 20,000 oz of Ag; most (76%) from the Jubilee vein (Downey Citation1935; Rabone Citation1975). Since 1970, the area has been intermittently explored by 105 diamond drill holes that produced a total of 17,399 m of core (Simpson Citation2016 and references therein).
The Waitekauri deposits and prospects are hosted by andesitic and dacitic flows, breccias and localised pyroclastic and air fall volcanic rocks of the Waipupu Formation, Mangakara Dacite, and Waitekauri Dacite that are locally intruded by narrow dykes of Maratoto Rhyolite. These altered rocks are locally blanketed by post-mineralisation Whakamoehau Andesite and younger Owharoa Ignimbrite (Rabone Citation1975; Brathwaite and Christie Citation1996; Haworth and Briggs Citation2006). Structurally, the area is dissected by NNE- and by less common WNW- trending faults. Both the Jubilee vein and mineralisation at Sovereign occur along the NNE- striking and steeply WNW-dipping Waitekauri Fault, which at Sovereign splays into the Realm and Young New Zealand faults.
The main Au-Ag mineralised quartz vein is the NNE-trending Jubilee vein that is 990 m in length, extends 215 m vertically and averages 2.4 m in width; although it is strongly lenticular and commonly narrows to several centimetres (Bell and Fraser Citation1912; Downey Citation1935). Mineralisation at Sovereign occurs in silicified breccias / quartz stockworks and at Scotia in quartz stockworks. No significant veins or Au have been found at Jasper Creek, but at surface there is a polymict breccia of suspected hydrothermal origin (Simpson and Mauk Citation2011).
Wharekirauponga (WKP)
The Wharekirauponga prospect (E), was explored by several historic adits between 1893 and 1899, but no production resulted as finance for development could not be raised (Bell and Fraser Citation1912; Downey Citation1935). Since 1978, the area has been explored by 46 diamond drill holes totalling 17,779 m of core with an inferred resource in 2013 of 260,000 oz Au and 390,000 oz Ag (Christie et al. Citation2016).
Quartz veins mainly are hosted in flows and breccias of Maratoto Rhyolite that form a dome complex that is partly overlain by rhyolitic tuffs of the Edmonds Formation and by post-mineralisation Whakamoehau Andesite (Rabone et al. Citation1989; Brathwaite and Christie Citation1996; Christie et al. Citation2003, Citation2006, Citation2016). The rhyolites are in fault contact with older Whiritoa Andesite in the east and in some drill holes the rhyolite overlies undifferentiated andesite and dacite. Narrow dykes of rhyolite intrude the andesite and dykes of andesite intrude the rhyolite. Structurally, the rhyolite is interpreted to fill a N-NE–trending graben (Rabone et al. Citation1989). Gold and silver are present in quartz veins, but also in the wall rock (e.g. WKP-20 has 83 m grading 1.4 g/t Au; Christie et al. Citation2016). Many of the veins are 1–10 mm wide and locally form sheeted vein complexes. Recent drilling has intercepted larger veins up to 9 m wide and more than 500 m in length (e.g. East Graben vein). Individual veins show a large variation about a general northerly strike, although most strike NW or NNE (Rabone et al. Citation1989; Brathwaite et al. Citation2001a).
Hydrothermal alteration
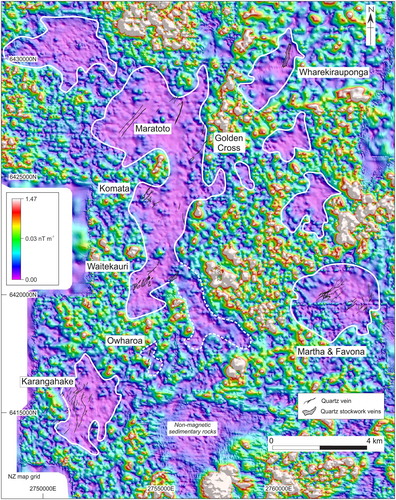
The most productive epithermal quartz veins of the Hauraki goldfield are mainly hosted in volcanic rocks and are enclosed by a halo of hydrothermal alteration. The areal extent of alteration has been broadly determined for many prospects and deposits by surface mapping and / or by airborne magnetic and radiometric geophysical techniques (B; Christie et al. Citation2001). Field mapping is restricted by rock exposures with large areas concealed by soil or post-mineralisation volcanic rock cover. Aeromagnetic data have been used to delineate the extent of alteration induced magnetite destruction (negative anomalies / demagnetised zone) for prospects and deposits hosted in volcanic rocks, especially for those in the southern Hauraki goldfield (), but it is less useful for those of the eastern or northern Hauraki goldfield because of post-mineralisation cover or the occurrence of non-magnetic rocks (greywacke). The demagnetised zone correlates with strong alteration, but weaker alteration extends beyond this and thus the areal extent interpreted from aeromagnetic data indicates the minimum system size. Despite limited exposure (due to post-mineralisation volcanic rocks, soils), the interpreted areal extent of hydrothermal alteration surrounding veins ranges from ∼6 km2 to ∼120 km2. Smaller alteration halos enclose the Karangahake deposit and the Waihi vein system, with the demagnetised zone from aeromagnetics, ∼6 and ∼12 km2 in areal extent, respectively (Harris et al. Citation2005; Morrell et al. Citation2011). The Maratoto, Golden Cross, Komata and Waitekauri deposits are all enclosed in a larger ∼42 km2 demagnetised zone (). Radiometric 40Ar/39Ar age determinations suggest that some of these veins centres have formed at different times and thus this large alteration halo could be the composite of several superimposed hydrothermal systems (Mauk et al. Citation2011). The largest alteration halo based on field mapping is ∼120 km2 in areal extent and encloses epithermal veins at Thames and Waiomu, but further includes propylitic and advanced argillic alteration associated with the Ohio Creek porphyry Cu-Mo-Au prospect (Christie et al. Citation2001; Brathwaite et al. Citation2001b). The physical shape of the alteration halo enclosing veins ranges from roughly sub-circular through elongate to highly irregular ().
Figure 3. Aeromagnetic analytical signal pseudocolour image of the reduced-to-pole total magnetic intensity map for the southern Hauraki goldfield and showing quartz veins (OceanaGold). The boundaries of zones of very low magnetic gradient are marked by the solid and dashed white lines (modified Morrell et al. Citation2011). These generally outline the extent of strong hydrothermal alteration in which magnetite has been destroyed. The zone of low magnetic gradient response east of Karangahake is related to non-magnetic sedimentary rocks. The location of this area in the Hauraki goldfield is outlined in B.
Alteration of the rocks can be characterised by the intensity of alteration which is a measure of the amount of primary minerals converted to hydrothermal minerals (Browne Citation1978). The intensity of alteration can range from weak to strong ( and ). We classify weakly, moderately and strongly altered rocks as those with <25%, 25–70% and >70–100% of minerals converted to hydrothermal minerals. Weakly altered volcanic rocks have variably altered pyroxene, amphibole and glass, with plagioclase and magnetite principally unaltered. In moderately altered volcanic rocks, glass, pyroxene and amphibole are typically completely altered, and plagioclase plus magnetite are partially altered. Strongly altered volcanic rocks can contain relict plagioclase, but generally lack magnetite. Overall, for volcanic rocks the following sequence of most to least susceptible igneous mineral alteration is seen; glass > amphibole > pyroxene > magnetite > plagioclase (e.g. Rabone Citation1975; de Ronde and Blattner, Citation1988; Simpson et al. Citation2001). Volcanic textures in altered rocks are commonly preserved (e.g. porphyritic, spherulitic), although for some strongly altered rocks (100% altered) their textures may be largely destroyed making rock type identification difficult.
Figure 4. Digital microscopic images of hydrothermal alteration minerals replacing volcanic rocks. A, Feldspar phenocrysts completely altered to adularia and albite (WV006 254.2 m, Jubilee), B, feldspar phenocryst altered to adularia with fractures filled by later trace illite (ML7 36.0 m, Sovereign), C, feldspar phenocrysts altered to adularia and later illite (sample AU#57552, Karangahake), D, feldspar phenocryst altered to adularia, illite and overprinted by calcite (WV007 166.5 m, Jubilee), E, feldspar phenocryst completely altered to illite (ML11 146.6 m, Sovereign), F, feldspar phenocryst completely altered to calcite (WV011 194.8 m, Scimitar) G, pyroxene phenocrysts altered to chlorite. Adjacent feldspar phenocrysts are altered to illite (WV008 204.95 m, Jubilee), H, plagioclase phenocryst partly altered by calcite. The groundmass is partially altered to smectite (WV009 466.2 m, Jasper Creek).
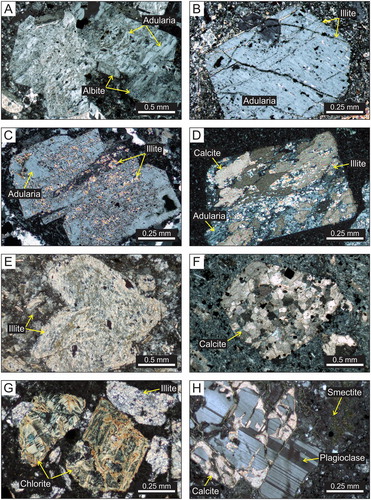
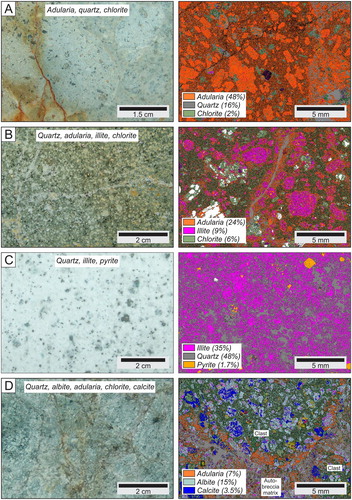
Figure 5. Images of hydrothermally altered rock (left) and corresponding automated mineralogy map (right) for samples from the Karangahake deposit. Note that left and right images are from different parts of the same slabbed rock surface. The different colours for the automated map represent different minerals with selected minerals indicated in the legend and their corresponding amount. A, Adularia, quartz and chlorite altered andesite. Feldspar phenocrysts are altered to adularia, and pyroxene phenocrysts altered to chlorite (AU#57555). B, Quartz, adularia, illite and chlorite altered andesite with phenocrystic feldspar altered to adularia and illite (AU#57491). C, Andesite pervasively altered to quartz, illite and minor pyrite. Faint outlines of feldspar phenocrysts are poorly preserved (AU#57548). D, Auto-brecciated andesite altered to quartz, albite, adularia, chlorite and calcite. Albite occurs throughout the sample, whereas adularia is concentrated in the auto-breccia matrix and rims the clasts. Adularia is interpreted to have formed later than the albite (AU#57510).
In general, the host rocks near veins are strongly altered (typically 100%), whereas those at greater distance (100’s to 1,000’s m) are less altered ( and ). However, lenses of moderately to weakly altered rock enclosed in strongly altered rocks can occur near to, and occasionally host veins, and these were termed ‘hard bars’ by the early miners (Fraser, Citation1910; Bell and Fraser Citation1912). These lenses of less altered rock, such as a lava flow within other lava flows are inferred to have a lower permeability that limited fluid throughput restricting element exchange and the type and intensity of alteration. In general, the alteration in strongly altered rocks is pervasive, although in moderately to weakly altered rocks some hydrothermal mineral occurrences may be restricted to adjacent narrow (mm to cm wide) veins.
Alteration of the rocks has resulted in the formation of a wide range of hydrothermal minerals. Some minerals can be identified macroscopically or by simple tests (e.g. calcite by reaction with HCl), but many including feldspar (adularia, albite) and clays (illite, mixed layered illite-smectite, smectite), are difficult to distinguish and require identification by analytical techniques. For epithermal deposits of the Hauraki goldfield, alteration minerals have mainly been identified from thin section petrography (), X-ray diffraction (XRD), hyperspectral short-wave infrared (SWIR) reflectance spectroscopy and from automated mineralogy mapping and quantification via scanning electron microscope-based chemical mapping ( and ). For XRD, the mineralogy of a rock is identified from randomly orientated powder rock mounts, whereas clays and the determination of interstratification for mixed-layered clay (i.e. the amount of illite in mixed-layered illite-smectite) are derived from glycol-treated clay separates (Reynolds Citation1980; Moore and Reynolds Citation1997). From powdered rock XRD, it is further possible to quantify mineral abundances using various software packages (e.g. SIROQANT) based on Rietveld refinement (Rietveld Citation1969).
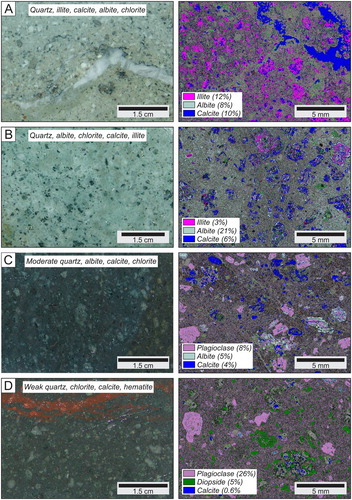
Figure 6. Images of hydrothermal altered rock (left) and corresponding automated mineralogy map (right) for samples from the Karangahake deposit. Note that left and right images are from different parts of the same slabbed rock surface. The different colours for the automated map represent different minerals with selected minerals indicated in the legend and their corresponding amount. A, Quartz, illite, chlorite, calcite and albite altered andesite with irregular calcite vein (AU#57568). B, Quartz, albite, calcite, chlorite and illite altered andesite. The sample contains a significant amount of albite that mainly occurs as an alteration mineral in the groundmass (AU#57545). C, Moderately quartz, albite, calcite and chlorite altered andesite. Plagioclase is partially altered to albite, whereas pyroxene is completely altered to calcite with minor chlorite. The groundmass is quartz (24%) altered (AU#57574). D, Weakly quartz, chlorite, calcite altered andesite with hematite vein. Plagioclase and diopside are essentially unaltered whereas enstatite is altered to chlorite and calcite. The groundmass is also partly altered to chlorite and quartz (AU#57573).
Spatial and temporal occurrences of alteration minerals
The wall rocks to epithermal veins of the Hauraki goldfield have been altered to a diversity of hydrothermal minerals that include, quartz, adularia, albite, chlorite, pyrite, calcite, illite, mixed-layered illite-smectite, smectite, NH4-feldspar, NH4-illite, and less common mixed-layered chlorite-smectite, corrensite, epidote, siderite, ankerite, dolomite, kaolinite, and alunite. Many of these alteration minerals and their spatial and temporal occurrences are described below.
Quartz
Quartz is a common alteration mineral present in varying amounts in strongly, moderately and weakly altered rocks. In volcanic rocks, quartz mainly is an alteration mineral of the groundmass (). Adjacent quartz veins, both pyroxene and amphibole can be altered to quartz and calcite, although these are more typically altered to chlorite with or without calcite.
Adularia and albite
Three types of hydrothermal feldspar occur around epithermal quartz veins, namely adularia, albite, and the ammonium feldspar, buddingtonite [(NH4)(AlSi3)O8]; the latter is separately detailed together with NH4-illite below. Hydrothermal adularia is a common and widespread alteration mineral that also can occur as a common, but volumetrically minor gangue mineral in quartz veins. Adularia occurs as an alteration product of plagioclase phenocrysts and laths (). Automated mineralogy mapping reveals adularia can be the dominant mineral comprising the groundmass in some samples (). Some rocks at the Karangahake deposit and the Waihi vein system from automated mineralogy mapping and quantitative XRD have up to 74 and 85 percent adularia, respectively, which is in greater abundance than quartz (Hughes et al. Citation2017; Simpson et al. Citation2019). Adularia is typically altered to illite or illite-smectite and can be overprinted by calcite (). The extent to which adularia is altered to illite or illite-smectite is highly variable and ranges from less than 5 to greater than 95 percent (A versus 5B), but usually exceeds 30 percent. Calcite appears to fill voids in the feldspar and is open spaced deposited overprinting adularia or illite and is not an alteration product of these minerals.
Adularia is a common alteration mineral found in many epithermal deposits of the Hauraki goldfield, but is not reported at the Thames-Tapu and Hauraki-Kapanga-Tokatea vein deposits (), that were notable for bonanza-grade gold (Fraser and Adams Citation1907; Fraser Citation1910; Merchant Citation1986; Simpson et al. Citation2011). Adularia alteration encloses quartz veins. At Karangahake, based on surface samples, adularia alteration that envelops the Comstock, Maria, and Welcome/Crown veins extends up to 500 m from these veins () and occurs between these veins (). In the rocks hosting the Waihi vein system, adularia in the Martha open pit extends >200 m laterally either side of the Martha vein (), and in drill line cross sections it is present between the Favona and Amaranth veins spanning ∼500 m and extends >150 to >200 m into the hanging wall of the Favona vein (). At Golden Cross, adularia envelops the Empire vein and shallow stockwork, and occurs 150 to >350 m into the footwall (). At Scotia, quartz stockwork veins occur in a zone of adularia with restricted vertical extent that extends ∼200 m below the current ground surface (). In general, adularia alteration is not depth dependant, extending over 400 m vertically and based on depth reconstructions can occur anywhere between ∼50 to >900 m below the estimated level of the palaeowater table.
Figure 7. Surface maps showing the distribution of hydrothermal alteration minerals at the Karangahake deposit identified from XRD. A, Major veins plus outlines for the aeromagnetic demagnetised zone and radiometric K anomaly (Harris et al. Citation2005), B, adularia, C, albite, D, illite, mixed-layered illite-smectite, smectite, E, chlorite, and F, calcite. (Stuart et al. Citation2005; Simpson et al. Citation2019). Sample locations are marked by x’s. The amount of interlayered illite in mixed-layered illite-smectite is indicated in the boxes; 0.9 corresponds to an illite-smectite with 90 percent illite.
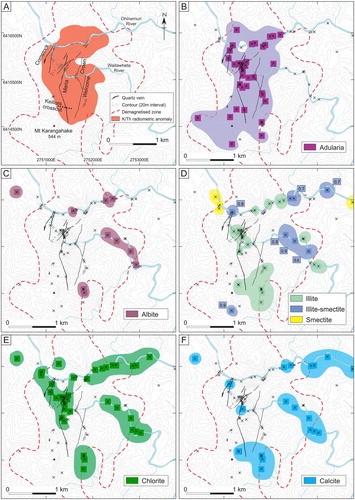
Figure 8. Mineral percentages of selected hydrothermal alteration minerals determined from quantitative XRD for samples along the Keillors crosscut, Karangahake deposit. The amount of adularia is greater in altered rocks near to the Maria, Welcome/Crown and Mystery veins. Albite and chlorite are present in samples between the veins but is absent in the samples directly adjacent the Maria and Welcome/Crown veins (Simpson et al. Citation2019). The amount of quartz shows minor variation, though notably in a few samples, the amount of adularia exceeds that of quartz. The location of the Keillors crosscut is shown in figure 7A.
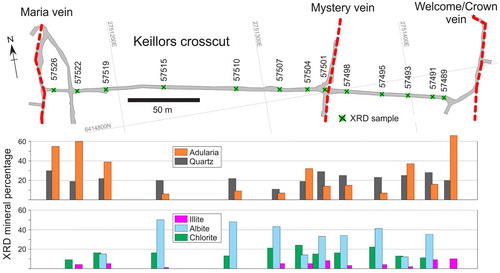
Figure 9. Maps showing the distribution of hydrothermal alteration minerals in the Martha open pit identified from XRD, A, adularia, B, albite, C, illite, illite-smectite, smectite, D, chlorite, and E, calcite (Castendyk et al. Citation2005; Simpson and Mauk Citation2007). The amount of interlayered illite in mixed-layered illite-smectite is indicated in the boxes; 0.9 corresponds to an illite-smectite with 90 percent illite. Smectite and illite-smectite with 70–80% illite occur in lenses of weakly altered rock (‘hard bars’). Veins are at 1,020 m RL (1,000 m RL = seal level), and contours are at 20-m intervals. Circles show sample locations. The location of the Martha open pit is shown in figure 2B.
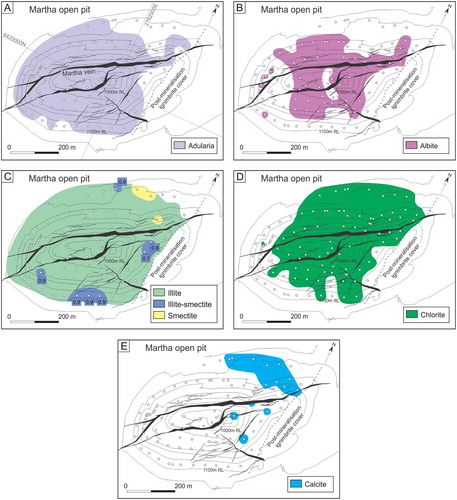
Figure 10. Cross sections along the 1000mN and 600mN drill lines showing the distribution of alteration minerals at the Favona deposit identified from XRD. A, And B, adularia plus albite, C, and D, illite, illite-smectite and smectite, E, and F, chlorite plus calcite (Simpson and Mauk Citation2007). Calcite is shown as spot samples due to minor and sporadic occurrence. Circles show sample locations. Cross section locations are shown in figure 2B. RL = relative level with 1,000m RL = sea level.
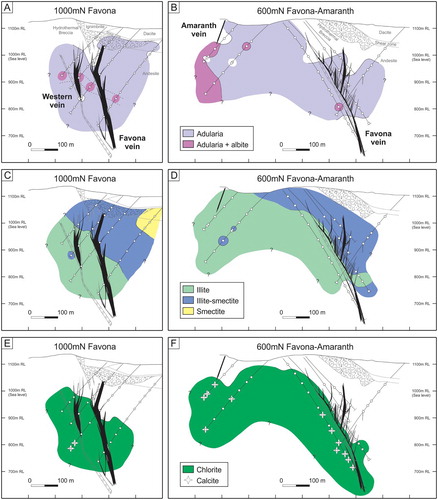
Figure 11. Cross sections along the 5050mN and 4850mN drill lines showing the distribution of alteration minerals at the Golden Cross deposit. A, And B, adularia, C, and D, illite and illite-smectite, E, and F, calcite (modified Simpson et al. Citation2001). The occurrence of chlorite is not shown as it is ubiquitous. Circles show sample locations. Cross section locations are shown in figure 2C. RSL = relative current sea level.
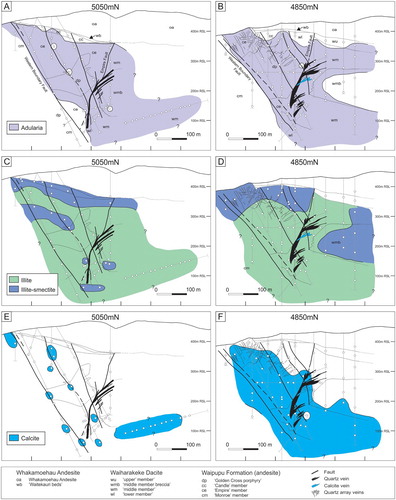
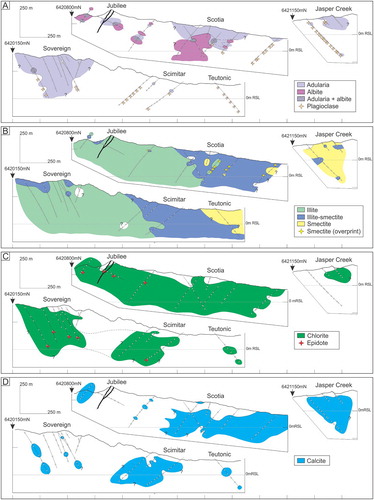
Figure 12. Cross sections through the Waitekauri deposits and prospects showing the occurrence of selected alteration minerals identified from XRD and petrography. A, Adularia, albite and igneous plagioclase, B, illite, illite-smectite and smectite, C, chlorite plus epidote, and D, calcite (modified Simpson and Mauk Citation2011). Circles show sample locations. Several drill holes protrude above the cross section topographic surface because they have been projected onto the section. Cross section locations are shown in figure 2D. RSL = relative current sea level.
Hydrothermal albite is an uncommon alteration mineral, though its occurrence is potentially underreported as automated mineralogy mapping at Karangahake and Waihi have reveal some albite not previously identified by other techniques (Hughes et al. Citation2017; Simpson et al. Citation2019). Hydrothermal albite is an alteration product of plagioclase phenocrysts and laths (). Quantitative XRD and automated mineralogy analyses indicate albite can constitute up to 50 percent of the rock, but typically is much less (). Albite can coexist or occur independent of adularia, and similarly, can be successively altered to varying amounts of illite, mixed-layered illite-smectite, and overprinted by calcite. The timing relationship between albite and adularia, where both are present, is difficult to resolve, although at Karangahake, some albite has formed prior to adularia (D; Simpson et al. Citation2019).
Hydrothermal albite has been identified at the Karangahake, Martha, Favona, and Waitekauri deposits. At the Waihi vein system, albite coexists with adularia in the Martha open pit and in rare samples at Favona ( and ); automated mineralogy mapping investigation of two drill holes extending from the Martha and Correnso veins identified albite beyond the extent of adularia alteration (Hughes et al. Citation2017). At Karangahake, albite in outcrop samples has a patchy distribution generally bordering the adularia halo and is found in both strongly and weakly altered rocks between 0.5 and 1.2 km from the Comstock, Maria, and Welcome/Crown veins (). Albite is coextensive with adularia in the Keillors crosscut that connects the Maria and Welcome/Crown veins (), but here adularia has formed following albite. In drill core from Rahu, located north of the Maria vein, albite alteration occurs beneath a carapace of adularia (Simpson et al. Citation2016). At Scotia (Waitekauri), albite similarly occurs beneath a carapace of adularia and sporadically towards the Jubilee vein, rarely coexisting with adularia (). No albite has been identified at Golden Cross (de Ronde and Blattner Citation1988; Simpson et al. Citation2001). Overall, albite can border the core zone of adularia, but can also coexist with adularia. The depth extent of albite based on depth reconstructions ranges from >300 to >900 m, below the estimated palaeowater table.
Illite, mixed-layered illite-smectite and smectite
Illite, mixed layered illite-smectite and smectite are common clays that have zoned spatial occurrences around epithermal veins. The identification of illite, mixed-layered illite-smectite, and smectite, as well as determination of illite interlayering of mixed-layered illite-smectite has been made via clay separate XRD analyses (Reynolds Citation1980; Moore and Reynolds Citation1997). Spectrally distinction of these clays, which share many of the same absorption features (OH, H2O, Al-OH), is also possible by determining absorption depths ratios (). Calibration surveys at Waitekauri and Favona that compared the reflectance calculated H2O/Al-OH depth ratio values against clay separate XRD mineral identifications have established broad threshold values to differentiate smectite, illite-smectite and illite (Simpson et al. Citation2006; Simpson Citation2015). For Waitekauri, the reflectance calculated H2O/Al-OH ratio values of <0.8 and >1.0 broadly correspond to end-member smectite and illite, respectively; values between correspond to illite-smectite (). However, there is some overlap and not all clay minerals are correctly identified based on this ratio. For example, many illite-smectite samples with 90% illite plot in the illite field and this indicates the limitation of reflectance spectrometers in being able to detect low amounts of smectite in this mixed layered clay. At Favona, a higher reflectance calculated H2O/Al-OH ratio of >1.1 corresponds to illite and <1.1 illite-smectite; the threshold for smectite could not be established as the few samples with smectite also have kaolinite that compromised the ratio. Unlike when using XRD, it was not possible to quantify the amount of illite interlayering in mixed-layered illite-smectite, though it was possible to generalise if it is smectite-rich or illite-rich (c.f. Simpson and Rae Citation2018). Despite these limitations, the same broad-scale zonation of these clays can be ascertained from reflectance spectroscopy ( SWIR versus B clay separate XRD). An NH4-illite has also been identified from reflectance spectroscopy and is described in a separate section detailing NH4-minerals below.
Figure 13. Representative reflectance spectra of alteration minerals. A, Smectite, B, mixed-layered illite-smectite with 70 percent illite, and C, illite, Waitekauri deposits and prospects. Smectite, illite-smectite and illite all have absorption features at ∼1410 nm, ∼1910 nm and ∼2205 nm, but have different absorption intensities and can be differentiated based on the H2O/Al-OH depth ratio (). D, To H, NH4-minerals from the Wharekirauponga prospect. E, Buddingtonite and H, NH4-illite. Since a spectral profile is the sum of all spectrally responsive minerals a sample with both buddingtonite and illite can generate a spectral profile that resembles NH4-illite. Spectral profiles for samples E, F and possibly G appear to be mixtures of buddingtonite and illite with varying amounts of each mineral. The greater the amount of illite the more subdued the signal from buddingtonite.
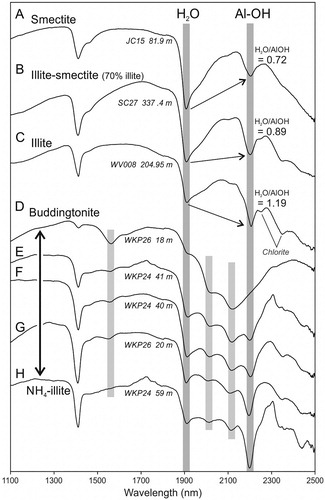
Figure 14. Reflectance spectrometry calculated H2O/Al-OH depth ratio plotted against Al-OH wavelength value for samples from the Waitekauri deposits and prospects and deposits with clay type distinction based on clay-separate XRD. A, Data for smectite, mixed-layered illite-smectite and illite with proposed dashed spectral threshold H2O/Al-OH depth values; <0.8 and >1.0 generally correspond to smectite and illite. B, Mixed-layered illite-smectite (IS) with illite percentages from clay separate XRD differentiated (Simpson et al. Citation2006).
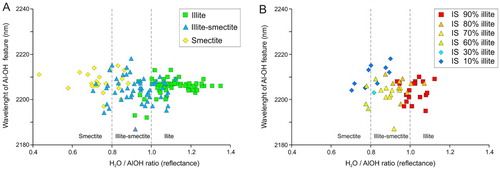
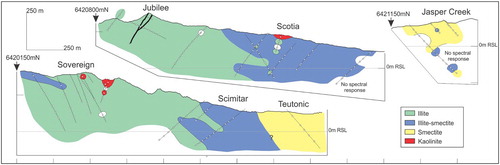
Figure 15. Cross sections through the Waitekauri deposits and prospects showing the distribution of smectite, mixed-layered illite-smectite and illite, identified from reflectance spectroscopy (Simpson et al. Citation2006). The overall distribution of these clays matches that determined from clay separate XRD (B). Circles show sample locations. Several drill holes protrude above the cross section topographic surface because they have been projected onto the section. Cross section locations are shown in figure 2D. RSL = relative current sea level.
Illite generally occurs in strongly altered rocks and illite-smectite in strongly and moderately altered rocks. Both these clays occur as alteration products of plagioclase, adularia and albite ( and ). The extent to which adularia and albite are altered to illite or illite-smectite is highly variable (<5 to >95%; commonly >30%), and often can be overprinted by later calcite. Smectite is present in strongly, moderately and weakly altered rocks. In weakly altered volcanic rocks, glass, amphibole, pyroxene and plagioclase incipiently along fractures, are altered to smectite. In moderately to strongly altered volcanic rocks, plagioclase is more strongly altered to smectite ().
The spatial occurrences of illite, mixed layered illite-smectite and smectite as determined from clay separate XRD are best documented for the Waitekauri, Karangahake, Martha, Favona, and Golden Cross deposits. For all these deposits, the proportion of interlayered illite in mixed layered illite-smectite typically increases systematically towards the illite zone. At Waitekauri, illite grades eastward into mixed-layered illite-smectite and to outlying smectite along a 3 km long drill line cross section with smectite at Jasper Creek occurring over a 400 m vertical extent (). At Karangahake from surface outcrop samples, illite occurs around veins and is present up to 1.3 km E of the Welcome/Crown vein. Illite is bordered by local illite-smectite and outlying smectite (). At Favona, illite is generally restricted to the footwall of the Favona vein but is locally present in the hanging wall at depth (). In a single drill hole, there is a progression from illite to illite-smectite to outlying smectite (C). At Golden Cross, illite envelops the Empire vein and illite-smectite occurs as an approximate 50 m thick carapace above the illite zone (). Illite extends 100 to >350 m into the footwall of the Empire vein. Along the drainage drive at the southern extent of the Empire vein, illite grades into illite-smectite in the footwall with the latter laterally persistent over >600 m. Illite-smectite also occurs in a breccia of the Waiharakeke Dacite close to the Empire vein but flows of the same unit above and below the breccia are altered to illite (D).
NH4-feldspar (buddingtonite) and NH4-illite
Reflectance spectroscopy has identified ammonium feldspar (buddingtonite [NH4AlSi3O8]) and an ammonium illite (suspected tobelite [(NH4,K)Al2(Si3Al)O10(OH)2]; Higashi Citation1982), in altered volcanic rocks at some prospects and deposits. NH4-illite appears more common, but because a spectral profile is the sum of all spectrally responsive minerals, a sample with both buddingtonite plus illite can generate a profile very similar, if not indistinguishable, from NH4-illite (). Because of this uncertainty, in the following, buddingtonite and NH4-illite are not differentiated and are collectively referred to as NH4-minerals.
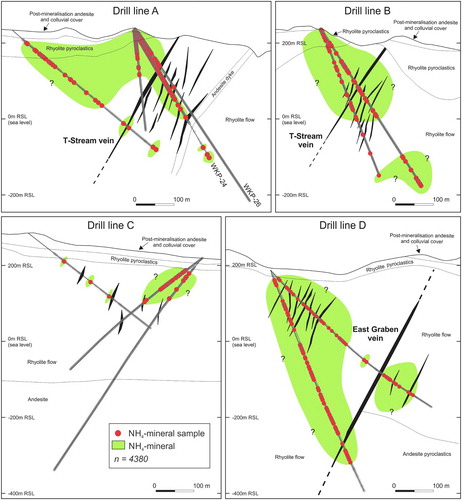
At the andesite-hosted Waihi vein system, the occurrence of NH4-minerals has been examined in drill holes that intersect the Favona, No. 9, and Correnso veins. NH4-minerals are most common in drill core along the 1200mN drill line section that transects the Favona vein and broadly surround the Favona vein (). Along the 1000mN section, NH4-minerals are mostly restricted to the hanging wall of this vein, with a few occurrences in the footwall. NH4-minerals also coincide with the nearby barren No. 9 vein over a 100 m interval; though this is based on the spectral investigation of a single drill hole. By contrast, along a drill line section through the Correnso vein (643260mN), NH4-minerals occur sporadically apart from a 105 m drill length interval in a single footwall drill hole adjacent the Correnso vein. At the rhyolite-hosted Wharekirauponga prospect, NH4-minerals are common and the occurrences of NH4-minerals in drill core is variable (). Some drill holes have near continuous interval of rocks with NH4-minerals (∼100–200 m drilled length), whereas other drill holes have broad, but patchy intervals (∼550 m drilled length). At Wharekirauponga, the occurrence of NH4-minerals coincides with sheeted quartz vein zones and some wider quartz veins (>0.5 m), but not all sheeted or wider quartz veins have wall rocks altered with NH4-minerals ().
Figure 16. Cross sections along the 1200mN and 1000mN drill lines showing the distribution of NH4-minerals at the Favona deposit (Simpson Citation2015). The locations of the cross sections are shown in figure 2B. Reflectance spectra at Favona were collected on average every 5 m but only those identified with ammonium are shown (circles). RL = relative level with 1,000m RL = sea level.
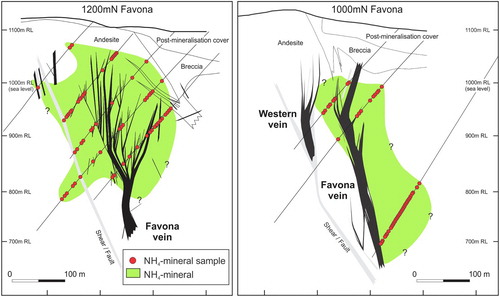
Figure 17. Cross sections along drill lines A to D showing the distribution of NH4-minerals at the Wharekirauponga prospect (Simpson Citation2018). NH4-minerals broadly envelop or occur adjacent to many of the sheeted quartz vein zones and quartz veins, but there are some veins in which the adjacent rocks lack NH4-minerals. On drill line section A, NH4-minerals are continuous along drill hole WKP-24 to a drilled depth of 220 m, but in an adjacent drill hole, WKP-26 only occur to a drilled depth of 120 m. Circles show sample locations. The locations of the cross sections are shown in figure 2E. RSL = relative current sea level.
Overall, reflectance spectroscopy reveals the occurrence of NH4-minerals in altered rocks at some prospects and deposits. However, there are prospects and deposits that do not have NH4-minerals, for example, Broken Hills (Carson Citation2017), Karangahake (unpublished), and Waitekauri (Simpson et al. Citation2006).
Chlorite
Chlorite is a common and widespread alteration mineral (, , , and ), that occurs in strongly, moderately and weakly altered rocks. In volcanic rocks, chlorite most prominently occurs as an alteration product of pyroxene and amphibole phenocrysts ( and ), but also is an alteration mineral of the groundmass. The amount of chlorite can vary as a function of rock type with this mineral more abundant in altered andesite compared to rhyolite.
Epidote
Epidote is rarely found and mostly identified from thin section petrography due to its low abundance (<0.5 vol.%). In volcanic rocks, epidote is an alteration product of plagioclase and occurs as anhedral grains in the groundmass. Epidote less commonly is an alteration product of pyroxene and amphibole. Sporadic and trace amounts of epidote have been identified at the Karangahake, Waihi, (Jennings Citation1991; Brathwaite and Faure Citation2002), Waitekauri (; Sovereign and Jubilee), and Tui deposits (Weissberg and Wodzicki Citation1970). Based on depth reconstructions epidote at these deposits formed at depths of >450 m below the estimated palaeowater table. No epidote has been recognised at Golden Cross. Visually recognisable epidote occurs in propylitic altered rocks associated with the Ohio Creek porphyry Cu-Mo-Au prospect (Brathwaite et al. Citation2001b).
Pyrite and Hematite
Pyrite is a common alteration mineral that occurs as finely disseminated anhedral to euhedral grains throughout the groundmass of volcanic rocks. Pyrite is also a minor alteration product of pyroxene and amphibole phenocrysts occurring together with common and more abundant chlorite. In rocks adjacent significant veins pyroxene and amphibole can be altered to pyrite and quartz.
In contrast, hematite is an uncommon alteration mineral. It is most prominently seen patchily distributed in drill core from the Teutonic and, Jasper Creek prospects and the eastern margin of Scotia deposit (Waitekauri), as a submicroscopic pervasive dissemination. The strongest development of hematite is seen over a 60-m interval in the deepest drill hole at Jasper Creek. While hematite can form during cooling and degassing of the lava at subsolidus temperatures, the hematite at Waitekauri is considered hydrothermal since it coincides with narrow quartz-hematite-pyrite (<5 cm wide) and quartz-hematite veins that are cut by calcite veins and clearly of hydrothermal origin. Weak hematite alteration and vein hematite are associated with hard bars at Golden Cross, and rare narrow veins (<1 cm wide) of hematite occur in outlying weakly altered rocks at Karangahake (D).
Calcite
Calcite is the most common carbonate mineral that occurs as an alteration mineral and as a gangue mineral in veins. Calcite occurs in strongly, moderately and weakly altered rocks and constitutes up to 20 volume percent of the rock. In strongly altered volcanic rocks, calcite often has the appearance of filling voids in feldspar phenocrysts overprinting adularia, albite and illite (). Some feldspar is exclusively altered to calcite and calcite can also locally flood the groundmass. In moderately to weakly altered volcanic rocks calcite together with chlorite occur as an alteration product of pyroxene and amphibole; plagioclase is incipiently calcite altered along fractures (). Overall, calcite in moderate to weakly altered rocks appears to have formed at the same time as chlorite and illite, but in strongly altered rocks, most calcite appears late stage, overprinting adularia, albite and illite. Other carbonates identified include rare siderite at Golden Cross, and minor ankerite and dolomite at the central Maratoto valley (Hikutaia) prospect (Kendrick et al. Citation1999; Simpson et al. Citation2004).
The spatial occurrence and amount of calcite is highly variable within and between deposits and prospects. At Golden Cross, calcite alteration is widespread with this mineral common along the 4650 and 4850mN drill line sections, but it is rare on the 5050mN section, where together with minor siderite it appears mostly near faults (). At Waitekauri, calcite is common and widespread at Scotia, Scimitar, and Jasper Creek, but is less common to rare and sporadically distributed at Jubilee, Sovereign, and Teutonic (). Minor calcite occurs at Karangahake where it mainly occurs to the east and at the southern extent of the Maria and Welcome/Crown veins (). By contrast, in the Martha open pit and along the Favona drill line sections, calcite is uncommon with localised occurrences ( and ), though calcite alteration is more abundant N and NE of the Martha open pit (Jennings et al. Citation1990; Jennings Citation1991). At Golden Cross, Waitekauri and NE of the Martha open pit, calcite alteration coincides with calcite veins that can range from a millimetre to greater than a metre wide.
Kaolinite
Kaolinite is found at several prospects and deposits and is easily identified using reflectance spectroscopy that can detect trace amounts of this mineral. Kaolinite is typically present in rocks variably stained by iron oxyhydroxides and can occur to depths of >400 m below the current ground surface (e.g. Wharekirauponga and Karangahake). This association of kaolinite with iron oxyhydroxides suggests in most cases that kaolinite is due to weathering. At Favona, near the present-day surface, there are localised occurrences of kaolinite with alunite (Oldfield Citation1989), and at Golden Cross, minor kaolinite with rare alunite was exposed at a shallow level in the former open pit (Simpson et al. Citation2001). Stable isotope analysis of the Golden Cross alunite indicates that it is hydrothermal in origin (Hoskin et al. Citation1994) and by inference the kaolinite also. The origin of kaolinite at Favona is less certain, although it occurs near silica sinter (palaeo-surface) and likely formed in an associated steam-heated environment.
Discussion
Epithermal veins of the Hauraki goldfield have associated widespread alteration halos in which the rocks are altered by a variety of hydrothermal minerals. The most common alteration minerals are quartz, adularia, chlorite, illite, mixed-layered illite-smectite, smectite, calcite, pyrite, and minor albite. Mapping of individual alteration minerals has revealed that many have consistently zoned distribution that can be broadly related to the occurrence of quartz veins and include, adularia, illite, mixed-layered illite-smectite, smectite, and NH4-minerals. These same alteration minerals occur in modern geothermal systems where they can be related to fluids of known temperature, pressure, mass flow and chemical composition, and their occurrence correlated with respect to the hydrologic structure (i.e. zones of fluid upflow, outflow, and incursion) (e.g. White Citation1955, Citation1981; Henley and Ellis Citation1983; Henley and Hedenquist Citation1986; Reyes Citation1990; Simmons and Browne Citation2000).
Modern geothermal systems and alteration mineral zonation
Geothermal systems occur in volcanic arcs and rifts and involve deep convective circulation (>5 km) of magma-heated, modified, meteoric water. There are three main end-member fluid types and the distribution of these fluids largely influenced by topographically controlled hydraulic gradients (Henley and Ellis Citation1983; Henley and Hedenquist Citation1986; Giggenbach Citation1997). The dominant fluid is near-neutral pH chloride waters (220° to 335°C), that have variable chloride, dissolved CO2, and H2S contents (Giggenbach Citation1995). As the chloride waters rise in the central upflow zone, boiling can occur at depths of 1–2-km below the water table resulting in dissolved gases (CO2 and H2S) partitioning into the vapour. This vapour at shallow levels or on the margins can condense or be absorbed into groundwater to form two types of steam-heated waters; CO2-rich and acid sulfate. Bicarbonate or CO2-rich steam-heated waters occur at shallow levels above the upflow, on the margins or in perched aquifers (Mahon et al. Citation1980; Hedenquist and Stewart Citation1985). Steam-heated acid sulfate condensates form via absorption and oxidation of H2S-bearing steam to form sulfuric acid (H2SO4) above the water table (White Citation1957; Schoen Citation1969; Schoen et al. Citation1974). Hybrid compositions form where the waters mix (i.e. mixed chloride-sulfate waters, sulfate-CO2 waters), and changes in the hydrology can result in steam-heated CO2-rich and acid sulfate waters encroaching into areas previously occupied by chloride waters. In low relief geothermal systems of the Taupo Volcanic Zone, New Zealand, the steam-heated waters occur above, and on, the periphery of the chloride water plume, with CO2-rich steam-heated waters occurring from near surface to depths greater than 1,000 m below the water table (Hedenquist Citation1990; Simmons and Browne Citation2000).
Interaction of chloride waters and associated shallow and marginal condensates (CO2-rich, acid sulfate, hybrid waters) with the rocks produces extensive zones of hydrothermal alteration and a diversity of hydrothermal minerals (Browne Citation1978). The main hydrothermal minerals that form from chloride waters are quartz, adularia, albite, chlorite, illite, calcite, and pyrite, with or without minor epidote and wairakite (Steiner Citation1968; Browne and Ellis Citation1970; Hedenquist and Browne Citation1989; Simmons and Browne Citation2000). Adularia, albite, illite, wairakite, and epidote occur at depth, and are successively mantled by mixed-layered illite-smectite and smectite with or without mordenite at shallower levels and on the margins. Interaction of CO2-rich steam-heated waters results in the formation of calcite, siderite, smectite, mixed-layered illite-smectite and kaolinite (Hedenquist Citation1990; Simmons and Christenson Citation1994). Whereas, steam-heated acid sulfate waters that leach the rocks have associated kaolinite, gypsum, alunite, and opal alteration (Schoen et al. Citation1974).
Some individual alteration minerals have restricted occurrences that broadly correlate with temperature or inferred permeability. Temperature-sensitive minerals include, clays (illite, mixed-layered illite-smectite, smectite), zeolites (mordenite, laumontite, wairakite) and calc-silicates (epidote), among others. In Taupo Volcanic Zone geothermal systems, smectite, mixed-layered illite-smectite and illite generally coincide with measured well temperatures of <130°, 130° to 230° and >230°C, respectively (Steiner Citation1968; Harvey and Browne Citation1991; Simmons and Browne Citation2000). Mordenite, laumontite and wairakite generally coincide with measured well temperatures of <150°, <220° and >200°C, respectively; and epidote >240°C (Browne and Ellis Citation1970; Steiner Citation1977; Reyes Citation1990). Ammonium minerals (NH4-illite and buddingtonite) spectrally identified at the Ohaaki geothermal field are inferred to form at temperatures of ≥200°C (Yang et al. Citation2001). The permeability of rocks can be inferred from hydrothermal feldspars based on their general occurrences and comparison with the measured permeability (from spinner, injectivity and discharge tests) from geothermal wells (Browne Citation1970; Browne and Ellis Citation1970). Adularia is the dominant feldspar in the central upflow from 100 to >1,000 m depth, with adularia and adularia plus albite inferred to indicate high permeability. Albite that boarders the core zone of adularia or adularia plus albite is inferred to signify lower permeability (Browne Citation1970; Simmons and Browne Citation2000). Adularia in the host rocks is also an indirect indicator mineral of boiling chloride waters that have become alkaline due to gas loss (Browne and Ellis Citation1970). The amounts and occurrences of calcite, zeolites (e.g. wairakite, mordenite), and epidote are variable and controlled by the concentration of dissolved CO2 in chloride waters (Browne and Ellis Citation1970). Chloride waters with low CO2 content (0.05 wt.%), favour the formation of zeolites and epidote, whereas chloride waters with high CO2 (0.2 wt.%), favour the formation of calcite and inhibit zeolites and epidote formation (Browne and Ellis Citation1970; Hedenquist and Henley Citation1985).
Hauraki goldfield palaeo-hydrothermal systems
Epithermal quartz veins of the Hauraki goldfield are hosted in andesite, dacite, rhyolite and less commonly greywacke. The composition of the volcanic rocks appears to have only minor influence on the type of alteration minerals in strongly altered rocks, although the physical properties (porosity, textures) have a strong control on the intensity of alteration (c.f. Browne, Citation1978). For epithermal deposits of the Hauraki goldfield, the alteration mineral association of quartz, adularia, albite, chlorite, illite, illite-smectite, smectite, pyrite and some calcite are considered to have formed from chloride waters. Minor marginal hematite has possibly formed by the mixing of chloride waters with more oxygenated groundwaters. Late calcite is likely to have formed from descending steam-heated CO2-rich waters and some kaolinite with or without alunite from steam-heated acid sulfate waters. The large-scale zonation of illite, illite-smectite and smectite is interpreted to reflect broad scale thermal gradients with inferred temperatures of >230°C in the core and <130°C towards the margins of the hydrothermal system. These temperatures inferred from clay minerals are generally consistent with those inferred from other temperature-sensitive minerals (e.g. epidote, zeolites) and those derived from fluid inclusions in quartz and calcite (e.g. Waitekauri; Simpson and Mauk Citation2011). However, the occurrence of illite-smectite or smectite in hard bars or associated with a specific rock type (e.g. Waiharakeke Dacite breccia, Golden Cross) suggest clay formation in these settings is primarily controlled by physical properties of the rock (Simpson et al. Citation2001; Tillick et al. Citation2001). In these instances, the rock is inferred to have been less permeable with lesser fluid-mineral interaction and limited element exchange preventing the formation of illite.
In addition, temperature sensitive minerals can be further used to infer minimum formation depths. Under boiling hydrostatic conditions, illite-smectite (130–230°C), illite (≥230°C) and epidote (≥240°C) indicate minimum formation depths of approximately 40, 300, and 370 m below the water table, respectively (Haas Citation1971). These are minimum formation depths and will be greater when these minerals form under non-boiling conditions.
In general, intense alteration of volcanic rocks indicates significant amounts of fluids have passed through the rocks. Rocks altered to adularia that commonly enclose quartz veins corresponds to regions of inferred high permeability and significant fluid flow. Adularia with coexisting albite is also considered to indicate high permeability, whereas albite without adularia that boarders the core of adularia or adularia plus albite is inferred to indicate lower permeability. However, the relationship between adularia and albite is not always clear and in the Keillors crosscut (Karangahake), albite formed prior to adularia, suggesting that the permeability structure there changed with time (Simpson et al. Citation2019). This alteration of albite by adularia has also been reported at the Waiotapu geothermal system and attributed to changing permeability (Hedenquist and Browne Citation1989).
The overall amount and spatial occurrence of calcite is highly variable within and between prospects and deposits. Calcite commonly occurs as a late stage overprinting mineral that is coextensive with late stage calcite veins. Isotopic studies of late calcite veins at Golden Cross have determined that the δ18O composition of water that deposited calcite is up to 2.5 per mil lower than the water that formed Au-Ag-bearing quartz veins (Simmons et al. Citation2000). A similar difference of 1.5–2.5 per mil has been measured between chloride and steam-heated water in geothermal systems (Giggenbach and Stewart Citation1982; Hedenquist and Stewart Citation1985; Simmons and Christenson Citation1994), and thus the massive calcite veins, and by extension calcite alteration at Golden Cross are interpreted to have formed from steam-heated CO2-rich waters (Simmons et al. Citation2000). Accordingly, the distribution of late calcite reflects the former occurrence of CO2-rich waters that at Golden Cross were dominant at the southern extent of the deposit (). The low occurrence of calcite at the Waihi vein system ( and ), and the zoned calcite occurrence at Waitekauri () is interpreted to indicate hydrologic controls on the former distribution of CO2-rich waters. In the case of the Waihi vein system, the lack of epidote and zeolites (indicating high CO2 fluids), coupled with a tilted palaeowater table (from fluid inclusions), is inferred to have resulted in the dispersal of CO2-rich waters away from the main upflow zones and prevented their incursion on thermal collapse resulting in the general lack of calcite (Simpson and Mauk Citation2007).
Alteration mineral vein proximity indicators
Several minerals have zoned distribution with respect to veins () that can potentially be useful for locating veins at other prospects; specifically, illite, mixed-layered illite-smectite, smectite, adularia and NH4-minerals (buddingtonite and NH4-illite). shows the schematic distributions of these alteration minerals and how they relate to veins based on epithermal deposits of the Hauraki goldfield. At a deposit scale, illite, illite-smectite and smectite have zoned distributions with illite in the core and successively boarded by illite-smectite and outlying smectite (, , and ). Quartz veins, both mineralised and unmineralised, typically occur in rocks altered to illite. At the Waihi vein system, the Favona vein in part cuts across and in part parallels the boundary between illite and illite-smectite suggesting the potential for other significant veins near and transecting this boundary. Stockwork quartz veins occur in both illite and illite-smectite altered rocks. No significant quartz veins occur in smectite altered rocks.
Figure 18. The lateral extent of selected alteration minerals in relation to the Empire, Favona and Martha veins. Data for the Empire vein (Golden Cross) and the Favona vein (Waihi vein system) is from drill line cross sections (shown in Figs 2B and 2C). Data for the Martha vein (Waihi vein system) is based on open pit exposures and a 1 km horizontal drill hole drilled to the NW (UW462 data from Bodger Citation2015).
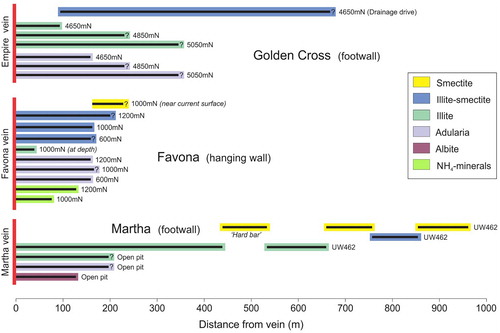
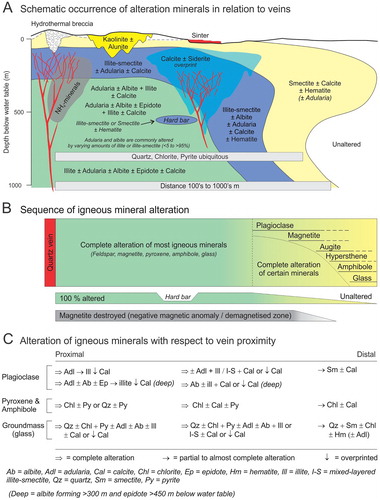
Figure 19. Summary aspects of hydrothermal alteration for epithermal deposits of the Hauraki goldfield. A, Schematic distribution of hydrothermal minerals in relation to veins. B, Sequence of igneous mineral alteration. C, Alteration of igneous minerals.
Adularia alteration forms a halo that can extend laterally up to >500 m from significant quartz veins (). Adularia alteration is broadly coextensive with illite and can overlap with mixed-layered illite-smectite. Adularia is generally not associated with smectite but has been found to locally occur with smectite at Jasper Creek (Waitekauri; ). Accordingly, the distribution of adularia can be more widespread than illite. Adularia is inferred to have formed in the high permeability upflow zone (Brown and Ellis Citation1970; Simmons and Browne Citation2000), and indicates boiling of the hydrothermal fluids, a process highly conducive to the deposition of Au (Simmons et al. Citation2005). Thus, wall rock adularia is an encouraging indicator mineral of mineralisation. However, the absence of adularia does not preclude the occurrence of mineralised veins as quartz veins with bonanza grades at Thames-Tapu and Hauraki-Kapanga-Tokatea do not have any recognised wall rock or vein adularia (Merchant Citation1986; Simpson et al. Citation2011).
Ammonium-minerals have a more restricted distribution around veins and are present in rocks altered to adularia and illite, or less commonly adularia and illite-smectite (Christie and Soong Citation2001; Simpson Citation2015). Ammonium minerals that irregularly envelop the Favona vein are laterally present up to 120 m from this vein (), and NH4-minerals that irregularly enclose sheeted quartz vein zones and quartz veins at Wharekirauponga are locally present up to 300 m from veins (). The NH4-minerals can be associated with economic as well as sub-economic veins (e.g. Favona vein versus No. 9 vein). The source of ammonia is unknown, though is likely to be from the breakdown of organic matter sourced from carbonaceous lacustrine sedimentary rocks or entombed organic matter (e.g. trees) in the basal layer of pyroclastic rocks (Krohn et al. Citation1993). Because rocks containing organic matter are uncommon and of restricted occurrence, this could explain why NH4-minerals are found at some prospects and deposits but are absent from others. Nonetheless, NH4-minerals at Favona, Wharekirauponga, and White Bluffs (OceanaGold, unpublished), coincide with the occurrence of quartz veins. This association of NH4-minerals with quartz veins has been identified from reflectance spectral studies of other epithermal deposits and prospects including the Ivanhoe, McLaughlin, and Sleeper deposits, USA (Krohn et al. Citation1993; Jackson Citation2007), Banderas prospect, Guatemala (Harlap Citation2008), Esquel, Argentina (Soechting et al. Citation2008) and is known from geochemical investigations of the Guanajuato, Pachuca and Tayoltita silver mining districts, Mexico (Ridgeway et al. Citation1991).
Mineral identification during exploration
The identification of adularia, illite, illite-smectite, smectite and NH4-minerals can only be reliably made using analytical techniques which is possible in the field using portable hyperspectral reflectance spectrometers (e.g. Halo, TerraSpec, OreXpress), and portable XRD (Terra XRD). Both techniques have their strengths and limitations. Reflectance spectroscopy can be used to identify clay minerals, but it is unable to detect or distinguish feldspar types (adularia, albite, plagioclase), apart from buddingtonite (NH4-feldspar). Distinction between smectite, illite-smectite and illite is broadly possible from the calculated H2O/Al-OH depth ratio. Calibration surveys at Waitekauri and Favona have established approximate threshold values to distinguish these clays, but they are slightly different for each deposit (Simpson et al. Citation2006; Simpson Citation2015; Simpson and Christie Citation2016). Care needs to be taken when accessing the values as they can be masked by other spectrally overlapping minerals (e.g. kaolinite, gypsum) and intra-crystalline water. Thus, filtering of the data is required with the values from ‘contaminated’ samples excluded. The overall shape of the spectral profile (continuum / background curvature), also has an influence on calculated values as has been found for an identical calibration survey of altered predominantly rhyolitic volcanic rocks for Taupo Volcanic Zone geothermal systems (Simpson and Rae Citation2018). This geothermal study determined that threshold values calculated from hull quotient corrected spectra (continuum removed and spectra ratioed), better align with clay separate XRD results than those calculated from uncorrected reflectance spectra. This contrasts with findings from surveys of epithermal deposits and prospects of the Hauraki goldfield where calculation of the H2O/Al-OH depth ratio for uncorrected reflectance spectra with negatively sloping continuum worked best. Nonetheless by careful filtering and evaluation of the results, reflectance spectroscopy provides the most rapid means to identify illite, illite-smectite and smectite. Moreover, reflectance spectroscopy can be used to identify NH4-bearing minerals that occur near veins.
X-ray diffraction can identify a much greater range of minerals compared to the other methods. Sample analyses using portable XRD is rapid (1–5 min per sample) and requires only minimal sample preparation (crushing). XRD can be used to identify swelling clays, but these can only be reliably determined from glycol-treated clay separates that require time to prepare and using a desktop XRD. From XRD it is possible to quantify mineral abundances. The quantification of alteration minerals at the Karangahake deposit by XRD and from automated mineralogy mapping has determine that the amount of adularia and albite replacing rocks along the Keillors crosscut varies as a function of distance to veins (). The amount of adularia in the rocks increases and is greatest within 50 m of the Maria and Welcome/Crown veins, and within 15 m of the Mystery vein. Conversely, the amount of albite is least or absent near these veins. In surface samples, the greatest amount of adularia occurs in rocks near the Maria and Welcome/Crown veins and the amount of adularia commonly exceeds that of quartz (Simpson et al. Citation2019). This trend of increasing adularia abundance may occur at other prospects and deposits.
An alternative and indirect means to determine the occurrence of adularia is by portable XRF (pXRF). This assumes that all potassium feldspar in the rock is hydrothermal, and in the case of andesitic and rhyolitic rocks of the Hauraki goldfield this is a safe assumption since they contain very little to no sanidine (Booden et al. Citation2012). Based on comparison of pXRF rock chemistry data with XRD identified adularia occurrences at the Waihi vein system, a K/Al ratio value above 0.4 corresponds to a sample with adularia (Hughes and Barker Citation2017). A similar pXRF rock chemistry, XRD and automated mineralogy comparison for altered rocks from the Karangahake deposit determined that samples with a K/Al ratio value above 0.45 have adularia (Simpson et al. Citation2019). In both cases, adularia can still be present in samples with lower values, but above these values, adularia is unequivocal. Taking into consideration these different values, the pXRF K/Al ratio can be used as a proxy for determining the occurrence of adularia (potassium-feldspar).
Concluding comment
This paper presents a summary overview of hydrothermal alteration that encloses epithermal Au-Ag veins for deposits and prospects hosted in volcanic rocks of the Hauraki goldfield. The veins are enclosed in a larger halo of alteration, 6–50 km2 in areal extent that outlines the footprint of the former hydrothermal system. There is no correlation between the amount of contained Au or Ag and the physical size of veins and the aerial extent of alteration; the Waihi vein system has produced more than 7.9 Moz Au and occurs in an alteration halo of strong alteration that is only ∼12 km2 in areal extent. Therefore, the physical dimensions of a vein or size of the alteration halo should not be a limiting factor in targeting epithermal deposits, because both small and large alteration halos can encircle veins that contain substantial amounts of Au and Ag (c.f. Simmons et al. Citation2005).
The rocks are generally strongly altered adjacent to the quartz veins, grading to moderate alteration that can occur anywhere from 150 to >1,500 m from major quartz veins. The rocks are altered to a variety of hydrothermal minerals. Key alteration minerals that are zoned with respect to the veins include illite, illite-smectite, smectite, adularia, and NH4-minerals ( and ). These minerals can only be reliably identified from analytical techniques such as reflectance spectroscopy and XRD, which is possible using field portable instruments. In the case of adularia, the K/Al ratio for altered rocks of the Hauraki goldfield from pXRF can be used as a proxy to determine the occurrence of this mineral (Hughes and Barker Citation2017; Simpson et al. Citation2019). At a system scale, illite, illite-smectite and smectite outline the broad thermal structure of the former hydrothermal system. Significant quartz veins mostly occur in illite altered rocks (e.g. Karangahake), but also across the illite and illite-smectite contact (e.g. Favona); quartz stockwork veins can occur in illite and/or illite-smectite altered rocks (e.g. Scotia) (). Adularia occurs around veins and is coextensive with illite and to a lesser extent illite-smectite and rarely smectite. Adularia rarely coexists with albite, and albite can occur beyond the extent of adularia. Bordering albite alteration can be subtle and could be more widespread than appreciated. At a more localised scale, NH4-minerals can enclose quartz veins and sheeted quartz veins. However, NH4-minerals do not necessarily occur around all veins at a given prospect or deposit and there are prospects and deposits for which these minerals have not been identified. Nonetheless, combined mapping of these alteration minerals can be used to help reconstruct the palaeohydrologic structure of the former hydrothermal system and identify zones of inferred high palaeo-permeability and areas that could contain veins. Ammonium-bearing minerals, when present, are a proximal indicator of veins.
Acknowledgments
This paper presents the culmination of many research projects on gold deposits of the Hauraki goldfield that would not have been possible without the support of the various mining companies and funding by the New Zealand Government through the Ministry of Business, Innovation and Employment (MBIE) and its predecessors. We would like to thank OceanaGold Ltd, Newmont Waihi Gold Ltd, New Talisman Gold Mines Ltd (formally Heritage Gold Ltd), and Coeur Gold New Zealand Ltd for access to their operations, drill core, maps, cross sections, some financial support, as well as invaluable help from many staff; Lorrance Torckler, Rick Streiff, Ross McConnochie, Rohan Worland, Scott Randall, Thomas Gardner, Peter Keall, Murray Stevens, Wayne Chowles, Peter Atkinson, Anton Barbar, Paul Vidanovich, Al McOnie, Peter White, and Paul Rutherford. OceanaGold is further thanked for supplying the aeromagnetic analytical signal map and the reflectance spectra for Wharekirauponga. MPS would like to specially thank Stuart Simmons for starting his journey into the fascinating and rewarding study of hydrothermal alteration initiated at Golden Cross. Studies at Favona, Waitekauri, Karangahake and Wharekirauponga were made possible through funded research programmes led by Jeff Mauk and Tony Christie. Jeff Mauk, Patrick Browne, Craig Panther, Bernard Spörli, Robert Brathwaite, Alistair Stuart, Matthew Harris, Mathijs Booden, Erin Hollinger, Helen Cocker, Ian Warren, Devin Castendyk, Ross Kendrick, Anne Morrell, Michael Gazley, Shaun Barker, and Rosie Hughes are thanked for many helpful discussions. Reviews by Stuart Simmons and Noel White helped improve the manuscript.
Disclosure statement
No potential conflict of interest was reported by the authors.
Additional information
Funding
Related Research Data
References
- Adams CJ, Graham IJ, Seward D, Skinner DNB. 1994. Geochronological and geochemical evolution of the late Cenozoic volcanism in the Coromandel Peninsula, New Zealand. New Zealand Journal of Geology and Geophysics. 37:359–379. doi: 10.1080/00288306.1994.9514626
- Barker SLL, Hughes RM, Hood S. 2019. The lithogeochemical signatures of hydrothermal alteration in the Waihi epithermal district, New Zealand. New Zealand Journal of Geology and Geophysics. 62:513–530.
- Begbie MJ, Spörli KB, Mauk JL. 2007. Structural evolution of the Golden Cross epithermal Au-Ag deposit, New Zealand. Economic Geology. 102:873–892. doi: 10.2113/gsecongeo.102.5.873
- Bell JM, Fraser C. 1912. The geology of the Waihi-Tairua subdivision, Hauraki division. Wellington: Government Printer. New Zealand Geological Survey bulletin 15, 192 p.
- Bodger B. 2015. Andesite volcanic facies and hydrothermal alteration in the subsurface peripheral to existing Waihi mine workings [MSc thesis]. University of Waikato. 248 p.
- Booden MA, Mauk JL, Simpson MP. 2011. Quantifying metasomatism in epithermal Au-Ag deposits: a case study from the Waitekauri area, New Zealand. Economic Geology. 106:999–1030. doi: 10.2113/econgeo.106.6.999
- Booden MA, Smith IEM, Mauk JL, Black PM. 2012. Geochemical and isotopic development of the Coromandel volcanic zone, northern New Zealand, since 18 Ma. Journal of Volcanology and Geothermal Research. 219–220:15–32. doi: 10.1016/j.jvolgeores.2012.01.005
- Brathwaite RL. 1989. Geology and exploration of the Karangahake gold silver deposit. In: Kear D, editor. Mineral deposits of New Zealand. Parkville: The Australasian Institute of Mining and Metallurgy Monograph. 13; p. 73–78.
- Brathwaite RL, Cargill HJ, Christie AB, Swain A. 2001a. Controls on the distribution of veining in andesite- and rhyolite-hosted gold-silver epithermal deposits of the Hauraki goldfields, New Zealand. Mineralium Deposita. 36:1–12. doi: 10.1007/s001260050282
- Brathwaite RL, Christie AB. 1996. Geology of the Waihi area, Institute of Geological and Nuclear Sciences 1:50 000 Geological Map 21.
- Brathwaite RL, Christie AB, Skinner DNB. 1989. The Hauraki goldfield—regional setting, mineralisation and recent exploration. In: Kear D, editor. Mineral deposits of New Zealand. Parkville: The Australasian Institute of Mining and Metallurgy Monograph. 13; p. 45–56.
- Brathwaite RL, Faure K. 2002. The Waihi epithermal gold-silver-base metal sulfide-quartz vein system, New Zealand: temperature and salinity controls on electrum and sulfide deposition. Economic Geology. 97:269–290. doi: 10.2113/gsecongeo.97.2.269
- Brathwaite RL, McKay DF. 1989. Geology and exploration of the Martha Hill gold-silver deposit. In: Kear D, editor. Mineral deposits of New Zealand. Parkville: The Australasian Institute of Mining and Metallurgy Monograph. 13; p. 83–88.
- Brathwaite RL, Simpson MP, Faure K, Skinner DNB. 2001b. Telescoped porphyry Cu-Mo-Au mineralisation, advanced argillic alteration and quartz-sulphide-gold-anhydrite veins in the Thames district, New Zealand. Mineralium Deposita. 36:623–640. doi: 10.1007/s001260100182
- Briggs RM, Houghton BF, McWilliams M, Wilson CJN. 2005. 40Ar/39Ar ages of silicic volcanic rocks in the Tauranga-Kaimai area, New Zealand: dating the transition between volcanism in the Coromandel Arc and the Taupo Volcanic Zone. New Zealand Journal of Geology and Geophysics. 48:459–469. doi: 10.1080/00288306.2005.9515126
- Browne PRL, 1970. Hydrothermal alteration as an aid in investigating geothermal fields. Geothermics. 2:564–570. doi: 10.1016/0375-6505(70)90057-X
- Browne PRL. 1978. Hydrothermal alteration in active geothermal fields. Annual Reviews in Earth and Planetary Sciences. 6:229–250. doi: 10.1146/annurev.ea.06.050178.001305
- Browne PRL, Ellis AJ. 1970. The Ohaki-Broadlands hydrothermal area, New Zealand: mineralogy and related geochemistry. American Journal of Science. 269:97–131. doi: 10.2475/ajs.269.2.97
- Buchanan LJ. 1981. Precious metal deposits associated with volcanic environments in the southwest. Arizona Geological Society Digest. 14:237–262.
- Burkett DA, Graham IT, Ward CR. 2015. The application of portable X-ray diffraction to quantitative mineralogical analysis of hydrothermal systems. The Canadian Mineralogist. 53:429–454.
- Carson L. 2017. Structure and alteration in the Broken Hills district, Coromandel Peninsula. In: Proceedings of the 50th Australasian Institute of Mining and Metallurgy New Zealand Branch Annual Conference; Sept 10-13; Christchurch. p. 381.
- Castendyk D, Mauk JL, Webster JG. 2005. A mineral quantification method for wall rocks at open pit mines, and application to the Martha Au-Ag mine, Waihi, New Zealand. Applied Geochemistry. 20:135–156. doi: 10.1016/j.apgeochem.2004.07.001
- Chambefort I, Lewis B, Simpson MP, Bignall G, Rae AJ. 2017. Ngatamariki geothermal system: magmatic to epithermal transition in the Taupo volcanic zone, New Zealand. Economic Geology. 112:319–346. doi: 10.2113/econgeo.112.2.319
- Christie AB, Brathwaite RL, Rattenbury MS, Skinner DNB. 2001. Mineral resource assessment of the Coromandel region, New Zealand. Lower Hutt: Institute of Geological & Nuclear Sciences. Institute of Geological & Nuclear Sciences science report 2001/11, 84 p.
- Christie AB, Faure K, Rabone SDC, Barker RG. 2003. Boiling and mixing of hydrothermal fluids in the Wharekirauponga rhyolite-hosted epithermal gold-silver deposit, Hauraki goldfield, New Zealand. In: Eliopoulos DG, editor. Proceedings of the Seventh Biennial SGA Meeting on Mineral Exploration and Sustainable Development, Aug 24–28; Athens, Greece. p. 453–456.
- Christie AB, Henderson SM, Grieve PL. 2016. Exploration of the Wharekirauponga epithermal gold-silver prospect, Hauraki goldfield, Coromandel volcanic zone. In: Christie AB, editor. Mineral deposits of New Zealand – exploration and research. Calton: The Australasian Institute of Mining and Metallurgy Monograph. 31; p. 259–271.
- Christie AB, Rabone SDC, Barker RG, Merchant RJ. 2006. Exploration of the Wharekirauponga epithermal Au-Ag deposit, Hauraki goldfield. In: Christie AB, Brathwaite RL, editors. Geology and exploration of New Zealand mineral deposits. Calton: The Australasian Institute of Mining and Metallurgy Monograph. 25; p. 137–144.
- Christie AB, Simpson MP, Brathwaite RL, Mauk JL, Simmons SF. 2007. Epithermal Au-Ag and related deposits of the Hauraki goldfield, Coromandel Volcanic Zone, New Zealand. Economic Geology. 102:785–816. doi: 10.2113/gsecongeo.102.5.785
- Christie AB, Soong R. 2001. Down-hole XRD analyses as a guide to hydrothermal alteration in the Wharekirauponga epithermal gold-silver prospect, Hauraki goldfield, New Zealand. In: Proceedings of the 34th Australasian Institute of Mining and Metallurgy New Zealand Branch Annual Conference; Aug 29-31; Dunedin. p. 227–234.
- David V, Barber S. 1997. An integrated underground mining approach to the structural complexity of the Empire vein system, Golden Cross mine, New Zealand. In: Proceedings of the Australasian Institute Mining and Metallurgy Annual Conference, Resourcing the 21st Century; Mar 12–15; Ballarat, Victoria. p.153–163.
- de Ronde CEJ, Blattner P. 1988. Hydrothermal alteration, stable isotopes, and fluid inclusions of the Golden Cross epithermal gold deposit, Waihi, New Zealand. Economic Geology. 83:895–917. doi: 10.2113/gsecongeo.83.5.895
- Downey JF. 1935. Gold mines of the Hauraki district. Wellington, New Zealand: Government Printer, 315p.
- Edbrooke SW. (compiler) 2001. Geology of the Auckland area, Institute of Geological and Nuclear Sciences 1:250 000 Geological Map 3. 1 sheet + 74 p. Lower Hutt, New Zealand. Institute of Geological and Nuclear Sciences Ltd.
- Fraser C. 1910. The geology of the Thames subdivision, Hauraki, Auckland. Wellington: Government Printer. New Zealand Geological Survey bulletin 10, 136 p.
- Fraser C, Adams JH. 1907. The geology of the Coromandel subdivision, Hauraki, Auckland. Wellington: Government Printer. New Zealand Geological Survey bulletin 4, 154 p.
- Gemmell JB. 2007. Hydrothermal alteration associated with the Gosowong epithermal Au-Ag deposit, Halmahera, Indonesia: mineralogy, geochemistry, and exploration implications. Economic Geology. 102:893–922. doi: 10.2113/gsecongeo.102.5.893
- Giggenbach WF. 1995. Variations in the chemical and isotopic compositions of fluids discharged from the Taupo volcanic zone, New Zealand. Journal of Volcanology and Geothermal Research. 68:89–116. doi: 10.1016/0377-0273(95)00009-J
- Giggenbach WF. 1997. The origin and evolution of fluids in magmatic-hydrothermal systems. In: Barnes HL editor. Geochemistry of hydrothermal ore deposits. 3rd ed. New York: John Wiley and Sons Inc; p. 737–796.
- Giggenbach WF, Stewart MK. 1982. Processes controlling the isotopic composition of steam and water discharges from steam vents and steam-heated pools in geothermal areas. Geothermics. 11:71–80. doi: 10.1016/0375-6505(82)90009-8
- Haas JL. 1971. The effects of salinity on the maximum thermal gradient of a hydrothermal system at hydrostatic pressure. Economic Geology. 66:940–946. doi: 10.2113/gsecongeo.66.6.940
- Harlap A. 2008. Alteration and ammonium enrichment vectors to low-sulphidation epithermal mineralization: insights from the Banderas gold-silver prospect [MSc thesis]. Montreal (Quebec, Canada): McGill University. 133 p.
- Harris M, Cassidy J, Locke C, Mauk JL. 2005. Geophysical characteristics of the Karangahake epithermal deposit, Hauraki goldfield, New Zealand. In: Proceedings of the 2005 New Zealand Minerals Conference; Nov 13–16; Auckland. Crown Minerals, Ministry of Economic Development and Australasian Institute of Mining and Metallurgy, New Zealand Branch. p. 115–124.
- Harvey CC, Browne PRL. 1991. Mixed-layer clay geothermometry in the Wairakei geothermal field, New Zealand. Clay and Clay Minerals. 39:614–621. doi: 10.1346/CCMN.1991.0390607
- Haworth AV, Briggs RM. 2006. Epithermal Au-Ag mineralisation in the lower Waitekauri valley, Hauraki goldfield. In: Christie AB, Brathwaite RL, editors. Geology and exploration of New Zealand mineral deposits. Calton: The Australasian Institute of Mining and Metallurgy Monograph. 25; p. 157–162.
- Hay KR. 1989. Exploration case history of the Golden Cross project, Waihi, New Zealand. In: Kear D, editor. Mineral deposits of New Zealand. Parkville: The Australasian Institute of Mining and Metallurgy Monograph. 13; p. 67–72.
- Hayba DO, Bethke PM, Foley NK. 1985. Geologic, mineralogic, and geochemical characteristics of volcanic-hosted epithermal precious metal deposits. Reviews in Economic Geology. 2:129–167.
- Heald P, Foley NK, Hayba DO. 1987. Comparative anatomy of volcanic-hosted epithermal deposits: acid-sulphate and adularia-sericite types. Economic Geology. 82:1–26. doi: 10.2113/gsecongeo.82.1.1
- Hedenquist JW. 1990. The thermal and geochemical structure of the Broadlands-Ohaaki geothermal system. Geothermics. 19:151–185. doi: 10.1016/0375-6505(90)90014-3
- Hedenquist JW, Arribas A Jr, Gonzales-Urien E. 2000. Exploration for epithermal gold deposits. Reviews in Economic Geology. 13:245–277.
- Hedenquist JW, Browne PRL. 1989. The evolution of the Waiotapu geothermal system, New Zealand, based on the chemical and isotopic composition of its fluids, minerals and rocks. Geochimica et Cosmochimica Acta. 53:2235–2257. doi: 10.1016/0016-7037(89)90347-5
- Hedenquist JW, Henley RW. 1985. Effect of CO2 on freezing point depression measurements of fluid inclusions: evidence from active systems and application to epithermal studies. Economic Geology. 80:1379–1406. doi: 10.2113/gsecongeo.80.5.1379
- Hedenquist JW, Stewart MK. 1985. Natural CO2-rich steam-heated waters at Broadlands, New Zealand: their chemistry, distribution and corrosive nature. Proceedings Geothermal Resources Council Annual Meeting, Transactions. 9:245–250.
- Henderson J, Bartrum JA. 1913. The geology of the Aroha subdivision, Hauraki, Auckland. Wellington: Government Printer. New Zealand Geological Survey bulletin 16, 127 p.
- Henley RW, Ellis AJ. 1983. Geothermal systems ancient and modern: a geochemical review. Earth Science Reviews. 19:1–50. doi: 10.1016/0012-8252(83)90075-2
- Henley RH, Hedenquist JW. 1986. Introduction to the geochemistry of active and fossil geothermal systems. Berlin-Stuttgart, Gebrüder Bornträeger, Monograph Series Mineral Deposits. 26:1–22.
- Higashi S. 1982. Tobelite, a new ammonium dioctahedral mica. Mineralogical Journal. 113:138–146. doi: 10.2465/minerj.11.138
- Hobbins JM, Torckler LK, Rhys DA, Ross KV, Mauk JL. 2012. The Correnso epithermal gold-silver deposit, a new blind discovery in Waihi, Hauraki goldfield, New Zealand. In: Proceedings of the 45th AusIMM New Zealand Branch Annual Conference; Aug 26–29; Rotorua. p. 227–240.
- Hochstein MP, Ballance PF. 1993. Hauraki rift: a young, active, intracontinental rift in a back-arc setting, in South Pacific Sedimentary Basins, Sedimentary Basins of the World 2: Elsevier, Amsterdam, p. 295–305.
- Hochstein MP, Tearney K, Rawson K, Davey FJ, Davidge S, Henrys S, Backshall D. 1986. Structure of the Hauraki rift (New Zealand). Royal Society of New Zealand Bulletin. 24:333–348.
- Hoskin PWO, Seal RR, Mauk JL. 1994. Sulphur isotope geochemistry of FeS2 at the Golden Cross mine, Coromandel peninsula, New Zealand. Geological Society of New Zealand Miscellaneous Publication. 80A:93.
- Hudson DM. 2003. Epithermal alteration and mineralisation in the Comstock District, Nevada. Economic Geology. 98:367–386. doi: 10.2113/gsecongeo.98.2.367
- Hughes R, Barker SLL. 2017. Using portable XRF to infer adularia halos within the Waihi Au-Ag system, New Zealand. Geochemistry: Exploration, Environment, Analysis (GEEA), geochem2016-006. doi:10.1144/geochem2016-006.
- Hughes R, Barker SLL, Gazley MF. 2017. Detecting and mapping adularia alteration in the Waihi system, using TESCAN integrated minerals analysis, X-ray diffraction and portable X-ray fluorescence. In: Proceedings of the 50th Australasian Institute of Mining and Metallurgy New Zealand Branch Annual Conference; Sept 10–13; Christchurch. p. 413–422.
- Jackson RG. 2007. 3D Geochemical and Mineralogical Model of the Sleeper Low Sulphidation Gold System, Nevada. In Milkereit, B., eds., In Proceedings of Exploration07, 3D Geochemistry Applied to Mineral Exploration; Fifth Decennial International Conference on Mineral Exploration; Sept 9–12; Toronto, Ontario. p. 317–330.
- Jennings K. 1991. Hydrothermal alteration and geochemistry of the Waihi epithermal gold-silver deposit, New Zealand [MSc thesis]. Auckland: University of Auckland. 143 p.
- Jennings K, Browne PRL, Clarke DS, Brathwaite RL. 1990. Aspects of hydrothermal alteration at the Waihi epithermal Au-Ag deposit, New Zealand. New Zealand Geothermal Workshop, 12th, Auckland, 1990, Proceedings, p. 237–242.
- Keall PC, Cook WC, Mathews SJ, Purvis AH. 1993. The geology of the Golden Cross orebody: complex veining and evolving mining responses. In: Proceedings of the 27th Australian Institute of Mining and Metallurgy New Zealand Branch Annual Conference; Aug 24-27; Wellington. p. 143–160.
- Kendrick R, Mauk JL, Grieve P. 1999. Hydrothermal vein sequence and alteration of the central Maratoto valley, Coromandel Peninsula, New Zealand. In: Proceedings of the 32nd Australasian Institute of Mining and Metallurgy New Zealand Branch Annual Conference; Sept 8–10; Waitangi. p 31–40.
- Krohn MD, Kendall C, Evans JR, Fries TL. 1993. Relations of ammonium minerals at several hydrothermal systems in the western U.S. Journal of Volcanology and Geothermal Research. 56:401–413. doi: 10.1016/0377-0273(93)90005-C
- Mahon WAJ, Klyen LE, Rhode M. 1980. Neutral sodium/bicarbonate/sulphate hot waters in geothermal systems. Chinetsu. Journal Japanese Geothermal Energy Association. 17:11–24.
- Malengreau B, Skinner D, Bromley C, Black P. 2000. Geophysical characterisation of large silicic volcanic structures in the Coromandel Peninsula, New Zealand. New Zealand Journal of Geology and Geophysics. 43:171–186. doi: 10.1080/00288306.2000.9514879
- Mauk JL, Hall CM, Chesley JT, Barra F. 2011. Punctuated evolution of a large epithermal province: the Hauraki goldfield, New Zealand. Economic Geology. 106:921–943. doi: 10.2113/econgeo.106.6.921
- Mauk JL, Simpson MP. 2007. Geochemistry and stable isotopic composition of wall rock alteration at the Golden Cross epithermal Au-Ag deposit, New Zealand. Economic Geology. 102:841–871. doi: 10.2113/gsecongeo.102.5.841
- Merchant RJ. 1986. Mineralization in the Thames district-Coromandel. Gebrüder Bornträeger, Berlin, Monograph Series on Mineral Deposits. 26:147–163.
- Meyer C, Hemley JJ. 1967. Wall rock alteration. In: Barnes HL, editor. Geochemistry of hydrothermal ore deposits. 1st ed. New York: Holt Rinehart & Winston; p. 166–235.
- Moore DM, Reynolds RC. 1997. XRD and the identification and analysis of clay minerals. 2nd ed. New York: Oxford University Press. 378p.
- Morgan PG. 1924. The geology and mines of the Waihi district, Hauraki Goldfield, New Zealand. Wellington: Government Printer. New Zealand Geological Survey Bulletin 26, 218 p.
- Morrell AE, Locke CA, Cassidy J, Mauk JL. 2011. Geophysical characteristics of adularia-sericite epithermal gold-silver deposits in the Waihi-Waitekauri region, New Zealand. Economic Geology. 106:1031–1041. doi: 10.2113/econgeo.106.6.1031
- Mortimer N, Herzer RH, Gans PB, Laporte-Magoni C, Calvert AT, Bosch D. 2007. Oligocene-Miocene tectonic evolution of the south Fiji Basin and Northland Plateau, SW Pacific Ocean: evidence from petrology and dating of dredged rocks. Marine Geology. 237:1–24. doi: 10.1016/j.margeo.2006.10.033
- New Talisman Gold Mines Limited. 2017. Annual report, p. 32.
- Nicholson KN, Black PM, Hoskin PWO, Smith IEM. 2004. Silicic volcanism and back-arc extension related to migration of the late Cainozoic Australian-Pacific plate boundary. Journal of Volcanology and Geothermal Research. 131:295–306. doi: 10.1016/S0377-0273(03)00382-2
- Oldfield GA. 1989. Union Hill epithermal mineralisation: New Zealand Geothermal Workshop, 11th, Auckland New Zealand, Proceedings, p. 195–200.
- Rabone SDC. 1975. Petrography and hydrothermal alteration of Tertiary andesite-rhyolite volcanics in the Waitekauri valley, Ohinemuri, New Zealand. New Zealand Journal of Geology and Geophysics. 18:239–258. doi: 10.1080/00288306.1975.10418196
- Rabone SM, Moore DH, Barker RG. 1989. Geology of the Wharekirauponga epithermal gold deposit, Coromandel region. In: Kear D, editor. Mineral deposits of New Zealand. Parkville: The Australasian Institute of Mining and Metallurgy Monograph. 13; p. 93–97.
- Reyes AG. 1990. Petrology of Philippine geothermal systems and the application of alteration mineralogy to their assessment. Journal of Volcanology and Geothermal Research. 43:279–309. doi: 10.1016/0377-0273(90)90057-M
- Ridgeway J, Martiny B, Gómez-Caballero A, Macias-Romo C, Villaseñor-Cabral MG. 1991. Ammonium geochemistry of some Mexican silver deposits. Journal of Geochemical Exploration. 40:311–327. doi: 10.1016/0375-6742(91)90045-V
- Rietveld HM. 1969. A profile refinement method for nuclear and magnetic structures. Journal of Applied Crystallography. 2:65–71. doi: 10.1107/S0021889869006558
- Reynolds RC. 1980. Interstratified clay minerals. In: Brindley GW, Brown G, editors. Crystal structures of clay minerals and their X-ray identification. London: Mineralogical Society. p. 249–303.
- Soechting W, Rubinstein N, Godeas M. 2008. Identification of ammonium-bearing minerals by shortwave infrared reflectance spectroscopy at the Esquel gold deposit, Argentina. Economic Geology. 103:865–869. doi: 10.2113/gsecongeo.103.4.865
- Schoen R. 1969. Rate of sulfuric acid formation in Yellowstone National Park. Geological Society of America Bulletin. 80:643–650. doi: 10.1130/0016-7606(1969)80[643:ROSAFI]2.0.CO;2
- Schoen R, White DE, Hemley J. 1974. Argillization by descending acid at the Steamboat Springs, Nevada. Clay and Clay Minerals. 22:1–22. doi: 10.1346/CCMN.1974.0220104
- Simmons SF, Arehart G, Simpson MP, Mauk JL. 2000. Origin of massive calcite veins in the Golden Cross, low-sulfidation epithermal Au-Ag deposit, New Zealand. Economic Geology. 95:99–112. doi: 10.2113/gsecongeo.95.1.99
- Simmons SF, Browne PRL. 2000. Hydrothermal minerals and precious metals in the Broadlands–Ohaaki geothermal system: implications for understanding low-sulphidation epithermal environment. Economic Geology. 95:971–999. doi: 10.2113/gsecongeo.95.5.971
- Simmons SF, Christenson BW. 1994. Origins of calcite in a boiling geothermal system. American Journal of Science. 294:361–400. doi: 10.2475/ajs.294.3.361
- Simmons SF, White NC, John D. 2005. Geological characteristics of epithermal precious and base metal deposits. Littleton (CO): Society of Economic Geologists, Inc. p. 485–522.
- Simpson MP. 2015. Reflectance spectrometry (SWIR) of alteration minerals surrounding the Favona epithermal vein, Waihi vein system, Hauraki goldfield. In: Proceedings of the 48th Australasian Institute of Mining and Metallurgy New Zealand Branch Annual Conference; Aug 30 – Sept 2; Dunedin. p. 409–418.
- Simpson MP. 2016. Exploration and geology of the Waitekauri epithermal gold–silver deposits and prospects, Hauraki goldfield. In: Christie AB, editor. Mineral deposits of New Zealand – exploration and research. Calton: The Australasian Institute of Mining and Metallurgy Monograph. 31; p. 273–282.
- Simpson MP. 2018. Hyperspectral (SWIR) characterisation of alteration at the Wharekirauponga epithermal Au-Ag prospect, Hauraki Goldfield, New Zealand. In: Proceedings of the 51st Australasian Institute of Mining and Metallurgy New Zealand Branch Annual Conference; Sept 17–18; Tauranga. p. 287–293.
- Simpson MP, Christie AB. 2016. Exploration of New Zealand mineral deposits and geothermal systems using X-ray diffraction (XRD) and reflectance spectrometry (SWIR): a comparison of techniques, GNS Science report 2016/61. P. 45. Doi: 10.21420/G2NP4D.
- Simpson MP, Gazley MF, Stuart AGJ, Pearce MA, Birchall R, Chappell D, Christie AB. Stevens MR. 2019. Hydrothermal alteration at the Karangahake epithermal Au-Ag deposit, Hauraki goldfield, New Zealand: Economic Geology.
- Simpson MP, Mauk JL. 2007. The Favona epithermal gold-silver deposit, Waihi, New Zealand. Economic Geology. 102:817–839. doi: 10.2113/gsecongeo.102.5.817
- Simpson MP, Mauk JL. 2011. Hydrothermal alteration and veins at the epithermal Au-Ag deposits and prospects of the Waitekauri area, Hauraki goldfield, New Zealand. Economic Geology. 106:945–973. doi: 10.2113/econgeo.106.6.945
- Simpson MP, Mauk JL, Bowyer D, Worland RJ. 2006. Alteration mineral studies of an epithermal prospect and a geothermal field using the TerraSpec. In: Proceedings of the 39th Australasian Institute of Mining and Metallurgy New Zealand Branch Annual Conference; Aug 30 – Sept 1; Wellington. p. 247–256.
- Simpson MP, Mauk JL, Castendyk D. 2003. Geochemistry of wall rock alteration at the Waihi and Favona epithermal deposits, New Zealand. In: Proceedings of the 36th Australasian Institute of Mining and Metallurgy New Zealand Branch Annual Conference; Sept 3–5; Greymouth. p. 261–270.
- Simpson MP, Mauk JL, Kendrick RG. 2004. Telescoped porphyry-style and epithermal veins and alteration at the central Maratoto valley prospect, Hauraki goldfield, New Zealand. New Zealand Journal of Geology and Geophysics. 47:39–56. doi: 10.1080/00288306.2004.9515036
- Simpson MP, Mauk JL, Merchant RJ. 2011. Bonanza-grade epithermal veins from the Coromandel and Thames districts, Hauraki goldfield. In: Proceedings of the 44th Australasian Institute of Mining and Metallurgy New Zealand Branch Annual Conference; Aug 27–30; Queenstown. p. 413–424.
- Simpson MP, Rae AJ. 2018. Short-wave infrared (SWIR) reflectance spectrometric characterisation of clays from geothermal systems of the Taupō Volcanic Zone, New Zealand. Geothermics. 73:74–90. doi: 10.1016/j.geothermics.2018.01.006
- Simpson MP, Simmons SF, Mauk JL. 2001. Hydrothermal alteration and hydrologic evolution of the Golden Cross epithermal Au-Ag deposit, New Zealand. Economic Geology. 96:773–796.
- Simpson MP, Stevens MR, Mauk JL, Harris MC, Stuart AGJ. 2016. Exploration and geology of the Karangahake and Rahu epithermal Au-Ag deposits, Hauraki goldfield. In: Christie AB, editor. Mineral deposits of New Zealand – exploration and research. Calton: The Australasian Institute of Mining and Metallurgy Monograph. 31; p. 283–292.
- Skinner DNB. 1986. Neogene volcanism of the Hauraki volcanic region. In: Smith IEM, editor. Late Cenozoic volcanism in New Zealand. Wellington: Royal Society of New Zealand Bulletin. 23; p. 20–47.
- Smith N, Cassidy J, Locke CA, Mauk JL, Christie AB. 2006. The role of regional-scale faults in controlling a trapdoor caldera, Coromandel Peninsula, New Zealand. Journal of Volcanology and Geothermal Research. 149:312–328. doi: 10.1016/j.jvolgeores.2005.09.005
- Spörli KB, Begbie MJ, Irwin MR, Rowland JV. 2006. Structural processes and tectonic controls on the epithermal Au-Ag deposits of the Hauraki goldfield. In: Christie AB, Brathwaite RL, editors. Geology and exploration of New Zealand mineral deposits. Calton: The Australasian Institute of Mining and Metallurgy Monograph. 25; p. 85–94.
- Spörli KB, Cargill H. 2011. Structural evolution of a world-class epithermal orebody: The Martha Hill deposit, Waihi, New Zealand. Economic Geology. 106:975–998. doi: 10.2113/econgeo.106.6.975
- Stagpoole VM, Christie AB, Henrys SA, Woodward DJ. 2001. Aeromagnetic map of the Coromandel region: total force anomalies 1:100,000, version 1.0: lower Hutt, New Zealand, Institute of Geological and Nuclear Sciences Ltd. Geophysical Map. 14.
- Steiner A. 1968. Clay minerals in hydrothermally altered rocks at Wairakei, New Zealand. Clays and Clay Minerals. 16:193–213. doi: 10.1346/CCMN.1968.0160302
- Steiner A. 1977. The Wairakei geothermal area, North Island, New Zealand: New Zealand Geological Survey Bulletin 90, 136 p.
- Stevens MR, Boswell GB. 2006. Review of exploration and geology of the Karangahake Au-Ag deposit, Hauraki goldfield. In: Christie AB, Brathwaite RL, editors. Geology and exploration of New Zealand mineral deposits. Calton: The Australasian Institute of Mining and Metallurgy Monograph. 25; p. 123–130.
- Stuart AGJ, Simpson MP, Mauk JL, Stevens M. 2005. Geology and alteration mineralogy of the Karangahake adularia-sericite epithermal deposit, Hauraki goldfield, New Zealand. In: Proceedings of the 2005 New Zealand Minerals Conference; Nov 13-16; Auckland. Crown Minerals, Ministry of Economic Development and Australasian Institute of Mining and Metallurgy, New Zealand Branch. p. 407–415.
- Tillick DA, Peacor DR, Mauk JL. 2001. Genesis of dioctahedral phyllosilicates during hydrothermal alteration of volcanic rocks: I. The Golden Cross epithermal ore deposit. New Zealand. Clay and Clay Minerals. 49:126–140. doi: 10.1346/CCMN.2001.0490203
- Torckler LK, Hobbins J, Christie AB. 2016. Mining and exploration of the epithermal gold–silver deposits at Waihi, Hauraki goldfield. In: Christie AB, editor. Mineral deposits of New Zealand – exploration and research. Calton: The Australasian Institute of Mining and Metallurgy Monograph. 31; p. 303–312.
- Torckler LK, McKay D, Hobbins J. 2006. Geology and exploration of the Favona Au-Ag deposit, Waihi, Hauraki goldfield. In: Christie AB, Brathwaite RL, editors. Geology and exploration of New Zealand mineral deposits. Calton: The Australasian Institute of Mining and Metallurgy Monograph. 25; p. 179–184.
- Vidal CP, Guido DM, Jovic SM, Bodnar RJ, Moncada D, Melgarejo JC, Hames W. 2016. The Marianas-San Marcos vein system: characteristics of a shallow low sulfidation epithermal Au–Ag deposit in the Cerro Negro district, Deseado Massif, Patagonia, Argentina. Mineralium Deposita. 51:725–748. doi: 10.1007/s00126-015-0633-9
- Weissberg BG, Wodzicki A. 1970. Geochemistry of hydrothermal alteration and origin of sulphide mineralization at the Tui mine, Te Aroha, New Zealand. New Zealand Journal of Science. 13:36–60.
- White DE. 1955. Thermal springs and epithermal ore deposits. New Haven (CT): The Economic Geology Publishing co. p. 99–154.
- White DE. 1957. Thermal waters of volcanic origin. Geological Society of America Bulletin. 68:1637–1657. doi: 10.1130/0016-7606(1957)68[1637:TWOVO]2.0.CO;2
- White DE. 1981. Active geothermal systems and hydrothermal ore deposits. New Haven (CT): The Economic Geology Publishing co. p. 392–423.
- White NC, Leake MJ, McCaughey SN, Parris BW. 1995. Epithermal deposits of the southwest Pacific. Journal of Geochemical Exploration. 54:87–136. doi: 10.1016/0375-6742(95)00027-6
- Yang K, Browne PRL, Huntington JF, Walshe JL. 2001. Characterising the hydrothermal alteration of the Broadlands–Ohaaki geothermal system, New Zealand, using short-wave infrared spectroscopy. Journal Volcanology and Geothermal Research. 106:53–65. doi: 10.1016/S0377-0273(00)00264-X