
ABSTRACT
More than 80 Cenozoic low sulphidation Au–Ag epithermal deposits and prospects are known in Northland, the Hauraki Goldfield (Coromandel Volcanic Zone) and the Taupō Volcanic Zone of the North Island. Reconnaissance exploration since the 1970s has included magnetic surveys, and stream sediment and rock-chip geochemical surveys. Prospect-scale exploration over the same period has included rock and soil geochemical surveys, magnetic and resistivity/induced polarisation geophysical surveys and drilling, including the study of hydrothermal alteration mineralogy (by thin section and XRD) plus fluid inclusion systematics, to help reconstruct the former hydrothermal system and identify zoning related to mineralisation. Since the 1990s, digital regional exploration and research data sets have enabled GIS-based targeting of prospective areas. At the prospect scale, multi-element ICP and ICP-MS analyses, hyperspectral short wave infrared spectral analyses and portable XRF geochemical analyses of field samples and drill core have been used to complement assay data for identifying spatial trends in geochemistry and mineralogy that help vector to mineral occurrences. Exploration since the 1970s has discovered new Au and Ag resources in extensions of some previously mined deposits (e.g. Golden Cross and Karangahake) and in new deposits in adjacent areas (e.g. Favona, Trio and Correnso in the Waihi area).
Introduction
New Zealand has a history of significant Au and Ag production from epithermal deposits since the 1860s, and epithermal deposits continue to be one of the main mineral deposit types sought by the exploration industry on the North Island. The deposits are associated with Cenozoic volcanic rocks in Northland (), the Coromandel Volcanic Zone (CVZ; ) and the Taupō Volcanic Zone (TVZ; ). The distribution of Au–Ag deposits in the CVZ defines the Hauraki Goldfield that encompasses Great Barrier Island and the Coromandel Peninsula, extending south to Te Puke (). Exploration for Au–Ag deposits and prospects has been aided by insights gained from nearby active geothermal systems of Northland (Ngawha; ) and the TVZ (e.g. Waiotapu, Waimangu, Ohaaki and Rotokawa; ) (Henley and Ellis Citation1983; Henley et al. Citation1986), and of volcanic hydrothermal systems related to andesitic volcanoes (e.g. White Island; Hedenquist et al. Citation1993). As these active hydrothermal systems are readily accessible modern-day analogs to past hydrothermal systems, explorers can directly observe processes that occurred in formation of epithermal deposits, the surface features that would have been present during epithermal deposit formation and appreciate the potential size of the hydrothermal systems.
Figure 1. Geology and location of epithermal Au–Ag prospects in Northland. See for a list of the main occurrences.
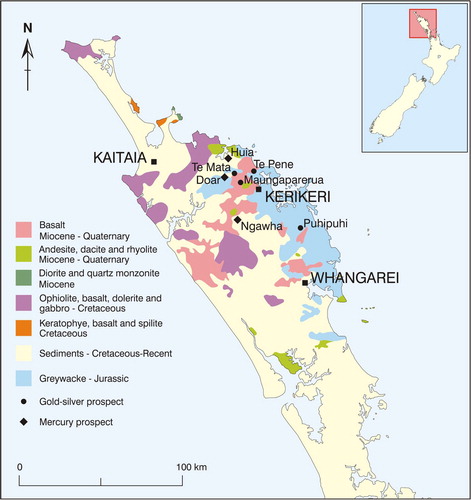
Figure 2. Geology and location of epithermal Au–Ag deposits and prospects in the Coromandel Volcanic Zone – Hauraki Goldfield. See and for a list of the main occurrences.
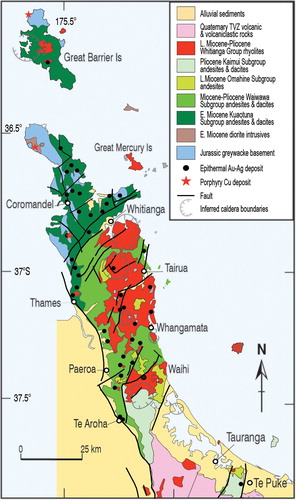
Figure 3. Geology and location of epithermal Au–Ag prospects and geothermal fields in the Taupō Volcanic Zone. See for a list of the main epithermal Au–Ag occurrences.
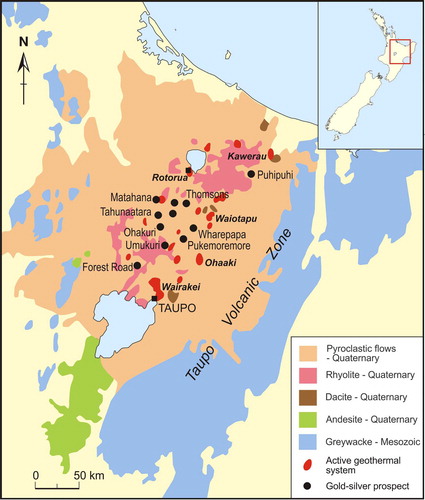
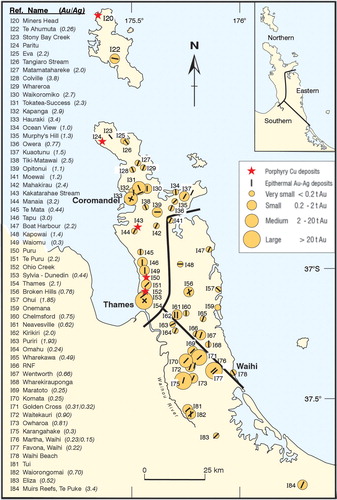
Figure 4. Relative size of past Au and Ag producers, Au:Ag ratios and dominant vein orientation of epithermal Au–Ag deposits of the Hauraki Goldfield (modified after Fig. 27 of Brathwaite and Pirajno Citation1993; Fig. 2 of Chrisite et al. Citation2006). The direction of the bar symbol shows the dominant strike of veins. Deposit reference codes are from Brathwaite and Pirajno (Citation1993). Inset map shows broad geographic groupings of deposits into northern, southern and eastern provinces based on mineralisation style described by Chrisite et al. (Citation2006, Citation2007).
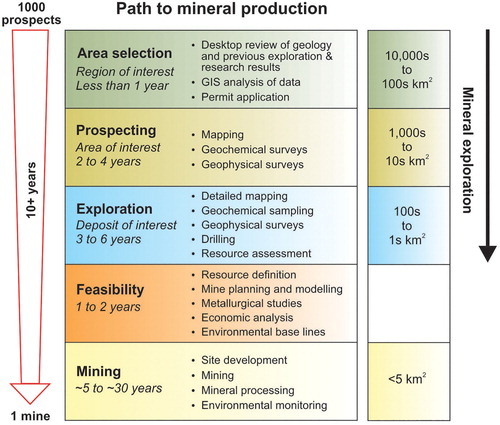
Most mineral exploration begins with developing a target concept and undertaking an area selection process based on an assessment of mineral potential (), as well as factors potentially relevant to development if discovery is successful. Exploration progresses in stages, with each stage ending in a decision point on whether to continue to more intensive investigations or abandon part or all of the area, progressively focussing on the most prospective ground. In areas where there has been significant previous exploration, specific target areas may already be apparent (e.g. known epithermal deposits), and the programme may commence with detailed exploration. This has been the case for most epithermal Au–Ag exploration in New Zealand since 2010. However, development of new concepts or techniques may justify reassessing regional selection and earlier unsuccessful targets.
Figure 5. Path to mineral production. Prospecting is reconnaissance exploration and Exploration is detailed exploration in the text.
In New Zealand, Au and Ag are Crown-owned minerals and therefore gold exploration requires a permit from the New Zealand Government, regardless of land ownership. There are three main types of onshore minerals permits that are granted by New Zealand Petroleum & Minerals (NZP&M – www.nzpam.govt.nz): prospecting, exploration and mining, and these differ in land area, duration and the type of permitted activities (). The permit heirachy and structure prescribe the framework for exploration programmes.
Table 1. Mineral permits (onshore) under the Crown Minerals Act 1991 and Minerals Programme for Minerals 2013.
This paper reviews exploration for epithermal Au and Ag deposits in New Zealand in terms of the programme structure and exploration techniques employed, and discusses some research that has assisted exploration. The paper concludes with a strategy for exploration for epithermal Au–Ag deposits in New Zealand, as well as a list of recommended future research topics.
Geological setting
Northland, CVZ and TVZ each contain a subduction-related Cenozoic volcanic arc with volcanic rocks overlying a basement of Mesozoic greywacke. Northland also includes a complex Cretaceous and Tertiary succession of autochthonous sedimentary rocks and allochthonous marine sedimentary and basaltic volcanic rocks (Ballance and Spörli Citation1979; Edbrooke and Brook Citation2009). In the CVZ, mid-Tertiary marine sedimentary rocks are locally present in the northern Coromandel Peninsula.
Cenozoic volcanism in Northland formed two semi-parallel NW-oriented volcanic belts of Miocene age: a western belt of basaltic volcanism and an eastern belt of andesitic and rhyolitic volcanism; later (Late Miocene-Quatenary) volcanism consisted of intraplate basalt and minor rhyolite eruptions. The epithermal Au–Ag deposits and present-day geothermal systems (e.g. Ngawha) are associated with the eastern belt and have produced small quantities of Ag and Hg (Williams Citation1974). In addition, three porphyry Cu occurrences and one Pb-Zn skarn deposit (Brathwaite and Pirajno Citation1993) are exposed on the eastern flank of the eastern belt, where erosion is deepest.
The CVZ volcanic rocks consist mainly of ca. 18 to 10 Ma andesite and dacite in the northern CVZ, and ca. 12 to 2 Ma rhyolite, andesite, dacite and minor basalt in the eastern and southern areas (Skinner Citation1986; Edbrooke Citation2001). Andesitic volcanism was mainly related to stratovolcanoes, whereas rhyolitic volcanism was mainly associated with caldera formation and dome extrusion.
The CVZ hosts c. 50 epithermal Au–Ag deposits that have collectively produced c. 12 Moz of Au and 50 Moz of Ag since the 1860s (; Brathwaite et al. Citation1989; Christie et al. Citation2007). The current annual production of c. 125,000 oz Au and 350,000 oz Ag is almost entirely from mines at Waihi (I76 and I77 area in ), with additional production from workings at Karangahake and Broken Hills (I75 and I56, respectively, in ). The porphyry Cu occurrences in the CVZ (I20, I24, I43, I50 and I52 in ) are best exemplified by that at Ohio Creek near Thames (Merchant Citation1986; Brathwaite et al. Citation2001b). Radiometric dating of the epithermal and porphyry Cu deposits indicate that they range in age from ca. 14 to 2 Ma and 16 to 10 Ma, respectively. However, most of the epithermal deposits in the southern CVZ, which account for more than 80% of the total Au and Ag production, were formed between ca. 7 and 6 Ma, during a period of strong regional extension (Mauk et al. Citation2011).
The TVZ is a NE-trending extensional volcanic-tectonic basin with a basement of Mesozoic greywacke and filled with Pleistocene (ca. 2 Ma) to recent volcanic and volcaniclastic rocks (Wilson et al. Citation1995; Wilson and Rowland Citation2016). It is flanked to the west and east by ignimbrite plateaus originating from volcanoes in the TVZ. The TVZ predominantly consists of rhyolite calderas and domes, and ignimbrite, with lesser andesite and dacite. Andesite forms a complex of stratovolcanoes at the southern end of the TVZ (Tongariro, Ngaruhoe and Ruapehu) and a largely submerged stratovolcano offshore at the northern end (White Island). Basalt is a minor constituent. The TVZ has c. 20 known geothermal systems (Rowland and Simmons Citation2012), some of which have been developed to produce electricity, and c. 20 epithermal Au–Ag prospects, but there has been no Au or Ag production.
Target type
The known epithermal Au–Ag deposits in New Zealand are all volcanic associated, with features characteristic of low (locally to intermediate) sulphidation types, in which the Au and Ag are mainly contained in quartz veins, with little disseminated Au and Ag in the wallrocks except for that in some rhyolite-hosted deposits such as Wharekirauponga (Christie et al. Citation2003, Citation2016). There is potential for high sulphidation epithermal Au–Ag deposits associated with porphyry Cu mineralisation at Ohio Creek near Thames, but this remains untested (Corbett Geological Services Citation1991; Brathwaite et al. Citation2001b; Christie et al. Citation2008). In addition to deposit characteristics described in epithermal deposit models (e.g. Brathwaite and Christie Citation2000; Christie and Brathwaite Citation2003a; Christie Citation2019), other criteria for target selection include: (1) whether the exploration will be brownfields, i.e. near past or present mining locations, or greenfields, in areas with no known deposits, or both; (2) the minimum total gold content sought; and (3) the minimum average gold grade. The latter affects the potential mining method, typically open pit bulk mining for low-grade ore, or the option of underground mining for high grade ore, particularly in the case of ore deposits below about 100 m depth. shows the evolution of target type in the CVZ from the 1960s to present day. Current community opinion on the North Island is unlikely to accept the development of any new open pit mining of Au and Ag, resulting in a change in the most common target type, from the 1980s exploration for stockwork or sheeted veins that are amenable to open pit bulk mining, to exploration during the past two decades for high-grade Au-bearing quartz veins that can be developed by underground mining.
Table 2. Evolving targets, model concepts and exploration techniques.
Area selection
Regional mineral endowment
A fundamental consideration in selecting a region for exploration is whether the proposed area has potential to contain resources of sufficient size for the commodity or commodities sought. For greenfields exploration, this is the presence of a favourable tectonic and geological history for forming gold deposits. For brownfields exploration, it includes evidence from previous exploration, mining and related research that there is still potential in the area for a significant undiscovered economic resource (termed residual endowment).
The CVZ has a long history of mining of epithermal Au–Ag deposits (Brathwaite et al. Citation1989; Christie et al. Citation2007), and current Au and Ag production is from mines at Waihi, Karangahake and Broken Hills. Epithermal deposits in the CVZ have also been mined for Hg at Mangakirikiri and Mackaytown (Ascot mine), and for Zn, Pb and Cu at Tui (Christie et al. Citation2008).
The main epithermal Au–Ag prospects in the CVZ (), where several discoveries have recently been made, include extensions of known deposits (e.g. Empire vein, Golden Cross) as well as discoveries near known veins (e.g. Favona, Trio and Correnso veins in Waihi; EG vein at Wharekirauponga), testifying to the exploration potential of the CVZ (Barker and Christie Citation2016a). In addition, there are large areas with post-mineral volcanic rock cover that have potential for concealed deposits beneath the cover (Christie and Brathwaite Citation2005). Brathwaite (Citation1981) graphed the past production of known deposits in the CVZ prior to the recent discoveries, and using Zipf’s law, suggested that there was potential to discover deposits of significant size, including four deposits with sizes intermediate between the historic (pre-1953) production of Waihi and Thames.
Table 3. Main epithermal Au–Ag exploration prospects in the Coromandel Volcanic Zone (Hauraki Goldfield) from 1978 (modified from of Barker and Christie Citation2016a).
Although Northland and the TVZ do not have a history of Au and Ag production, each province has significant exploration targets ( and ; Barker and Christie Citation2016b, Citation2016c), with exploration at Puhipuhi in Northland and Ohakuri in the TVZ indicating significant Au and Ag resources in these deposits (Grieve Citation2000; Hamilton and Soengkono Citation2009; Beach and Hobbins Citation2016; Hobbins et al. Citation2018). Regional mineral resource assessments by Christie et al. (Citation2008) for the CVZ and by Christie and Barker (Citation2007) for Northland found that there was potential for significant undiscovered Au and Ag resources in epithermal deposits in these areas.
Table 4. Main epithermal Au–Ag exploration prospects in Northland from 1970 (modified from of Barker and Christie Citation2016c).
Table 5. Main epithermal Au–Ag exploration prospects in the Taupō Volcanic Zone from 1978 (modified from of Barker and Christie Citation2016b).
Data discovery
Area selection commonly involves a desktop review of the geology and previous exploration, and relevant research results of the area(s) being considered. In New Zealand, prospecting and exploration permit holders must report their exploration results to the government (NZP&M). Since the 1970s, this has generated more than 2000 such reports related to epithermal Au–Ag exploration. The supplied information is held confidential until the permit expires or five years from the time of submission of the information, whichever is sooner. The subsequent open-file reports and data are publicly available for download free of charge from the Exploration Database section of the NZP&M website (www.nzpam.govt.nz). Data generated from regional airborne magnetic and radiometric surveys carried out by Glass Earth in the TVZ in 2004 and in Northland by the government in 2011 (Doyle Citation2007; Stagpoole et al. Citation2012, Citation2015, Citation2016; Rattenbury et al. Citation2016) were also compiled and are available. Other major information sources include: geological maps at various scales, produced by GNS Science and its predecessor organisations (e.g. New Zealand Geological Survey), published research papers, reports and university theses, as well as satellite remote sensing data, Lidar data and digital elevation models.
GIS analysis of data and target ranking
Relevant geological, geophysical, geochemical and topographic data are compiled and typically assessed by the explorer with GIS software, and prospectivity assessment may be conducted using weights of evidence and fuzzy logic techniques to aid in area selection (e.g. Rattenbury and Partington Citation2003; Feltrin et al. Citation2016; Peters et al. Citation2016; Hill et al. Citation2019). A mineral systems approach, assessing metal and fluid source, metal transport and fluid pathways, physical and chemical depositional traps, and preservation factors, has been recommended for this type of assessment because it is conceptual or process based (e.g. Hronsky and Groves Citation2008; McCuaig et al. Citation2010; Joly et al. Citation2012; McCuaig and Sherlock Citation2017).
At a more detailed stage, NZP&M’s National Core Store may also provide information for desktop prospecting with drill core photographs, geological and geotechnical logs and assay data available online from the NZP&M exploration database.
Government data compilation and prospectivity studies
Data from the open-file exploration reports have been compiled into digital databases of geochemical and airborne geophysical surveys (e.g. Crown Minerals Citation2009). The exploration data have been incorporated in an epithermal gold package, including a prospectivity weight of evidence study, by Crown Minerals (Citation2003). This analysis was recently updated by Hill et al. (Citation2019). Many of the airborne magnetic surveys with publicly available data (Christie et al. Citation2012), including government-funded surveys of the Northland region, also have radiometric data that enables geology and hydrothermal alteration (i.e. K-bearing minerals) to be mapped (e.g. Morrell et al. Citation2011). National reconnaissance ground-based gravity surveys, with an average spacing of 5 km, have been augmented by more localised and detailed surveys by university researchers in the southern CVZ (e.g. Smith et al. Citation2003, Citation2006; Morrell et al. Citation2011) and by a TVZ airborne gravity survey by Glass Earth (Doyle Citation2007).
Exploration company data compilation and analysis
Some exploration companies have conducted major data compilations and studies. For example, Glass Earth Ltd (later Glass Earth Gold Ltd) carried out an extensive study in the TVZ and southern CVZ in 2004. They compiled previous exploration and research data in a 3D database for interpretation of the geology and structure, and to determine data gaps requiring follow-up exploration (Henderson et al. Citation2005, Citation2016). Kenex, generally on behalf of their clients, also carried out numerous data compilation projects and prospectivity studies (Payne et al. Citation2014; Payne and Peters Citation2015; Peters et al. Citation2016).
Target ranking
Targets defined in an area selection process can be ranked based on geological, geochemical, geophysical, prospectivity (e.g. from weights of evidence prospectivity analysis) and other criteria, such as ease of access and an assessment of local societal issues. The geological aspects can be assessed with an empirical system that ranks subjectively-based features associated with known mineral deposits (e.g. geological setting, geochemical anomalies and hydrothermal alteration). This allows features that are considered relevant by the geologist in relation to the mineral deposit model to be targeted. These empirical criteria are combined to achieve a relative ranking of targets (McCuaig and Sherlock Citation2017). Joly et al. (Citation2012) noted that in a mineral systems approach, ranking may be based more objectively on the probability of occurrence of each critical mineralisation process, depending on the available information.
Reconnaissance regional-scale exploration
Prospecting for epithermal quartz veins in the late nineteenth and early to mid-twentieth centuries was by basic sediment panning and examination of float and outcrops. Since the 1970s, reconnaissance exploration of large areas has typically involved regional airborne geophysical surveys and/or reconnaissance geochemical surveys as a first step prior to ground-based surveys. Aeromagnetic surveys are generally the most cost-effective airborne surveys for epithermal deposit exploration in volcanic terrains and radiometric measurements are commonly collected at the same time (Kellet and Bromley Citation2018). Airborne electromagnetic and gravity surveys are also useful but generally involve a much higher cost. Satellite imagery, aerial photography and Lidar surveys can assist mapping of structure, and a few epithermal deposits have a topographic expression due to either a quartz vein(s) and/or siliceous hydrothermal alteration that are resistant to erosion (e.g. the Martha vein system at Waihi, Big Buck Reef at Wairongomai, and Muirs Reef). Regional-scale geochemical surveys typically use stream sediment geochemistry with conventional minus-80 mesh or bulk leach extractable gold (BLEG) sediment sampling techniques, the latter characterised by a lower density of sampling. Panned concentrate geochemical surveys are also sometimes used.
Even where exploration uses remote techniques, field prospecting and mapping of outcrops are still important fundamental techniques to characterise the geological and structural setting, as well as style and footprint of hydrothermal alteration and mineralisation. Mapping the geological units can provide an indication of primary permeability and rheological properties of the rocks, which, in turn, may influence the potential to host veins. Important features noted during mapping include veins, hydrothermal breccias, silicified horizons and silica sinters (cf. Simmons Citation2017, Citation2019; Hamilton et al. Citation2018). Furthermore, documentation of vein textures may provide information on paleodepth (colloform-banded versus massive crystalline quartz) and boiling (e.g. bladed quartz or calcite; Simmons and Christenson Citation1994; Simmons Citation2019) that is a process conducive for the deposition of gold; breccia textures may indicate multiple hydrothermal events. The use of portable XRF (pXRF) and portable infrared spectrometers in the analysis of samples in the field, as well as for drill hole samples, has greatly assisted mapping of hydrothermal alteration by characterising the geochemical anomalies and mineralogy, respectively (e.g. Halley Citation2014; Halley et al. Citation2015). Portable XRD instruments are now also available and can be useful for determining and quantifying alteration mineralogy (e.g. Burkett et al. Citation2015).
Reconnaissance exploration in Northland
In Northland (), reconnaissance exploration programmes during the 1970s to 1990s included rock chip, stream sediment and panned concentrate surveys (Brown Citation1989; Barker and Christie Citation2016c). In addition to the previously known Puhipuhi prospect, several new prospects were identified from geochemical anomalies and mapping of hydrothermal alteration and epithermal mineralisation features, particularly hydrothermal eruption breccias. The main discoveries include Hazelbrook (Huia, Toolshed, Backyard), Te Pene, Te Mata, Puketotara and Waikare, as well as the previously known Puhipuhi deposit (Christie and Barker Citation2007). In 2011, the government funded an airborne magnetic and radiometric survey of the entire Northland region, which was subsequently interpreted by Stagpoole et al. (Citation2012, Citation2016).
Reconnaissance exploration in the Hauraki Goldfield (CVZ)
A phase of intensive mineral prospecting began in the CVZ in 1976 with reconnaissance surveys by Amoco Minerals that extended into the 1980s (Hay Citation1989; Rabone Citation1991). Many other companies carried out reconnaissance prospecting programmes in the 1980s and 1990s (Barker and Christie Citation2016a). Stream sediment geochemical surveys were the major reconnaissance prospecting technique used on a routine basis, together with selected rock and soil geochemical surveys. Most stream sediment programmes used conventional sampling techniques and analysed the minus-80 mesh sediment fraction; however, in the 1980s, many companies began using panned concentrate and BLEG techniques. Following the Amoco Minerals aeromagnetic surveys in the 1970s, several companies carried out detailed airborne magnetic and radiometric surveys beginning in the 1980s. The results of many of these airborne surveys were compiled by Stagpoole et al. (Citation2001). The total magnetic intensity maps identified low-amplitude magnetic zones that correlate with areas where magnetite has been converted to pyrite during hydrothermal alteration, destroying magnetisation (Allis Citation1990; Irvine and Smith Citation1990; Locke et al. Citation2006; Kellett and Bromley Citation2018). Newmont Waihi Gold conducted helicopter-borne electromagnetic surveys of many of their prospects to identify resistive alteration and vein zones (Kellet and Bromley Citation2018).
Reconnaissance exploration in the Taupō Volcanic Zone (TVZ)
The TVZ () was prospected from the 1970s to the early 1980s by a number of companies (Barker and Christie Citation2016b). This work identified more than 10 epithermal Au and Ag prospects based on the presence of epithermal features such as sinters, hydrothermal eruption breccias, silicified hydrothermal breccias, quartz veins, quartz-and adularia-altered rocks, and/or geochemical and geophysical anomalies. The work included geological mapping, geochemical surveys, ground magnetic surveys and aeromagnetic surveys by BP and ACM. Early reconnaissance geochemical surveys found that the widespread presence of volcanic ash and other cover rocks, particularly Taupō Pumice, limited the usefulness of conventional stream sediment samples, and therefore most subsequent drainage surveys used panning with visual identification of gold grains, panned concentrate sampling with chemical analysis of the concentrate, or BLEG geochemistry. Furthermore, because of limited erosion and exposure of the epithermal systems, there has been considerable emphasis on geophysical prospecting in the TVZ, including use of Department of Scientific and Industrial Research resistivity survey data originally collected for exploration of geothermal resources (Allis Citation1990).
In 2005, Glass Earth Ltd commissioned regional-scale airborne geophysical surveys of the TVZ. These were a combined aeromagnetic and radiometric survey over a large part of the TVZ and a smaller airborne gravity survey (airborne full tensor gravity gradiometry) within this area. A large database of geological, geochemical and geophysical information, together with the interpretation of the airborne geophysical survey data, identified 22 targets for follow-up exploration (Henderson et al. Citation2016). Many of these targets have coincident areas of low magnetic and high residual Bouguer gravity anomalies. Wavelength edge detection analyses of the magnetic and gravity data were interpreted to indicate deep crustal structures that were suggested to control the location of some geological features and mineral prospects (Smith et al. Citation2007). Later, publicly available data were used by Kenex to complete a 2D prospectivity model for epithermal Au–Ag prospects in the TVZ and a 3D model of the Ohakuri epithermal Au–Ag prospect (Payne et al. Citation2014; Peters et al. Citation2016).
Research information relevant to area selection and regional-scale exploration
Geothermal analogues of epithermal Au–Ag deposits
Study of geothermal systems in the TVZ provides information to model the footprint, and geological and structural setting of active systems that can help to target epithermal Au–Ag deposits (). Resistivity surveys that determine the extent of hot fluid and clay alteration in TVZ geothermal systems have shown that their footprint varies in size from 7 to 62 km2, with most between 18 and 26 km2 (Bibby et al. Citation1995). Simpson and Mauk (Citation2004) showed that this geothermal size, or footprint, was similar to the footprint of hydrothermal alteration in the Au–Ag deposits of the CVZ.
Table 6. Advances in the understanding of epithermal ore deposits from TVZ geothermal systems.
More than 20 geothermal systems are currently active in the TVZ, spaced at 10–15 km intervals. By analogy, multiple epithermal Au–Ag systems were likely active contemporaneously in both Northland and the CVZ during the Miocene-Pliocene.
The CO2/H2S ratios and metal contents of the deep geothermal fluids vary between different geothermal systems, even between adjacent systems such as those at Wairakei and Rotokawa (Henley Citation1985; Henley and Brown Citation1985; Henley et al. Citation1986; Simmons et al. Citation2016b). This variability may reflect heterogeneity in magmatic source and flux, and/or the composition of the basement and reservoir rocks that the fluid interacted with (cf. Ellis and Mahon Citation1964, Citation1967; Hedenquist Citation1986). Simmons et al. (Citation2016b) argued that input of magmatic fluid is required to develop the highest concentrations of Au and Ag, as well as Te, in TVZ geothermal fluids, which are a function of the concentration of H2S in the fluid. By analogy, this argument would extend to the source and metal diversity for epithermal ore deposits.
Volcanotectonic setting
The Miocene-Pliocene volcanic rocks of Northland, CVZ and TVZ were formed in a series of volcanic arcs related to subduction along the boundary between the Pacific and Indian-Australian plates. The succession of arcs records a change in orientation of the subduction zone from NNW-SSE at ca. 25 to 15 Ma during the formation of the Northland Arc, to the present ENE-WSW trending TVZ-Kermadec Arc related to subduction along the similarly oriented Hikurangi Trench. There is controversy about the nature and mechanisms of this change in orientation (e.g. Mortimer Citation2012), but nonetheless the change resulted in a series of events that are recorded by periods of volcanism as well as associated hydrothermal activity (e.g. Mauk et al. Citation2011). The changing orientation strongly influenced the structural development of the volcanic arcs (e.g. Rowland et al. Citation2016; Bahiru et al. Citation2019). The formation of the Hauraki Rift was also a major influence on the structural development of the CVZ and may be partly responsible for the southeastern tilt of the CVZ stratigraphy (Irwin Citation2004; Spörli et al. Citation2006; Rowland et al. Citation2016). Elucidation of this volcanotectonic development has potential to provide an improved understanding of the prospectivity of specific rock groups and ages. Chrisite et al. (Citation2006, Citation2007) recognised three sub-regions in the CVZ based on mineralisation style and host-rock association (), likely related to the volcanotectonic history.
Regional geological mapping
Since the geological setting of the epithermal deposits is crucial to their location, geological maps provide basic information to explorers. Large-scale geological maps of relatively small areas were published by GNS Science and its predecessor organisations (e.g. New Zealand Geological Survey) between 1975 and 1996 at 1:63,360 and 1:50,000 over parts of the provinces prospective for epithermal Au and Ag deposits (e.g. Skinner Citation1993, Citation1995; Brathwaite and Christie Citation1996). In addition, self-published maps cover parts of the CVZ and Northland at 1:100,000 (Rabone Citation1992, Thames to Te Aroha) and at 1:50,000 (Evans Citation1993a, Citation1993b, Citation1993c; Ahipara and Kaitaia, Herkino and Rawene, Waipoua and Aranga, respectively). Since 2001, GNS Science has produced GIS-based compilations at 1:250,000 (QMap) and achieved national coverage. The relevant QMap sheets for epithermal exploration are Auckland (Edbrooke Citation2001), Whangarei (Edbrooke and Brook Citation2009) and Rotorua (Leonard et al. Citation2010), and seamless QMap digital data are now available.
Regional structural mapping
Remote sensing and aeromagnetic and gravity survey results help to identify major structural features such as fault zones, structural corridors, and calderas in Northland (e.g. Stagpoole et al. Citation2012), CVZ (e.g. Skinner Citation1983, Citation1986, Citation1993, Citation1995; Briggs and Fulton Citation1990; Bromley and Brathwaite Citation1991; Rabone Citation1991; Brathwaite and Christie Citation1996; Malengreau et al. Citation2000; Smith et al. Citation2006; Christie et al. Citation2007; Bahiru et al. Citation2019) and TVZ (e.g. Leonard et al. Citation2010; Stagpoole et al. Citation2015). Several of the CVZ Au–Ag deposits are associated with structurally controlled basins or grabens, including the Waihi vein system (Torckler et al. Citation2006) and Wharekirauponga (Christie et al. Citation2016).
Skinner (Citation1986), Rowland and Simmons (Citation2012), Rowland et al. (Citation2017) and Bahiru et al. (Citation2019) suggested that many of the structures in the CVZ and TVZ Cenozoic volcanic rocks are inherited from N- to NW-striking structures in the greywacke basement and some act as potential transfer zones between discrete fault segments in the younger cover sequence. Their analysis suggests that such regional-scale inherited structural fabrics are important conduits for fluid flow and appear to have controlled the distribution of hydrothermal mineralisation and alteration. Moreover, in the TVZ, Rowland and Simmons (Citation2012) suggest NW-striking transfer zones coincide with the alignment of some geothermal systems, rhombic caldera structures and young (<61 ka) silicic vents.
Regional geochemical and hydrothermal alteration mapping
Compilation of the stream sediment geochemical data indicates elevated concentrations of Cu, Pb and Zn in the western part of the CVZ that reflect more deeply formed base–metal epithermal and porphyry mineralisation exposed as a result of the regional eastward tilting of the stratigraphy and a deeper level of erosion on the western side of the CVZ than on the easern side (see Fig. 4 of Christie and Stewart Citation2016).
Christie and Brathwaite (Citation1986) and Christie et al. (Citation2001) mapped hydrothermal alteration on the Coromandel Peninsula on a regional scale (see Fig. 1B of Simpson and Christie Citation2019 – this issue). They used information from 1:50,000 geological map sheets (Skinner Citation1993, Citation1995; Brathwaite and Christie Citation1996), open-file mineral exploration reports and university theses on individual prospects, and indications of subdued magnetic variation on aeromagnetic maps (e.g. Rabone Citation1991). The field mapping was based on visual appearance of the rocks, in many cases supported by petrological and XRD analyses.
Recent processing of high-resolution aeromagnetic and airborne radiometric data acquired by exploration companies complements the above interpretations. Total magnetic intensity maps delineate magnetic quiet zones that correlate with areas where magnetite has been destroyed by strong hydrothermal alteration (Allis Citation1990; Irvine and Smith Citation1990; Locke et al. Citation2006; Kellett and Bromley Citation2018). Potassium band data from radiometric surveys can potentially be useful for delineating rocks with significant adularia and/or illite (Morrell Citation2004; Harris et al. Citation2005; Morrell et al. Citation2011). Adularia and illite are common K-bearing alteration minerals in the core of deposits in the southern CVZ (e.g. Simpson et al. Citation2001, Citation2019; Brathwaite and Faure Citation2002; Simpson and Mauk Citation2007, Citation2011; Christie et al. Citation2007; Simpson and Christie Citation2019). Therefore, combined geophysical methods can reveal the extent of hydrothermal alteration, and the K-altered zone that can surround orebodies, provided the host rocks originally contained magnetite and there is limited post-mineralisation cover.
Detailed prospect-scale exploration
In the late nineteenth and early to mid-twentieth centuries, veins were tested by trenching and underground workings excavated with hand tools and explosives. Drilling was rarely used except at the larger prospects and mines. From the 1960s, various geochemical and geophysical techniques were developed for detailed exploration to help identify drilling targets.
Modern follow-up exploration of prospects identified in regional exploration is commonly carried out by grid-based soil geochemical surveys, as well as by geophysical surveys such as magnetic, resistivity/induced polarisation (IP) and controlled source audio-frequency magnetotelluric (CSAMT) surveys (Kellet and Bromley Citation2018). In rugged terrain where sampling grids are difficult, soil geochemical surveys commonly use ridge and spur sampling.
Once the sources of anomalies have been located, drilling is used to test the targets at depth. Drill testing of prospects typically involves diamond drilling (DDH) that collects continuous core samples. This method is expensive, but it provides the most information as it produces samples of rock that are relatively undisturbed and for additional cost may be surveyed to enable orientation and measurement of dip and azimuth of structures. Lower cost drilling methods, such as reverse circulation (RC) and rotary air blast (RAB), produce crushed rock samples and are typically used as a reconnaissance approach or to determine the continuity of mineral content between the DDH. Drill cores are examined and described in detail, and samples are taken and analysed. All the data are recorded in a digital database and rendered and modelled in 3D.
Geochemistry
There have been significant advances in geochemical analysis of exploration samples over the past 40 years from AAS to INAA to ICP-AES to ICP-MS, with lowering of detection limits and availability of a larger number of elements for similar cost (e.g. Halley Citation2014). In the 1960s and 1970s, typically only a few elements were analysed (e.g. Ag, As, Cu, Pb, and Zn). Gold and Ag had high lower limits of detection relative to analyses today and therefore, if analysed for Au and Ag, a high percentage of samples returned assays below the lower limits of detection. Commercial laboratories now offer packages of 30 or more elements for their ICP-MS analyses. However, fire assay is still a popular method of Au analysis and some drill programmes will assay only for Au and Ag, and maybe a few selected other elements. Halley (Citation2014) recommended routinely using a 4-acid digestion and ICP-MS/AES analyses of a large suite of elements in exploration samples to provide data for interpreting geology and hydrothermal alteration, as well as metal assays.
Whole-rock geochemistry and mineral chemistry (e.g. chlorite, adularia and pyrite) in samples (typically drill core) may be used to identify the zonation of hydrothermal alteration. This will enable vectoring toward higher grade alteration and, hopefully, Au and Ag mineralisation (Gemmell Citation2006). Alteration indices such as the Alteration Index (AI; Ishikawa et al. Citation1976) and chlorite-carbonate-pyrite index (CCPI; Large et al. Citation2001) using ratios of major element geochemistry (e.g. K2O, Na2O, MgO, S and LOI) typically increase toward mineralisation. A study by Booden et al. (Citation2011) at Waitekaui in the CVZ suggested that ratios of K/Sr, Rb/Sr, molar K/(K + Na + 2Ca), and K/Al can be used to vector toward adularia-rich rocks (cf. Barker et al. Citation2019). Chlorite chemistry changes from Fe-chlorite to Mg-Fe chlorite to Mg chlorite with increasing hydrothermal alteration and proximity to ore in some deposits (note that this property may also be determined by SWIR analyses). Adularia shows an increase in Ba, Pb and, to a lesser extent, Cs, and pyrite shows an increase in Pb, Bi and Mo, towards mineralisation (Gemmell Citation2006).
Hydrothermal alteration mineralogy
Description of the hydrothermal alteration mineralogy in surface and drill hole samples provides information on hydrothermal fluid composition, fluid temperature and any potential overprinting of hydrothermal events (Simpson and Christie Citation2019). This is particularly important for identifying spatial relationships and interpreting 3D alteration trends, and possible vectoring to mineralisation. In exploration, routine thin section petrography and XRD analyses are gradually being replaced by hyperspectral SWIR analyses for low cost real-time information. Geochemical mineral proxies identified in multielement analyses and pXRF analyses are also used (see above). Portable XRD analysis may become more useful in the future with further improvements in the technique and reduction in cost. A more traditional technique of staining for the presence of potassium is still useful for visual logging the occurrence of adularia and its abundance in drill core.
Detailed exploration in Northland
Detailed exploration of the more than 20 epithermal Au–Ag prospects identified by reconnaissance exploration in Northland was undertaken by 11 companies (Barker and Christie Citation2016c) with five prospects tested by drilling (). This work included mapping of geology and hydrothermal alteration, rock chip and soil geochemical surveys, resistivity/IP and CSAMT surveys, and drilling at the Te Pene, Hazelbrook-Huia, Puketotara, and Puhipuhi prospects. Puhipuhi is the most explored prospect with 12 DDH, 66 RC and 106 RAB drill holes (Barker and Christie Citation2016c; Hobbins et al. Citation2018).
Detailed exploration in the Hauraki Goldfield (CVZ)
In the 1960s and 1970s, several Pb–Zn–Cu–Au–Ag epithermal veins were explored, notably at the Tui mine that produced Zn, Pb and Cu from 1967 to 1974 (Brathwaite et al. Citation1989). With a rise in the gold price in the late 1970s, detailed exploration commenced with follow-up from Amoco’s reconnaissance programmes and, at the same time, a reappraisal of the former Martha underground mine at Waihi by Amax and Waihi Mining and Development for possible open pit mining (Brathwaite and McKay Citation1989). These two programmes led to a new phase of gold mining that commenced in 1988 with the opening of the Martha open pit mine at Waihi (Brathwaite et al. Citation2006). Subsequently, the Golden Cross mine was commissioned in 1991 as a combined open pit and underground operation (Simpson et al. Citation2001) and further discoveries at Waihi led to underground mining at Favona, Trio and Correnso (Torckler et al. Citation2016; Barker and Christie Citation2016a).
Detailed exploration has used close spaced rock and soil geochemical sampling, and geophysical surveys including ground magnetic, resistivity/IP and CSAMT surveys, generally on a grid pattern, to outline drill targets (Barker and Christie Citation2016a; Kellet and Bromley Citation2018). Diamond drilling has been the most common drilling type, although RC drilling has been used on some prospects (see Barker and Christie Citation2016a).
Most of the old mining centres and new targets defined by reconnaissance prospecting were investigated, with detailed exploration programmes by more than 20 companies (). This work resulted in the definition of new Au and Ag resources in previously mined deposits at Monowai, Karangahake (Talisman), and Waihi (Martha), and discovery of previously unknown veins during brownfields exploration at Golden Cross (Empire stockwork in 1981 and deep Empire vein system in 1982; Hay Citation1989) and Waihi (discoveries of Favona in 2001, Trio in 2003 and Correnso in 2009; Torckler et al. Citation2006, Citation2016). Concealed quartz veins with economic grades (EG Vein and T-Stream vein) have recently been discovered at Wharekirauponga (Streiff et al. Citation2019).
Detailed exploration in the Taupō Volcanic Zone
Follow-up detailed exploration of the more than 20 epithermal Au–Ag prospects identified in the TVZ by reconnaissance exploration was undertaken by seven companies (). The exploration programmes included geological and hydrothermal alteration mapping, rock chip and soil geochemical surveys, IP/resistivity, CSAMT and E-SCAN resistivity surveys, and drilling of 12 prospects (Barker and Christie Citation2016b). Three of the drill-tested prospects are at Ohakuri, including Ohakuri North, East and West. At Ohakuri North, more than 40 holes were drilled, returning up to 4.05 g/t Au over 5.5 m (DDH OH8); resources were estimated as 126 Mt at 0.38 g/t Au and 8.5 g/t Ag, for a contained 2.22 Moz Au equivalent (Au + Ag) (Grieve Citation2000).
Research information to aid detailed prospect-scale exploration
Exploration techniques
In the CVZ, soil geochemical surveys were undertaken at Ohui (Carruthers et al. Citation2010) and Favona as a part of a research programme (Browne and Mauk Citation2007). Theron and Mauk (Citation2010) used data from soil geochemical surveys of several prospects in the southern CVZ to determine regional background, threshold and anomaly values. In the CVZ and TVZ, experimental biogeochemical surveys (e.g. Goff et al. Citation1985; Dunn and Christie Citation2014, Citation2017; Dunn et al. Citation2017, Citation2018) and soil gas surveys (e.g. Christenson et al. Citation1988) have been carried out on epithermal prospects and geothermal areas, but to date these techniques have not been adopted in routine exploration.
Geophysical research has ranged from undertaking surveys to reinterpreting industry acquired data. These include gravity surveys at Golden Cross (Locke and de Ronde Citation1987) and Waihi (Smith et al. Citation2006), resistivity surveys at Golden Cross and Waihi (Bromley and Funnell Citation1990; Bromley et al. Citation1996), multiple geophysical techniques at Puhipuhi (Locke et al. Citation1999), and new interpretations of existing data at Karangahake (Harris et al. Citation2005), deposits in the Waihi-Waitekauri area (Morrell et al. Citation2011) and Golden Cross (Kellett and Bromley Citation2018).
Geothermal research
During the 1960s and 1970s, TVZ geothermal research provided a wealth of information on the temperature profiles, fluid compositions and hydrologic structure of geothermal systems that could further be correlated with hydrothermal alteration mineralogy. This enabled synthesis into cross sectional models by Henley and Ellis (Citation1983) that show the architecture of geothermal systems and alteration mineral zonation. The zonation of some minerals is temperature dependant with the alteration sequence of smectite, interlayered illite/smectite and illite, indicating temperatures of <130°C, 130 and 230°C and >230°C, respectively (Steiner Citation1968; Henley and Ellis Citation1983; Simmons and Browne Citation2000). Similarly, adularia indicates temperatures >180°C and epidote forms at temperatures >230°C from fluids with generally low CO2 concentrations (Browne and Ellis Citation1970). Adularia also correlates with zones of high fluid permeability and is an indirect mineral indicator of boiling, and bladed textured calcite deposited in open spaces is also indicative of formation from a boiling fluid (Browne and Ellis Citation1970; Simmons and Christenson Citation1994; Simmons and Browne Citation2000; Simmons Citation2017, Citation2019). Recently active (ca. 19 to 1.5 ka) geothermal systems at Ohakuri and Tahunaatara that host epithermal Au-Ag mineralisation, have a distal alteration assemblage of mordenite-clinoptilolite-K-feldspar-opal-smectite that probably formed at temperatures of 60–150°C (Brathwaite and Henderson Citation2016; Brathwaite and Rae Citation2019).
Structure strongly influences fluid permeability and fluid upflow zones (e.g. Grindley Citation1965) with mineral deposition concentrated by high fluid flow rates and boiling at epithermal depths (>1000 m to <200 m) (Rowland and Simmons Citation2012). The host rhyolitic rocks are predominantly pyroclastic deposits that have primary permeability in the upper c. 1 km of the system, enabling the fluids to flow outward from feeder structures to produce an upwardly mushrooming fluid profile.
A major advance in understanding the process of epithermal deposit formation was made by Brown (Citation1986) who showed that high concentrations of metals precipitated on back pressure plates in geothermal well heads due to boiling. Brown and Simmons (Citation2003) and Simmons et al. (Citation2016b) directly sampled fluids at depth in the wells, prior to boiling and metal deposition, and determined that high gold grades are deposited from fluids with low metal concentrations at the ppb level. However, in order to deposit a large quantity of gold, a high fluid flux must be coupled with boiling (Rowland and Simmons Citation2012). Reyes et al. (Citation2002) described metal zonation in amorphous silica scales which precipitated as a result of boiling and rapid cooling in pipes downstream from geothermal wellheads at the Rotokawa geothermal field, as Cu, Pb, Zn, Ag and Au at and near the wellhead, followed downstream by Hg and Sb.
Hydrothermal alteration mineralogy and geochemistry
Early research on hydrothermal alteration in the TVZ geothermal systems encouraged New Zealand explorers to conduct petrological and XRD studies of the mineralogy of altered rocks from the late 1970s, to help identify mineral zonation and indicate areas of fluid upflow and potential gold deposition within large areas of hydrothermal alteration (e.g. Simpson and Mauk Citation2001, Citation2007, Citation2011; Brathwaite and Faure Citation2002). More recently, hyperspectral SWIR and pXRF instruments have helped in this task. The SWIR instruments provide analyses of some key hydrothermal alteration minerals (e.g. clays and ammonium minerals; Simpson and Christie Citation2016; Simpson et al. Citation2019), whereas pXRF provides lithogeochemical data that can be used to determine element zonation as well as be used as a proxy for mineral determination (e.g. adularia) (e.g. Waihi; Hughes and Barker Citation2017; Barker et al. Citation2019). The use of automated mineralogy from a scanning electron microscope showed that adularia is more common in hydrothermal alteration at Karangahake than previously known, with many rocks containing >30% adularia and a maximum of 74% adularia (Simpson et al. Citation2019). Thus, large amounts of adularia may occur near veins and its increasing abundance towards the veins may be used as a potential vector to mineralisation.
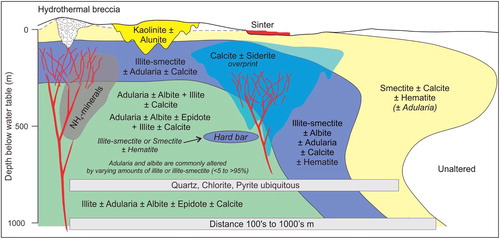
Research on the hydrothermal alteration of individual Au-Ag deposits in the CVZ has enabled the development of a model of hydrothermal alteration mineral zonation (; Christie et al. Citation2007; Simpson and Christie Citation2019). This model identified an assemblage of adularia ± albite + illite ± calcite proximal to the vein followed outward by a zone of interlayered illite-smectite ± albite ± adularia ± calcite and a distal zone of smectite ± calcite ± hematite. Quartz, pyrite ± chlorite are present in all three zones. Ammonium minerals are present at some deposits and occur proximal to veins.
Figure 6. Schematic model of hydrothermal alteration mineral zonation (modified after Christie et al. Citation2007; Simpson and Christie Citation2019). Hard bar: miners term for moderately to weakly altered rock enclosed in strongly altered rock.
Structure
The detailed structure of deposits in the CVZ has been described in several theses completed at the University of Auckland and in subsequent publications (e.g. Nowell Citation1990; Smith Citation2003; Irwin Citation2004; Nortje et al. Citation2006; Begbie et al. Citation2007; Mortimer Citation2008; Spörli and Cargill Citation2011; Masangcay et al. Citation2019). Studies of deposits hosted in andesite, rhyolite and greywacke indicate that vein patterns develop due to local stress conditions, typically triplanar (Irwin Citation2004; Spörli et al. Citation2006; Mortimer Citation2008). In general, the metalliferous veins formed in extensional to oblique extensional stress regimes, dominated by steeply dipping normal faults (Spörli et al. Citation2006; Mortimer Citation2008). Movement on the vein-hosting structures was predominantly dip-slip with only minor strike-slip, whereas strike-slip movement has occurred on many of the post-mineral faults. Fault dilation, with potential for ore shoot development, may occur with changes in fault dip and/or strike and at the intersection of faults (Fraser Citation1910; Wodzicki and Weissberg Citation1970; Merchant Citation1978; Main Citation1979; Irwin Citation2004).
Brathwaite et al. (Citation2001a) quantified the differences in vein development in different host rocks. They found that rock type has a significant influence on vein spacing distributions, with veins hosted in rhyolite being thinner and shorter, but with a higher density compared with veins hosted in andesite at the same deposit. Joints are a major control on vein spacing. Overall, andesite lava and andesitic pyroclastic rocks host thicker and more persistent veins than rhyolite lava and tuff. However, rhyolite can host significant veins as exemplified by the discovery of the EG vein, Wharekirauponga (Streiff et al. Citation2019).
Quartz vein and breccia textures
Quartz vein textures in deposits of the CVZ have been described in many University of Auckland MSc theses mostly following the classification schemes of Dong and Morrison (Citation1995) and Dong et al. (Citation1995). In terms of prospectivity and exploration, probably the most important vein textures are lattice bladed quartz pseudomorphs after platy calcite and colloform textures that indicate boiling, and banded veins that indicate multiple events (e.g. Simmons Citation2017). The presence of pseudosedimentary textures, such as swirl, ripple marks, channel fill, ponding and graded bedding, are caused by fluid flow and tend to form at shallower depths.
Breccia textures have also been described and classified in theses on CVZ Au-Ag deposits, with a comprehensive description of breccias at Favona presented by Mortimer (Citation2008; Table 4.4). Oatmeal breccia texture, described from Golden Cross and the Waihi vein system, typically has associated high gold grades. The texture consists of fragments of vein material that are slabby to ovoid in section and commonly exhibit preferred orientation, suggesting a settling or imbricate texture (see Fig. 3.4C in Simmons Citation2019). Hydrothermal breccias with clasts of breccia are another indicator of multiple events.
Tilting and reorientation
Most of the host rocks to the CVZ Au-Ag deposits are tilted to the east and southeast (Skinner Citation1986). Structural studies by Begbie et al. (Citation2007) concluded that the local 50o southeast dip of the host rocks at Golden Cross was post-mineralisation. By restoring the vein system to its original orientation, the apparent reverse sense of movement on the steeply dipping Empire vein and numerous low-angle footwall veins are transformed so that the Empire vein is shown to have formed as a southeast dipping normal fault and the low-angle footwall veins were steeply dipping extensional veins in the hangingwall (see Fig. 21 of Begbie et al. Citation2007). Similarly, the veins in the Waihi vein system are interpreted to have undergone tilting to the southeast post-mineralisation (Brathwaite and Faure Citation2002). This is confirmed by identification of vein sediments that exhibit tilting from their former horizontal bedding. Masangcay et al. (Citation2019) similarly noted a 15o east to southeast tilt of the Wharekirauponga veins based on the orientation of vein sediments.
Hydrothermal fluid temperature and salinity – fluid inclusions
Studies of fluid inclusions in quartz deposited in veins have been used to estimate the ore-forming fluid temperatures and compositions. These, in turn, have been used to estimate depth below the paleowater table (see below), the gold deposition depth window, and vectors toward high fluid temperature. The first two applications have been very successful (see below), however, vectoring has not been so successful, partly because the large number of samples required to be measured limits the technique to advanced drilling projects.
Measured homogenisation temperatures are mainly from 225 to 250°C, with individual measurements between 100 and 350°C (Merchant Citation1978; Christie Citation1982; Brathwaite and Faure Citation2002; Christie et al. Citation2007; Simpson et al. Citation2015). Salinities are mainly in the 0–2 wt % NaCl eq. range, although maximum salinities exhibited by individual inclusions are as high as 11.9 wt % NaCl eq. at Tui, the deepest deposit (c. 1200–1300 m below the paleo-water table; Christie et al. Citation2007), and 1.7 wt % NaCl eq. at c. 850 m below the paleo-water table at Waihi.
Paleodepth
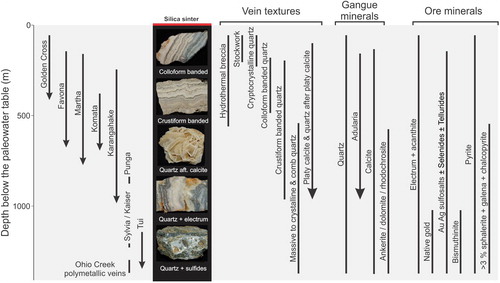
Paleodepths of the epithermal Au-Ag mineralisation in the CVZ have been determined for some deposits by paleosurface indicators such as sinters, where preserved (Hamilton et al. Citation2018), or more commonly have been calculated from fluid inclusion temperatures or boardly estimated from hydrothermal alteration minerals, ore mineralogy, and vein textures (; Brathwaite and Christie Citation2000; Christie and Brathwaite Citation2003b, Citation2004; Chrisite et al. Citation2006, Citation2017). These indicate the deposits formed over a range of depths from near-surface to >1 km below the surface.
Figure 7. Paleodepth relations of vein textures, and gangue and ore minerals, that along with fluid inclusion data enable the estimated depth range below the paleowater table of some deposits (modified after Christie et al. Citation2007).
Gold window
Brathwaite and Christie (Citation2000) observed that economic concentrations of electrum in the CVZ deposits are confined to a paleotemperature window of 260–180°C, which corresponds to temperatures generally conducive for gold deposition from geothermal fluids (Brown Citation1986; Simmons and Browne Citation2000). This means that for dilute, gas-poor fluids that follow the boiling point with depth curve (Haas Citation1971), gold deposition is limited to a vertical interval of about 400 m, with its upper limit at about 100 m below the water table. Most deposits in the CVZ were mined over vertical extents of 170–330 m (Chrisite et al. Citation2006). The greater depth extent of economic gold ore at some deposits such as Waihi (600 m) and Karangahake (700 m) may be due to changes in the concentration of CO2 in the fluid (cf. Hedenquist and Henley Citation1985b) or changes in the level of the water table due to uplift, sector collapse or by draining of lakes (Simmons Citation1991, Citation2002; Simmons et al. Citation1993), or to overprinting systems. Brathwaite and Faure (Citation2002) also suggested mixing as a cause for deep ore deposition. Christie and Brathwaite (Citation2005) and Christie et al. (Citation2017) mapped areas of the CVZ where the gold window was likely to be largely preserved versus other areas where it was eroded or deeply buried, providing another criteria for regional and deposit scale prospectivity.
Discussion and conclusions
An exploration strategy for epithermal Au-Ag deposits in New Zealand is presented in and includes guides from research studies and prospective features at various stages of exploration, from area selection through to the prefeasibility stage. Legacy geochemical exploration data are an important component in desk-top area and target selection using GIS analyses and GIS prospectivity studies. Research on host rock and mineralisation ages, and regional tectonics, structure and paleodepth provides additional information to map the most prospective areas and aid in area selection and targeting.
Table 7. Mineral exploration strategy for low and low-intermediate sulphidation epithermal Au–Ag deposits in New Zealand.
Reconnaissance exploration typically begins with stream sediment surveys along with rock chip sampling of interesting stream float and outcrops, in addition to mapping of geology, hydrothermal alteration, and mineralisation features. Airborne magnetic, radiometric, electromagnetic and lidar surveys can provide useful data for mapping geology, hydrothermal alteration and structure. A major future advance will be the miniaturisation of instrumentation for drone-based geophysical surveys that should reduce the cost of the surveys and enable increased data acquisition and applications. District-scale seismic surveys could help in determining deep structure but have not been used in mineral exploration in New Zealand to date, mostly because of their high cost and logistical difficulties in populated areas. Passive seismic studies may be an alternative.
Detailed exploration typically involves soil and rock chip geochemical surveys and resistivity geophysical surveys to compliment geological and hydrothermal alteration mapping to develop drill targets. Portable XRF and hyperspectral (e.g. Terraspec Halo) analysers are increasingly being used to identify hydrothermal alteration mineralogy and element abundance and zonation, particularly during logging of drill core. Portable XRD instruments are available and can also be used to identify hydrothermal alteration mineralogy and quantify mineral abundances. Hyperspectral core loggers, such as Hylogger and Corescan, have so far not been used in New Zealand because of set-up and running costs, but their application could benefit large drilling projects by identifying hydrothermal mineral vectors to mineralisation. Routine multielement geochemical analyses of surface and drill hole samples enables the use of alteration indices and proxies for alteration minerals (e.g. K/Al for adularia) to help vector toward mineralisation. The combined use of geochemical and alteration mineral determinations by various techniques (assays, pXRF, hyperspectral, XRD) provides the most information about the former hydrothermal system.
Future exploration may benefit from improvements in exploration tools as well as concepts (). Major challenges include expanding efforts to explore under cover and making informed decisions on where to drill next or whether to abandon the prospect. The recent advances in geochemical and mineralogical vectors work best with information from several to many drill holes. Explorationists would benefit from reliable test(s) on a small suite of samples, such as core from the first drill hole, that can indicate the prospectivity of a prospect. So far this has been elusive, and proposed techniques such as the use of the trace element composition of quartz veins and fluid inclusion salinities have not been fruitful. Exploration continues to rely on traditional methods of evaluating size and grade by successive phases of targeted drilling and analyses of drill core.
Table 8. Some areas of future research that would benefit exploration for epithermal Au–Ag deposit in New Zealand.
Acknowledgements
Carolyn Hume and Katy Kelly drafted –. The paper has greatly benefited from reviews by Jeff Hedenquist and Stuart Simmons, and editing by Rich Goldfarb.
Disclosure statement
No potential conflict of interest was reported by the authors.
Additional information
Funding
Related Research Data
References
- Allis RG. 1990. Geophysical anomalies over epithermal systems. Journal of Geochemical Exploration. 36:339–374.
- Arehart GB, Christenson BW, Wood CP, Foland KA, Browne PRL. 2002. Timing of volcanic, plutonic, and geothermal activity at Ngatamariki, New Zealand. Journal of Volcanology and Geothermal Research. 116:201–214.
- Bahiru E, Rowland JV, Eccles JD, Kellett RL. 2019. Regional crustal-scale structural control on epithermal deposits within the Hauraki Goldfield, Coromandel Volcanic Zone, New Zealand: Insight from integrated geological and aeromagnetic structural patterns. New Zealand Journal of Geology and Geophysics. doi: 10.1080/00288306.2019.1574268
- Ballance PF, Spörli KB. 1979. Northland allochthon. Journal of the Royal Society of New Zealand. 9:259–275.
- Barker RG, Christie AB. 2016a. Exploration for epithermal gold-silver deposits in the Hauraki Goldfield, North Island. In: Christie AB, editor. Mineral deposits of New Zealand – exploration and research. Calton: The Australasian Institute of Mining and Metallurgy Monograph. 31; p. 225–236.
- Barker RG, Christie AB. 2016b. Exploration for epithermal gold-silver deposits in the Taupō Volcanic Zone, North Island, New Zealand. In: Christie AB, editor. Mineral deposits of New Zealand – exploration and research. Calton: The Australasian Institute of Mining and Metallurgy Monograph. 31; p. 325–332.
- Barker RG, Christie AB. 2016c. Mineral exploration in the Northland region. In: Christie AB, editor. Mineral deposits of New Zealand – exploration and research. Calton: The Australasian Institute of Mining and Metallurgy Monograph. 31; p. 61–69.
- Barker SLL, Hood S, Hughes RM, Richards S. 2019. The lithogeochemical signatures of hydrothermal alteration in the Waihi epithermal district, New Zealand. New Zealand Journal of Geology and Geophysics. doi: 10.1080/00288306.2019.1651345
- Beach V, Hobbins JM. 2016. Puhipuhi – a high level epithermal gold-silver prospect in Northland. In: Christie AB, editor. Mineral deposits of New Zealand – exploration and research. Calton: The Australasian Institute of Mining and Metallurgy Monograph. 31; p. 219–224.
- Begbie MJ, Spörli KB, Mauk JL. 2007. Structural evolution of the Golden Cross epithermal Au-Ag deposit, New Zealand. Economic Geology. 102(5):873–892.
- Bibby HM, Bennie SL, Stagpoole VM, Caldwell TG. 1994. Resistivity structure of the Waimangu, Waiotapu, Waikite and Reporoa geothermal areas, New Zealand. Geothermics. 23(5/6):445–471. doi: 10.1016/0375-6505(94)90013-2
- Bibby HM, Caldwell TG, Davey FJ, Webb TH. 1995. Geophysical evidence on the structure of the TVZ and its hydrothermal circulation. Journal of Volcanology and Geothermal Research. 68:29–58.
- Bibby HM, Dawson GB, Rayner HH, Bennie SL, Bromley CJ. 1992. Electrical resistivity and magnetic investigations of the geothermal systems in the Rotorua area, New Zealand. Geothermics. 21(1/2):43–64. doi: 10.1016/0375-6505(92)90067-J
- Bibby HM, Dawson GB, Rayner HH, Stagpoole VM, Graham DJ. 1984. The structure of the Mokai Geothermal Field based on geophysical observations. Journal of Volcanology and Geothermal Research. 20(1/2):1–20. doi: 10.1016/0377-0273(84)90063-5
- Booden MA, Mauk JL, Simpson MP. 2011. Quantifying metasomatism in epithermal Au-Ag deposits: a case study from the Waitekauri area, New Zealand. Economic Geology. 106(6):999–1030. doi: 10.2113/econgeo.106.6.999
- Brathwaite RL. 1981. Size patterns of gold-silver deposits in the Hauraki goldfield, Coromandel Peninsula. Proceedings of the 15th Australasian Institute of Mining and Metallurgy New Zealand Branch Annual Conference; Aug 19–21; Thames; 11 p.
- Brathwaite RL, Cargill HJ, Christie AB, Swain A. 2001a. Lithological and spatial controls on the distribution of quartz veins in andesite- and rhyolite-hosted epithermal Au-Ag deposits of the Hauraki Goldfield, New Zealand. Mineralium Deposita. 36:1–12.
- Brathwaite RL, Christie AB. 1996. Geology of the Waihi area, Sheet T13BD, scale 1:50,000. Institute of Geological & Nuclear Sciences Geological Map 21.
- Brathwaite RL, Christie AB. 2000. Deposit types and paleo-depth extents of Coromandel epithermal Au-Ag deposits. Proceedings of the 2000 New Zealand Minerals and Mining Conference; Oct 29–31; Wellington. Crown Minerals, Ministry of Economic Development; p. 185–196.
- Brathwaite RL, Christie AB, Skinner DNB. 1989. The Hauraki goldfield – regional setting, mineralisation and recent exploration. In: Kear D, editor. Mineral deposits of New Zealand. Vol. 13. Parkville: The Australasian Institute of Mining and Metallurgy Monograph; p. 45–56.
- Brathwaite RL, Faure K. 2002. The Waihi gold-silver-base metal sulfide-quartz vein system, New Zealand: temperature and salinity controls on electrum and sulfide deposition. Economic Geology. 97:269–290.
- Brathwaite RL, Henderson S. 2016. Epithermal zeolite and Au-Ag mineralisation in the Ngakuru area, Taupō Volcanic Zone. In: Christie AB, editor. Mineral deposits of New Zealand – exploration and research. Vol. 31. Calton: The Australasian Institute of Mining and Metallurgy Monograph; p. 503–509.
- Brathwaite RL, McKay DF. 1989. Geology and exploration of the Martha Hill gold-silver deposit, Waihi. In: Kear D, editor. Mineral deposits of New Zealand. Parkville: Australasian Institute of Mining and Metallurgy Monograph. 13; p. 83–88.
- Brathwaite RL, Pirajno F. 1993. Metallogenic map of New Zealand 1:1,000,000. Institute of Geological and Nuclear Sciences Monograph 3.
- Brathwaite RL, Rae A. 2019. Epithermal zeolite mineralisation, central Taupō Volcanic Zone. Proceedings of the PACRIM 2019 – Mineral systems of the Pacific Rim Congress; Auckland, New Zealand, 3–5 April 2019; p. 264–266.
- Brathwaite RL, Simpson MP, Faure K, Skinner DNB. 2001b. Telescoped porphyry Cu-Mo-Au, advanced argillic alteration and polymetallic quartz-sulfide-gold-anhydrite veins in the Thames District, New Zealand. Mineralium Deposita. 36:623–640.
- Brathwaite RL, Torckler LK, Jones PK. 2006. The Martha Hill epithermal Au-Ag deposit, Waihi – geology and mining history. In: Christie AB, Brathwaite RL, editor. Geology and exploration of New Zealand mineral deposits. Calton: The Australasian Institute of Mining and Metallurgy Monograph. 25; p. 171–178.
- Briggs RM, Fulton BWJ. 1990. Volcanism, structure, and petrology of the Whiritoa-Whangamata coastal section, Coromandel Volcanic Zone, New Zealand: facies model evidence for the Tunaiti caldera. New Zealand Journal of Geology and Geophysics. 33:623–633.
- Bromley CJ, Bennie SL, Graham DJ. 1996. Golden Cross South CSAMT resistivity survey Waitekauri Valley, Waihi. Coeur Gold New Zealand. IGNS confidential client report 72633C.
- Bromley CJ, Brathwaite RL. 1991. Waihi Basin structure in light of recent geophysical surveys. Proceedings of the 25th Australasian Institute of Mining and Metallurgy New Zealand Branch Annual Conference; Waihi; p. 225–238.
- Bromley CJ, Funnell RH. 1990. In-situ resistivity measurement of veins in epithermal goldmines near Waihi. In: Harvey CC, Browne PRL, Freeston DH, Scott GL, editors. Proceedings of the 12th New Zealand Geothermal Workshop 1990. Auckland: Geothermal Institute; p. 233–236.
- Brown GA. 1989. Mineral potential of Northland. In: Kear D, editor. Mineral deposits of New Zealand. Vol. 13. Parkville: The Australasian Institute of Mining and Metallurgy Monograph; p. 33–37.
- Brown KL. 1986. Gold deposition from geothermal discharges in New Zealand. Economic Geology. 81:979–983.
- Brown KL, Simmons SF. 2003. Precious metals in high-temperature geothermal systems in New Zealand. Geothermics. 32(4/6):619–625. doi: 10.1016/S0375-6505(03)00049-X
- Browne PRL. 1969. Sulfide mineralisation in a Broadlands geothermal drillhole, Taupō Volcanic Zone, New Zealand. Economic Geology. 64:156–169.
- Browne PRL. 1971. Mineralisation in the Broadlands geothermal field, Taupō Volcanic Zone, New Zealand. Society of Mining Geologists of Japan. Special Issue. 2:64–75.
- Browne PRL. 1978. Hydrothermal alteration in active geothermal fields. Annual Review of Earth and Planetary Sciences. 6:229–250.
- Browne PRL. 1979. Minimum age of the Kawerau geothermal field, North Island, New Zealand. Journal of Volcanology and Geothermal Research. 6:213–215.
- Browne PRL, Ellis AJ. 1970. The Ohaaki-Broadlands geothermal area, New Zealand: mineralogy and related geochemistry. American Journal of Science. 269:97–131.
- Browne PRL, Lawless JV. 2001. Characteristics of hydrothermal eruptions, with examples from New Zealand and elsewhere. Earth-Science Reviews. 52:299–331.
- Browne CJ, Mauk JL. 2007. The distribution of pathfinder elements in soils in the Favona deposit, Waihi region, New Zealand. Proceedings of the 40th Australasian Institute of Mining and Metallurgy New Zealand Branch Annual Conference; Aug 13–15; Christchurch; p. 303–308.
- Browne PRL, Weissberg BG, Wodzicki A. 1975. Comparison of hydrothermal systems at Broadlands and the Tui Mine, Te Aroha. New Zealand Geochemical Group Newsletter. 37:8.
- Burkett DA, Graham IT, Ward CR. 2015. The application of portable X-ray diffraction to quantitative mineralogical analysis of hydrothermal systems. The Canadian Mineralogist. 53:429–454. doi: 10.3749/canmin.1400099
- Carruthers SD, Mauk JL, Streiff R, van Warden T. 2010. Soil geochemistry of the Ohui Au-Ag epithermal prospect, Coromandel Peninsula. Proceedings of the 43rd Australasian Institute of Mining and Metallurgy New Zealand Branch Annual Conference; Nov 24–26; Auckland; p. 129–138.
- Chambefort I, Lewis BD, Simpson MP, Bignall G, Rae AJ, Ganefianto N. 2017. Ngatamariki geothermal system: magmatic to epithermal transition in the Taupō Volcanic Zone, New Zealand. Economic Geology. 112:319–346. doi: 10.2113/econgeo.112.2.319
- Christenson BW, Hayba DO. 1995. Hydrothermal eruptions in oreforming reservoirs: analogues and models. Pacrim Congress 1995, Auckland, New Zealand, Proceedings; p. 119–124.
- Christenson BW, Malmqvist L, Kristiansson K, Finlayson JB. 1988. Soil gas trace metal transport – the GEOGAS method applied to NZ epithermal and geothermal environments. Proceedings of the 10th New Zealand Geothermal Workshop, Geothermal Institute of the University of Auckland and the Centre for Continuing Education; p. 155–160.
- Christie AB. 1982. Fluid inclusions, stable isotopes and geochemistry of porphyry copper and epithermal vein deposits of the Hauraki gold-silver province, New Zealand [Unpublished PhD thesis]. Victoria University of Wellington; 796 p.
- Christie AB. 2019. Introduction to New Zealand hard rock gold deposits and their exploration models. New Zealand Journal of Geology and Geophysics. doi: 10.1080/00288306.2019.1653328
- Christie AB, Barker RG. 2007. Mineral resource assessment of Northland. GNS Science report 2007/6.
- Christie AB, Barker RG, Vidanovich P. 2012. Publicly available airborne geophysical survey data in New Zealand. The AusIMM Bulletin. 2012(4):27–29.
- Christie AB, Brathwaite RL. 1986. Epithermal gold-silver and porphyry copper deposits of the Hauraki goldfield - a review. In: Henley RW, Hedenquist JW, Roberts PJ, editors. Guide to the active epithermal (geothermal) systems and precious metal deposits of New Zealand. Vol. 26. Berlin: Gebruder & Borntraeger, Monograph Series on Mineral Deposits; p. 129–145.
- Christie AB, Brathwaite RL. 2003a. Epithermal gold in New Zealand: Mineral deposit models. Institute of Geological and Nuclear Sciences Science Report. 2003/11; 72 p.
- Christie AB, Brathwaite RL. 2003b. Paleodepth studies of epithermal Au-Ag deposits in the North Island of New Zealand: progress toward a 4D model. Proceedings of the 36th Australasian Institute of Mining and Metallurgy New Zealand Branch Annual Conference; Greymouth; p. 219–230.
- Christie AB, Brathwaite RL. 2004. Paleodepth assessment of epithermal gold-silver deposits in New Zealand. In: Muhling J, Goldfarb R, Vielreicher N, Bierlein F, Stumpfl E, Groves DI, Kenworthy S, editors. SEG 2004: Predictive mineral discovery under cover: extended Abstracts. Centre for Global Metallogeny, The University of Western Australia, Publication. 33; p. 208–211.
- Christie AB, Brathwaite RL. 2005. Regional targeting of epithermal Au-Ag deposits in a Miocene-Pliocene volcanic terrane: Hauraki goldfield, New Zealand. In: Mao J, Bierlein FP, editors. Mineral deposit research: meeting the global challenge, proceedings of the Eighth Biennial SGA Meeting, volume 2. Berlin: Springer; p. 1457–1460.
- Christie AB, Brathwaite RL, Barker RG, Skinner DNB. 2008. Mineral resource assessment of the Thames-Coromandel and Hauraki districts, New Zealand. GNS Science Report. 2008/14, 119 p.
- Christie AB, Brathwaite RL, Mauk JL, Simpson MP. 2006. Hauraki Goldfield – regional exploration databases and prospectivity studies. In: Christie AB, Brathwaite RL, editors. Geology and exploration of New Zealand mineral deposits. Vol. 25. Calton: The Australasian Institute of Mining and Metallurgy Monograph; p. 73–84.
- Christie AB, Brathwaite RL, Rattenbury MS, Skinner DNB. 2001. Mineral resource assessment of the Coromandel region, New Zealand. Institute of Geological and Nuclear Sciences, Science Report 2001/11.
- Christie AB, Brathwaite RL, Simpson MP. 2017. Paleodepth indicators for targeting and vectoring of epithermal Au-Ag deposits: examples from the Hauraki Goldfield, New Zealand. Proceedings of the 14th SGA Biennial Meeting, Mineral Resources to Discover, Quebec City; August 20–23, 2017, Vol. 3; p. 1073–1076.
- Christie AB, Faure K, Rabone SDC, Barker RG, et al. 2003. Boiling and mixing of hydrothermal fluids in the Wharekirauponga rhyolite-hosted epithermal gold-silver deposit, Hauraki goldfield, New Zealand. In: Eliopoulos DG, editor. Mineral exploration and sustainable development. Rotterdam: Millpress Science; p. 453–456.
- Christie AB, Henderson SM, Grieve PL. 2016. Exploration of the Wharekirauponga gold-silver prospect, Hauraki Goldfield, Coromandel volcanic Zone. In: Christie AB, editor. Mineral deposits of New Zealand – exploration and research. Vol. 31. Calton: The Australasian Institute of Mining and Metallurgy Monograph; p. 259–271.
- Christie AB, Simpson MP, Brathwaite RL, Mauk JL, Simmons SF. 2007. Epithermal Au-Ag and related deposits of the Hauraki Goldfield, Coromandel Volcanic Zone, New Zealand. Economic Geology. 102:785–816.
- Christie AB, Stewart T. 2016. Regional exploration geochemistry database of geochemical data compiled from open-file mineral reports. In: Christie AB, editor. Mineral deposits of New Zealand – exploration and research. Vol. 31. Calton: The Australasian Institute of Mining and Metallurgy Monograph; p. 543–548.
- Corbett Geological Services. 1991. Final report on prospecting licence 31-1591 Lookout Rocks Project. Austpac Gold Exploration NZ Ltd. New Zealand Petroleum & Minerals, Ministry of Business, Innovation and Employment, Wellington, unpublished open-file mineral report MR3009.
- Crown Minerals. 2003. Epithermal gold in New Zealand: GIS data package and prospectivity modelling. Published jointly by Crown Minerals, Ministry of Economic Development and Institute of Geological and Nuclear Sciences.
- Crown Minerals. 2009. Crown Minerals open file metallic minerals geochemical database. Ministry of Economic Development Wellington unpublished open-file mineral report MR4510.
- Dong G, Morrison G. 1995. Adularia in epithermal veins, Queensland: Morphology, structural state and origin. Mineralium Deposita. 30:11–19.
- Dong G, Morrison G, Jareth S. 1995. Quartz textures in epithermal veins, Queensland – classification, origin, and implications. Economic Geology. 90:1841–1856.
- Doyle S. 2007. Final report prospecting permit 39-282, Taupō Volcanic Zone. Glass Earth (NZ) Ltd. Unpublished open-file mining company report, New Zealand Petroleum & Minerals, Ministry of Business, Innovation and Employment MR4214.
- Dunn CE, Christie AB. 2014. Biogeochemical orientation survey, Luck at Last Mine Area, Coromandel, New Zealand. GNS Science Report. 2014/60; 112 p.
- Dunn CE, Christie AB. 2017. Tree ferns in biogeochemical exploration, Goldmine (Puhipuhi) Hill, North Island, New Zealand. GNS Science Report. 2017/21.
- Dunn CE, Christie AB, Black J. 2017. Tree ferns as biogeochemical survey sample media in gold exploration, Luck at Last Mine, Coromandel, New Zealand. GNS Science Report. 2017/22.
- Dunn CE, Christie AB, Black J. 2018. Biogeochemical surveys at Ohui and Pine Sinter epithermal Au-Ag prospects, Coromandel, and at Waiotapu Thermal Park, New Zealand. GNS Science Report. 2018/20; 84 p.
- Edbrooke SW. (compiler) 2001. Geology of the Auckland area: scale 1:250,000. Lower Hutt: Institute of Geological & Nuclear Sciences Limited. Institute of Geological & Nuclear Sciences 1:250,000 geological map 3. 74 p. + 1 fold. map.
- Edbrooke SW, Brook FJ. (compilers) 2009. Geology of the Whangarei area: scale 1:250,000. Lower Hutt: GNS Science. Institute of Geological & Nuclear Sciences 1:250,000 geological map 2. 68 p. + 1 folded map.
- Ellis AJ, Mahon WAJ. 1964. Natural hydrothermal systems and experimental hot-water/rock interactions. Geochimica et Cosmochimica Acta. 28:1323–1357.
- Ellis AJ, Mahon WAJ. 1967. Natural hydrothermal systems and experimental hot water/rock interactions (part II). Geochimica et Cosmochimica Acta. 31(4):519–538. doi: 10.1016/0016-7037(67)90032-4
- Ellis AJ, Mahon WAJ. 1977. Chemistry and geothermal systems. New York: Acedemic Press; 392 p.
- Evans RB. 1993a. Geological map of Northland: Sheets N04 & O04: Ahipara and Kaitaia. Published by the author, PO Box 383, Kerikeri.
- Evans RB. 1993b. Geological map of Northland: Sheets N05 & O05: Herekino and Rawene. Published by the author, PO Box 383, Kerikeri.
- Evans RB. 1993c. Geological map of Northland: Sheets O06 & O07: Waipoua and Aranga. Published by the author, PO Box 383, Kerikeri.
- Ewers GR, Keays RR. 1977. Volatile and precious metal zoning in the Broadlands geothermal field, New Zealand. Economic Geology. 72:1337–1354.
- Feltrin L, Motta JG, Al-Obeidat F, Marir F, Bertelli M. 2016. Combining weights of evidence analysis with feature extraction – a case study from the Hauraki Goldfield, New Zealand. Procedia Computer Science. 83:1262–1267.
- Fraser C. 1910. The geology of the Thames subdivision, Hauraki, Auckland. New Zealand Geological Survey Bulletin. 10; 136 p.
- Gemmell JB. AMIRA P588 Research Team. 2006. Exploration implications of hydrothermal alteration associated with epithermal Au-Ag deposits. Proceedings of the Australian Earth Science Convention 2006; Melbourne, Geological Society of Australia; p. 5.
- Giggenbach WF. 1981. Geothermal mineral equilibria. Geochimica et Cosmochimica Acta. 45(3):393–410. doi: 10.1016/0016-7037(81)90248-9
- Goff S, Brooks RR, Nadidu SD, Coppard E. 1985. Delineation of potentially auriferous quartz reefs by analysis of the bark of Pinus radiata (Monterey Pine). Journal of Geochemical Exploration. 24:273–280.
- Grieve P. 2000. Final report on prospecting licence 312733 (Ohakuri), Taupō Volcanic Zone, New Zealand. Delta Gold NZ Ltd. New Zealand Petroleum & Minerals, Ministry of Business, Innovation and Employment, Wellington, unpublished open-file mineral report MR3802.
- Grimes S, Rickard D, Hawkesworth C, van Calsteren P, Browne P. 1998. A U-Th calcite isochron age from an active geothermal field in New Zealand. Journal of Volcanology and Geothermal Research. 81:327–333.
- Grindley GW. 1965. The geology, structure and exploitation of the Wairakei geothermal field, Taupō, New Zealand. New Zealand Geological Survey Bulletin. 75; 130 p.
- Haas JL. 1971. The effect of salinity on the maximum thermal gradient of a hydrothermal system at hydrostatic pressure. Economic Geology. 66:940–946.
- Halley S. 2014. Calculated mineralogy and its applications. Pp. 199–206 in: Chapter 3, Geological interpretation and geological modeling of: Mineral Resource and Ore Reserve Estimation – The AusIMM Guide to Good Practice (2nd ed). AusIMM Monograph 30.
- Halley S, Dilles JH, Tosdal RM. 2015. Footprints: hydrothermal alteration and geochemical dispersion around porphyry copper deposits. SEG Newsletter. 100(1):12–17.
- Hamilton AR, Campbell KA, Rowland JV, Barker S, Guido D. 2018. Characteristics and variations in sinters of the Coromandel Volcanic Zone: application to epithermal exploration. New Zealand Journal of Geology and Geophysics. doi: 10.1080/00288306.2018.1519514
- Hamilton A, Soengkono S. 2009. Ohakuri Prospect EP 40-656 Global resource evaluation. Report prepared for Glass Earth New Zealand Ltd. NZP&M Open File Report MR4469.
- Harris MC, Cassidy J, Locke CA, Mauk JL, Stevens M, Vidanovich P. 2005. Geophysical characteristics of the Karangahake epithermal deposit, Hauraki Goldfield, New Zealand. Proceedings of the 2005 New Zealand Minerals Conference, Realising New Zealand's mineral potential; Nov 13–16; Auckland. Crown Minerals, Ministry of Economic Development and Australasian Institute of Mining and Metallurgy, New Zealand Branch; p. 115–124.
- Hay KR. 1989. Exploration case history of the Golden Cross project Waihi, New Zealand. In: Kear D, editor. Mineral deposits of New Zealand. Vol. 13. Parkville: Australasian Institute of Mining and Metallurgy Monograph; p. 67–72.
- Hedenquist JW. 1986. Geothermal systems of the Taupō Volcanic Zone: their characteristics and relation to volcanism and mineralisation. In: Smith IEM, editor. Late Cenozoic volcanism in New Zealand. Vol. 23. Wellington: Royal Society of New Zealand Bulletin; p. 134–168.
- Hedenquist JW. 1991. Boiling and dilution in the shallow portion of the Waiotapu geothermal system, New Zealand. Geochimica et Cosmochimica Acta. 55:2753–2765.
- Hedenquist JW, Henley RW. 1985a. Hydrothermal eruptions in the Waiotapu geothermal system, New Zealand: origin, breccia deposits and effect on the precious metal mineralisation. Economic Geology. 80:1640–1668.
- Hedenquist JW, Henley RW. 1985b. The importance of CO2 on freezing point measurements of fluid inclusions: evidence from active geothermal systems and implications for epithermal ore deposition. Economic Geology. 80:1379–1406.
- Hedenquist JW, Simmons SF, Giggenbach WF, Eldridge CS. 1993. White Island, New Zealand, volcanic-hydrothermal system represents the geochemical environment of high-sulfidation Cu and Au ore deposition. Geology. 21(8):731–734.
- Heise W, Caldwell TG, Bibby HM, Bannister S. 2008. Three-dimensional modelling of magnetotelluric data from the Rotokawa geothermal field, Taupō Volcanic Zone, New Zealand. Geophysical Journal International. 173(2):740–750. doi: 10.1111/j.1365-246X.2008.03737.x
- Henderson SM, Christie AB, Soengkono S, Henderson D, Howie K, Smith B, Coote A, Cahill J. 2016. Glass Earth staged exploration for epithermal gold-silver deposits in the southern Hauraki Goldfield and Taupō Volcanic Zone, North Island, 2003-2013. In: Christie AB, editor. Mineral deposits of New Zealand – exploration and research. 31. Calton: The Australasian Institute of Mining and Metallurgy Monograph; p. 237–246.
- Henderson S, Cryan G, Cahill J, Stratford W, Garwin S, Power W, Stuart R, Holden D. 2005. Glass Earth gold exploration: combining Geoinformatics data intervention processes with ultra-detailed geophysical prospecting. In: Proceedings of the 2005 New Zealand Minerals Conference; Nov 13–16; Auckland. Crown Minerals, Ministry of Economic Development and Australasian Institute of Mining and Metallurgy, New Zealand Branch; p. 134–141.
- Henley RW. 1985. The geothermal framework of epithermal deposits. Reviews in Economic Geology. 2:1–24.
- Henley RW, Brown KL. 1985. A practical guide to the thermodynamics of geothermal fluids and hydrothermal ore deposits. Reviews in Economic Geology. 2:25–44.
- Henley RW, Ellis AJ. 1983. Geothermal systems, ancient and modern. Earth Science Reviews. 19:1–50.
- Henley RW, Hedenquist JW, Roberts PJ, editors. 1986. Guide to the active epithermal (geothermal) systems and precious metal deposits of New Zealand. Berlin: Gebrueder Borntraeger. Monograph Series on Mineral Deposits 26; 211 p.
- Henley RW, Truesdell AH, Barton PB Jr. 1984. Fluid-mineral equilibria in hydrothermal systems. Reviews in Economic Geology. 1; 267 p.
- Hill MP, Christie AB, Durance PMJ, Martin AP, Turnbull RE, Smillie RW. 2019. An update on new mineral potential modelling of onshore Zealandia. Proceedings of the PACRIM 2019 – mineral systems of the Pacific Rim Congress; Auckland, New Zealand, 3–5 April 2019; p. 280–286.
- Hobbins JM, Theron R, Campbell KA. 2018. Recent exploration results from the Puhipuhi epithermal camp. Proceedings 51st of the Australasian Institute of Mining and Metallurgy New Zealand Branch Annual Conference; Sept 17–18; Tauranga; p. 171–180.
- Hronsky JMA, Groves D. 2008. Science of targeting: definition, strategies, targeting and performance measurement. Australian Journal of Earth Sciences. 55:3–12.
- Hughes R, Barker SLL. 2017. Using portable XRF to infer adularia halos within the Waihi Au-Ag system, New Zealand. Geochemistry: Exploration, Environment, Analysis. 18:97–108. doi: 10.1144/geochem2016-006
- Irvine RJ, Smith MJ. 1990. Geophysical exploration for epithermal gold deposits. Journal of Geochemical Exploration. 36:375–412.
- Irwin MR. 2004. The structure of epithermal deposits of the Coromandel Peninsula: dynamic processes and three-dimensional strain [Unpublished PhD (Geology) thesis]. University of Auckland. 2 volumes.
- Ishikawa Y, Sawaguchi T, Iwaya S, Horiuchi M. 1976. Delineation of prospecting targets for Kuroko deposits based on modes of volcanism of underlying dacite and alteration halos. Mining Geology. 26:105–117.
- Joly A, Porwal A, McCuaig TC. 2012. Exploration targeting for orogenic gold deposits in the Granites-Tanami Orogen: mineral system analysis, targeting model and prospectivity analysis. Ore Geology Reviews. 48:349–383.
- Kellett RL, Bromley CJ. 2018. Geophysical signatures of New Zealand epithermal Au-Ag deposits, and methods for new exploration. New Zealand Journal of Geology and Geophysics. doi: 10.1080/00288306.2018.1548494
- Krupp RE, Seward TM. 1987. The Rotokawa geothermal system, New Zealand: an active epithermal gold-depositing environment. Economic Geology. 82(5):1109–1129.
- Large RR, Gemmell J, Paulick H. 2001. The alteration box plot: a simple approach to understanding the relationship between alteration mineralogy and lithogeochemistry associated with volcanic-hosted massive sulfide deposits. Economic Geology. 96:957–971.
- Leonard GS, Begg JG, Wilson CJN. 2010. Geology of the Rotorua area: scale 1:250,000. Lower Hutt: GNS Science. Institute of Geological & Nuclear Sciences 1:250,000 geological map 5. 102 p. + 1 folded map.
- Locke CA, de Ronde CEJ. 1987. Delineation of gold-bearing hydrothermally altered rocks using gravity data – a New Zealand example. Geoexploration. 24:471–481.
- Locke CA, Johnson SA, Cassidy J, Mauk JL. 1999. Geophysical exploration of the Puhipuhi epithermal area, Northland, New Zealand. Journal of Geochemical Exploration. 65:91–109.
- Locke CA, Morrell AE, Cassidy J, Smith N. 2006. Magnetic and gravity methods in the exploration of epithermal deposits in the Coromandel Peninsula, Hauraki Goldfield. In: Christie AB, Brathwaite RL, editors. Geology and exploration of New Zealand mineral deposits. Calton: The Australasian Institute of Mining and Metallurgy Monograph. 25; p. 95–100.
- Main JV. 1979. Precious metal bearing veins of the Maratoto – Wentworth area, Hauraki goldfield, New Zealand. New Zealand Journal of Geology and Geophysics. 22:41–51.
- Malengreau B, Skinner DNB, Bromley C, Black PM. 2000. Geophysical characterisation of large silicic volcanic structures in the Coromandel Peninsula, New Zealand. New Zealand Journal of Geology and Geophysics. 43:171–186.
- Masangcay BS, Rowland J, Torckler L, Randall S, Theron R, Gardner T, McArthur F. 2019. Structural architecture of the Wharekirauponga low-sulphidation epithermal Au-Ag deposit, Hauraki Goldfield, New Zealand. Poster presentation at PACRIM 2019 – Mineral systems of the Pacific Rim Congress; Auckland, New Zealand, 3–5 April 2019; p. 256–259.
- Mauk JL, Hall CM, Chesley JT, Barra F. 2011. Punctuated evolution of a large epithermal province: the Hauraki Goldfield, New Zealand. Economic Geology. 106:921–943.
- McCuaig TC, Beresford S, Hronsky J. 2010. Translating the mineral systems approach into an effective exploration targeting system. Ore Geology Reviews. 38:128–138.
- McCuaig TC, Sherlock RL. 2017. Exploration targeting. In: V Tschirhart, MD Thomas, editor. Proceedings of exploration 17: Sixth Decennial International Conference on Mineral Exploration; Toronto (ON); p. 75–82.
- Merchant RJ. 1978. Metallogenesis in the Thames - Tapu area Coromandel Peninsula, New Zealand [Unpublished Ph.D. thesis]. Auckland: University of Auckland.
- Merchant RJ. 1986. Mineralisation in the Thames district, Coromandel. In: Henley RW, Hedenquist JW, Roberts PJ, editors. Guide to the active epithermal (geothermal) systems and precious metal deposits of New Zealand. Vol. 26. Berlin: Gebruder & Borntraeger, Monograph Series on Mineral Deposits; p. 165–183.
- Milicich SD, Wilson CJN, Bignall G, Pezaro B, Charlier BLA, Wooden JL, Ireland TR. 2013. U-Pb dating of zircon in hydrothermally altered rocks of the Kawerau geothermal field, Taupō Volcanic Zone, New Zealand. Journal of Volcanology and Geothermal Research. 253:97–113.
- Morrell AE. 2004. Geophysical characteristics of low-sulphidation epithermal gold-silver deposits in the Waihi-Waitekauri region, New Zealand [Unpublished M.Sc. thesis]. Auckland: University of Auckland.
- Morrell AE, Locke CA, Cassidy J, Mauk JL. 2011. Geophysical characteristics of adularia-sericite epithermal gold-silver deposits in the Waihi-Waitekauri region, New Zealand. Economic Geology. 106:1031–1041.
- Mortimer JA. 2008. Structural aspects of the Favona epithermal Au-Ag deposit, Waihi, New Zealand [Unpublished MSc thesis]. University of Auckland; 166 p.
- Mortimer N. 2012. Miocene volcano-tectonic setting of Coromandel epithermal mineralisation: the big picture context. Proceedings of the 45th Australasian Institute of Mining and Metallurgy New Zealand Branch Annual Conference; Aug 26–29; Rotorua; p. 309–314.
- Nortje GS, Rowland JV, Spörli KB, Blenkinsop TG, Rabone SDC. 2006. Vein deflections and thickness variations of epithermal quartz veins as indicators of fracture coalescence. Journal of Structural Geology. 28:1396–1405.
- Nowell SB. 1990. The structure and associated alteration of epithermal vein mineralisation, Waiotahi Valley, Thames, New Zealand [MSc thesis unpublished]. University of Auckland.
- Payne CE, Cunningham F, Peters KJ, Nielsen S, Puccioni E, Wildman C, Partington GA. 2014. From 2D to 3D: prospectivity modeling in the Taupō Volcanic Zone, New Zealand. Ore Geology Reviews. 20. doi: 10.1016/j.oregeorev.2014.11.013
- Payne CE, Peters KJ. 2015. Geochemistry in prospectivity modelling: investigating gold mineralisation in the Taupō Volcanic Zone, New Zealand. Geochemistry: Exploration, Environment, Analysis. 15:193–204. doi: 10.1144/geochem2014-274
- Peters KJ, Partington GA, McKenzie CJ, Hill MP, Miller AVM, Nielsen SHH. 2016. A review of mineral prospectivity modelling in New Zealand during the past 15 years. In: Christie AB, editor. Mineral deposits of New Zealand – exploration and research. Vol. 31. Calton: The Australasian Institute of Mining and Metallurgy Monograph; p. 53–60.
- Pope JG, Brown KL, McConchie DM. 2005. Gold concentrations in springs at Waiotapu, New Zealand: implications for precious metal deposition in geothermal systems. Economic Geology. 100:677–687.
- Rabone SDC. 1991. Residual total force magnetic anomaly map, Coromandel region, 1:100,000. New Zealand Geological Survey report M183.
- Rabone SDC. 1992. Coromandel Peninsula Sheet 2 (south), Thames – Te Aroha, Geological Map 1:100,000. Published by author.
- Rae AJ, Bouchot V, Guillo H, Prior CA. 2015. Constraining the age and duration of hydrothermal activity at the extinct Ohakuri hydrothermal system, Taupō Volcanic Zone New Zealand. Proceedings 37th Geothermal Workshop, paper no. 70; University of Auckland, New Zealand.
- Rattenbury MS, Cox SC, Edbrooke SW, Martin AP. 2016. Integrating airborne geophysical data into new geological maps of New Zealand mineral provinces. In: Christie AB, editor. Mineral deposits of New Zealand – exploration and research. Vol. 31. Calton: The Australasian Institute of Mining and Metallurgy Monograph; p. 37–44.
- Rattenbury MS, Partington GA. 2003. Prospectivity models and GIS data for the exploration of epithermal gold mineralisation in New Zealand, 68 p.: In: Anon, Epithermal gold in New Zealand: GIS data package and prospectivity modelling: Published jointly by Crown Minerals, Ministry of Economic Development and Institute of Geological and Nuclear Sciences (CD-ROM).
- Reyes AG, Trompetter WJ, Britten K, Searle J. 2002. Mineral deposits in the Rotokawa geothermal pipelines, New Zealand. Journal of Volcanological and Geothermal Research. 119:215–239.
- Risk GF, Bibby HM, Caldwell TG. 1999. Resistivity structure of the central Taupō volcanic Zone, New Zealand. Journal of Volcanology and Geothermal Research. 90(3/4):163–181.
- Rowland JV, Bahiru E, Pogancnik J. 2017. The influence of inherited structure on localisation of epithermal gold mineralisation. In: Proceedings of the Gold17 Conference; Feb 21–23; Rotorua. Australian Institute of Geoscientists Bulletin. 63:86–88.
- Rowland JV, Bahiru EA, Schofield M, Hamilton A, Pickle R, Zuquim M de P, Eccles J. 2016. Tectonic and structural controls on late Miocene-to-present epithermal gold-silver mineralisation, Northern New Zealand. In: Christie AB, editor. Mineral deposits of New Zealand – exploration and research. Calton: The Australasian Institute of Mining and Metallurgy Monograph. 31; p. 247–258.
- Rowland JV, Simmons SF. 2012. Hydrologic, magmatic, and tectonic controls on hydrothermal fluid flow, Taupō Volcanic Zone, New Zealand: implications for the formation of epithermal vein deposits. Economic Geology. 107:427–457.
- Seward TM. 1989. The hydrothermal chemistry of gold and its implications for ore formation: boiling and conductive cooling as examples. Economic Geology Monograph. 6:398–404.
- Simmons SF. 1991. Hydrologic implications of alteration and fluid inclusion studies in the Fresnillo District, Mexico: evidence for a brine reservoir and a descending water table during the formation of hydrothermal Ag-Pb-Zn orebodies. Economic Geology. 86:1579–1601.
- Simmons SF. 2002. The paleosurface and paleowater table and their relationship to epithermal mineralisation. SEG Newsletter. 51:28–29.
- Simmons SF. 2017. Proximal to distal hydrothermal alteration patterns around epithermal low-intermediate sulfidation vein deposits and their implications for precious metal exploration. GNS Science Report. 2017(28):39. doi: 10.21420/G2FW6C
- Simmons SF. 2019. The geometry and evolution of the boiling zone that produced the Favona ore bodies in the Hauraki Goldfield, and the implications for exploration. GNS Science Report. 2019(02):28. doi: 10.21420/393T-G091
- Simmons SF, Brown KL. 2006. Gold in magmatic hydrothermal solutions and the rapid formation of a giant ore deposit. Science. 314:288–291. doi: 10.1126/science.1132866
- Simmons SF, Brown KL. 2007. The flux of gold and related metals through a volcanic arc, Taupō Volcanic Zone, New Zealand. Geology. 35(12):1099–1102. doi: 10.1130/G24022A.1
- Simmons SF, Brown KL, Browne PRL, Rowland JV. 2016a. Gold and silver resources in Taupō Volcanic Zone geothermal systems. Geothermics. 59(B):205–214.
- Simmons SF, Brown KL, Tutolo BM. 2016b. Hydrothermal transport of Ag, Au, Cu, Pb, Te, Zn, and other metals and metalloids in New Zealand geothermal systems: spatial patterns, fluid-mineral equilibria, and implications for epithermal mineralization. Economic Geology. 111(3):589–618. doi: 10.2113/econgeo.111.3.589
- Simmons SF, Browne PRL. 2000. Hydrothermal minerals and precious metals in the Broadlands-Ohaaki geothermal system: Implications for understanding low-sulfidation epithermal environments. Economic Geology. 95:971–999.
- Simmons SF, Christenson BW. 1994. Origins of calcite in a boiling geothermal system. American Journal of Science. 294:361–400.
- Simmons SF, Keywood M, Scott BJ, Keam RF. 1993. Irreversible change of the Rotomahana-Waimangu hydrothermal system (New Zealand) as a consequence of a volcanic eruption. Geology. 21(7):643–646.
- Simpson MP, Christie AB. 2016. Exploration of New Zealand mineral deposits and geothermal systems using X-ray diffraction (XRD) and reflectance spectrometry (SWIR): a comparison of techniques. GNS Science Report. 2016(61):45.
- Simpson MP, Christie AB. 2019. Hydrothermal alteration mineralogical footprints for New Zealand epithermal Au-Ag deposits. New Zealand Journal of Geology and Geophysics. doi: 10.1080/00288306.2019.1577278
- Simpson MP, Gazley MF, Stuart AGJ, Pearce MA, Birchall R, Chappell D, Christie AB, Stevens M. 2019. Hydrothermal alteration at the Karangahake epithermal deposit, Hauraki goldfield, New Zealand. Economic Geology. 114(2):243–273.
- Simpson MP, Mauk JL. 2001. Hydrothermal alteration and hydrologic evolution of the Golden Cross epithermal Au-Ag deposit, New Zealand. Economic Geology. 96(4):773–796.
- Simpson MP, Mauk JL. 2004. Epithermal deposits and analogous geothermal systems: a physical size comparison with implications for exploration. Proceedings of the 37th Australasian Institute of Mining and Metallurgy New Zealand Branch Annual Conference; Aug 29–Sept 1; Nelson; p. 229–240.
- Simpson MP, Mauk JL. 2007. The Favona epithermal gold-silver deposit, Waihi, New Zealand. Economic Geology. 102(5):817–839.
- Simpson MP, Mauk JL. 2011. Hydrothermal alteration and veins at the epithermal Au-Ag deposits and prospects of the Waitekauri area, Hauraki goldfield, New Zealand. Economic Geology. 106(6):945–973. doi: 10.2113/econgeo.106.6.945
- Simpson MP, Mauk JL, Simmons SF. 2001. Hydrothermal alteration and hydrologic evolution of the Golden Cross epithermal Au-Ag deposit, New Zealand. Economic Geology. 96:773–796.
- Simpson MP, Palinkas SS, Mauk JL, Bodnar RJ. 2015. Fluid inclusion chemistry of adularia-sericite epithermal Au-Ag deposits of the southern Hauraki goldfield, New Zealand. Economic Geology. 110:763–786. doi: 10.2113/econgeo.110.3.763
- Skinner DNB. 1983. Ring rhyolites ‘round Rangihau. In: Geological Society of New Zealand Annual Conference Programme and Abstracts; Nov 14–18; Auckland. Geological Society of New Zealand Miscellaneous Publication. 30A:101.
- Skinner DNB. 1986. Neogene volcanism of the Hauraki volcanic region. In: Smith IEM, editor. Late Cenozoic volcanism in New Zealand: a collection of papers dealing with the nature and distribution of late Cenozoic volcanic activity in New Zealand, published in the centennial year of the 1886 eruption of Tarawera. Wellington: Royal Society of New Zealand. Royal Society of New Zealand Bulletin. 23; p. 21–47.
- Skinner DNB. 1993. Geology of the Coromandel Harbour area. Lower Hutt: Institute of Geological & Nuclear Sciences. Institute of Geological & Nuclear Sciences geological map 4. 44 p. + fold. map, scale 1:50,000.
- Skinner DNB. 1995. Geology of the Mercury Bay area: sheets T11BD & part U11, scale 1:50 000. Lower Hutt: Institute of Geological & Nuclear Sciences. Institute of Geological & Nuclear Sciences geological map 17. 56 p. + 1 fold. map.
- Smith SF. 2003. Structural control of mineralisation at the Karangahake low-sulphidation epithermal Au-Ag deposit, Coromandel Peninsula, New Zealand [MSc thesis unpublished]. University of Auckland.
- Smith N, Cassidy J, Locke CA, Mauk JL, Christie AB. 2003. A geophysical study of the Waihi Region, New Zealand. Proceedings of the 36th Australasian Institute of Mining and Metallurgy New Zealand Branch Annual Conference; Greymouth; p. 10.
- Smith N, Cassidy J, Locke CA, Mauk JL, Christie AB. 2006. The role of regional-scale faults in controlling a trap-door caldera, Coromandel Peninsula, New Zealand. Journal of Volcanology and Geothermal Research. 149:312–328.
- Smith B, Henderson D, Howie K. 2007. New characterisation of deep crustal structure in the Taupō Volcanic Zone and its implications for ongoing gold exploration by Glass Earth Limited. Proceedings of the 40th Australasian Institute of Mining and Metallurgy New Zealand Branch Annual Conference; Aug 13–15; Christchurch; p. 109–114.
- Spörli KB, Begbie MJ, Irwin MR, Rowland JV. 2006. Structural processes and tectonic controls on the epithermal Au-Ag deposits of the Hauraki Goldfield. In: Christie AB, Brathwaite RL, editors. Geology and exploration of New Zealand mineral deposits. Vol. 25. Calton: The Australasian Institute of Mining and Metallurgy Monograph; p. 85–94.
- Spörli KB, Cargill H. 2011. Structural evolution of a world-class epithermal orebody: the Martha Hill deposit, Waihi, New Zealand. Economic Geology. 106:975–998.
- Stagpoole VM, Caratori Tontini F, Barretto J, Davy B, Edbrooke SW. 2016. Inversion of magnetic and gravity data reveals subsurface igneous bodies in Northland, New Zealand. New Zealand Journal of Geology and Geophysics. 59(3):416–425. doi: 10.1080/00288306.2016.1162178
- Stagpoole VM, Caratori Tontini F, Soengkono S, Rattenbury MS, Henderson S. 2015. Inversion and quantitative analysis of airborne geophysical survey data from the Taupō Volcanic Zone. GNS Science report 2013/51. 35 p. + 1 enclosure + 1 CD.
- Stagpoole VM, Christie AB, Henrys SA, Woodward DJ. 2001. Aeromagnetic map of the Coromandel region: total force anomalies, 1:100,000. Institute of Geological and Nuclear Sciences geophysical map 14.
- Stagpoole VM, Edbrooke SW, Christie AB, Davy BW, Caratori Tontini F, Soengkono S, Cox SC, Isaac MJ. 2012. Northland airborne magnetic and radiometric survey: a geological interpretation. GNS Science Report. 2011/54. 113 p.
- Steiner A. 1953. Hydrothermal rock alteration at Wairakei, New Zealand. Economic Geology. 48(1):1–13. doi: 10.2113/gsecongeo.48.1.1
- Steiner A. 1968. Clay minerals in hydrothermally altered rocks at Wairakei, New Zealand. Clays and Clay Minerals. 16:193–213.
- Steiner A. 1970. Genesis of hydrothermal K-feldspar (adularia) in an active geothermal environment at Wairakei, New Zealand. Mineralogical Magazine. 37(292):916–922.
- Steiner A. 1977. The Wairakei geothermal area, North Island, New Zealand: its subsurface geology and hydrothermal rock alteration. Lower Hutt: New Zealand Geological Survey. New Zealand Geological Survey Bulletin 90; 136 p.
- Streiff R, Randall S, McArthur F, Gardner T, Torckler L. 2019. Road to discovery at WKP, New Zealand. Proceedings of the PACRIM 2019 – Mineral systems of the Pacific Rim Congress; Auckland, New Zealand, 3–5 April 2019; p. 256–259.
- Theron R, Mauk JL. 2010. Soil geochemistry of the southern Hauraki Goldfield, Coromandel Peninsula, New Zealand: geochemical background, threshold values, and anomaly recognition. Proceedings of the 43rd Australasian Institute of Mining and Metallurgy New Zealand Branch Annual Conference; Nov 24–26; Auckland; p. 543–552.
- Torckler LK, Hobbins JM, Christie AB. 2016. Mining and exploration of the epithermal gold-silver deposits at Waihi, Hauraki Goldfield. In: Christie AB, editor. Mineral deposits of New Zealand – exploration and research. Calton: The Australasian Institute of Mining and Metallurgy Monograph. 31; p. 303–312.
- Torckler LK, McKay D, Hobbins J. 2006. Geology and exploration of the Favona Au-Ag deposit, Waihi, Hauraki Goldfield. In: Christie AB, Brathwaite RL, editors. Geology and exploration of New Zealand mineral deposits. Calton: The Australasian Institute of Mining and Metallurgy Monograph. 25; p. 179–184.
- Weissberg BG. 1969. Gold-silver ore-grade precipitates from New Zealand thermal waters. Economic Geology. 64:95–108.
- Weissberg BG, Browne PRL, Seward TM. 1979. Ore metals in active geothermal systems. In: Barnes HL, editor. Geochemistry of hydrothermal ore deposits. 2nd ed. New York (NY): Wiley; p. 738–780.
- Williams GJ. 1974. Economic geology of New Zealand. Australasian Institute of Mining and Metallurgy Monograph Series 4.
- Wilson CJN, Houghton BF, McWilliams MO, Lanphere MA, Weaver SD, Briggs RM. 1995. Volcanic and structural evolution of Taupō Volcanic Zone, New Zealand: a review. Journal of Volcanology and Geothermal Research. 68:1–28.
- Wilson CJN, Rowland JV. 2016. The volcanic, magmatic, and tectonic setting of the Taupō Volcanic Zone, New Zealand, reviewed from a geothermal perspective. Geothermics. 59(Part B):168–187.
- Wodzicki A, Weissberg BG. 1970. Structural control of base metal mineralisation at the Tui Mine, Te Aroha, New Zealand. New Zealand Journal of Geology and Geophysics. 13:610–630.