
ABSTRACT
We analyse seismic data collected from a short-term array deployment in the low seismicity area of Dunedin city, New Zealand. The addition of this temporary network to the permanent GeoNet national seismic network allows detection of earthquakes not captured by the GeoNet network. Using one of the newly detected earthquakes as a master event, we employ a template match-filter analysis to identify similar events in the area. Specifically, we record a cluster of micro-events at the northern extent of the Akatore Fault (<15 km from the city centre). A recent paleoseismic study has shown the Akatore Fault to have had multiple earthquake ruptures in the late Holocene after over 110 ka of quiescence, so the observed microseismicity is consistent with the fault being in a state of elevated activity. In contrast, other known faults in the area are quiescent with respect to both microseismicity and Holocene ruptures. The establishment of a permanent seismic array in and around Dunedin for the monitoring of microseismicity on the Akatore Fault and other local faults is warranted.
Introduction
The 2010–2012 Canterbury sequence was one of the most damaging earthquake sequences in New Zealand history, both in terms of damage to buildings and infrastructure, and loss of life (e.g. Kaiser et al. Citation2012). Both the Mw 7.1 September 2010 Darfield earthquake and the Mw 6.2 February 2011 Christchurch earthquake occurred on previously unidentified fault systems in regions of historically low seismicity (e.g. Beavan et al. Citation2011; Quigley et al. Citation2012). The Christchurch earthquake was especially damaging due to high amplitude ground motions in proximity to densely populated areas of Christchurch (e.g. Bradley and Cubrinovski Citation2011) and highlights the dangers of blind thrusts and ‘near-field’ ground motions (Fry, Benites, Kaiser et al. Citation2011; Fry, Benites, Reyners et al. Citation2011). Furthermore, it is likely that strong ground motions as well as clustered and long-lived aftershocks in the Canterbury sequence are affected by the low-seismicity nature of the Cantabrian crust (Fry and Gerstenberger Citation2011). The lack of damaging local earthquakes in the historical record leading up to the 2010–2011 sequence () meant the built environment contained numerous old, unreinforced masonry buildings that had not been reinforced for strong seismic shaking (e.g. Cole et al. Citation2012; Goded et al. Citation2018). Unknown faults in regions of historically low seismicity present challenges to probabilistic seismic hazard (PSH) models (Stirling et al. Citation1998, Citation2002, Citation2012) as these regions often have sparse seismic networks, and high magnitude completeness thresholds. This can be especially problematic when there are highly populated areas within these regions.
Dunedin city is analogous to Christchurch prior to the 2010–2011 earthquake sequence, as it is a city with numerous unreinforced masonry buildings, and has been seismically quiescent for the entire historical period (1840-present). The only earthquake to significantly shake Dunedin and produce minor damage in the historical period was a shallow (<20 km) ML 4.9 earthquake approximately 10 km south of the city in 1974 (Bishop Citation1974). One of the recommendations of the Royal Commission report on the Canterbury earthquakes (‘Unknown Faults Under Cities’, Villamor et al. Citation2018) was that cities in other low seismicity regions in New Zealand should be studied in an effort to avert future loss of life and property. Dunedin subsequently became a pilot study for these efforts, which applied a multidisciplinary approach to identifying active faults under or close to the city, where surface evidence of faulting is not present or is obscured (Villamor et al. Citation2018). Because the station spacing for the New Zealand National Seismograph Network (operated and maintained by GeoNet; www.geonet.org.nz) in the southern South Island is relatively sparse compared to the rest of the country (on the order of 70–130 k spacing), our study utilises a temporary seismic array deployment to improve earthquake detection and expand the completeness threshold of the resulting earthquake catalogue. Our study seeks to: (1) detect microseismicity and tremor occurring in and around Dunedin by using seismic data from a short-term deployment of three mini seismic arrays. The arrays were designed to potentially capture microseismicity from local active or potentially active faults, including newly mapped faults defined from geomorphic lineaments. (; Villamor et al. Citation2018); (2) produce an earthquake catalogue for the duration of the array deployment; and (3) use the results of (1) and (2) to assess the contemporary activity of known and potentially active faults close to Dunedin.
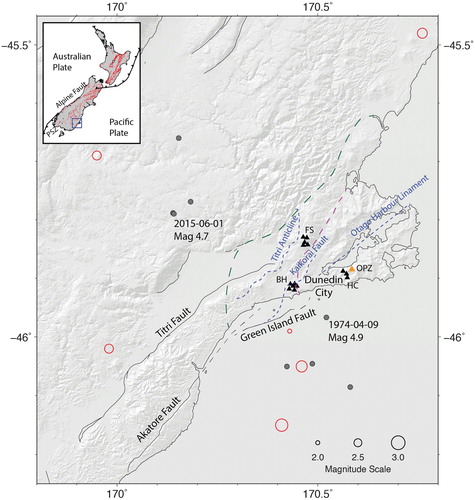
Figure 1. Seismic array deployment locations around Dunedin city (black triangles). Earthquakes detected by the Dunedin seismic arrays (deployed between JD 201–247) are plotted as red circles. None of these events (magnitudes 2.0–2.9) are in the New Zealand earthquake catalogue (also note that Reyners et al. Citation2017 and Eberhart-Phillips et al. Citation2018 suggested an additional earthquake near Dunedin during their array deployment in 2014–2015). Earthquakes from the New Zealand earthquake catalogue since 1960 with magnitude ≥4.0 are plotted as dark grey circles. The largest recorded earthquake occurred a few kilometres south of Dunedin in 1974 and was a magnitude 4.9. The main population centres are located east of the coarsely dashed line, the Dunedin volcano is located to the east of the medium dashed line, known and inferred active faults are shown as solid and finely dashed lines, respectively (Gorman et al. Citation2013), and the Puysegur Subduction Zone is denoted by ‘PSZ’.
Tectonic setting and seismic hazard
Dunedin is located along the south eastern coast of the South Island, and is underlain by a diverse geology of Tertiary volcanics, Tertiary marine sediments, and Jurassic schist (Bishop and Turnbull Citation1996). Dunedin sits at the onshore eastern extent of the Otago range and basin province (e.g. Taylor-Silva et al. Citation2019). The province is characterised by a series of northeast–southwest trending folds and reverse faults that collectively accommodate some of the convergence between the obliquely-colliding Pacific and Australian plates (). Two of these active faults, the Akatore and Titri faults, are located close to Dunedin. They have been the subject of recent paleoseismic studies, and are interpreted as being capable of producing earthquakes with magnitudes greater than 7.0 (Litchfield and Norris Citation2000; Rees-Jones et al. Citation2000; Litchfield Citation2001; Litchfield et al. Citation2002; Litchfield and Lian Citation2004; Gorman et al. Citation2013; Denys et al. Citation2016; Taylor-Silva et al. Citation2019). The results of Villamor et al. (Citation2018) shows that the Akatore Fault does not extend northward into Dunedin City, but does come to within ∼15 km of the city centre. It may also intersect with the newly mapped and offshore Green Island Fault (Gorman et al. Citation2013; Holt Citation2017; Villamor et al. Citation2018), which in turn may link to the newly mapped and onshore Kaikorai Valley Fault in the southwestern suburbs of the city (Villamor et al. Citation2018; ).
Although the Akatore and Titri faults both show evidence of late Quaternary activity (Litchfield and Norris Citation2000; Litchfield Citation2001; Parvizi et al. Citation2019; Taylor-Silva et al. Citation2019), the recent tectonic geomorphological and paleoseismic investigations indicate that the Akatore Fault has shown strongly episodic behaviour through time. These studies document three Holocene events on the fault, but with no evidence for at least the previous ∼110 ka (Litchfield and Norris Citation2000; Taylor-Silva et al. Citation2019). Due to its proximity to Dunedin (the dashed line on shows the northern offshore continuation of the fault), determining the activity of the northern extent of the Akatore Fault, together with the Green Island and Kaikorai Valley faults is of great importance for characterising the seismic hazard for the city. Furthermore, the northern extension of the Titri Fault as an active anticline on the northwestern side of the city, and the possible presence of an active fault along the length of Otago Harbour are additional considerations for assessing the seismic hazard of the city (Villamor et al. Citation2018). The seismic array described in our study was designed to detect microseismicity across the greater Dunedin area, and potentially provide constraints on the activity of local faults.
Dunedin’s built environment includes a large number of buildings that date from the mid to late nineteenth century that have not yet experienced strong ground shaking from large local earthquakes (Adams and Kean Citation1974; Bishop Citation1974). The GeoNet catalogue (www.geonet.org.nz) contains only eight earthquakes of magnitude 4.0 or greater within 70 km of Dunedin since the New Zealand seismograph network achieved national coverage and completeness down to magnitude 4 in 1964 (Smith Citation1976; and ). The 1974 ML 4.9 earthquake is all that has happened of significance in historical time. At the time of this event, the Akatore Fault was the only mapped fault in the vicinity of Dunedin (only the onshore length known at the time, ∼30 km to the south), and the source of the event remains unknown. Reyners et al. (Citation2017) and Eberhart-Phillips et al. (Citation2018) show that a few earthquakes were detected during the 2014–2015 deployment of a broadband seismic array throughout central and eastern Otago that do not appear in the GeoNet catalogue. Additionally, recent small earthquakes that have occurred offshore to the southwest of Dunedin and near the newly-mapped northern extent of the Akatore Fault (Gorman et al. Citation2013; Holt Citation2017; Villamor et al. Citation2018) are the main focus of this study. This area also hosts most of the eight earthquakes recorded by the GeoNet catalogue, including four events greater than magnitude 4 ().
Table 1. Earthquakes M4.0 near Christchurch City in the GeoNet catalogue in the time period 1964–2009 (catalogue from www.geonet.org.nz).
Table 2. Earthquakes M4.0 near Dunedin City in the GeoNet catalogue since 1964 (catalogue from www.geonet.org.nz).
Short-term deployment of a small aperture broadband seismic array of arrays
Seismic station spacing in the southern South Island is sparse, with only seven broadband real-time stations installed within ∼200 km of Dunedin between 2000 and 2008 (https://www.geonet.org.nz/data/tools/FDSN). While this wide aperture seismic network provides a seismic catalogue with completeness down to magnitude 4 (Stirling et al. Citation2012), it is inadequate for detecting smaller earthquakes in the area of Dunedin. It is also inadequate for detecting tremor or microseismicity that could indicate active deformation on a known or unknown fault. In order to look for microseismicity occurring in Dunedin, denser seismic station spacing is required. As part of the Natural Hazards Research Platform study ‘Unknown Faults Under Cities’ (Villamor et al. Citation2018), three mini arrays of 5–6 seismometers (arrays BH, HC, and FS in ) were deployed around the city () and began recording in early August 2016, with each station recording data for a subset of their deployment time. By the time the last data were recorded in September 2016, each of the 14 stations had recorded data for around 20 total days (). Within the deployment period, most stations simultaneously recorded data between the 2016 Julian days (JD) 224–238. This study consequently focusses on the short time period of 2016 JD 224–238.
Table 3. Location information for the Dunedin array stations used in this study.
Table 4. Dunedin array station recording dates.
Dense seismic arrays are effective at detecting low amplitude seismic signals, such as microseismicity originating from the same source area (e.g. Wech and Creager Citation2008). Another method used to detect small earthquakes originating from the same source area is template matched-filter analysis, which creates a waveform template from a master event and scans the dataset to search for repeating events with waveforms matching the master event above a specified cross-correlation threshold. Some of these methods have been applied to New Zealand faults to detect tectonic tremor, which are effectively low frequency earthquakes that are thought to be seismic manifestations of creep on a fault at depth (e.g. Kim et al. Citation2011; Wech et al. Citation2012; Chamberlain et al. Citation2014; Todd and Schwartz Citation2016), and microseismicity (e.g. Boese et al. Citation2012, Citation2013; Warren-Smith et al. Citation2017; Baratin et al. Citation2018; Michailos et al. Citation2019). In the following sections we describe our use of these methods and the small-aperture Dunedin seismic array deployment to detect active microseismicity beneath Dunedin.
Methods
Creating an earthquake catalogue
Data from the Dunedin seismic array are added to data from the permanent GeoNet stations around the southern South Island to create a virtual seismic network with added station density in Dunedin. The purpose of doing so is to create a catalogue with a lower detection threshold than the GeoNet stations alone can provide. Other than a M3 event about 200 km to the north of Dunedin (https://www.geonet.org.nz/earthquake/technical/2016p622912), the GeoNet network did not detect any earthquakes near Dunedin during the array deployment. For compatibility and adding consistency with the GeoNet catalogue, we use SeisComp3 (www.seiscomp3.org) to employ an automatic detection algorithm similar to the method used by GeoNet on a national scale. This software suite enables us to detect earthquakes throughout the duration of the Dunedin array deployment ().
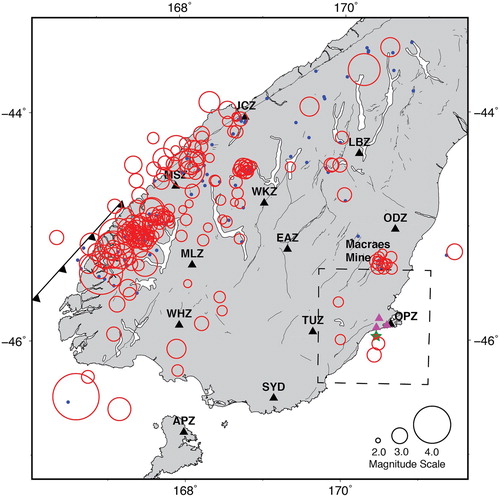
Figure 2. Events detected by the Dunedin array (purple triangles) and the broadband GeoNet stations shown (black triangles) together between JD 201–247 are plotted as red circles and scaled for magnitude. Events from the GeoNet catalogue are plotted as blue dots. Blasts from Macraes Mine are labelled. The addition of the Dunedin array stations improved the detection for smaller magnitude events, especially in Eastern Otago and Southland. The event proximal to the Dunedin Array used in the template match filter search is depicted as a star. Efforts to detect tectonic tremor were confined to the Dunedin region inside area denoted by the black dashed rectangle.
Earthquake phases from events that took place during the deployment period are automatically picked in SeisComp3 using scautopick, a software that searches through data and identifies sudden changes in amplitude in the time histories. An automatic STA/LTA (Short term average over long term average) triggering algorithm is applied to the time histories that make a detection (i.e. identifies a potential P-wave onset) when the change in amplitude over time exceeds an a priori threshold. Since we are especially interested in detecting small events in eastern Otago, we use STA and LTA windows of 0.5 and 20 s, respectively, on bandpass filtered traces between 2 and 15 Hz. Each detection is manually checked, and additional P and S waves are manually picked on Dunedin array stations and permanent GeoNet broadband stations for the duration of the Dunedin array deployment. These picks are associated with the known origins, and the events are initially located with SeisComp3’s linear inversion algorithm, Locsat (Bratt and Bache Citation1988) within the automatic process scautoloc. They are then relocated with a Bayesian searching algorithm, NonLinLoc (alomax.free.fr/nlloc) using the New Zealand 3D velocity model (Eberhart-Phillips et al. Citation2010). Finally, local magnitudes are computed with SeisComp3’s scamp and scmag algorithms in order to compute network and station values from the amplitude measurements and event origin distances.
Template matched-filter analysis with EQcorrscan
To further analyse the data collected from the short-term small aperture seismic array around Dunedin, we use a ML 2.0 earthquake located approximately 10 km south of the array in the vicinity of the 1974 ML 4.9 earthquake that caused some damage in the city (). We employ a template matched-filter analysis of this event to search for additional events originating from the same fault or proximal faults with the same mechanism during the array deployment. EQcorrscan is a Python package that is designed to detect and analyse repeating or near-repeating seismic events (Chamberlain et al. Citation2018). The package is often used to isolate small amplitude repeating signals in regions with various levels of seismicity (e.g. Chamberlain et al. Citation2014; Baratin et al. Citation2018; Michailos et al. Citation2019).
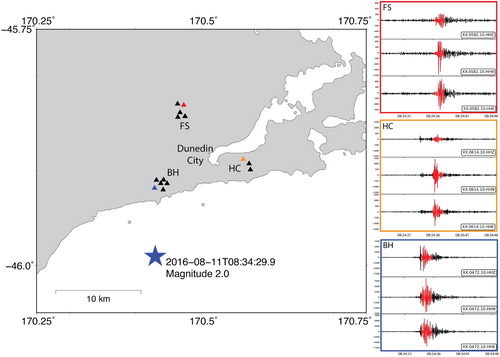
Figure 3. Dunedin Array locations (triangles), master event location (star) are shown with respect to Dunedin City. Waveforms from one station in each array (denoted by the coloured triangles) are plotted in black with the templates used in the matched-filter superimposed in red. All detected events are assumed to be collocated or nearly collocated with the master event.
We create a 1.8 s template waveform from the selected earthquake (2016-08-11 08:34:29.9; ML 2.0) that starts 0.2 s before the S wave on each of the Dunedin array stations that record the earthquake () and cross-correlate the waveform through all waveform data recorded for 12 days between JD224 and JD236. These 12 days were timed for when most of the stations were simultaneously recording. When the cross-correlation sum exceeds a certain threshold (7.9 × the Mean Absolute Deviation; MAD), the detection is recorded as an event. Due to the short duration of the Dunedin array deployment, this threshold is determined by visually inspecting all the unique matched-filter detections with cross-correlation coefficients above 0.65 in order to see phase arrivals before the S wave template detection, and to minimise the number of false detections. This was done for thresholds between 5–13 × MAD at 1.0 intervals and 0.1 intervals between thresholds of 7.5 and 8.5. Use of a manually calibrated cross-correlation sum threshold provides a conservative estimate of the number of event detections that is sufficient for the short duration of the dataset. Detections on a single channel are required to have a 6 s gap to ensure the same detected event is not picked multiple times. We then determine magnitudes relative to the original template earthquake by taking the log of the peak amplitude in each detection and normalising them by the magnitude of the template event, ML 2.0. While these are not actual ML magnitudes, they serve as relative magnitudes for the purposes of our study.
Searching for tectonic tremor
The dense placement of the arrays around Dunedin city allows for an investigation into whether near-continuous, low amplitude seismic energy is present on any fault structures beneath the city, and within the area of the arrays. To search for tectonic tremor that may indicate creep on faults at depth, we slightly modify the tremor detection method in Todd and Schwartz (Citation2016) to search for shallow tremor on crustal faults in the immediate vicinity of Dunedin. Tectonic tremor was not detected over the short duration of our dataset (between JD 224 and JD236).
Results
Short-term earthquake catalogue
During the entirety of the Dunedin array deployment (JD 201–247), 189 events were detected and located by adding the Dunedin array data to the GeoNet stations and using the STA/LTA triggering method described earlier (). Each event listed in the catalogue requires that at least one Dunedin array station is used to locate the event. This initial catalogue is dominated by larger regional events of ML > 3.0 from the Fiordland subduction zone and blast events from Macraes Mine, located 60 km north of Dunedin. The addition of the Dunedin seismic array greatly improved the network’s ability to detect M < 3.0 earthquakes, especially in eastern Otago and Southland.
Five of the newly detected events in the catalogue are located within 50 km of Dunedin and have magnitudes between 2.0 and 2.9. One of these events was located less than 10 km from the city, and occurred on JD 224 (2016-08-11 08:34:29.9), when nearly all of the Dunedin array stations were recording (4). The earthquake was well-recorded on all the Dunedin array stations despite being magnitude 2.0 (). Additionally, this earthquake is proximal to the northern offshore end of the Akatore Fault, and also close to the Green Island Fault and estimated location of the 1974 ML 4.9 earthquake. While we cannot determine whether either of these structures produced the earthquake (the location and hypocentral depth are poorly constrained), the event is the best candidate for a template matched-filter search through the array data to better define this earthquake sequence and assess the presence of microseismicity in and around Dunedin.
Microseismicity located near Dunedin
We detect 16 earthquakes on stations across the Dunedin array in the 12 days starting JD224 including one foreshock with a relative magnitude of 1.7–1.8 around 30 min before the ML 2.0 master event and 15 aftershocks ( and ). Since there were only a few days during the deployment when most of the Dunedin array stations were recording, each event above the prescribed detection threshold is visually inspected and checked against larger regional events to minimise false detections. Relative magnitudes are computed for each of the 16 detections from their respective maximum amplitudes and normalised by the ML 2.0 master event () and three-component plots of each detected event are shown in . While the short deployment and varying quality of the station data in the arrays do not provide much opportunity to confidently detect many aftershocks above the detection threshold of the array, it is clear that microseismicity was occurring within a few kilometres of Dunedin, on or near the northern extent of the Akatore Fault during the short duration of the array. In other words, it is possible that the area shows pronounced activity on a regular basis, unless we somehow managed to record rare seismicity during the very short duration of the array. The latter seems unlikely to us.
Figure 4. Waveforms of two detections are shown for select Dunedin array stations. The colour of the boxes bounding the waveforms correspond to the matching station symbol, and the vertical lines denote the origin time of each event. The differences in detections between the stations in the arrays around Dunedin are primarily due to differences in site conditions. Vertical lines denote the origin time of each event.
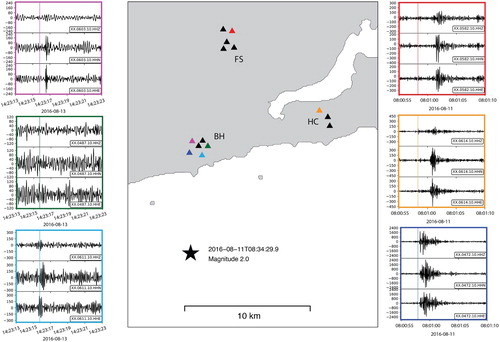
Figure 5. Matched-filter detections based on the master event for JD 224–236. (a) The detected foreshock plotted at two stations with the master event waveform. Relative magnitudes computed for each detection based on the magnitude 2.0 master event. The foreshock is shown at the nearest and farthest stations to illustrate the range of relative magnitudes (1.70–1.76) for a single event. (b) Waveforms for the 15 aftershock detections with the template superimposed in red. The cross correlation coefficients are listed for each detection, and aftershocks are displayed on the clearest channel.
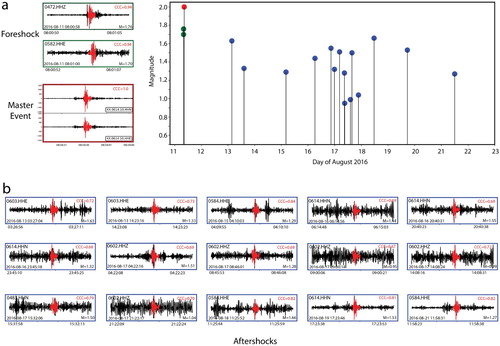
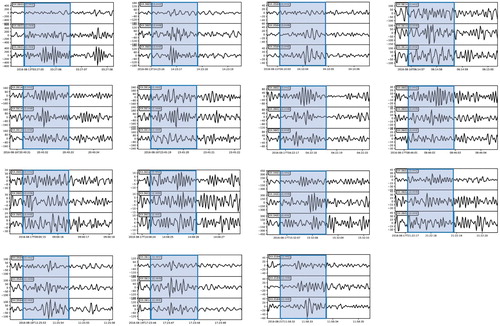
Figure 6. Three-component plots for the 15 detected aftershocks. The time span of the template match is highlighted by the blue box. The match is typically made on only one of the three components due to variability between the channels. The clearest matching channel is shown in .
Seismic hazard implications
The key findings of this project of relevance to seismic hazard analysis in the Dunedin area are: (1) that there appears to be an absence of microseismicity and tremor beneath Dunedin, including along the faults modelled as potentially active by Villamor et al. (Citation2018); and (2) the only notable area of microseismicity near the city is concentrated near the northern offshore end of the Akatore Fault. Unfortunately, the absence of microseismicity under Dunedin is insufficient to confirm faults like the Kaikorai Fault as inactive, as the Titri Fault is a known active fault that is also absent of microseismicity. The Akatore Fault is the only fault that has shown both contemporary microseismicity and pronounced large earthquake activity in the late Holocene (Taylor-Silva et al. Citation2019). Given that one of the recommendations of Taylor-Silva et al. (Citation2019) is that future seismic hazard studies should assume that the high late Holocene rates of Akatore Fault earthquakes (0.3–6 mm/yr slip rate, and two large earthquakes within the last thousand years) will continue into the immediate future, we consider that the contemporary microseismicity observed on the fault is compatible with this assumption. All of these interpretations are made with the caveat that we have only been able to examine the 46 days of microseismicity available from the Dunedin temporary array.
Our study shows that with a more detailed array around the city than currently provided by the New Zealand network, the local microseismicity can be detected. Despite the short duration of the deployment, we can detect potential activity near the intersection of the northern part of the Akatore Fault, the Green Island Fault, and the southern part of the Kaikorai Valley Fault. We are also able to detect more earthquakes in the wider Otago region than those detected by the GeoNet network. Future seismic studies should go beyond simply establishing a temporary array deployment of longer duration than that of our Dunedin array. Instead, working to establish a low cost permanent seismic array would be a much more desirable goal.
Conclusions
This study has utilised a short-term broadband seismic array deployment to conduct the first microseismicity study of the area around Dunedin. The addition of data from this temporary seismic array to the permanent GeoNet stations enhanced the earthquake detection sensitivity in the general area by lowering the detection threshold to include earthquakes too small to be detected by the GeoNet network alone. The enhanced catalogue was developed by applying a matched-filter technique to a newly detected offshore event to the south of Dunedin, and then using the event template to identify microseismicity during the array deployment. Significant microseismicity was observed near the northern extent of the Akatore Fault, and also close to the Green Island Fault. Tremor was not detected at all in the array data, which would have demonstrated active deformation at depth. However, the microseismicity being located at the north end of the Akatore Fault is consistent with the fault having produced multiple ruptures in the late Holocene. Our study shows the need for a permanent seismic array in and around the city for the monitoring of microseismicity on the Akatore Fault and other local faults.
Acknowledgments
The authors thank Calum Chamberlain for discussions surrounding the use of EQcorrscan for this analysis, and GNS Science is acknowledged for access to SeisComp3, and office space in their Dunedin campus. Finally, University of Otago is acknowledged for supporting Erin Todd’s postdoctoral scholarship over the duration of this study.
Disclosure statement
No potential conflict of interest was reported by the authors.
References
- Adams RD, Kean RJ. 1974. The Dunedin earthquake, 9 April 1974 part 1: Seismological studies. Bull N Z Natl Soc Earthq Eng. 7(3):115–122.
- Baratin L-M, Chamberlain CJ, Townend J, Savage MK. 2018. Focal mechanisms and inter-event times of low-frequency earthquakes reveal quasi-continuous deformation and triggered slow slip on the deep Alpine Fault. Earth Planet Sci Lett. 484:111–123. doi:10.1016/j.epsl.2017.12.021.
- Beavan J, Fielding E, Motagh M, Samsonov S, Donnelly N. 2011. Fault location and slip distribution of the 22 February 2011 Mw 6.2 Christchurch, New Zealand, earthquake from geodetic data. Seismol Res Lett. 82(6):789–799. doi:10.1785/gssrl.82.6.789.
- Bishop DG. 1974. The Dunedin earthquake, 9 April 1974 part 2: local effects. Bull N Z Natl Soc Earthq Eng. 7(3):123–129.
- Bishop DG, Turnbull IM. 1996. Geology of the Dunedin area. Institute of Geological and Nuclear Sciences 1:250000 Geological Map 21, Map (1 sheet) and book (52pp.), Institute of Geological and Nuclear Sciences Ltd., Lower Hutt, Map (1 sheet) and book (52pp.), 1:250,000.
- Boese CM, Stern TA, Townend J, Bourguignon S, Sheehan A, Smith EGC. 2013. Sub-crustal earthquakes within the Australia–Pacific plate boundary zone beneath the Southern Alps, New Zealand. Earth Planet Sci Lett. 376(Supplement C):212–219. doi:10.1016/j.epsl.2013.06.030.
- Boese CM, Townend J, Smith E, Stern T. 2012. Microseismicity and stress in the vicinity of the Alpine Fault, central Southern Alps, New Zealand. J Geophys Res Solid Earth. 117(2). doi: 10.1029/2011JB008460
- Bradley BA, Cubrinovski M. 2011. Near-source strong ground motions observed in the 22 February 2011 Christchurch earthquake. Seismol Res Lett. 82(6):853–865. doi:10.1785/gssrl.82.6.853.
- Bratt SR, Bache TC. 1988. Locating events with a sparse network of regional arrays. Bull Seismol Soc Am. 78(2):780–798.
- Chamberlain CJ, Hopp CJ, Boese CM, Warren-Smith E, Chambers D, Chu SX, Michailos K, Townend J. 2018. EQcorrscan: repeating and near-repeating earthquake detection and analysis in python. Seismol Res Lett. 89(1):173–181. doi:10.1785/0220170151.
- Chamberlain CJ, Shelly DR, Townend J, Stern TA. 2014. Low-frequency earthquakes reveal punctuated slow slip on the deep extent of the Alpine Fault, New Zealand. Geochem Geophys Geosystems. 15(7):2984–2999. doi:10.1002/2014GC005436.
- Cole GL, Dhakal RP, Turner FM. 2012. Building pounding damage observed in the 2011 Christchurch earthquake. Earthq Eng Struct Dyn. 41(5):893–913. doi:10.1002/eqe.1164.
- Denys P, Pearson C, Norris R, Denham M. 2016. A geodetic study of Otago: results of the central Otago deformation network 2004–2014. N Z J Geol Geophys. 59(1):147–156. doi:10.1080/00288306.2015.1134592.
- Eberhart-Phillips D, Reyners M, Bannister S, Chadwick M, Ellis S. 2010. Establishing a versatile 3-D seismic velocity model for New Zealand. Seismol Res Lett. 81(6):992–1000. doi:10.1785/gssrl.81.6.992.
- Eberhart-Phillips D, Reyners M, Upton P, Gubbins D. 2018. Insights into the structure and tectonic history of the southern South Island, New Zealand, from the 3-D distribution of P- and S-wave attenuation. Geophys J Int. 214(2):1479–1505. doi:10.1093/gji/ggy194.
- Fry B, Benites R, Kaiser A. 2011. The character of accelerations in the Mw 6.2 Christchurch earthquake. Seismol Res Lett. 82(6):846–852. doi:10.1785/gssrl.82.6.846.
- Fry B, Benites R, Reyners M, Holden C, Kaiser A, Bannister S, Gerstenberger M, Williams C, Ristau J, Beavan J. 2011. Strong shaking in recent New Zealand earthquakes. Eos Trans Am Geophys Union. 92(41):349–351. doi:10.1029/2011EO410001.
- Fry B, Gerstenberger MC. 2011. Large apparent stresses from the Canterbury earthquakes of 2010 and 2011. Seismol Res Lett. 82(6):833–838. doi:10.1785/gssrl.82.6.833.
- Goded T, Lewis A, Stirling M. 2018. Seismic vulnerability scenarios of unreinforced masonry churches in New Zealand. Bull Earthq Eng. 16(9):3957–3999. doi:10.1007/s10518-018-0351-7.
- Gorman AR, Hill MG, Orpin AR, Koons PO, Norris RJ, Landis CA, Allan TMH, Johnstone T, Gray FL, Wilson D, Osterberg EC. 2013. Quaternary shelf structures SE of the South Island, imaged by high-resolution seismic profiling. N Z J Geol Geophys. 56(2):68–82. doi:10.1080/00288306.2013.772906.
- Holt AA. 2017. Acoustic investigations of geologic hazards and seismic processing off the Coast of Otago, New Zealand [thesis]. University of Otago.
- Kaiser A, Holden C, Beavan J, Beetham D, Benites R, Celentano A, Collett D, Cousins J, Cubrinovski M, Dellow G, et al. 2012. The Mw 6.2 Christchurch earthquake of February 2011: preliminary report. N Z J Geol Geophys. 55(1):67–90. doi:10.1080/00288306.2011.641182.
- Kim MJ, Schwartz SY, Bannister S. 2011. Non-volcanic tremor associated with the March 2010 Gisborne slow slip event at the Hikurangi subduction margin, New Zealand. Geophys Res Lett. 38(14). doi: 10.1029/2011GL048400
- Litchfield NJ. 2001. The Titri fault system: quaternary-active faults near the leading edge of the Otago reverse fault province. N Z J Geol Geophys. 44(4):517–534. doi:10.1080/00288306.2001.9514953.
- Litchfield N, Craw D, Koons PO, Edge B, Perraudin E, Peake B. 2002. Geology and geochemistry of groundwater within the Taieri Basin, East Otago, New Zealand. N Z J Geol Geophys. 45(4):481–497. doi:10.1080/00288306.2002.9514987.
- Litchfield NJ, Lian OB. 2004. Luminescence age estimates of Pleistocene marine terrace and alluvial fan sediments associated with tectonic activity along coastal Otago, New Zealand. N Z J Geol Geophys. 47(1):29–37. doi:10.1080/00288306.2004.9515035.
- Litchfield NJ, Norris RJ. 2000. Holocene motion on the Akatore Fault, south Otago coast, New Zealand. N Z J Geol Geophys. 43(3):405–418. doi:10.1080/00288306.2000.9514897.
- Michailos K, Smith EGC, Chamberlain CJ, Savage MK, Townend J. 2019. Variations in seismogenic thickness along the central alpine fault, New Zealand, revealed by a decade’s relocated microseismicity. Geochem Geophys Geosystems. 20(1):470–486. doi:10.1029/2018GC007743.
- Parvizi E, Craw D, Waters JM. 2019. Kelp DNA records late Holocene paleoseismic uplift of coastline, southeastern New Zealand. Earth Planet Sci Lett. 520:18–25. doi:10.1016/j.epsl.2019.05.034.
- Quigley M, Dissen RV, Litchfield N, Villamor P, Duffy B, Barrell D, Furlong K, Stahl T, Bilderback E, Noble D. 2012. Surface rupture during the 2010 Mw 7.1 Darfield (Canterbury) earthquake: Implications for fault rupture dynamics and seismic-hazard analysis. Geology. 40(1):55–58. doi:10.1130/G32528.1.
- Rees-Jones J, Rink WJ, Norris RJ, Litchfield NJ. 2000. Optical luminescence dating of uplifted marine terraces along the Akatore Fault near Dunedin, South Island, New Zealand. N Z J Geol Geophys. 43(3):419–424. doi:10.1080/00288306.2000.9514898.
- Reyners M, Eberhart-Phillips D, Upton P, Gubbins D. 2017. Three-dimensional imaging of impact of a large igneous province with a subduction zone. Earth Planet Sci Lett. 460:143–151. doi:10.1016/j.epsl.2016.12.025.
- Smith WD. 1976. Computer file of New Zealand earthquakes. N Z J Geol Geophys. 19(3):393–394. doi:10.1080/00288306.1976.10423570.
- Stirling M, McVerry G, Gerstenberger M, Litchfield N, Van Dissen R, Berryman K, Barnes P, Wallace L, Villamor P, Langridge R, et al. 2012. National seismic hazard model for New Zealand: 2010 update. Bull Seismol Soc Am. 102(4):1514–1542. doi:10.1785/0120110170.
- Stirling MW, Verry GHM, Berryman KR. 2002. A new seismic hazard model for New Zealand. Bull Seismol Soc Am. 92(5):1878–1903. doi:10.1785/0120010156.
- Stirling MW, Wesnousky SG, Berryman KR. 1998. Probabilistic seismic hazard analysis of New Zealand. N Z J Geol Geophys. 41(4):355–375. doi:10.1080/00288306.1998.9514816.
- Taylor-Silva BI, Stirling MW, Litchfield NJ, Griffin JD, van den Berg EJ, Wang N. 2019. Paleoseismology of the Akatore Fault, Otago, New Zealand. N Z J Geol Geophys. 1–17. doi:10.1080/00288306.2019.1645706.
- Todd EK, Schwartz SY. 2016. Tectonic tremor along the northern Hikurangi Margin, New Zealand, between 2010 and 2015. J Geophys Res Solid Earth, 2016JB013480. doi:10.1002/2016JB013480.
- Villamor P, Barrell DJA, Gorman A, Davy B, Fry B, Hreinsdottir S, Hamling I, Stirling M, Cox S, Litchfield N, et al. 2018. Unknown faults under cities. doi:10.21420/g2pw7x.
- Warren-Smith E, Lamb S, Stern TA, Smith E. 2017. Microseismicity in Southern South Island, New Zealand: implications for the mechanism of crustal deformation adjacent to a major continental transform. J Geophys Res Solid Earth. 122(11):9208–9227. doi:10.1002/2017JB014732.
- Wech AG, Boese CM, Stern TA, Townend J. 2012. Tectonic tremor and deep slow slip on the Alpine Fault. Geophys Res Lett. 39(1). doi: 10.1029/2012GL051751
- Wech AG, Creager KC. 2008. Automated detection and location of Cascadia tremor. Geophys Res Lett. 35(20):L20302. doi:10.1029/2008GL035458.