
ABSTRACT
We present the first paleoseismic investigation of the Hyde Fault, one of a series of north-east striking reverse faults within the Otago range and basin province in southern New Zealand. Surface traces of the fault and associated geomorphology were mapped using a lidar digital elevation model and field investigations. Trenches were excavated at two sites across fault scarps on alluvial fan surfaces. The trenches revealed stratigraphic evidence for four surface-rupturing earthquakes. Optically stimulated luminescence dating constrains the timing of these events to around 47.2 ka (37.5–56.7 ka at 95% confidence), 34.6 ka (24.7–46.4 ka), 23.5 ka (19.7–27.3 ka) and 10.5 ka (7.9–13.1 ka). We obtain a mean inter-event time of 12.4 kyr (2.3–23.9 kyr at 95% confidence) and the slip rate is estimated to be 0.22 mm/yr (0.15–0.3 mm/yr). We do not find evidence to suggest that earthquake recurrence on the Hyde Fault is episodic, in contrast to other well-studied faults within Otago, suggesting diverse recurrence styles may co-exist in the same fault system. This poses challenges for characterising the seismic hazard potential of faults in the region, particularly when paleoearthquake records are limited to the most recent few events.
Introduction
The Hyde Fault is one of a series of parallel north-east striking range-bounding reverse faults within a region termed the Otago range and basin province (McSaveney and Stirling Citation1992; ). These faults are thought to have been formed during Cretaceous extension, and subsequently reactivated as reverse faults in the late Cenozoic (Bishop Citation1974; Litchfield Citation2001). Contemporary geodetic measurements show that the system accommodates 2–3 mm/yr of relative plate motion east of the main plate boundary Alpine Fault (Beavan et al. Citation2016), resolved as almost pure contraction across the north-east striking faults of east Otago (Denys et al. Citation2016). Slip-rates for individual faults are generally assumed to be in the range 0.1–1 mm/yr (e.g. Stirling et al. Citation2012; Litchfield et al. Citation2014), and contemporary seismicity rates are low (Todd et al. Citation2020).
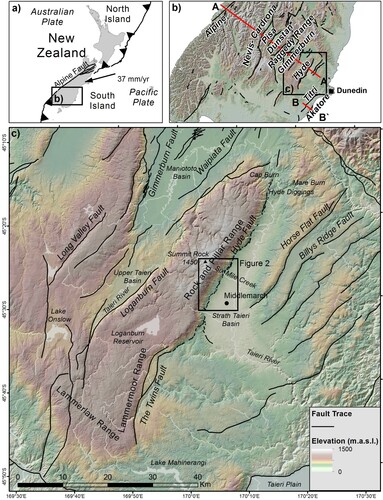
Figure 1. Locality map showing (a) location of the Otago range and basin province within New Zealand with relative plate motion vector from Bird (Citation2003); (b) topography of the Otago range and basin province showing major faults (black lines) compiled from the GNS Science Active Fault Database (Langridge et al. Citation2016), Villamor et al. (Citation2018) and the New Zealand Community Fault model (Van Dissen et al. Citation2021); (c) Land Information New Zealand (LINZ) 15 m DEM of the Hyde Fault and surrounds. Faults and folds are shown in black. Black rectangle indicates extent of . Red lines in part (b) show cross-sections in .
Of the faults within east Otago, geomorphic evidence of late Quaternary activity has been documented for the Akatore, Titri, Hyde and Horse Flat (Taieri Ridge) faults (Norris and Nicolls Citation2004). While the Akatore and Titri faults have had their late Quaternary earthquake activity characterised in previous paleoearthquake investigations (Litchfield and Norris Citation2000; Litchfield Citation2001; Barrell et al. Citation2020; Taylor-Silva et al. Citation2020), the present work is the first to address the Hyde Fault in detail. Beyond its own significance for characterising seismic hazard in east Otago, development of a paleoearthquake record for the Hyde Fault contributes to our understanding of large earthquake recurrence within the Otago range and basin province. It was hypothesised by Beanland and Berryman (Citation1989) that earthquake recurrence on individual faults is episodic, with individual fault showing long periods of quiescence (on the order of 100 kyr) separated by shorter bursts of earthquake activity over timespans on the order of 10 kyr. Episodic earthquake activity is hypothesised to be the result of strain sharing between faults within the system, which are thought to be linked at depth by either a low-angle detachment fault (Beanland and Berryman Citation1989) or a broader mid-crustal ductile shear zone (Norris Citation2004; Upton et al. Citation2009).
Several studies have identified evidence that supports the hypothesis of episodic earthquake recurrence on the basis of Quaternary geology, geomorphology and paleoseismology (Litchfield and Norris Citation2000; Litchfield Citation2001; Jackson et al. Citation2002; Norris and Nicolls Citation2004; Van Dissen et al. Citation2007; Taylor-Silva et al. Citation2020). In particular, out-of-phase activity between the neighbouring Pisa and Dunstan faults (Beanland and Berryman Citation1989; Van Dissen et al. Citation2007), and similarly, the neighbouring Titri and Akatore faults (Litchfield and Norris Citation2000; Litchfield Citation2001; Barrell et al. Citation2020; Taylor-Silva et al. Citation2020; Barrell Citation2021) supports a model of strain migration (b). Despite this evidence, it is unclear whether episodic earthquake recurrence is ubiquitous in Otago. For example, a recent paleoseismic study of the Titri Fault (b; Barrell et al. Citation2020) did not demonstrate episodic earthquake recurrence, however limitations of the record mean that the distribution of inter-event times could not be resolved.
Episodic earthquake recurrence in Otago is consistent with observations from many low activity rate faults globally (e.g. Clark et al. Citation2012), particularly for reverse faults, and is not easily explained by the standard earthquake cycle model of regular strain accumulation and release (Calais et al. Citation2016; Griffin et al. Citation2020b). Developing a better understanding of the variability of earthquake inter-event times on faults within Otago, and whether episodic recurrence is a ubiquitous feature within the system, has important implications for seismic hazard assessment (e.g. Stirling et al. Citation2012). How best to characterise the distribution of earthquake inter-event times for faults that demonstrate episodic earthquake activity is presently a major source of uncertainty for seismic hazard assessment, particularly on low activity-rate faults (Stirling et al. Citation2011; Coppersmith et al. Citation2012; Petersen et al. Citation2015; Allen et al. Citation2020; Morell et al. Citation2020; Taylor-Silva et al. Citation2020; Griffin et al. Citation2020a; Stirling et al. Citation2021).
The Hyde Fault
The Hyde Fault extends for at least 55 km along the south-eastern edge of the Rock and Pillar Range. The range is box-shaped (Jackson et al. Citation2002), and is bounded on its north-western flank by the Loganburn and Waipiata faults, which are thought to dip to the south-east (i.e. antithetically to the Hyde Fault) and presumably intersect the Hyde Fault at some depth (). The smooth summit of the Rock and Pillar Range is a remnant of the Waipounamu Erosion Surface (WES; Landis et al. Citation2008), and has been vertically offset ∼1100 m by the Hyde Fault during the late Cenozoic. This is the largest total vertical offset of the WES in eastern Otago. An apron of alluvial fans extends out from drainage systems on the south-eastern flank of the range into the Strath Taieri Basin. Where the Hyde Fault intersects the fans, faults scarps of varying heights are clearly visible in a lidar digital elevation model (DEM; ) and in the field ().
Figure 2. Hillshade relief map for the central part of the Hyde Fault () including the two trench sites. Red arrows indicate the surface trace of the fault, expressed as scarps of varying height cut across alluvial fan surfaces. Sense of slip is indicated by red letters U (up-thrown) and D (down-thrown). The high-resolution relief east of the lower part of the range is the lidar DEM, with the lower resolution relief to the west from the LINZ 15 m DEM. Rectangles show the extent of geomorphic maps at the trench sites shown in and .
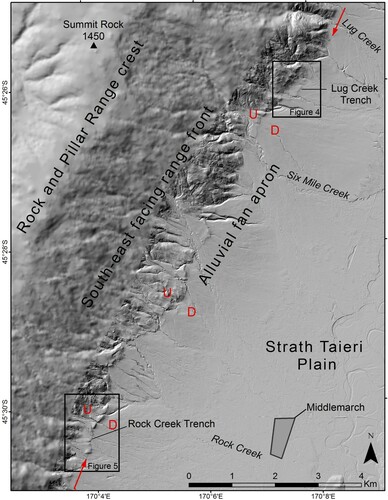
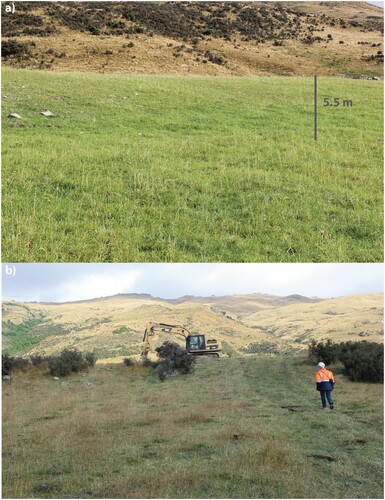
Figure 3. View upslope towards fault scarps prior to trenching at (a) Lug Creek; and (b) Rock Creek. Note presence of boulders on the fault scarp just below the digger at Rock Creek.
Previous work on the Hyde Fault mainly focused on structural and geomorphic mapping (Salton Citation1993; Norris et al. Citation1994; Norris and Nicolls Citation2004; Nicolls Citation2020). Norris and Nicolls (Citation2004) inferred that the most recent large earthquakes occurred in the early Holocene (before ∼8 ka), based on limited Optically Stimulated Luminescence (OSL) dating of alluvial fan sediments and loess; otherwise, the paleoearthquake record of the fault has not been characterised prior to the present study.
Here we present a detailed paleoseismic investigations of the Hyde Fault. A lidar DEM was used to map surface traces of the fault and associated geomorphology, complemented locally by field investigations. Trenches were excavated at two sites (Lug Creek and Rock Creek, ) where the fault has offset alluvial fan surfaces. OSL dating was used to constrain the age of stratigraphic units in the two trenches, and hence infer the timing of paleoearthquakes.
Methods
Mapping of the fault and associated geomorphology
Previous mapping of the fault trace (Forsyth Citation2001; Villamor et al. Citation2018; Barrell Citation2021) was updated using a 1 m horizontal resolution DEM constructed from a lidar dataset (with resolution of 2.68 points/m2) acquired by the Otago Regional Council in 2016 (). Using the DEM and derived products (slope and contour maps, and topographic profiles taken along fluvial gradients across the scarp), we mapped the extent of active fault scarps along the range front, and mapped and correlated alluvial fan surfaces. Fault scarps were identified in topographic profiles as breaks in slope, and distinguished from fluvial features (e.g. terrace risers) by continuity of the scarp across topographic gradients. Topographic profiles were also used to measure the vertical offset of fan surfaces in the vicinity of the trench sites. Interpretation of the lidar-based mapping was verified by field investigations at the trench sites.
Trenching
Two trenches of approximately 30 m length and 6 m width were excavated across the fault scarp to depths of ∼5 m, with a mid-level bench (McCalpin Citation2009). After the trench walls were cleaned, a 1 m string grid was applied to provide a reference frame for logging the trench and the location of the trench surveyed using a real-time kinematic global navigation satellite system (GNSS) receiver. Field-based logging and unit descriptions were supported by office-based interpretation of orthophoto mosaics of the trench walls. The string grid is the primary geometric reference for the trench logs.
In order to estimate single-event displacements, total throw of faulted units was first estimated by projecting lines parallel to the inferred depositional gradient of deposits on both the hanging wall and footwall and measuring the vertical offset across the fault. Total displacement was then calculated from the geometry of the fault dip and inferred original gradient of the faulted units. This ensured that displacement due to both faulting and folding (at least within the confines of the trench) was accounted for.
Geochronology
OSL dating was applied to samples extracted from trench wall silt and sand units to determine a chronology of the trench stratigraphy. OSL samples were collected using 30 cm long steel tubes hammered into the freshly excavated trench wall. Samples were covered and sealed with light-impenetrable material upon recovery. An absence of organic material preserved within the excavated sediments precluded the use of radiocarbon dating techniques.
OSL samples were processed at the Luminescence Dating Laboratory at Victoria University Wellington and were prepared using the fine grain (4–11 μm) technique. The luminescence age was determined by the single aliquot regenerative method (Murray and Wintle Citation2000). The blue luminescence of samples WLL1410-WLL1416 was measured during infrared stimulation. Samples WLL1390-WLL1397 had no blue luminescence during infrared stimulation, so their broadband luminescence was measured instead. The environmental dose rate depends on the dose rate conversion factors (Guérin et al. Citation2011), contents of U, Th and K measured by gamma spectrometry, water content and the a-value (the ratio of luminescence induced by alpha irradiation to that induced by beta or gamma irradiation, assumed to be 0.06 ± 0.03). The cosmic dose rate was determined by the depth of the sample below the surface, its longitude, latitude and altitude (Prescott and Hutton Citation1994).
The Lug Creek trench contained abundant silt and sand units in the footwall, which provided good material for OSL dating and a well-resolved stratigraphy. In contrast, the Rock Creek trench contained several large boulders and coarse alluvium co-located with the fault, making detailed stratigraphic interpretation and sampling more difficult. We therefore focused our dating efforts at Lug Creek (12 OSL samples dated out of 14 collected) with only two out of nine OSL samples from the Rock Creek trench dated. We used OxCal (version 4.4; Bronk Ramsey Citation2009) to model the earthquake chronology accounting for stratigraphic constraints and dating uncertainties, following the approach outlined by DuRoss et al. (Citation2011).
Fault mapping
The lidar DEM reveals the surface trace of the Hyde Fault as a discontinuous fault scarp extending for at least 55 km along the south-eastern edge of the Rock and Pillar range front (c; ; see also Data Availability Statement). Scarp heights vary from ∼2 m across young alluvial surfaces, to up to ∼30 m, including where Otago Schist bedrock has overthrust alluvial fan deposits.
Towards the southern end of the Rock and Pillar Range the Hyde Fault bifurcates (c). A minor branch of the fault continues in a southerly direction for ∼8 km, vertically offsetting the WES by up to 200 m. No scarps are observed where fan surfaces intersect the trace of the fault on this southerly branch, suggesting earthquakes have not occurred along this branch of the fault since at least the late Pleistocene. The main branch of the fault continues in a south-westerly direction vertically offsetting the WES by ∼400 m, before linking with The Twins Fault (Villamor et al. Citation2018). From here it curves around to the south bounding the east flank of the Lammermoor Range, with vertical offset of the WES becoming negligible north-west of Lake Mahinerangi (c). Scarps are not visible in elevation data outside of the area of lidar coverage, and therefore evidence of tectonic deformation in these areas is limited to offset of the WES.
To the north, the Hyde Fault continues through the Hyde Diggings (c) where schist is thrust over late Cenozoic sediments (Salton Citation1993), although no fault scarp is preserved at this location. North of the diggings, the main strand of the fault strikes in a more northerly direction, and appears to taper out at the northern extent of the Rock and Pillar Range. The fault is visible within incised schist banks of the Cap Burn; here it is expressed as a thin gouge zone with surficial travertine deposits, suggesting fault-controlled groundwater flow. North-east striking fault splays may also link the Hyde Fault with a series of small WES offsets near Mare Burn (c).
Site descriptions
Lug Creek site
The Lug Creek trench (a; ) was excavated across a fault scarp on a small alluvial fan surface just to the north of the extensive Six Mile Creek fan, which drains a large upper montane basin beneath the summit of the Rock and Pillar Range. Here the scarp sits ∼200 m out from the range front, stepping back into the range front ∼400 m to the south. Analysis of the lidar DEM at the trench site shows the fault as a 5.5 m high scarp (a; a). To the south the scarp crosses a younger alluvial terrace that has been vertically offset 2.5 m by the fault (, d), providing evidence that the fault scarp at the trench site was created by more than one earthquake. Smoothing of the scarp’s morphology was indicative of post-faulting silt infill on the footwall. Springs observed ∼300 m to the north of the trench site along-strike of the fault suggest that the fault provides controls on local groundwater flows.
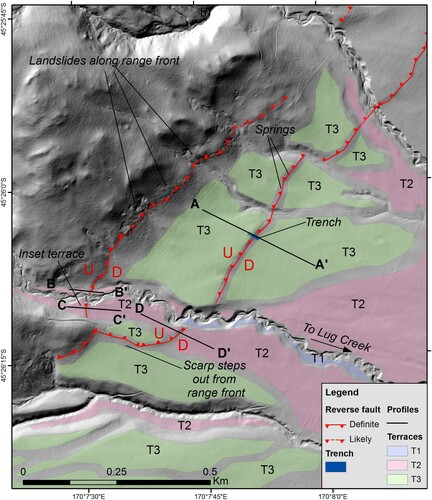
Figure 4. Geomorphic map of the Lug Creek site overlying hill shaded lidar DEM. Topographic profiles are shown in . Alluvial fan terrace numbering system (T1-T3) is specific to this study site and not the same as the numbering system used for the Rock Creek site (). Figure location is shown in .
Rock Creek site
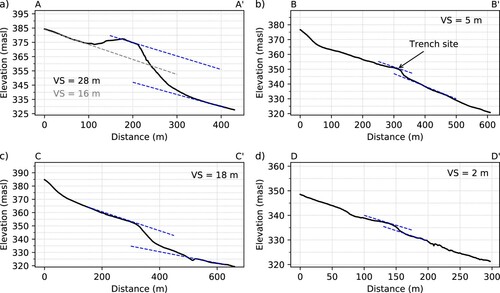
The Rock Creek trench (b; ) was located on a 5 m high scarp (b) crossing an interfluve. Scarps of varying heights are present in both directions along the strike of the fault (), including large scarps where schist basement has overthrust fan sediments with vertical offsets of up to 28 m (a). A smaller 2 m high scarp offsets a younger terrace surface to the south of the trench site (d), again providing evidence for more than one event at the trench site. At the Rock Creek site major fans are not present; instead, the site is proximal to the range front and several smaller fans have deposited very coarse alluvium, including many large boulders, indicating a higher energy depositional environment than the Lug Creek site. Again, the rounded scarp crest suggests post-faulting scarp degradation and sedimentary infilling of the footwall. A single fault trace was mapped at this site.
Figure 5. Geomorphic map of the Rock Creek site overlying hill shaded lidar DEM. Topographic profiles are shown in . Alluvial fan terrace numbering system (T1-T6) is specific to this study site and not the same as the numbering system used for the Lug Creek site (). Figure location shown in .
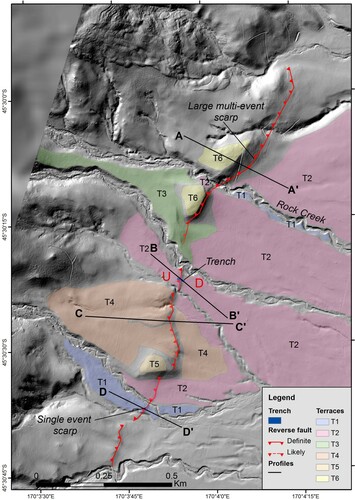
Figure 6. Elevation profiles from the Lug Creek site. Dashed blue lines show inferred pre-faulting surface profiles. Profile locations are shown in .
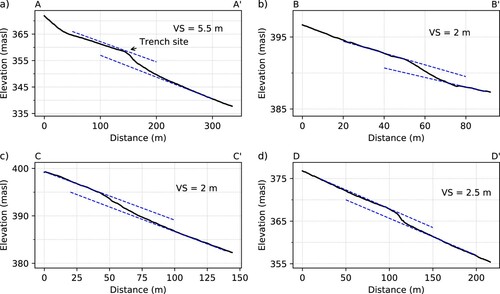
Figure 7. Elevation profiles from the Rock Creek site. Dashed blue lines show inferred pre-faulting surface profiles. Dashed grey line in (a) shows inferred surface profile where a younger surface is present upslope from the main scarp. Profile locations are shown in .
Trenching results
Lug Creek trench
The Lug Creek trench was dominated by coarse gravels in the hanging wall and in the base of the footwall. Much of the footwall was infilled by massive silt above the gravels. Trench logs are shown for the north wall () and south wall (). Accompanying orthophotos are also provided (see Data Availability Statement). Single event displacements are given in and unit descriptions in .
Figure 8. Trench log for the north wall of the Lug Creek trench. OSL samples are indicated by black (dated) and grey (not dated) dots.
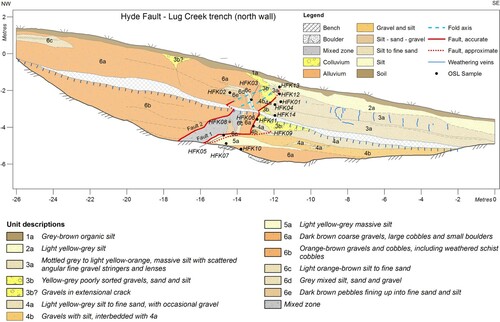
Figure 9. Trench log for the south wall of the Lug Creek trench.
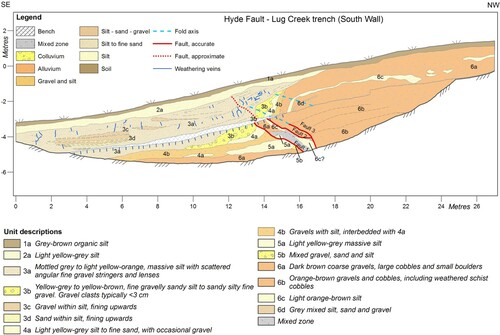
Table 1. Measured total throw and slip along the fault plane for each event based on offset of relevant faulted units. Single event displacements are calculated from the measured throw considering the geometry of the trench (i.e. fault dip and inferred original pre-faulting depositional gradient). Measured slip along the fault plane is less than total displacement due to folding accommodating a significant component of displacement.
Table 2. Unit descriptions for the Lug Creek trench.
Stratigraphy and paleoenvironments
The base of the hanging-wall exposure in the trench consists of a series of coarse gravels interpreted as alluvial fan deposits (unit 6b; and ). The upper hanging-wall exposure is also predominantly coarse alluvial fan material (unit 6a), however, it also contains occasional finer grained packages (units 6c, 6d and 6e). The lowest fan unit within unit 6, in the base of the hanging wall, contains highly weathered, friable schist boulders suggesting a significant period of surface exposure and weathering of the fan deposit prior to deposition of the remainder of unit 6. The base of the footwall exposure consists of coarse alluvial fan gravels, with some boulders in the base of the trench. These are equivalent to unit 6a in the hanging wall. Unit 6a is interpreted as being deposited in a period of active alluvial fan formation that OSL dates () correlate with the 65 ka southern hemisphere glacial maximum (Schaefer et al. Citation2015). Deposition of silts post-65 ka (5a, 4a) above unit 6a on the footwall suggests that faulting created accommodation space for fine sediment deposition within the lee of a scarp. There was no further significant alluvial fan deposition after deposition of unit 6, although unit 4b is interpreted to be fluvially reworked silt and gravel colluvium. Reduced activity of the fan may be due to changes in climatic conditions favouring stream incision rather than fan aggradation after the 65 ka southern hemisphere glacial maximum. Alternatively, fan abandonment may simply be because of local changes in the locus of deposition due to faulting and/or fan aggradation.
Table 3. Optically stimulated luminescence (OSL) data and ages from the Lug Creek (field code prefix HFK) and Rock Creek (field code prefix HFB) trenches, with raw ages and modelled ages obtained by stratigraphic constraints using OxCal. Uncertainties are reported at one standard deviation.
Within the footwall silt deposits (units 5a, 4a and 3a), grain size is finer (mostly massive silts) on the north wall compared with the south wall, which contains numerous small sand and gravel lenses (units 3c and 3d within unit 3a). Bedding on the south wall of the footwall suggests paleostream flow sub-parallel to the scarp. An undeformed upper massive silt layer (unit 2a) has a distinct columnar structure and is lighter in colour than the silts below. This is interpreted as being a loess deposit, with an OSL age of 8.3 ± 0.7 ka. An equivalent OSL age of 8.4 ± 0.8 ka was previously obtained from undeformed loess at House Creek (Norris and Nicolls Citation2004), 7 km to the north of the Lug Creek trench, suggesting the loess may be a locally extensive marker unit within the Strath Taieri Basin that post-dates the most recent tectonic deformation. Above the loess layer is modern soil.
The fault consists of a primary lower fault plane along which most of the slip has occurred. The average dip of the fault plane over the trench exposure is 31°, with large local departures from this value. In the lower part of the trench a tectonically mixed zone of sheared alluvium overlies the main fault plane, with secondary fault planes separating the mixed zone from overlying strata. On the north wall, a single secondary upper fault plane terminates in a tight fold axis, with other minor folds also evident in the hanging wall. On the south wall, two secondary fault planes transition to folds in the upper hanging wall. These secondary fault planes are interpreted as primarily shear planes, with only a minor component of slip likely to have occurred along these planes. A significant component of tectonic deformation observed in the Lug Creek trench has occurred through folding.
The Lug Creek trench shows stratigraphic evidence for four paleoearthquakes, presented below.
Event D (earliest event)
Evidence for Event D is given by the massive silt (unit 5a) near the base of the footwall that has no equivalent on the hanging wall (b). We interpret that a combination of faulting and folding uplifted units 6a and 6b on the hanging wall, followed by deposition of the unit 5a silts in the lee of the scarp. On the south wall, a small wedge of gravels (unit 5b) is interpreted as a colluvial wedge associated with this event. This unit is not preserved on the north wall, where it is assumed to have been incorporated into the tectonically mixed zone between the main lower fault plane and the secondary shear planes. No further deposition occurs on the hanging wall upslope from the fault following Event D. Single event displacement cannot be estimated for this event, as most of the slip occurred beneath the base of the trench.
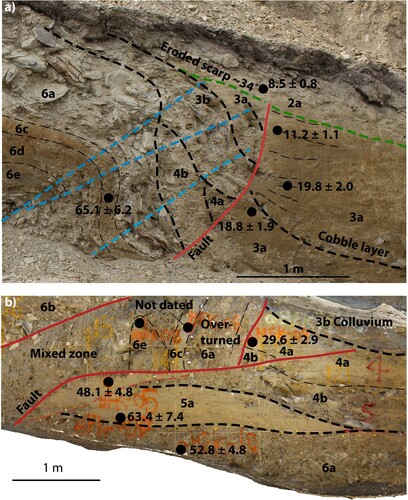
Figure 10. (a) Interpretation of the upper limit of faulting on the north wall of the Lug Creek trench, showing undeformed silt layer (2a) uniformly overlying both the footwall and eroded hanging wall, and onlapping colluvium on the hanging wall; (b) interpretation of deformation on the lower north wall of the Lug Creek trench. Units 4a and 4b sit stratigraphically above unit 5a, but also onlap unit 6a in the now over-turned fault tip, providing evidence for an earthquake between deposition of unit 5a and deposition of unit 4b. Red lines shows the fault, blue dashed lines show fold axes, black dashed lines show stratigraphic boundaries and green dashed line show unconformity prior to deposition of post-faulting loess unit 2a. Black dots show OSL sample locations with ages in thousands of years before present.
Event C
Evidence for Event C is provided by units 4b (gravels interbedded with silt) and 4a (massive silt). These two units were deposited above unit 5a on the footwall, and also onlap the thrust tip of unit 6a (; b). Therefore unit 6a must have been thrust over unit 5a in an event after Event D and before deposition of unit 4b. Unit 4b is not strictly a colluvial wedge, as bedding follows a fluvial gradient and gravels are interbedded with silts. However, the poorly sorted and interbedded mix of silt and gravel within this unit suggests that this material has been locally eroded from the hanging wall. We interpret that the gravels were derived from unit 6a, with a minor silt component derived from 5a as the thrust tip has propagated through this unit. Unit 4b tapers out above where it onlaps unit 6a above the fault on the hanging wall, providing further evidence for deposition after a faulting event has elevated unit 6a. A single-event displacement of >1.3 m is estimated ().
Event B (penultimate event)
The penultimate event is indicated by low-angle propagation of the thrust tip through footwall silts and gravels of units 4a and 4b (; ). Associated folding and uplift of units 6a on the hanging wall has resulted in scarp collapse and deposition of a coarse colluvial wedge (3b, predominantly derived from unit 6a) on top of unit 4a. An extensional crack within unit 6a on the hanging wall of the north wall is infilled with colluvium. While we log this as unit 3b and interpret it to have occurred following Event B due to extension caused by forward propagation of the fault tip, it could plausibly have happened following any of the events recorded in this trench. A single event displacement of ∼2.6 m is estimated for this event ().
Event A (most recent event)
Primary evidence for Event A is provided by faulting and folding of the colluvial wedge (unit 3b) formed following Event B. As with previous events, a significant component of the deformation associated with Event A occurred as folding, during which the fault tip from earlier events (unit 6a) was completely overturned. Determining the uppermost extent of deformation caused by event A is difficult as the upper deformation zone and overlying sediments are dominated by massive silts (unit 3a), with only occasional gravels and sand stringers present to provide constraints on bedding orientation and deformation (a; ).
On the footwall a single cobble layer within the lower part of unit 3a has been up-warped by fault-drag, showing the same deformation as the underlying silt (lower 3a) and upper surface of the Event B colluvium (unit 3b; a). This layer provides a clear minimum upper deformation limit. However, other evidence shows that the fault has propagated further up through the massive silts (unit 3a), although it is not clearly visible due to a lack of visible bedding. The upper boundary of the colluvial wedge (unit 3b) has been folded, based on the alignment of deformation with the projection of fold axes observed more clearly in bedded alluvial units directly below (a). This indicates that the pre-faulting ground surface extended above unit 3b. Furthermore, an interpretation of a lower deformation limit would require the preservation of a steep free face (∼60°) in the gravel-dominated unit 3b, well beyond the ∼34° angle of repose. Based on this evidence, we conclude that the upper limit of deformation in the trench is just below the onlapping, clearly undeformed, silt unit 2a.
Figure 11. Detail of upper part of the south wall of the Lug Creek Trench. Black dashed lines show bedding and red dashed line shows the inferred fault. Solid blue lines show weathering features interpreted as biotubules, which provide evidence of tectonic tilting. Upper deformation limit (pre-faulting ground surface) is approximate.
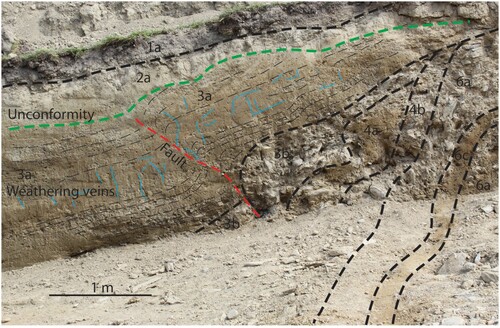
Further evidence for our interpretation is provided on the south wall (; ). Here, gravel stringers within the upper silt layers (unit 3a) follow the slope of the present ground surface near the fault, flattening to horizontal at a distance of ∼10 m from the fault on the footwall. While the sloping gravel stringers are consistent with pre-seismic deposition and subsequent tectonic deformation through faulting and/or monoclinal folding, they could also be interpreted as post-Event A slope-wash deposits following the slope of the scarp. However, tectonic deformation is also evidenced by linear blue-grey weathering features that may be interpreted as biotubules (i.e. weathering zones around roots) or weathering cracks due to desiccation of silty soils. Similar sub-vertical weathering cracks are visible in the present soil. Near to the fault, linear weathering features are tilted towards the footwall (dipping at angles of up to ∼60° to the north-west), intersecting the sloping gravel stringers perpendicularly. Furthermore, the silt-dominated layer containing the linear weathering features is offset across the up-dip projection of the observed fault, as are gravel stringers above and below this layer (). This allows us to infer an up-dip extension of the fault and constrain the up-dip limit of tectonic deformation to below the undeformed silt unit 2a ().
An alternative interpretation is that two deformation events are recorded in the upper fault zone. The cobble layer within unit 3a on the north wall could be interpreted as minor colluvial material derived from the hanging wall and deposited onto the ground surface after an event, and then subsequently faulted by the most recent event (MRE). However, differences in faulted offset between this cobble layer and the unit 3b colluvial wedge are within measurement uncertainty, implying that for this interpretation to be correct the MRE must have only involved 20–30 cm of slip. We therefore consider this interpretation unlikely, and attribute deposition of the cobble layer to a climactic, rather than tectonic, event.
A single event displacement of ∼2.0 m is estimated for Event A (). Displacement is predominantly due to folding, with only 0.7 m of slip measured along the fault plane.
Rock Creek trench
The stratigraphy of the Rock Creek trench reveals a higher energy depositional environment compared with Lug Creek, containing coarse alluvium and some large (2–3 m diameter) boulders. Some of the boulders are co-located with the fault, creating some difficulties in interpreting near-fault stratigraphy. Trench logs are provided for the north wall () and south wall (). Accompanying orthophotos are also provided (see Data Availability Statement). Single event displacements and unit descriptions are given in and , respectively.
Figure 12. Trench log for the north wall of the Rock Creek trench. OSL samples are indicated by black (dated) and grey (not dated) dots.
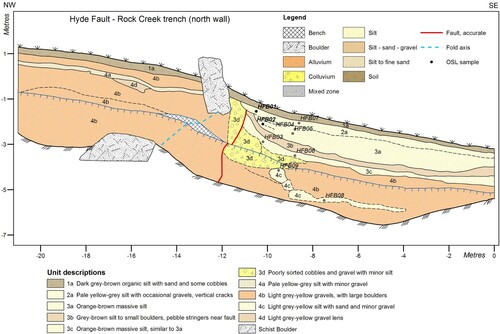
Figure 13. Trench log for the south wall of the Rock Creek trench.
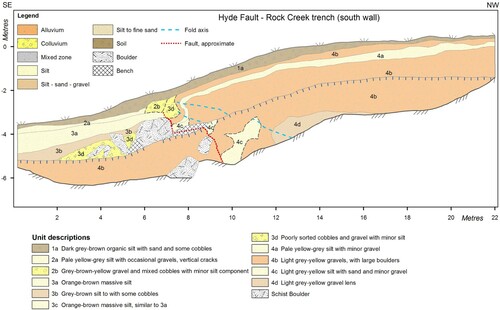
Table 4. Unit descriptions for the Rock Creek trench.
Stratigraphy and paleoenvironments
Basal units at Rock Creek are predominantly coarse alluvial fan deposits, including many large cobbles to boulders (units 4b), with occasional inter-bedded mixed silt-sand-gravel units (units 4a, 4c and 4d). Unit 4 is interpreted as a high-energy depositional environment, with boulders impacting local stream energy, which has resulted in deposition of silt, sand and gravel immediately upstream of large boulders (units 4a, 4c and 4d). The footwall has been infilled predominantly by massive silt to fine sands (units 3a, 3c and 2a). A 20–30 cm thick cobble layer (unit 3b) separates units 3a and 3c, which are otherwise lithological similar.
One clear fault plane is evident within the Rock Creek trench. The average dip of the fault is ∼50°, although it varies widely within the trench.
Event B (penultimate event)
Event B in the Rock Creek trench is indicated by a coarse colluvial wedge (3d) located below the large boulder in the north wall. Textural differences (lack of silt matrix) were observed in this unit compared with the other alluvial fan units (supported by silt matrix), particularly evident following preferential drying out of the colluvial unit following trench excavation. This unit is interpreted to have been formed by scarp collapse of up-thrown gravels (unit 4b) following Event B. A single event displacement of 2.5–3.4 m is determined for this event () ( and ).
Event A (most recent event)
Event A in the Rock Creek trench is clearly evidenced by faulting of the colluvial wedge associated with the penultimate event (unit 3d), and associated uplift of large boulders on the hanging-wall (). A layer of cobbles (unit 3b) within silts (units 3a and 3c) on the footwall that has been upwarped by the fault to the surface provides a minimum constraint on the extent of the pre-Event A footwall ground surface. As with the Lug Creek trench, overlying footwall sediments are predominantly massive silts with limited constraints on bedding orientation, and hence limited constraints on the upper deformation limit. Silts and cobbles overlying the colluvial wedge (units 3a and 3b, preserved only on the footwall) must have been up-thrown above the present-day ground surface during Event A, and then subsequently removed from the hanging wall by erosion. On the north wall, no colluvial wedge associated with event A can be identified; this may be because up-thrown silts were removed by post-faulting erosion and subsequently deposited in the footwall. Large-scale scarp collapse did not occur, possibly due to the large boulder collocated with the fault here. On the south wall, there is evidence for a coarse colluvial wedge (unit 2b), indicating some scarp collapse. Stratigraphic relationships between unit 2b and footwall silts (units 2a and 3a) are again difficult to establish; although unit 2b colluvium clearly overlies some footwall silts, lack of defined bedding structures within the silts makes it difficult to determine the pre-faulting ground surface away from the fault scarp. Up-thrown silt packages were presumably rapidly eroded off the scarp and deposited in the footwall following faulting, smoothing over the scarp to form the present-day topography.
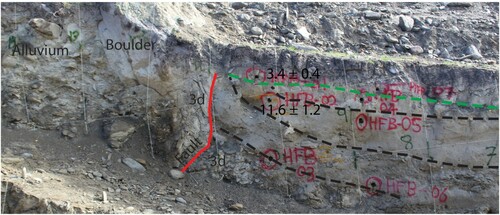
Figure 14. Detail of upper part of the north wall of the Rock Creek Trench. Black dashed lines show bedding and green dashed lines shows unconformity related to the MRE. Black dots show OSL sample locations with ages in thousands of years before present.
As with the Lug Creek trench, the folded cobble layer (unit 3b) could be interpreted as an additional event between events B and A. However, as we cannot measure a significant difference in offset between this layer and the underlying colluvium (3d) we attribute this cobble layer to a climatic rather than tectonic event that affected both sites. A single event displacement of ∼2.2 m is determined for Event A at Rock Creek, expressed through both folding and ∼1.8 m of slip on the fault plane ().
Earthquake chronology
The Lug Creek trench revealed evidence of four earthquakes, while the Rock Creek trench demonstrated evidence for only two events. A schematic retro-deformation model of the Lug Creek trench is shown in . We use this interpretation to constrain the stratigraphic order of OSL samples in our OxCal model, which is based on only the Lug Creek data (; see also Data Availability Statement).
Figure 15. Schematic retro-deformation model of evolution of the north wall of the Lug Creek trench showing (a) period of active fan deposition prior to ∼60 ka; (b) Event D faults and folds alluvial fan sediments, and a small colluvial wedge is deposited followed by silt infill of the footwall; (c) in Event C the fault tip is thrust on top of footwall silts, followed by deposition of mixed gravels and silts interpreted as reworking of up-thrown sediments; (d) in Event B the fault tip is shunted forward along a low-angle thrust tip, faulting units 4a and 4b, and additional folding uplifts the hanging wall which becomes unstable and collapses resulting in deposition of a colluvial wedge (unit 3b); (e) Event A sees further folding and propagation of the fault tip at a steep angle to ground surface; (f) at present, silts on the unstable scarp have been eroded onto the footwall, followed by deposition of loess and subsequent formation of modern soil.
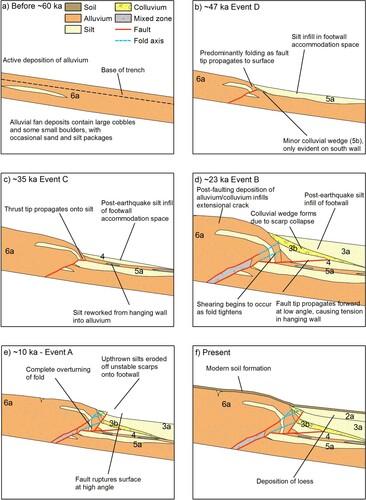
Figure 16. OxCal model for the Lug Creek trench showing probability distributions for original OSL ages (light grey) and posterior OSL ages considering trench stratigraphy (dark grey); posterior ages for events A, B, C and D are also shown in dark grey. Unit code from which the sample was taken is given in parentheses after sample code. Horizontal brackets contain 95.4% of the posterior distribution.
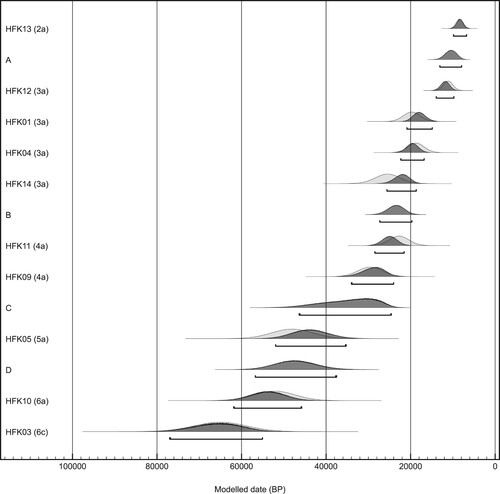
Constraints on the timing of Event D are given by OSL ages at the base of unit 5a (HFK07; 63.4 ± 7.4 ka), at the top of unit 6a beneath 5a on the footwall (HFK10; 52.2 ± 4.8 ka) and within the uplifted sandy silt unit 6c on the hanging wall (HFK03; 65.1 ± 6.2 ka). The mean age of HFK07 is out of stratigraphic order, and the agreement index in our OxCal model (the likelihood of observing the data assuming the model is correct) is less than the standard threshold value of 60% (Bronk Ramsey Citation2009). We interpret the anomalously old age of this sample to be due to incomplete bleaching of silt that has been reworked from the hanging wall to the footwall immediately after event D, resulting in equivalent ages for HFK07 (unit 6c) and HFK10 (unit 5a). Therefore we exclude sample HFK07 from our final OxCal model, instead using sample HFK05 (48.11 ± 4.8 ka) at the top of unit 5a as the first post-event date. This yields a timing of 47.2 ka (37.5–56.7 ka at 95% confidence) for Event D in our OxCal model.
An alternative interpretation, in which the date for HFK10 (52.2 ± 4.8 ka) is considered erroneous, would suggest that units 6c (HFK03; 65.1 ± 6.2 ka) and 5a (HFK07; 63.4 ± 7.4 ka) are equivalent based on the similarity in their OSL ages. This would imply equivalency between the upper part of unit 6a on the hanging wall, and unit 4b on the footwall, and furthermore, require one less faulting event. We exclude this possibility based on differences in the lithology, along with stratigraphic and faulting relationships. In particular, unit 6c contains fine sand and fining upwards sequences suggesting deposition within an active stream; in contrast, unit 5a is a massive silt suggesting deposition in the lee of the fault scarp, as is also interpreted for units 4a and 3a. Furthermore, the upper part of unit 6a on the hanging wall contains some small boulders, which we consider equivalent to those found in the base of the trench on the footwall (), in contrast to the smaller clasts in unit 4b. In addition to the lithological differences, evidence from the south wall shows that unit 6c has been offset significantly further than unit 5a ().
The timing of Event C is constrained by a pre-event OSL date at the top of unit 5a (HFK05; 48.1 ± 4.8 ka) and post-event date at the base of unit 4a (HFK09; 29.6 ± 2.9 ka), yielding a modelled event age of 34.6 ka (24.7–46.4 ka at 95% confidence).
The timing of Event B is constrained by OSL dates directly below (HFK11; 22.8 ± 2.3 ka) and above (HFK14; 25.5 ± 2.9 ka) the colluvial wedge (unit 3b) in the Lug Creek trench, yielding an event timing of 23.5 ka (19.7–27.3 ka at 95% confidence) in our OxCal model. Both trenches show vertical accumulation of ∼1.5 m of silt above the colluvial wedge associated with Event B prior to Event A, and both contain layers of cobbles within this layer. Based on this stratigraphic correlation, we interpret the penultimate event in both trenches to be the same event.
The timing of Event A is constrained well by OSL dates within unit 3a immediately below unit 2a (HFK12; 11.2 ± 1.1 ka), and within unit 2a (HFK13; 8.5 ± 0.8 ka), yielding a date for Event A of 10.5 ka (7.9–13.1 ka at 95% confidence) in our OxCal model. Two OSL samples taken from the north wall of the Rock Creek trench were dated, giving ages of 11.6 ± 1.2 ka (pre-Event A) and 3.4 ± 0.4 ka (post-Event A). These two ages bracket the ∼10 ka age of Event A from the Lug Creek Trench, and therefore we interpret Event A in the Rock Creek trench to be the same event as Event A in the Lug Creek trench. This interpretation is further supported by the stratigraphic correlation of footwall silt and cobble units described above.
As discussed above, we attribute the deposition of a cobble layer within footwall silts (unit 3a in both trenches) to a climatic, rather than tectonic, event. OSL dates below (HFK04; 18.8 ± 1.9 ka) and above (HFK01; 19.8 ± 2.0 ka) this cobble layer in the Lug Creek trench constrain the timing of deposition of this unit to around the time of the last glacial maximum at 19.5 ± 1.6 ka.
Possibility of additional events
An important question relevant to this study (and all paleoseismic studies) is the possibility that the trenches have not recorded all of the most recent surface rupturing earthquakes on the Hyde Fault. The Lug Creek trench site scarp sits 200 m out from the range front on a fan surface we denote as T3 (). Approximately 400 m to the south the scarp steps back into the range front. Just north of this point, a younger inset terrace surface that we denote as T2 has been offset by a ∼2 m high scarp at the range front and a 2.5 m high scarp along the basinward trace that was trenched (; ). This means that additional deformation has been accommodated along a range front trace since deposition of T3 at the trench site. No scarp is observed along strike of the range front trace directly upslope of the Lug Creek trench site, but it could easily have been obscured by the plentiful mass movement observed there. Smaller single-event displacements in the Lug Creek trench compared with the Rock Creek trench () suggest that additional slip may have occurred on a range front trace during the events observed in the Lug Creek trench. It is therefore also possible that there have been additional events to those constrained at the Lug Creek trench site that were restricted to a now-hidden range front trace.
Single event displacements, slip rates and earthquake magnitudes
Single event displacements () were estimated using the vertical offset of faulted units, and the geometry of the fault dip and pre-faulting depositional gradient of the unit. Single event displacements are subject to considerable uncertainty, particularly due to the large component of off-fault folding. While we account for this by taking vertical offset measurements away from the fault zone, the possibility of additional folding beyond the trench means our estimates are likely minimums.
We use the total observed stratigraphic displacement in the trenches, which is better constrained than fault displacements for individual earthquakes, to estimate the slip rate. Slip rate estimates are made for the Lug Creek site, beneath the range summit; lower slip-rates may be expected at Rock Creek, where the range crest is 140 m (13%) lower than at the summit, assuming no change in slip rate along the fault with time. A slip rate estimate of ∼0.15 mm/yr is obtained assuming the ∼9.5 m displacement observed within the Lug Creek trench is the only displacement to have occurred since ∼65 ka. However, this is likely a lower bound as displacement due to Event D is not fully resolved in the base of the trench. If we consider that the trench exposure only resolves the fault displacement since ∼55 ka (i.e, the age at the base of the footwall exposure), a slip rate of ∼0.17 mm/yr is obtained. Furthermore, if we include the additional 2 m vertical offset of terrace T2 near the range front ∼200 m south of the trench site (; b,c), and assume that the fault dip is around 45° at the range front, we estimate the slip-rate to be ∼0.22 mm/yr. Given these uncertainties, and that it is likely that we do not fully resolve the total displacement, we broadly estimate slip rates to be in the range of 0.15–0.3 mm/yr, with a preferred estimate of ∼0.22 mm/yr.
Assuming a full-length rupture of the main, 55 km long section of the Hyde Fault, we use scaling relations (Thingbaijam et al. Citation2017) to estimate a moment magnitude Mw 7.2 (7.0–7.5 at 95% confidence). Extension of the rupture into The Twins Fault to the south could give a rupture length as long as 80 km, with associated Mw 7.5 (7.2–7.8 at 95% confidence).
Discussion
The paleoearthquake chronology from the Lug Creek trench defines closed inter-event times of 12.7 kyr (0.0–25.0 kyr at 95% confidence), 11.1 kyr (0.0–22.9 kyr), 13.0 kyr (8.2–17.7 kyr), and a present open interval of >10.5 kyr (>7.9 kyr at 95% confidence). Because dating uncertainties of some of the events overlap, these inter-event times are not independent of each other (e.g. if the first one is at the upper end of its range, the length of the next inter-event time will be limited). In order to better constrain the inter-event time distribution, we take 10,000 Monte Carlo samples from the probability distributions of the event timings to construct possible earthquake chronologies, with the samples constrained such that events remain in stratigraphic order (Biasi et al. Citation2002). From these samples, we obtain a mean inter-event time of 12.4 kyr (2.3–23.9 kyr at 95% confidence).
Although there are uncertainties in our chronology, the observation of four events spread across the past ∼65 kyr allows us to reject a strict interpretation of the Beanland and Berryman (Citation1989) hypothesis of episodic earthquake recurrence. Specifically, they postulated that active periods last on the order of 10 kyr, separated by quiescent periods on the order of 100 kyr. This hypothesis was based on out-of-phase activity on the neighbouring Pisa and Dunstan faults inferred from estimated ages of faulted and unfaulted alluvial fans and glacial outwash terraces. While subsequent paleoseismic studies of the Dunstan Fault have supported this hypothesis (Van Dissen et al. Citation2007; ), the age of faulting on the Pisa Fault has not been constrained with modern dating techniques. In contrast, the Hyde Fault appears to have continued to be active for at least the past ∼65 kyr, generating earthquakes roughly every 12 kyr. Ongoing activity prior to this is further suggested by the presence of several larger scarps (10–30 m in height) at the Rock Creek site ( and ). While event age uncertainties allow for variability in earthquake inter-event times, we find no evidence to suggest that the Hyde Fault has long periods of quiescence (∼100 kyr) as implied by the hypothesis of episodic earthquake recurrence.
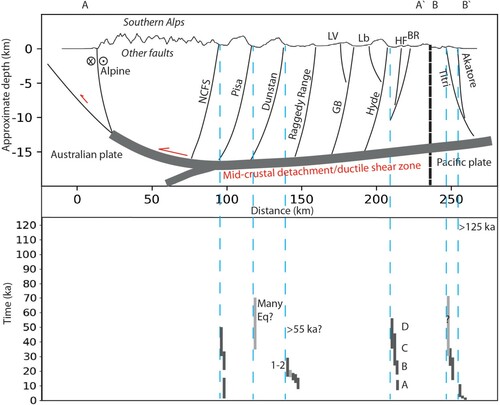
Figure 17. Time-space diagram of paleoearthquake records from the Otago range and basin province. Top panel shows topography (with 5 times vertical exaggeration) and schematic cross-section adapted from Beanland and Berryman (Citation1989) and Warren-Smith et al. (Citation2016); reverse faults in Otago are linked to either a mid-crustal detachment fault or, in an alternative hypothesis, a broader ductile shear zone. Cross-section locations are shown in b. Bottom part shows paleoearthquake records for the Dunstan, Akatore, Titri and Hyde faults compiled from Van Dissen et al. (Citation2007), Taylor-Silva et al. (Citation2020), Barrell et al. (Citation2020) and the present study (with events labelled), along with unpublished data for the North-West Cardrona Fault (van den Berg Citation2020), part of the Nevis-Cardrona Fault System (NCFS). Vertical bars represent 95% confidence limits on the timing of individual paleoearthquakes, except where a range of possible number of events is given. Dark grey bars indicate that good evidence for the paleoearthquake has been identified, while light grey indicates possible events. Inferred period of earthquake activity for the Pisa Fault is also shown by light grey bar (Beanland and Berryman Citation1989). Where evidence for quiescent periods has been identified, the estimated timing of the end of the previous active period is given. LV – Long Valley; GB – Gimmerburn; Lb – Loganburn; HF – Horse Flat; BR – Billys Ridge.
Episodic earthquake recurrence in Otago has been postulated as being due to stress transfer along a hypothesised low-angle basal detachment fault, into which the north-east striking faults are suggested to sole at depth (Beanland and Berryman Citation1989). This implies that only one, or a few, faults will be generating earthquakes at any given point in time. Possible out-of-phase earthquake occurrence seen in paleoseismic studies of the neighbouring Akatore and Titri faults (Litchfield and Norris Citation2000; Litchfield Citation2001; Barrell et al. Citation2020; Taylor-Silva et al. Citation2020; Barrell Citation2021) supports this hypothesis, at least between faults that are close together. In contrast, paleoearthquake ages from the Hyde Fault are not obviously in or out of phase with paleoearthquake ages from previously studied faults within the region (). The two most recent earthquakes on the Hyde Fault occurred near the beginning and end of the most recent active phase of activity on the Dunstan Fault (from 24.3 ± 3.9 ka to 12.1 ka; Van Dissen et al. Citation2007). The timing of events D, C and B on the Hyde Fault overlap with the timing of the most recent events on the Titri Fault () while the MRE on Hyde occurred during a period of quiescence on both the Titri and Akatore faults (Barrell et al. Citation2020; Taylor-Silva et al. Citation2020).
The evidence presented here demonstrates that multiple faults within the Otago range and basin fault system may be active at the same time, as also suggested by Norris and Nicolls (Citation2004). Our results further demonstrate that episodic activity is not a ubiquitous feature of the system. Evidence of out-of-phase activity on neighbouring faults suggests that variability in earthquake activity may be driven more by local scale fault interactions than system-wide stress transfer. The faults neighbouring the Hyde Fault each have a total throw of a few hundred metres or less (c), suggesting lower activity-rates compared with the Hyde Fault. Therefore it is possible that strain accumulation on Hyde Fault is less often impacted by stress interactions from large earthquakes on those faults (e.g. King et al. Citation1994; McAuliffe et al. Citation2013), and instead accumulates in a more independent process. This contrasts with faults where evidence for episodic earthquake recurrence has been identified, including the Dunstan Fault, which is closer to the plate boundary and located near several other active faults with more than 1 km of throw (b), and the Akatore Fault, which have been suggested to link into the same structure as the Titri Fault at depth (Litchfield and Norris Citation2000).
The results presented here show that earthquake recurrence on faults within Otago is a complex process, with some faults generating earthquakes episodically and others more regularly. This raises further questions about the mechanisms of strain accumulation within the system, particularly regarding the relative influence of local stress transfer between neighbouring faults compared with system-wide stress transfer along either a low-angle basal detachment (Beanland and Berryman Citation1989), or within a broader mid-crustal ductile shear zone (Norris Citation2004; Upton et al. Citation2009). Further development of long paleoearthquake chronologies for other faults within the fault system, coupled with physics-based models (e.g. Richards-Dinger and Dieterich Citation2012) of stress interactions between faults, will be needed to resolve these questions.
The observation of diverse recurrence styles within a single fault system also raises challenges regarding how activity-rates for these faults should be parameterised in future seismic hazard assessments (e.g. Stirling et al. Citation2012). Several hazard studies have used logic trees to incorporate alternative earthquake activity-rate models for ‘active’ and ‘quiescent’ phases (Stirling et al. Citation2011; Coppersmith et al. Citation2012; Petersen et al. Citation2015; Allen et al. Citation2020). However, such approaches usually involve deterministic definition of these phases. For example, Taylor-Silva et al. (Citation2020) argued that it would be prudent for seismic hazard assessments to assume that elevated Holocene activity-rates on the Akatore Fault will likely continue into the future. Development of statistical approaches that avoid deterministic assumptions about whether a fault generates earthquakes regularly or in defined phases of activity, and if the latter, whether it is presently in an active or quiescent phase, is required for more robust assessment of the hazard posed by such faults.
Conclusions
Excavation of paleoseismic trenches across alluvial fans at two sites on the Hyde Fault has revealed stratigraphic evidence for four paleoearthquakes. OSL dating at the Lug Creek site constrains the timing of Event D to around 47.2 ka (37.5–56.7 ka at 95% confidence), Event C to around 34.6 ka (24.7–46.4 ka), Event B to around 23.5 ka (19.7–27.3 ka) and Event A (the most recent event) to around 10.5 ka (7.9–13.1 ka). We obtain a mean inter-event time of 12.4 kyr (2.3–23.9 kyr at 95% confidence). Slip rates are estimated to be 0.22 mm/yr (0.15–0.3 mm/yr), and potential maximum earthquake magnitudes in the range Mw 7.0–7.8. In contrast to other well-studied faults within Otago, we do not find evidence to suggest strongly episodic earthquake recurrence behaviour, nor any obvious relationship between earthquake timing on the Hyde Fault and other previously studied faults in Otago. The results presented here suggest that diverse styles of earthquake recurrence can coexist within a single fault system, raising further challenges for assessing the seismic hazard posed by these faults.
Acknowledgements
Funding for fieldwork and dating was provided by University of Otago Research Grant PL11303001.RFK and EQC Internal Project 18/SP767. Lidar elevation data were provided by Otago Regional Council. Nicola Litchfield is thanked for valuable assistance during initial trench excavation and Stephen Read guided the creation of the orthophotos. Dan Clark gave helpful guidance on trench interpretation and reviewed an early version of this manuscript. Thoughtful reviews by Andy Nicol and Narges Khajavi, along with comments from the associate editor Phaedra Upton, improved the quality of this manuscript. We thank the landowners for allowing us to trench the Lug Creek and Rock Creek sites, and the many other landowners who allowed access for field inspections along the fault. Jonathan Griffin publishes with the permission of the CEO, Geoscience Australia, and acknowledges support from a University of Otago Postgraduate Publishing Bursary.
Disclosure statement
No potential conflict of interest was reported by the author(s).
Data availability statement
The orthophotos of the trench walls, the digitised fault trace and the code used to generate the OxCal model used in this study are openly available in the online zenodo repository https://doi.org/10.5281/zenodo.5121047. OSL data and trench logs are provided within the main text of the paper. The lidar digital elevation model was provided by the Otago Regional Council and can be requested from them.
Additional information
Funding
References
- Allen TI, Griffin JD, Leonard M, Clark DJ, Ghasemi H. 2020. The 2018 national seismic hazard assessment of Australia: quantifying hazard changes and model uncertainties. Earthq Spectra. 36 Suppl 1:5–43.
- Barrell DJA. 2021. General distribution and characteristics of active faults and folds in the Clutha and Dunedin City districts, Otago. GNS Science Consultancy Report 2020/88, Lower Hutt, New Zealand.
- Barrell DJA, Litchfield NJ, Van Dissen RJ, Wang N, Taylor-Silva BI, Hornblow S, Stirling MW. 2020. Investigation of past earthquakes on the Titri Fault, coastal Otago, New Zealand. GNS Science Report 2017/35, Lower Hutt, New Zealand.
- Beanland S, Berryman KR. 1989. Style and episodicity of late Quaternary activity on the Pisa-Grandview Fault Zone, Central Otago, New Zealand. New Zeal J Geol Geophys. 32(4):451–461. doi:10.1080/00288306.1989.10427553.
- Beavan J, Wallace LM, Palmer N, Denys P, Ellis S, Fournier N, Hreinsdottir S, Pearson C, Denham M. 2016. New Zealand GPS velocity field: 1995–2013. New Zeal J Geol Geophys. 59(1):5–14. doi:10.1080/00288306.2015.1112817.
- Biasi GP, Weldon RJ, Fumal TE, Seitz GG. 2002. Paleoseismic event dating and the conditional probability of large earthquakes on the southern San Andreas fault, California. Bull Seismol Soc Am. 92(7):2761–2781. doi:10.1785/0120000605.
- Bird P. 2003. An updated digital model of plate boundaries. Geochem Geophys Geosys. 4(3). doi:10.1029/2001GC000252.
- Bishop DG. 1974. Stratigraphic, structural, and metamorphic relationships in the Dansey Pass area, Otago, New Zealand. New Zeal J Geol Geophys. 17(2):301–335. doi:10.1080/00288306.1974.10430396.
- Bronk Ramsey C. 2009. Bayesian analysis of radiocarbon dates. Radiocarbon. 51(1):337–360. doi:10.2458/azu_js_rc.v51i1.3494.
- Calais E, Camelbeeck T, Stein S, Liu M, Craig TJ. 2016. A new paradigm for large earthquakes in stable continental plate interiors. Geophys Res Lett. 43:10621–10637. doi:10.1002/2016GL070815.
- Clark D, McPherson A, Van Dissen R. 2012. Long-term behaviour of Australian stable continental region (SCR) faults. Tectonophysics. 566:1–30.
- Coppersmith KJ, Salomone LA, Fuller CW, Hanson KL, Hartleb RD, Lettis WR, Lindvall SC, McDuffie SM, McGuire RK, Stirewalt GL, et al. 2012. Technical Report: Central and Eastern United States Seismic Source Characterization for Nuclear Facilities. Electric Power Research Institute, US Department of Energy, US Nuclear Regulatory Commission, Palo Alto.
- Denys P, Pearson C, Norris R, Denham M. 2016. A geodetic study of Otago: results of the central Otago deformation network 2004–2014. New Zeal J Geol Geophys. 59(1):147–156. doi:10.1080/00288306.2015.1134592.
- DuRoss CB, Personius SF, Crone AJ, Olig SS, Lund WR. 2011. Integration of paleoseismic data from multiple sites to develop an objective earthquake chronology: application to the Weber segment of the Wasatch Fault Zone, Utah. Bull Seismol Soc Am. 101(6):2765–2781. doi:10.1785/0120110102.
- Forsyth PJ. 2001. Geology of the Waitaki area. Institute of Geological and Nuclear Science 1:250,000 Geological Map 19. GNS Science, Lower Hutt, New Zealand.
- Griffin JD, Allen TI, Gerstenberger MC. 2020a. Seismic hazard assessment in Australia: can structured expert elicitation achieve consensus in the ‘Land of the Fair Go’? Seismol Res Lett. 91(2A):859–873. doi:10.1785/0220190186.
- Griffin JD, Stirling MW, Wang T. 2020b. Periodicity and clustering in the long-term earthquake record. Geophys Res Lett. 47(22). doi:10.1029/2020GL089272.
- Guérin G, Mercier N, Adamiec G. 2011. Dose-rate conversion factors: update. Anc TL. 29(1):5–8.
- Jackson J, Ritz J-F, Siame L, Raisbeck G, Yiou F, Norris R, Youngson J, Bennett E. 2002. Fault growth and landscape development rates in Otago, New Zealand, using in situ cosmogenic 10Be. Earth Planet Sci Lett. 195(3–4):185–193. doi:10.1016/S0012-821X(01)00583-0.
- King GCP, Stein RS, Lin J. 1994. Static stress changes and the triggering of earthquakes. Bull Seismol Soc Am. 84(3):935–953.
- Landis CA, Campbell HJ, Begg JG, Mildenhall DC, Paterson AM, Trewick SA. 2008. The Waipounamu erosion surface: questioning the antiquity of the New Zealand land surface and terrestrial fauna and flora. Geol Mag. 145(2):173–197. doi:10.1017/S0016756807004268.
- Langridge RM, Ries WF, Litchfield NJ, Villamor P, Van Dissen RJ, Barrell DJA, Rattenbury MS, Heron DW, Haubrock S, Townsend DB, et al. 2016. The New Zealand Active Faults Database. New Zeal J Geol Geophys. 59(1):86–96. doi:10.1080/00288306.2015.1112818.
- Litchfield NJ. 2001. The Titri Fault System: Quaternary-active faults near the leading edge of the Otago reverse fault province. New Zeal J Geol Geophys. 44(4):517–534. doi:10.1080/00288306.2001.9514953.
- Litchfield NJ, Norris RJ. 2000. Holocene motion on the Akatore Fault, south Otago coast, New Zealand. New Zeal J Geol Geophys. 43(3):405–418. doi:10.1080/00288306.2000.9514897.
- Litchfield NJ, Van Dissen R, Sutherland R, Barnes PM, Cox SC, Norris R, Beavan RJ, Langridge R, Villamor P, Berryman K, et al. 2014. A model of active faulting in New Zealand. New Zeal J Geol Geophys. 57(1):32–56. doi:10.1080/00288306.2013.854256.
- McAuliffe LJ, Dolan JF, Kirby E, Rollins C, Haravitch B, Alm S, Rittenour TM. 2013. Paleoseismology of the southern Panamint Valley fault: implications for regional earthquake occurrence and seismic hazard in southern California. J Geophys Res Solid Earth. 118(9):5126–5146. doi:10.1002/jgrb.50359.
- McCalpin JP, editor. 2009. Paleoseismology. Burlington: Academic Press.
- McSaveney MJ, Stirling MW. 1992. Central Otago: basin and range country. In: Soons JM, Selby MJ, editors. Landforms of New Zealand. Auckland: Longman Paul; p. 482–504.
- Morell KD, Styron R, Stirling M, Griffin J, Archuleta R, Onur T. 2020. Seismic hazard analyses from geologic and geomorphic data: current and future challenges. Tectonics. 39(10). doi:10.1029/2018tc005365.
- Murray AS, Wintle AG. 2000. Luminescence dating of quartz using an improved single-aliquot regenerative-dose protocol. Radiat Meas. 32(1):57–73. doi:10.1016/S1350-4487(99)00253-X.
- Nicolls R. 2020. Tectonic geomorphology of the Rock and Pillar Range, and Taieri Ridge, Otago, New Zealand. Unpublished Masters Thesis, University of Otago.
- Norris RJ. 2004. Strain localisation within ductile shear zones beneath active faults: The Alpine Fault contrasted with the adjacent Otago fault system, New Zealand. Earth Planets Space. 56:1095–1101.
- Norris RJ, Koons PO, Landis CA. 1994. Seismotectonic evaluation of fault structures in east Otago. Dunedin: University of Otago. EQC Funded Report 91/53, Dunedin, New Zealand.
- Norris RJ, Nicolls R. 2004. Strain accumulation and episodicity of fault movements in Otago. University of Otago, EQC Funded Report 01/445, Dunedin, New Zealand.
- Petersen MD, Moschetti MP, Powers PM, Mueller CS, Haller KM, Frankel AD, Zeng Y, Rezaeian S, Harmsen SC, Boyd OS, et al. 2015. The 2014 United States National Seismic Hazard Model. Earthq Spectra. 31:S1–S30. doi:10.1193/120814EQS210M.
- Prescott JR, Hutton JT. 1994. Cosmic ray contributions to dose rates for luminescence and ESR dating: large depths and long-term time variations. Radiat Meas. 23(2–3):497–500. doi:10.1016/1350-4487(94)90086-8.
- Richards-Dinger K, Dieterich JH. 2012. RSQSim earthquake simulator. Seismol Res Lett. 83(6):983–990. doi:10.1785/0220120105.
- Salton GG. 1993. Mechanics of folding in central Otago: an investigation of the recent deformation of the Rock and Pillar Range. Unpublished Masters Thesis, University of Otago.
- Schaefer JM, Putnam AE, Denton GH, Kaplan MR, Birkel S, Doughty AM, Kelley S, Barrell DJA, Finkel RC, Winckler G, et al. 2015. The southern glacial maximum 65,000 years ago and its unfinished termination. Quat Sci Rev. 114:52–60. doi:10.1016/j.quascirev.2015.02.009.
- Stirling M, Litchfield N, Gerstenberger M, Clark D, Bradley B, Beavan J, McVerry G, Van Dissen R, Nicol A, Wallace L, et al. 2011. Preliminary probabilistic seismic hazard analysis of the CO2CRC Otway Project Site, Victoria, Australia. Bull Seismol Soc Am. 101(6):2726–2736. doi:10.1785/0120110049.
- Stirling M, McVerry G, Gerstenberger M, Litchfield N, Van Dissen R, Berryman K, Barnes P, Wallace L, Villamor P, Langridge R, et al. 2012. National Seismic Hazard Model for New Zealand: 2010 update. Bull Seismol Soc Am. 102(4):1514–1542. doi:10.1785/0120110170.
- Stirling MW, Abbott E, Rood DH, McVerry G, Abrahamson NA, Barrell DJA, Huso R, Litchfield NJ, Luna L, Rhoades DA, et al. 2021. First use of fragile geologic features to set the design motions for a major existing engineered structure. Bull Seismol Soc Am. 111(5):2673–2695. doi:10.1785/0120210026.
- Taylor-Silva BI, Stirling MW, Litchfield NJ, Griffin JD, van den Berg EJ, Wang N. 2020. Paleoseismology of the Akatore Fault, Otago, New Zealand. New Zeal J Geol Geophys. 63(2):151–167. doi:10.1080/00288306.2019.1645706.
- Thingbaijam KKS, Mai PM, Goda K. 2017. New empirical earthquake source-scaling laws. Bull Seismol Soc Am. 107(5):2225–2246. doi:10.1785/0120170017.
- Todd EK, Stirling MW, Fry B, Salichon J, Villamor P. 2020. Characterising microseismicity in a low seismicity region: applications of short-term broadband seismic arrays in Dunedin, New Zealand. New Zeal J Geol Geophys. 63(3):331–341. doi:10.1080/00288306.2019.1707238.
- Upton P, Koons PO, Craw D, Henderson CM, Enlow R. 2009. Along-strike differences in the Southern Alps of New Zealand: consequences of inherited variation in rheology. Tectonics. 28(2) doi:10.1029/2008TC002353.
- van den Berg EJ. 2020. Paleoseismology of the NW Cardrona Fault, Central Otago. Unpublished Masters thesis, University of Otago.
- Van Dissen R, Barrell D, Langridge R, Litchfield N, Villamor P, Tonkin P. 2007. Reassessment of seismic hazard at Clyde Dam, Central Otago: Earthquake geology field investigations and determination of Dunstan Fault rupture characteristics. GNS Science Consultancy Report 2006/147. GNS Science, Lower Hutt, New Zealand.
- Van Dissen R, Seebeck H, Litchfield N, Barnes P, Nicol A, Langridge R, Barrell DJA, Villamor P, Ellis S, Rattenbury M, et al. 2021. Development of the New Zealand Community Fault Model – version 1.0. In Proceedings of the New Zealand Society for Earthquake Engineering Annual Conference 2021; Christchurch, New Zealand.
- Villamor P, Barrell D, Gorman A, Davy B, Fry B, Hreinsdottir S, Hamling I, Stirling M, Cox S, Litchfield N, et al. 2018. Unknown faults under cities. GNS Science Miscellaneous Series 124, Lower Hutt, New Zealand.
- Warren-Smith E, Lamb S, Seward D, Smith E, Herman F, Stern T. 2016. Thermochronological evidence of a low-angle, mid-crustal detachment plane beneath the central South Island, New Zealand. Geochem Geophys Geosys. 17(10):4212–4235.