
ABSTRACT
The Kaikōura Earthquake ruptured a complex network of at least 20 faults in the northeastern South Island, with variable geometries, slip and slip rates. Ground shaking and surface fault rupture generated a tsunami, thousands of landslides, and many dammed rivers. The earthquake damaged farmland, buildings and infrastructure in the northeastern South Island and Wellington regions, closing critical transport networks for over a year. This special issue presents a collection of 12 papers on the earthquake. These papers cover a range of topics, including, the geometries and paleoearthquake histories of faults that ruptured, seismic hazards, the tsunami and coastal geomorphology, together with the societal impact and communication of the earthquake. They incorporate our understanding of the earthquake 5–6 years since it occurred. Despite an unprecedented amount of data and thousands of published papers referring to the earthquake, many key questions remain. These include: is the Hikurangi subduction interface capable of producing great earthquakes beneath the northeastern South Island? Why did the Hope Fault not accommodate significant slip in the earthquake? Has the earthquake changed the seismic hazard in central Aotearoa New Zealand? Addressing these questions will improve understanding of seismic processes and hazards helping to build resilience to future earthquakes.
Introduction
The 2016 Mw 7.8 Kaikōura Earthquake is one of more than a dozen moderate to large earthquakes (M6.5-8.2) that have impacted society in Aotearoa New Zealand since 1840 AD (Downes and Dowrick Citation2015; Nicol et al. Citation2016). Despite significant advances in our knowledge of earthquakes over the last ∼50 years, recent large-magnitude earthquakes in Aotearoa New Zealand have produced some unexpected scientific results which, in themselves, demonstrate that we still have much to learn. Maximising the value of information collected in past earthquakes is important for understanding earthquake processes, guiding recovery and improving societal resilience. This is particularly true of the 2010–2012 Canterbury and 2016 Kaikōura earthquakes which both generated global interest and produced large volumes of data and models that were unprecedented for Aotearoa New Zealand (e.g. Bannister and Gledhill Citation2012; Beavan et al. Citation2012; Elliott et al. Citation2012; Kaiser et al. Citation2017; Litchfield et al. Citation2018; Hamling Citation2020).
This special issue brings together 12 papers that contribute to knowledge of the Kaikōura Earthquake, tsunami and societal impact. These contributions were mainly written 5–6 years after the earthquake and offer a perspective informed by observations from the immediate post-earthquake period (e.g. 2016--2018) and ongoing research. The papers cover a range of topics including; the sub-surface geometries and slip of 2016 fault ruptures (Morris et al. Citation2023b; Barrell et al. Citation2023; Nicol et al. Citation2023), paleoseismic histories for faults that ruptured in 2016 (Brough et al. Citation2023; Barrell et al. Citation2023; Langridge et al. Citation2023; Morris et al. Citation2023a), seismic hazard for the Kaikōura region (Gerstenberger et al. Citation2023), hazard for surface deformation (Bloom et al. Citation2023), a review of the tsunami generated by the earthquake (Lane et al. Citation2023), impact of uplift on coastal sedimentation processes (MacDonald et al. Citation2023) and, earthquake recovery, resilience and communication (Becker et al. Citation2023; Fountain and Cradock-Henry Citation2023). The special issue is intended to provide a focus for research papers on the earthquake, to draw together previous work and to highlight some aspects of the earthquake that require further consideration. In addition to this volume and the review articles contained within it (Lane et al. Citation2023; Fountain and Cradock-Henry Citation2023), we draw the readers’ attention to a number of papers that review or provide substantive summaries of the earthquake and its related hazards (e.g. Litchfield et al. Citation2018; Massey et al. Citation2018; Hamling Citation2020; Chamberlain et al. Citation2022).
The earthquake
The Kaikōura Earthquake nucleated on The Humps Fault at a depth of ∼14 km within the continental crust of the Australian plate at 12.03 am (NZT) on 14 November 2016. It propagated ∼180 km northeastwards for about 120 s (Kaiser et al. Citation2017; Ando and Kaneko Citation2018). The earthquake is widely regarded as one of the most complex recorded globally during the last ∼150 years, rupturing more than 20 faults at the ground surface and seabed in the northeastern South Island and immediate offshore region (e.g. Hamling et al. Citation2017; Litchfield et al. Citation2018; Nicol et al. Citation2018, Citation2023; Zinke et al. Citation2019; Hamling Citation2020; Howell et al. Citation2020; Howell and Clark Citation2022) (). In addition to these surface faults, many studies indicate that the earthquake ruptured thrust faults (perhaps including the Hikurangi subduction interface) beneath the surface faults in coastal and offshore areas (e.g. Bai et al. Citation2017; Clark et al. Citation2017; Duputel and Rivera Citation2017; Furlong and Herman Citation2017; Hollingsworth et al. Citation2017; Power et al. Citation2017; Wang et al. Citation2018; Mouslopoulou et al. Citation2019; Ulrich et al. Citation2019; Nicol et al. Citation2023).
Figure 1. Maps showing plate boundary setting of Kaikōura Earthquake. (A) New Zealand plate boundary. AF: Alpine Fault; Hikurangi subduction interface. (B) November 14 2016 Mw 7.8 Kaikōura Earthquake fault ruptures observed at the surface or modelled using surface deformation (red lines with key fault names shown; THF, The Humaps Fault; HF, Hundalee Fault; OSTF, Offshore Thrust Fault; UKF, Upper Kowhai Fault; JF, Jordan Fault; PF, Papatea Fault; KF, Kekerengu Fault; NF, Needles Fault)(modified from Litchfield et al. Citation2018; Howell et al. Citation2020). Active faults shown by black lines are from Langridge et al. (Citation2016). The epicentral location of the Kaikōura Earthquake (yellow star, Chamberlain et al. Citation2022) is shown. Location and authors of studies in this special issue are shown. Onshore topographic basemap is from LINZ and bathymetry is from NIWA. MFS: Marlborough Fault System; NCD: North Canterbury Domain.
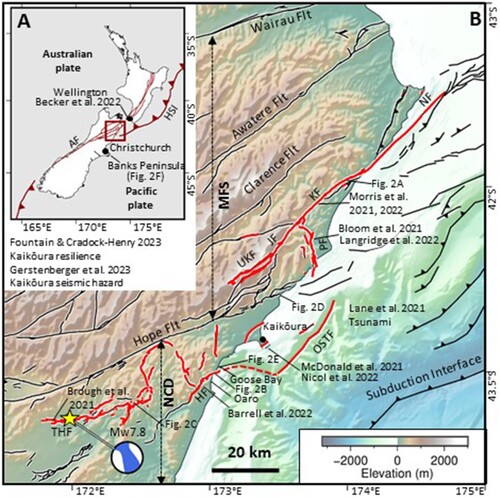
Focal mechanisms for the earthquake mainshock indicate that it accommodated a combination of reverse and right-lateral strike-slip faulting (Kaiser et al. Citation2017) (A). The focal mechanism provides a composite or average view of the earthquake, which increases in geometric and slip complexity when individual faults are considered. The faults that ruptured the ground surface are characterised by variable slip rates of >0.2 to <26 mm/yr and produced a range of trace lengths (<2 to ∼85 km), orientations (strikes 0-180°, dips 30-90°), slip types (reverse, normal, left-lateral strike slip, right-lateral strike slip) and amounts of slip (<0.4–12 m) (e.g. Kearse et al. Citation2018; Langridge et al. Citation2018; Litchfield et al. Citation2018; Nicol et al. Citation2018, Citation2023; Williams et al. Citation2018; Zinke et al. Citation2019; Howell et al. Citation2020; Brough et al. Citation2023) (). Despite this variability, a number of key conclusions can be drawn from geological observations of surface faulting. These are: (i) the earthquake ruptured across a tectonic domain boundary between transpression in the south (NCD; e.g. Nicol et al. Citation1994) and strike-slip faulting in the north (MFS; e.g. Wallace et al. Citation2012)(; see domain boundaries in Stirling et al. Citation2012), (ii) the greatest slip on faults occurred north of Kaikōura where fault slip rates are also highest, (iii) the sense of slip on the majority of faults that ruptured is consistent with the regional maximum horizontal shortening direction (SHmax) of 120 ± 19°, (iv) the more northerly striking fault-ruptures appear to have utilised planes of weakness in Mesozoic Torlesse basement rock and, (v) some of the faults that ruptured in 2016 do not appear to be optimally oriented for slip in the contemporary stress field (e.g. Nicol et al. Citation2018).
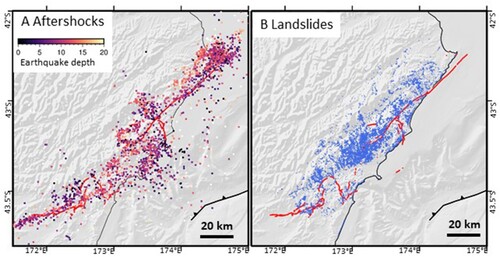
The earthquake caused damage to farmland, buildings and infrastructure in the northeastern South Island and Wellington regions (). Much of the damage resulted from shaking during the main shock which generated ground accelerations of up to ∼3.25 g at one site. With the highest seismic energy north of the Kaikōura, where the largest fault slip occurred, ∼100 km north of the earthquake nucleation zone (Kaiser et al. Citation2017; Bradley et al. Citation2018). The main shock was followed by more than 18,500 aftershocks up to Mw 6.7 (prior to 10 August 2017; https://www.geonet.org.nz/earthquake/story/2016p858000, accessed 12 February 2023), many of which are located close to the faults that ruptured the ground surface (Chamberlain et al. Citation2022) (A). The earthquake produced multiple hazards including: tsunami (e.g. Bai et al. Citation2017; Power et al. Citation2017; Lane et al. Citation2023), nearly 30,000 landslides (C & D) and >200 landslide dammed rivers (Massey et al. Citation2018, Citation2020a, Citation2020b) (A &D, 3B). Post-earthquake hazard from landslides, landslide-dammed lakes, sediment transport and flooding are ongoing and likely to remain important for decades. Damage from the earthquake mostly occurred in areas of rural farmland, severely impacting the road network (B) and main-trunk railway line (D), with state highway 1 north of Kaikōura remaining closed until December 2017 (Fountain and Cradock-Henry Citation2023). The earthquake severely disrupted the transportation of goods to, and from, areas south of Kaikōura and highlight the fragility of the New Zealand road network during large magnitude earthquakes, particularly in areas of topographic relief.
Figure 2. Photographs showing surface rupture, damage to transport infrastructure and buidlings, landslides and coastal uplift from the 2016 Kaikōura Earthquake. (A) Surface rupture of the Kekerengu Fault where it displaces a farm track by ∼6.8 m horizontally (right lateral)(Site 23 in Kearse et al. Citation2018). Photograph looking northwest and taken by Tim Little on 20 November, 2016. (B) Rupture of State Highway 1 along the Hundalee Fault immediately north of Oaro, where ∼3.7 m right-lateral and ∼1.5 m vertical displacement accrued in the earthquake (Williams et al. Citation2018). Photograph looking northeast and taken on 14 November 2016 by Daniel Bullen. (C) Leader landslide viewed towards the northeast. The landslide volume is ∼6 million m3 and dammed the Leader River to produce the ∼1100 m long Lake Rebekah (Abad et al. Citation2022). Photograph by Kate Pedley, 11 December, 2016. (D) Displaced railway tracks Half Moon Bay. The railway tracks were dislodged and transported seawards >100 m by a landslide (top left of the photograph) which blocked State Highway 1 and came to rest on the shore platform. Photograph by Vasiliki Mouslopoulou, 5 February, 2017. (E) Coastal uplift of ∼2 m south of Kaikōura showing high-and-dry marine fauna and flora (e.g. paua, bull kelp and coralline algae) the day of the earthquake. Photograph by Will Wilding, 14 November, 2016. (F) Kaikōura Earthquake tsunami caused extensive damage to a historical cottage at Little Pigeon Bay on Banks Peninsula. Locally the tsunami reached a height of ∼3 m at this location, with the anomalously large wave height being due to the narrow bay and its north facing aspect. Photograph by William Power, November, 2016. For locations of A-E see .
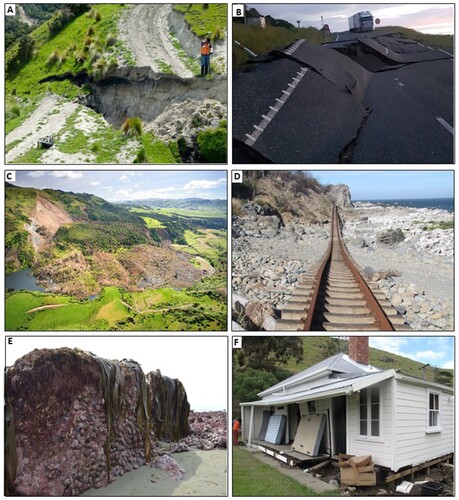
Figure 3. Maps showing aftershocks (A) and landslides (B) associated with the earthquake. Earthquakes are from Chamberlain et al. (Citation2022) and landslides from Massey et al. (Citation2018).
Understanding the earthquake
This section focuses on aspects of the earthquake addressed by papers included in this special issue and is not intended to review all work completed on the earthquake. Most notably, little or no consideration is given to the dynamic rupture process, ground motions during the main shock, aftershock locations and focal mechanisms or the engineering design and infrastructure reinstatement undertaken post-earthquake as part of the recovery. Views are split on how much new understanding the earthquake provided on earthquake processes and seismic hazard. It is certainly true that most of the points mentioned below have been raised in the literature or in scientific meetings prior to 2016, however, even today some of these points are still being debated (e.g. rupture of Hikurangi subduction interface beneath the northeastern South Island in large or great earthquakes).
| 1) | Multi-fault earthquakes | ||||
The complexity and number of fault surface ruptures is one of the most striking aspects of the Kaikōura Earthquake. Although an extreme example, this complexity is consistent with surface ruptures during numerous historical earthquakes in New Zealand (e.g. 1987 Edgecumbe, Beanland et al. Citation1989, 2010 Darfield earthquakes, Beavan et al. Citation2012) and overseas (e.g. Kurushin et al. Citation1997; Fletcher et al. Citation2014). For many in the science community the Kaikōura Earthquake strongly reinforced the idea that the ‘one fault one earthquake’ model does not always apply. Mapping of surface ruptures, together with modelling of sub-surface thrust faults and spatial analysis of aftershocks, all support the notion that the Kaikōura Earthquake ruptured an interconnected network of geological faults, with little requirement for ‘jumping’ of the earthquake rupture between unlinked faults (e.g. Hamling et al. Citation2017; Kearse et al. Citation2018; Litchfield et al. Citation2018; Nicol et al. Citation2018; Mouslopoulou et al. Citation2019; Zinke et al. Citation2019; Howell et al. Citation2020; Barrell et al. Citation2023; Nicol et al. Citation2023) (see also point 3 below).
| 2) | Paleoearthquakes and frequency of Kaikōura-type earthquakes | ||||
Prior to the 2016 earthquake no paleoseismic trench data had been published for individual faults that ruptured in the earthquake. In the absence of these data, recurrence intervals calculated from fault-slip rates and single-event displacements ranged from hundreds of years on the Kekerengu Fault to as much as 20 kyr on faults south of Kaikōura (e.g. Stirling et al. Citation2012). This special issue includes four papers that present paleoseismic data on the Kekerengu (Morris et al. Citation2023a), Papatea (Langridge et al. Citation2023), Hundalee (Barrell et al. Citation2023) and The Humps (Brough et al. Citation2023) faults, which ruptured in 2016. These papers together with previous publications (e.g. Litchfield et al. Citation2018; Little et al. Citation2018; Howell and Clark Citation2022) generally support the pre 2016 conclusions that earthquake-recurrence intervals are significantly shorter on faults north of Kaikōura (e.g. 300–400 yrs, Kekerengu and Papatea fault; Little et al. Citation2018; Langridge et al. Citation2023; Morris et al. Citation2023a) than south of Kaikōura (e.g. 2–3 kyr, The Humps Fault, Brough et al. Citation2023, 1–3.5 kyr, Hundalee Fault, Barrell et al. Citation2023). The disparity of recurrence intervals suggests that most (≥90%) of the earthquakes that rupture the Kekerengu Fault, for example, likely do not co-rupture the faults south of Kaikōura that ruptured in 2016 (Nicol et al. Citation2018, Citation2023; Morris et al. Citation2023a). If all ruptures on The Humps Fault are similar to 2016, then the time between Kaikōura-type earthquakes would be as short as 2–3 kyr and if, like the Kekerengu Fault, ≥ 90% of earthquakes on The Humps Fault were not of Kaikōura-type, then the time between earthquakes similar to 2016 would be ≥20 kyr. The spread of these numbers demonstrates that the recurrence interval for Kaikōura-type earthquakes is presently poorly resolved.
| 3) | Fault geometries and near-surface deformation | ||||
Thrust faulting beneath coastal and offshore areas of the northeastern South Island may have accommodated 10-30% of the total seismic moment and appears to represent an important component of the earthquake. The earthquake may have ruptured the subduction interface and/or thrusts faults splaying from the interface, although neither of these ruptures appear to have reached the seabed or been resolved in offshore geophysical surveys. Modelling using global seismological data has generally been interpreted to indicate that most of the seismic moment attributed to thrust faults occurred on the subduction interface (Duputel and Rivera Citation2017; Furlong and Herman Citation2017; Hollingsworth et al. Citation2017). By contrast, analysis of local geodetic, tsunami and coastal uplift data support a more nuanced model is which splay faulting and possible subduction interface slip occurred (Bai et al. Citation2017; Clark et al. Citation2017; Power et al. Citation2017; Wang et al. Citation2018; Mouslopoulou et al. Citation2019; Ulrich et al. Citation2019; Lane et al. Citation2023; Barrell et al. Citation2023; Nicol et al. Citation2023). Independent of the precise geometries of the thrust(s), it is becoming increasingly clear that they connected surface ruptures south and north of Kaikōura, and probably facilitated the northward propagation of the earthquake (Litchfield et al. Citation2018; Ulrich et al. Citation2019; Mouslopoulou et al. Citation2019; Chamberlain et al. Citation2022; Barrell et al. Citation2023; Nicol et al. Citation2023).
In addition to continued improvement in the resolution of thrust faults, ongoing research has resulted in the identification of new faults that slipped in 2016 but which were not identified in fault-trace mapping (Zinke et al. Citation2019; Howell et al. Citation2020). In this volume, Nicol et al. (Citation2023) have mapped two new faults in the Kaikoura Peninsula area (), which produced uplift of <0.5 m at the ground surface without generating surface traces. The discovery of new 2016 faults support the view that the number and geometric complexity of Kaikōura Earthquake fault ruptures is likely to be greater than presently published in the literature. Despite the proposed increase in complexity, it is likely that the existing mapped 2016 faults accommodate most (e.g. > 90%) of the seismic moment in the earthquake.
Near-surface deformation on the Kekerengu Fault in 2016 and earlier earthquakes has been examined by Morris et al. (Citation2023b). For the first time they re-excavated a trench that had been ruptured in an earthquake. Detailed logs of the trench walls pre- and post-earthquake demonstrated that the geometry of deformation and slip vector varied between earthquakes.
| 4) | Implication for seismic hazards | ||||
A time-dependent Kaikōura Seismic Hazard Model for the next 100 years was produced following the earthquake to inform the reinstatement of key road and rail transport networks (Gerstenberger et al. Citation2023). The model incorporates an updated fault source model, multi-fault ruptures, a weighting that discounts earthquakes far in the future and equal weights for earthquake rupture or no rupture of the Hikurangi subduction interface. It shows elevated seismic hazards along the Hope Fault and emphasises the challenge of adequately representing clustering of large earthquakes in probabilistic seismic hazard models. In addition to triggering the development of the Kaikōura Seismic Hazard Model, the Kaikōura Earthquake reinforced a number of ideas about parameters that should be included in seismic hazard models. These attributes include: (i) complex multi-fault ruptures of numerous faults (e.g. > 5) totalling hundreds of kilometres in length, (ii) rupture of some faults that were either not previously mapped or not included in previous seismic hazard models (e.g. Stirling et al. Citation2012), (iii) the potential for slip on the subduction interface beneath the northeastern South Island during large earthquakes (>M7), (iv) co-rupture of upper plate faults and the subduction interface along the Hikurangi margin, and (v) amplification of long-period seismic waves (e.g. 0.5-2 s) in shallow sedimentation basins (e.g. Wellington Basin, Kaiser et al. Citation2017; Bradley et al. Citation2018). Many of these insights have been incorporated into the 2022 version of the National Seismic Hazard Model (NZ NSHM) (Gerstenberger et al. Citation2022). Compared to models where each earthquake ruptures one fault or one fault segment, seismic hazards that include attributes (i) to (iv) can be expected to have an increased maximum magnitude and a decreased frequency of earthquakes > M7, with a larger proportion of the total seismic-moment budget accommodated by the largest earthquakes (Gerstenberger et al. Citation2022).
On the scale of individual sites establishing fault-avoidance zones for active fault traces is an important tool for mitigating seismic hazard associated with ground-surface rupture during earthquakes (e.g. Kerr et al. Citation2003). Here map-view widths of co-seismic distributed vertical displacement associated with the 2016 earthquake was measured by Bloom et al. (Citation2023) for the Papatea Fault. These data provide an empirical means of defining the dimensions of fault-avoidance zones. Bloom et al. (Citation2023) show that the width of surface deformation is variable and up to ∼1 km wide. They recommended further work to define better the widths of fault deformation zones and the factors that control their dimensions.
| 5) | Tsunami and beach sedimentation | ||||
The Kaikōura Earthquake tsunami and associated societal response are reviewed by Lane et al. (Citation2023). Localised tsunami with estimated heights up to 6.9 m and runups of 250 m were induced by the earthquake, with Goose Bay and Oaro (Kaikōura coast, ) and Little Pigeon Bay (Bank Peninsula, & E) experiencing the greatest wave heights. Tide gauges in central Aotearoa New Zealand mainly recorded tsunami heights of <1 m, with Kaikōura being the exception at ∼2.5 m. Hydrological modelling indicates that the tsunami resulted from at least two areas of seabed uplift, perhaps associated with reverse slip on two faults (Bai et al. Citation2017; Gusman et al. Citation2018). Studies of paleotsunami deposits in central Aotearoa-New Zealand indicate that tsunami have been common in the Holocene. Evacuation surveys show that more than half (∼60%) of respondents evacuated within 3 h of the earthquake, with maximum wave heights occurring in <4 h <200 km of Kaikōura along the east coast of Aotearoa New Zealand. These results have been the catalyst for improved communication with coastal communities to ensure that they evacuate to high ground in a timely manner.
Ground shaking, surface rupture and uplift during the earthquake has the potential to significantly impact coastal deposition and erosion processes. MacDonald et al. (Citation2023) examine the role of coastal uplift in modifying coastal deposition/erosion on mixed sand and gravel beaches along Kaikōura Peninsula, where about 1 m of uplift was recorded (Clark et al. Citation2017; Reid et al. Citation2020; Nicol et al. Citation2023). The results indicate that despite the relative sea level fall most beaches maintained or increased their depositional or erosional trends from prior to the earthquake. These observations suggest that in high-energy sand-gravel beaches sedimentary processes largely overwhelmed the impact of relatively small (∼1 m) instantaneous tectonic uplift within 2 yrs of the earthquake. This finding contrasts with observations from uplifted areas of coastline where there is no sedimentary cover, especially areas with mudstone bedrock where erosion rates increased by up to 148% post-earthquake (Horton et al. Citation2022).
| 6) | Improving earthquake resilience and communication | ||||
The earthquake offers the opportunity to improve strategies for increasing societal resilience. Fountain and Cradock-Henry (Citation2023) review existing social science research and offer new analysis of the impact of the earthquake and its aftermath on the community in Kaikōura over the subsequent five years. They show that the earthquake had significant implications for tourism and primary industries in the northeastern South Island. Although recovery in Kaikōura benefited from community collaboration, it has been slow, and dependent on restoring transport links that were completely severed in the earthquake. The study highlights the need for integrated and equitable approaches to building long-term community resilience.
Communication is critical for reduction of natural hazards. Becker et al. (Citation2023) conducted interviews to understand how evacuation information was communicated to apartment dwellers in Wellington immediately following the Kaikōura Earthquake, and how residents used that information for decision-making. They found that communication about the earthquake and associated tsunami to apartment dwellers was mainly achieved via social media. Communication with body-corporate or landlords about building evacuation and damage was often limited and Becker et al. (Citation2023) highlight the need for additional strategies to deliver information to apartment dwellers.
Outstanding questions
Despite the unprecedented amount of data available and the thousands of papers that have been published on, or which refer to the earthquake (∼4500 Google Scholar Kaikōura Earthquake records, 12 February 2023), many key questions remain about the earthquake process, implications of the earthquake for seismic hazards and building resilience for future earthquakes, tsunami and geological processes in central New Zealand.
A key question remains about how much slip (and seismic moment) accrued on the subduction interface in 2016. A good case can be made for slip on a thrust(s) beneath the coastline and offshore in the 2016 earthquake (for discussions see Howell and Clark Citation2022; Nicol et al. Citation2023). Differences in opinion arise due to changes in the length scale of the data being modelled (i.e. global seismological versus local surface deformation data), and the non-uniqueness of the modelling results. For example, modelling highlights a trade-off between interface and splay-fault slip (e.g. Mouslopoulou et al. Citation2019). In addition, decreasing the dips of upper plate faults from >60° to 30-40° based on aftershock relocations (e.g. Chamberlain et al. Citation2022) can reduce the requirement for slip on the interface (e.g. Nicol et al. Citation2023).
Given uncertainty of the involvement of the subduction interface in 2016, this earthquake cannot be used to definitively state that the subduction interface beneath the northeastern South Island is capable of generating great earthquakes. Perhaps more clearly resolved from geodetic modelling is up to 0.5 m of afterslip in the year following the 2016 earthquake on the subduction interface beneath the faults that ruptured the ground surface (Wallace et al. Citation2018). Afterslip requires that the subduction interface is not permanently locked beneath the northeastern South Island, but again does not conclusively demonstrate that it is capable of rupturing in great earthquakes. The strongest evidence for potential great earthquakes on the subduction interface beneath the 2016 ruptures is provided by horizontal and vertical land movements recorded by GNSS and InSAR data (Wallace et al. Citation2012; Hamling et al. Citation2022). Both of these datasets record contemporary subsidence of the coastline north of Kaikōura prior to the earthquake and combined with observations of uplift on geological timescales (Ota et al. Citation1996; Nicol et al. Citation2023), point to the possibility of subsidence during interseismic coupling and future rebound in earthquakes on the subduction interface. Therefore, the 2022 version of the NSHM has included interface rupture as a possibility (Gerstenberger et al. Citation2022), although further work is required to resolve how much slip on the interface accrues in great earthquakes and how frequently these earthquakes occur.
The 2016 earthquake ruptured numerous faults close to the Hope Fault, which accommodates a third to a half of the relative plate motion on geological timescales (e.g. Langridge et al. Citation2003). Surprisingly, the earthquake did not produce significant slip (i.e. > 1 m at the ground surface) on the Hope Fault, despite its proximity to the 2016 ruptures. The reason(s) the rupture bypassed the Hope Fault is unresolved, and could include: change in stresses due to the 2016 earthquake were near-zero or negative across the Hope Fault (Hamling et al. Citation2017; Ulrich et al. Citation2019), local stresses across the fault immediately prior to 2016 were low and the fault was further from failure than other faults in the region and/or the fault zone was relatively strong at the time of the earthquake. Understanding why the Hope Fault did not accommodate significant slip in the earthquake may improve understanding of why faults co-rupture during the same earthquake.
The Kaikōura Earthquake triggered creep on the subduction interface (Wallace et al. Citation2018) and the question remains whether it also advanced the ‘seismic clock’ on other active faults in central Aotearoa New Zealand? Coulomb stress modelling indicates positive changes in the lower North Island arising from the Kaikōura Earthquake, which may have increased the probability of future earthquakes in this region (e.g. Cheng et al. Citation2018; Kaneko et al. Citation2018). Rigorous exploration and testing is required before Coulomb stress analysis of the type presented by Cheng et al. (Citation2018) can be included in seismic hazard assessment or used for planning purposes. What is perhaps clearer from the 2016 ruptures, and other historical earthquakes, is that complex multi-fault ruptures will likely occur in future earthquakes. The 2010 version of the NZ NSHM incorporates some multiple-fault ruptures (Stirling et al. Citation2012), while thousands of ‘plausible’ multi-fault earthquakes have been included in the 2022 version of the NZ NSHM (Gerstenberger et al. Citation2022). Further work is required to determine whether multi-fault ruptures increase or decrease the probability of seismic hazards in different parts of Aotearoa New Zealand.
Lastly, while new scientific knowledge has been developed about the co-seismic hazard and risk facing Aotearoa New Zealand, fundamental questions remain about tsunami-generating sources and the likely return period for high-impact tsunami. Further investigation of onshore and offshore geological records is required to help improve understanding of tsunami hazard and history to underpin risk and impact assessments informing more effective disaster risk management (Lane et al. Citation2023).
Acknowledgements
We thank authors and reviewers who have contributed to the Special Issue. Kari Bassett Senior Editor for NZJGG (2016-2022) and Fei He Programme Manager Publishing from the Royal Society of New Zealand Te Apārangi were critical for starting and finishing this ppecial issue, respectively. Much of the work reported in this special issue was financially supported by Toka Tū Ake EQC, Ministry of Business, Industry and Enterprise, and the National Hazards Research Platform. We thank Bill Fry, Matt Gerstenberger and Tim Stahl for discussions on aspects of this paper. Laura Wallace is also thanked for her comments on an early version of this paper.
Disclosure statement
No potential conflict of interest was reported by the author(s).
Data availability statement
The data that support the findings of this study are provided in this paper or the papers that the article refers to.
References
- Abad L, Hölbling D, Spiekermann R, Prasicek G, Dabiri Z, Argentin A-L. 2022. Detecting landslide-dammed lakes on Sentinel-2 imagery and monitoring their spatio-temporal evolution following the Kaikōura earthquake in New Zealand. Science of the Total Environment. 820:153335.
- Ando R, Kaneko Y. 2018. Dynamic rupture simulation reproduces spontaneous multifault rupture and arrest during the 2016 MW 7.9 Kaikōura earthquake. Geophysical Research Letters. 45:12,875–12,883. doi:10.1029/2018GL080550.
- Bai YF, Lay T, Cheung KF, Ye LL. 2017. Two regions of seafloor deformation generated the tsunami for the 13 November 2016, Kaikōura, New Zealand earthquake. Geophysical Research Letters. 44:6597–6606.
- Bannister S, Gledhill K. 2012. Evolution of the 2010–2012 Canterbury earthquake sequence. New Zealand Journal of Geology and Geophysics. 55(3):295–304. doi:10.1080/00288306.2012.680475.
- Barrell DJA, Stirling M, Williams J, Sauer KM, van den Berg EJ. 2023. Hundalee Fault, North Canterbury, New Zealand: late Quaternary activity and regional tectonics. New Zealand Journal of Geology and Geophysics. 66(2):293–316. doi:10.1080/00288306.2022.2153877.
- Beanland S, Berryman KR, Blick GH. 1989. Geological investigations of the 1987 Edgecumbe earthquake, New Zealand. New Zealand Journal of Geology and Geophysics. 32(1):73–91.
- Beavan J, Motagh M, Fielding EJ, Donnelly N, Collett D. 2012. Fault slip models of the 2010–2011 Canterbury, New Zealand, earthquakes from geodetic data and observations of postseismic ground deformation. New Zealand Journal of Geology and Geophysics. 55(3):207–221.
- Becker JS, Blake D, Thompson J, Vinnell LJ, Doyle EEH. 2023. Communicating evacuation information to multi-storey apartment dwellers: a case study of the 2016 Kaikōura earthquake in Te Whanganui-a-Tara (Wellington), Aotearoa New Zealand. New Zealand Journal of Geology and Geophysics. 66(2):177–191. doi:10.1080/00288306.2022.2135544.
- Bloom C, Stahl T, Howell A. 2023. Distributed displacement on the Papatea Fault from the 2016 Mw 7.8 Kaikōura earthquake and implications for hazard planning. New Zealand Journal of Geology and Geophysics. 66(2):217–227. doi:10.1080/00288306.2021.1975777.
- Bradley BA, Wotherspoon LM, Kaiser AE, Cox B, Jeong S. 2018. Influence of site effects on observed ground motions in the Wellington region from the Mw 7.8 Kaikōura, New Zealand, earthquake. Bulletin of the Seismological Society of America. 108 (3B):1722–1735. doi:10.1785/0120170286.
- Brough T, Nicol A, Stahl T, Pettinga J, Van Dissen R, Clark D, Khajavi N, Pedley K, Langridge R, Wang N. 2023. Paleoseismicity of the western Humps fault on the Emu plain, North Canterbury, New Zealand. New Zealand Journal of Geology and Geophysics. 66(2):279–292. doi:10.1080/00288306.2021.1986727.
- Chamberlain CJ, Frank WB, Lanza F, Townend J, Warren-Smith E. 2022. Illuminating the pre-, co-, and post-seismic phases of the 2016 M7.8 Kaikōura earthquake with 10 years of seismicity. Journal of Geophysical Research. doi:10.1029/2021JB022304.
- Cheng H-H, Zhang B, Zhang H, Shi Y-L. 2018. Calculation of the co-seismic deformation and stress changes of the Kaikoura Mw7.8 earthquake, Nov 13, 2016. Chinese Journal of Geophysics. 60(5):520–531. doi:10.1002/cjg2.30065.
- Clark KJ, Nissen EK, Howarth JD, Hamling IJ, Mountjoy JJ, Ries WF, Jones K, Goldstien S, Cochran UA, Villamor P, et al. 2017. Highly variable coastal deformation in the 2016 Mw7.8 Kaikōura earthquake reflects rupture complexity along a transpressional plate boundary. Earth and Planetary Science Letters. 474:334–344. doi:10.1016/j.epsl.2017.06.048.
- Downes GL, Dowrick DJ. 2015. Atlas of isoseismal maps of New Zealand earthquakes, 1843-2003, 2nd Edition. Institute of Geological & Nuclear Sciences monograph 25 (issued as a CD) Lower Hutt: Institute of Geological & Nuclear Sciences.
- Duputel Z, Rivera L. 2017. Long-period analysis of the 2016 Kaikōura earthquake. Physics of the Earth Planet. International. 265:62–66.
- Elliott JR, Nissen EK, England PC, Jackson JA, Lamb S, Li Z, 2012. Slip in the 2010 and 2011 Canterbury earthquakes, New Zealand. Journal of Geophysical Research. 117:B03401. doi:10.1029/2011JB008868.
- Fletcher JM, Teran OJ, Rockwell TK, Oskin ME, Hudnut KW, Mueller KJ, Spelz RM, Akciz SO, Masana E, Faneros G, et al. 2014. Assembly of a large earthquake from a complex fault system: surface rupture kinematics of the 4 April 2010 El Mayor-Cucapah (Mexico) Mw 7.2 earthquake. Geosphere. 10:797–827.
- Fountain J, Cradock-Henry NA. 2023. We’re all in this together? Community resilience and recovery in Kaikōura following the 2016 Kaikōura-Hurunui earthquake. New Zealand Journal of Geology and Geophysics. 66(2):162–176. doi:10.1080/00288306.2023.2167842.
- Furlong KP, Herman M. 2017. Reconciling the deformational dichotomy of the 2016 Mw 7.8 Kaikōura NZ earthquake. Geophysical Research Letters. 44:6788–6791.
- Gerstenberger MC, Bora S, Bradley BA, DiCaprio C, Van Dissen RJ, Atkinson GM, Chamberlain C, Christophersen A, Clark KJ, Coffey GL, et al. 2022. New Zealand National Seismic Hazard model 2022 revision: model, hazard and process overview. Lower Hutt (NZ): GNS Science. 106 p. (GNS Science report; 2022/57). doi:10.21420/TB83-7X19.
- Gerstenberger MC, Rhoades DA, Litchfield N, Abbott E, Goded T, Christophersen A, Van Dissen RJ, Bannister S, Barrell D, Bruce Z, et al. 2023. A time-dependent seismic hazard model following the Kaikōura M7.8 earthquake. New Zealand. New Zealand Journal of Geology and Geophysics. 66(2):192–216. doi:10.1080/00288306.2022.2158881.
- Gusman AR, Satake K, Gunawan E, Hamling I, Power W. 2018. Contribution to multiple fault ruptures to tsunami generation during the 2016 Kaikoura earthquake. Pure and Applied Geophysics. 175:2557–2574. doi:10.1007/s00024-018-1949-z.
- Hamling IJ. 2020. A review of the 2016 Kaikōura earthquake: insights from the first 3 years. Journal of the Royal Society of New Zealand. 50(2):226–244. doi: 10.1080/03036758.2019.1701048.
- Hamling IJ, Hreinsdóttir S, Clark K, Elliott J, Liang C, Fielding E, Litchfield N, Villamor P, Wallace L, Wright TJ, et al. 2017. Complex multifault rupture during the 2016Mw7.8 Kaikōura earthquake, New Zealand. Science. 356:6334.
- Hamling IJ, Wright TJ, Hreinsdóttir S, Wallace L. 2022. A snapshot of New Zealand's dynamic deformation field from envisat InSAR and GNSS observations between 2003 and 2011. Geophysical Research Letters. 49(2) doi:10.1029/2021GL096465
- Hollingsworth J, Ye L, Avouac JP. 2017. Dynamically triggered slip on a splay fault in the Mw 7.8, 2016 Kaikōura (New Zealand) earthquake. Geophysical Research Letter. 44:3517–3525.
- Horton SL, Stephenson WJ, Dickson ME. 2022. Changes in shore platform wetting and drying cycles following the 2016 Kaikōura earthquake: implications for incipient marine terrace evolution. Earth Surface Processes and Landforms. 47(12):2972–2988. doi:10.1002/esp.5438.
- Howell A, Clark K. 2022. Late holocene coseismic uplift of the Kaikōura coast, New Zealand. Geosphere. 18 (3):1104–1137. doi:10.1130/GES02479.1.
- Howell A, Nissen E, Stahl T, Clark K, Kearse J, Van Dissen R, Villamor P., Langridge R., Jones K. 2020. Three-dimensional surface displacements during the 2016 MW 7.8 Kaikōura earthquake (New Zealand) from photogrammetry-derived point clouds. Journal of Geophysical Research: Solid Earth. 125. doi:10.1029/2019JB018739
- Kaiser A, Balfour N, Fry B, Holden C, Litchfield N, Gerstenberger M, D’Anastasio E, Horspool N, McVerry G, Ristau J, et al. 2017. The 2016 Kaikōura, New Zealand, earthquake: preliminary seismological report. Seismological Research Letters. 88(3):727–739.
- Kaneko Y, Wallace LM, Hamling IJ, Gerstenberger MC. 2018. Simple physical model for the probability of a subduction- zone earthquake following slow slip events and earthquakes: application to the Hikurangi megathrust, New Zealand. Geophysical Research Letters. 45(9):3932–3941. doi:10.1029/2018GL077641.
- Kearse J, Little TA, Van Dissen RJ, Barnes P, Langridge R, Mountjoy J. 2018. Onshore and offshore ground-surface and seabed rupture of the Jordan–Kekerengu–Needles Fault network during the 2016 MW 7.8 Kaikōura earthquake, New Zealand. Bulletin of the Seismological Society of America. 108(3B):1573–1595. doi:10.1785/0120170304.
- Kerr J, Nathan S, Van Dissen R, Webb P, Brunsdon D, King A. 2003. Planning for development of land on or close to active faults a guideline to assist resource management planners in New Zealand. Report prepared for the Ministry for the Environment. ISBN: 0-478-18979-6 ME number: 565.
- Kurushin RA, Bayasgalan A, Ölziybat M, Enkhtuvshin B, Molnar P, Bayarsayhan C, Hudnut KW, Lin J. 1997. The surface rupture of the 1957 Gobi-Altay, Mongolia, earthquake. Geological Society of America Special Paper. 320:143. pp.
- Lane EM, Thomas K-L, King DN, Williams S, Borrero J, Power W. 2023. Five years after the 14 November 2016 Kaikōura Tsunami in Aotearoa-New Zealand: insights from recent research. New Zealand Journal of Geology and Geophysics. 66(2):147–161. doi:10.1080/00288306.2021.1951307.
- Langridge R, Campbell J, Hill N, Pere V, Pope J, Pettinga J, Estrada B, Berryman K. 2003. Paleoseismology and slip rate of the Conway segment of the Hope Fault at Greenburn Stream, South Island, New Zealand. Annals of Geophysics. 46(5):1119–1140.
- Langridge RM, Clark KJ, Almond P, Baize S, Howell A, Kearse J. 2023. Late Holocene earthquakes on the Papatea Fault and its role in past earthquake cycles, Marlborough, New Zealand, New Zealand. New Zealand Journal of Geology and Geophysics. 66(2):317–341. doi:10.1080/00288306.2022.2117829.
- Langridge R, Ries WF, Litchfield N, Villamor P, Van Dissen RJ, Barrell DJA, Rattenbury MS, Heron DW, Haubrock S, Townsend DB, Lee JM, Berryman KR, Nicol A, Cox SC, Stirling MW. 2016. The New Zealand active faults database. New Zealand Journal of Geology and Geophysics. 59(1):86–96.
- Litchfield NJ, Villamor P, Van Dissen RJ, Nicol A, Barnes PM, Barrell DJA, Pettinga JR, Langridge RM, Little TA, Mountjoy JJ, et al. 2018. Surface rupture of multiple crustal faults in the 2016 Mw 7.8 Kaikōura, New Zealand. Bulletin of the Seismological Society of America. 108(3B):1496–1520.
- Little TA, Van Dissen R, Kearse J, Norton K, Benson A, Wang N. 2018. Kekerengu fault, New Zealand: timing and size of late Holocene surface ruptures. Bulletin of the Seismological Society of America. 108(3B):1556–1572.
- MacDonald KE, Hart DE, Pitman SJ. 2023. Geomorphic responses of uplifted mixed sand and gravel beaches: combining short-term observations from Kaikōura, New Zealand with longer-term evidence. New Zealand Journal of Geology and Geophysics. 66(2):228–243. doi:10.1080/00288306.2021.1994425.
- Massey C, Townsend D, Rathje E, Allstadt KE, Lukovic B, Kaneko Y, Bradley B, Wartman J, Jibson RW, Petley DN, et al. 2018. Landslides triggered by the 14 November 2016 Mw 7.8 Kaikōura earthquake. Bulletin of the Seismological Society of America. 108(3B):1630–1648. doi:10.1785/0120170305.
- Massey CI, Townsend D, Jones K, Lukovic B, Rhoades D, Morgenstern R, Rosser B, Ries W, Howarth J, Hamling I, et al. 2020b. Volume characteristics of landslides triggered by the MW 7.8 2016 Kaikōura Earthquake, New Zealand, derived from digital surface difference modelling. Journal of Geophysical Research Earth Surface. 125:e2019JF005163. doi:10.1029/2019JF005163.
- Massey CI, Townsend DT, Lukovic B, Morgenstern R, Jones K, Rosser B, de Vilder S. 2020a. Landslides triggered by the MW 7.8 2016 Kaikōura earthquake: an update. Geomorphology. 17:2401–2408. doi:10.1007/s10346-020-01439-x.
- Morris P, Little T, Van Dissen R, Hemphill-Haley KJ, Hill M. 2023a. A revised paleoseismological record of late Holocene ruptures on the Kekerengu Fault following the 2016 Kaikōura earthquake. New Zealand Journal of Geology and Geophysics. 66(2):342–363. doi:10.1080/00288306.2022.2059766.
- Morris P, Little T, Van Dissen R, Hill M, Hemphill-Haley KJ. 2023b. Evaluating 9 m of near-surface transpressional displacement during the Mw 7.8 2016 Kaikōura earthquake: re-excavation of a pre-earthquake paleoseismic trench, Kekerengu Fault. New Zealand Journal of Geology and Geophysics. 66(2):244–262. doi:10.1080/00288306.2021.1954958.
- Mouslopoulou V, Saltogianni V, Nicol A, Oncken O, Begg J, Babeyko A, Cesca S, Moreno M. 2019. Breaking a subduction-termination from top to bottom: the large 2016 Kaikōura earthquake, New Zealand. Earth and Planetary Science Letters. 506:221–230.
- Nicol A, Alloway BV, Tonkin P. 1994. Rates of deformation, uplift and landscape development associated with active folding in the Waipara area of North Canterbury, New Zealand. Tectonics. 13:1327–1344.
- Nicol A, Begg J, Saltogianni V, Mouslopoulou V, Oncken O, Howell A. 2023. Uplift and fault slip during the 2016 Kaikōura Earthquake and Late Quaternary, Kaikōura Peninsula, New Zealand. New Zealand Journal of Geology and Geophysics. 66(2):263–278. doi:10.1080/00288306.2021.2021955.
- Nicol A, Khajavi N, Pettinga JR, Fenton C, Stahl T, Bannister S, Pedley K, Hyland-Brook N, Bushell T, Hamling I, et al. 2018. Preliminary geometry, displacement, and Kinematics of fault ruptures in the Epicentral region of the 2016 Mw 7.8 Kaikōura, New Zealand, earthquake. Bulletin of the Seismological Society of America. 108(3B):1521–1539.
- Nicol A, Van Dissen R, Stirling M, Gerstenberger M. 2016. Completeness of the paleoseismic active fault record in New Zealand. Seismol. Res. Lett. 87(6), doi:10.1785/0220160088.
- Ota Y, Pillans B, Berryman K, Beu A, Fujimori T, Miyauchi T, Berger G, Beu AG, Climo FM. 1996. Pleistocene coastal terraces of Kaikōura Peninsula and the Marlborough Coast, South Island, New Zealand. New Zealand Journal of Geology and Geophysics. 39:51–73.
- Power W, Clark K, King DN, Borrero J, Howarth J, Lane EM, Goring D, Goff J, Chague-Goff C, Williams J, et al. 2017. Tsunami runup and tide-gauge observations from the 14 November 2016 M7.8 Kaikōura earthquake, New Zealand. Pure and Applied Geophysics. 174:2457–2473.
- Reid C, Begg J, Mouslopoulou V, Oncken O, Nicol A, Kufner S-K. 2020. Using a calibrated upper living-position of marine-biota to calculate coseismic uplift: the case-study of 2016 Kaikōura earthquake, New Zealand. Earth Surface Dynamics. 8:1–15. doi:10.5194/esurf-8-1-2020.
- Stirling M, McVerry G, Gerstenberger M, Litchfield N, Van Dissen R, Berryman K, Barnes P, Wallace L, Villamor P, Langridge R, et al. 2012. National Seismic Hazard model for New Zealand: 2010 update. Bulletin of the Seismological Society of America. 102:1514–1542.
- Ulrich T, Gabriel A, Ampuero J-P, Xu W. 2019. Dynamic viability of the 2016 Mw 7.8 Kaikōura earthquake cascade on weak crustal faults. Nature Communications. 10:1213. doi:10.1038/s41467-019-09125-w
- Wallace L, Hreinsdóttir S, Ellis S, Hamling I, D'Anastasio E, Denys P. 2018. Triggered slow slip and afterslip on the southern Hikurangi subduction zone following the Kaikōura earthquake. Geophysical Research Letters. 45(10):4710–4718. Doi:10.1002/2018GL077385.
- Wallace LM, Barnes P, Beavan J, Van Dissen R, Litchfield N, Mountjoy J, Langridge R, Lamarche G, Pondard N. 2012. The kinematics of a transition from subduction to strike-slip: an example from the central New Zealand plate boundary. Journal of Geophysical Research. 117:1–24. doi:10.1029/2011JB008640
- Wang T, Wei S, Shi X, Qiu Q, Li L, Peng D, 2018. The 2016 Kaikōura earthquake: simultaneous rupture of the subduction interface and overlying faults. Earth and Planetary Science Letters. 482:44–51. doi:10.1016/j.epsl.2017.10.056.
- Williams JN, Barrell DJA, Stirling MW, Sauer KM, Duke GC, Hao KX. 2018. Surface rupture of the Hundalee Fault during the 2016 Mw 7.8 Kaikōura earthquake. Bulletin of the Seismological Society of America. 108:1540–1555.
- Zinke R, Hollingsworth J, Dolan JF, Van Dissen R. 2019. Three-dimensional surface deformation in the 2016 MW 7.8 Kaikōura, New Zealand, earthquake from optical image correlation: implications for strain localization and long-term evolution of the Pacific-Australian plate boundary. Geochemistry, Geophysics, Geosystems. 20:1609–1628. doi:10.1029/2018GC007951.