
ABSTRACT
U–Pb, and zircon and apatite fission track data provide a powerful means to characterise the Late Cretaceous to Late Oligocene source-to-sink system and continent evolution in central Zealandia. Our dataset includes samples from potential source rocks in northwest Nelson (Takaka and Buller terranes; Karamea, Tobin, Darran and Separation Point suites) and Cenozoic sediments in the Taranaki and King Country basins. Zircon (ZFT) and apatite (AFT) fission track data for basement rocks indicate 7.5 to 10 km of Late Cretaceous to Paleogene exhumation, requiring a substantial Early Cretaceous to Paleogene mountain range in northwest Nelson, which was eroded to sea level by the Late Oligocene. Some 54% of the detrital zircon content in basin sandstone beds have Separation Point Suite U–Pb age, 24% have Karamea Batholith age and 19% have Darran and Tobin suites age. The remainder could be from the Buller and/or Takaka terranes. Revised Late Eocene and Oligocene paleogeographic maps for the basins define the sediment transport routes until termination during 29 to 26 Ma due to shortening across central to southern parts of the Taranaki Fault System, which dates the timing of subduction initiation along the Hikurangi margin of the modern Australia-Pacific plate boundary.
Introduction
Modern numerical dating methods, particularly zircon U–Pb geochronology, are increasingly being applied to map the provenance of sedimentary systems from source to sink (e.g. Schoene Citation2014; Mason et al. Citation2022). The linkage of sediments to their source area(s) is a key paleogeographic outcome of basin analysis because it helps define sediment pathways. Furthermore, the results are complemented with the application of low temperature thermochronology methods such as zircon and apatite fission track analysis (ZFT, AFT) to establish whether or not exhumation in a source area was concurrent with sediment dispersal to, and accumulation within, a basin.
Here, we report the results of an extensive zircon U–Pb source-to-sink dating programme of samples from the Paleozoic to Cretaceous basement rocks in northwest (NW) Nelson, South Island, as well as Late Cretaceous to Oligocene sedimentary sandstone formations sampled from the Taranaki and King Country basins that may have accumulated the eroded material (). This gives us the ability to directly link potential basement source units to basin formations via their respective component and detrital U–Pb zircon ages. We accompany these data with the results of double dating zircon U–Pb and ZFT on single crystals, and of AFT analysis and inverse thermal history modelling on selected basement unit samples, to establish the magnitude and duration of their exhumation. This helps establish whether or not basement units were viable sediment sources throughout the Late Cretaceous to Oligocene period of sediment accumulation in the basins. With this information, we then generate a series of paleogeographic maps showing potential sediment pathways between the Taranaki and King Country basins, and interpret the termination of these pathways in terms of the successive evolution of Australia-Pacific plate boundary zones through Zealandia.
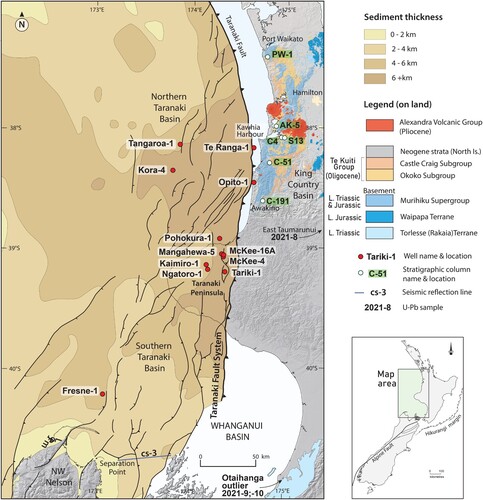
Figure. 1. Map of central-western North Island, showing present-day Taranaki Basin structure and depth to basement modified from NZPM (Citation2014, p. 21). The drill holes shown as red circles in Taranaki Basin are those that were sampled in this study. The white circles on land in northern King Country and Waikato regions with labels locate stratigraphic sections through parts of the Te Kuiti Group (Kamp et al. Citation2008) also sampled in this study. Inset, the modern Australia-Pacific plate boundary through New Zealand.
Geological setting
NW Nelson basement units
The basement of NW Nelson comprises two batholiths (Karamea and Median) subdivided into petrogenetic suites, and two basement terranes (Takaka and Buller) (Rattenbury et al. Citation1998) (). The Buller Terrane is exposed in the western part of NW Nelson and comprises Early to early–Late Devonian quartzose turbiditic fine sandstone and associated thick pelagic shale, regionally metamorphosed up to lower greenschist facies (Cooper Citation1989; Rattenbury et al. Citation1998; Adams et al. Citation2015). The Takaka Terrane is located in central to eastern parts of NW Nelson and comprises a diverse assemblage of igneous and sedimentary rocks that accumulated in a Cambrian volcanic arc environment, overlain by carbonates (including marble) and siliciclastics of Late Cambrian to Early Devonian age (Rattenbury et al. Citation1998; Adams et al. Citation2015).
The Karamea Batholith intruded the Buller Terrane and is the most western of three granite belts in NW Nelson. The Karamea Suite (371-368 Ma; Tulloch Citation1988; Muir et al. Citation1996; Tulloch and Kimbrough Citation2003; Tulloch et al. Citation2009; Sagar and Palin Citation2013; Turnbull et al. Citation2016, Citation2018) is the most extensive of the suites. Other suites include the Paringa (369–362 Ma), Ridge (355–340 Ma), Tobin (351–337 Ma), and Foulwind (350–305 Ma) (Tulloch et al. Citation2009; Turnbull et al. Citation2016).
The Median Batholith lies between the Takaka Terrane and the Eastern Province, and represents a long-lived arc system along the Gondwana margin (Mortimer et al. Citation1999). The Separation Point Suite (SPS) dominates the western Median Batholith in NW Nelson, where it sutures the Takaka Terrane to the west () and the Darran Suite to the east (Challis et al. Citation1994; Scott et al. Citation2014). Tobin Suite Carboniferous plutons also form the known basement to the Darran Suite (Muir et al. Citation1998; Scott et al. Citation2009; Tulloch and Mortimer Citation2017). Published zircon U–Pb ages for the SPS in NW Nelson range from c. 112–119 Ma (Harrison and McDougall Citation1980; Kimbrough et al. Citation1994; Muir et al. Citation1994; Muir et al. Citation1995; Bolhar et al. Citation2008).
The Darran Suite is exposed in the vicinity of Lake Rotoroa, east of the main outcrop belt of the SPS, where it is mapped within the Rotoroa Complex (Challis et al. Citation1994; Rattenbury et al. Citation1998) (). However, Darran Suite also lies beneath Late Neogene strata of the Moutere Depression west and southwest of Nelson City (Lihou Citation1993; Rattenbury et al. Citation1998) and offshore beneath a structural high in southern Taranaki Basin (Mortimer et al. Citation1997; Tulloch and Mortimer Citation2017; Higgs and King Citation2018). In NW Nelson published U–Pb ages for the Darran Suite range from c. 147–228 Ma (Kimbrough et al. Citation1993). Plutons of Carboniferous and Early Permian age spatially associated with the Darran Suite (Kimbrough et al. Citation1993) belong to the Tobin and Ridge suites (Tulloch et al. Citation2009; Turnbull et al. Citation2023).
Taranaki Basin and plate boundary
Taranaki Basin is a long-lived (Late Cretaceous – Cenozoic) depocentre on and offshore central-western North Island, New Zealand (). This basin formed during three phases of crustal extension and by subsequent crustal shortening (Strogen et al. Citation2017): the first phase occurred during c. 105 – c. 83 Ma; the second during c. 80–52 Ma, and the third during the Late Eocene – Oligocene, restricted to southern Taranaki Basin, concurrent with seafloor spreading in the Emerald Basin south of South Island (Weissel et al. Citation1977; Kamp Citation1986a; Keller Citation2004; Hayes et al. Citation2009; Shuck et al. Citation2021). During the Late Cretaceous through to the Oligocene a broad coastal plain and shoreface accumulated with water depth increasing to the northwest and north where sandstone passes into mudstone facies (King and Thrasher Citation1996) ().
Figure 2. Map showing restoration of the New Zealand continent at 27 Ma. The deformation associated with the modern Australia-Pacific plate boundary zone has been restored by conserving the area of continental crust. Present-day latitude and longitude are in an Australia plate frame of reference. The map also shows the initial (43–30 Ma) Australia-Pacific plate boundary zone through western New Zealand and its different tectonic character from seafloor spreading in the south (Emerald Basin) to continental rifting in western South Island and southern Taranaki Basin, to a foreland basin in northern Taranaki Basin, to foreland inversion in Reinga Basin, which passes into east verging subduction east of New Caledonia (not shown). The nascent Hikurangi Margin from c. 29–26 Ma is shown along the East Coast of the future North Island and Marlborough.
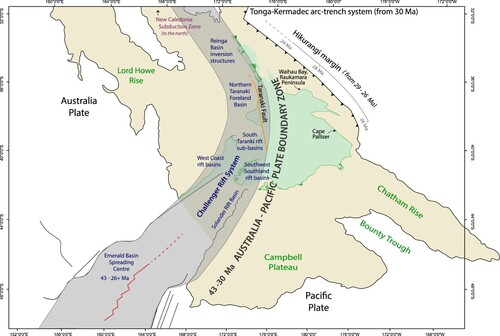
Figure 3. Simplified geological map of the northwest Nelson region compiled from Rattenbury et al. (Citation1998), Rattenbury et al. (Citation2006) and Nathan et al. (Citation2002), showing the distribution of plutonic suites within the Median Batholith (Separation Point, Rahu, Darran and Tobin), the Karamea Batholith, and the Takaka and Buller terranes, as well as Late Cretaceous and Cenozoic sedimentary rocks. The black dots mark the location of rock samples used in this study and their sample numbers.
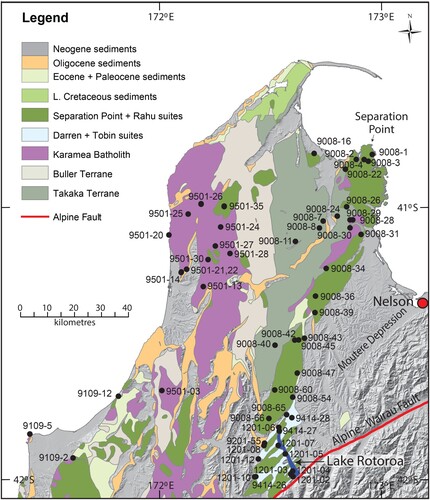
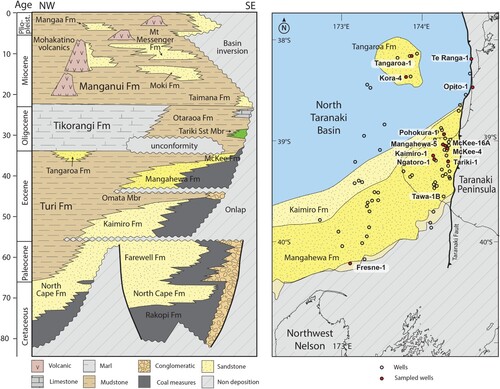
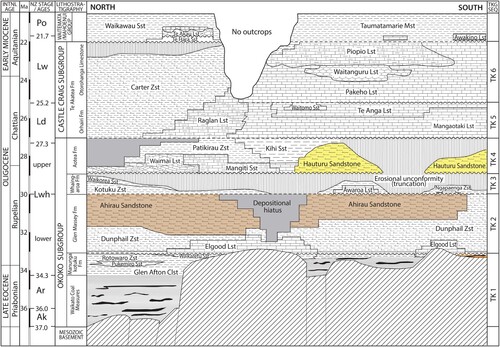
Figure 4. A chronostratigraphic chart illustrating the formational stratigraphy and facies distribution for a SE to NW cross-section in Taranaki Basin modified from NZPM (Citation2014, p. 29). To the right is a Late Eocene (35 Ma) simplified paleogeographic map of Taranaki Basin also from NZPM (Citation2014, p. 25). The facies key applies to both figures. This map shows the limits of the Early Eocene Kaimiro and Mangahewa formations, comprising coastal plain and shoreface sediments. Taranaki Fault is shown in its present-day position. Petrographic data for Late Cretaceous through to Early Oligocene sediments in Taranaki Basin (e.g. Higgs and King Citation2018; Smithies et al. Citation2019) show that the NW Nelson region was the likely source area of sediment supplied to Taranaki Basin during that interval. Paleogeographic maps (Strogen Citation2011) infer river systems infilling asymmetrical rift basins in southern Taranaki Basin during the Late Cretaceous, followed during the Paleogene by the development of a coastal plain, in which sand was transported by longshore drift from NW Nelson to Taranaki Peninsula. We report and interpret zircon U–Pb age data for the Late Cretaceous North Cape Formation and the Late Eocene to Oligocene Turi, Mangahewa, McKee, Tangaroa and Otaraoa formations in Taranaki Basin. The depositional age of sediments in New Zealand basins are mostly dated biostratigraphically with reference to New Zealand stages, the boundaries of which have been correlated to the numerical timescale (Cooper Citation2004; Raine et al. Citation2015).
During the Late Eocene and Oligocene the Taranaki Fault Zone became active as a thrust fault along the eastern margin of Taranaki Basin north of Taranaki Peninsula (King and Thrasher Citation1996; Stagpoole and Nicol Citation2008). The more southern and broader Taranaki Fault System () originated during the Late Oligocene concurrent with the development of southern Taranaki Basin as a foreland basin (Bull et al. Citation2018), which accumulated predominantly mudstone (Manganui Formation). During the Late Miocene the fault system in southern Taranaki Basin migrated into the foreland basin and across NW Nelson, inverting prior basins as well as the sense of throw on their normal boundary faults (e.g. Kamp and Green Citation1990; Kamp et al. Citation1996; King and Thrasher Citation1996; Crowhurst et al. Citation2002; Ghisetti et al. Citation2014, Citation2016; Reilly et al. Citation2015).
Continental rifting north of Emerald Basin involved the Solander Basin (Shuck et al. Citation2021) and basins in Westland (Laird Citation1968; Nathan et al. Citation1986; Kamp Citation1986b; Kamp et al. Citation1996; Riordan et al. Citation2014; Ring et al. Citation2021) () as well as in southern Taranaki Basin (King and Thrasher Citation1996; Strogen et al. Citation2014). Late Eocene – Early Oligocene crustal shortening is well described along the eastern margin of North Taranaki Basin where it is mainly expressed as a marked increase in bathymetry (Morgans et al. Citation2007) and westward over-thrusting of sheets of Murihiku Supergroup within the Taranaki Fault Zone (King and Thrasher Citation1996; Campbell et al. Citation2003; Bierbrauer et al. Citation2008; Stagpoole and Nicol Citation2008). These observations led King (Citation2000) to place the contemporary Australia-Pacific Plate Boundary reconstruction pole in southern Taranaki Peninsula.
Farther north in the Reinga Basin across to the eastern margin of New Caledonia Basin, Late Eocene – Early Oligocene inversion on boundary faults has been documented by Bache et al. (Citation2012), Etienne et al. (Citation2018) and Orr et al. (Citation2020). North of the Reinga Basin, ocean-continent subduction occurred at the New Caledonia Subduction Zone (Schellart et al. Citation2006; Van de Lagemaat et al. Citation2018, Citation2023). Accordingly, we interpret the initial (43–30 Ma) Australia-Pacific plate boundary zone through Zealandia as including this south to north diversity of tectonic features – seafloor spreading in the south to subduction in the north ().
Furlong and Kamp (Citation2013) incorrectly illustrated the plate boundary zone at 43–30 Ma as passing from Emerald Basin northeastward through central New Zealand, exiting through the East Coast Basin. They used the Keller (Citation2004) poles derived from transform faults in the Emerald Basin, assuming that the seafloor spreading ridge and the axis of the continental rift would lie on the same great cycle, as implied in plate tectonic theory. More recently, other workers have derived stage poles describing seafloor spreading in the Emerald Basin and their poles are also located in the vicinity of the East Coast Basin or farther offshore (e.g. Seebeck et al. Citation2023). Despite the location of these various stage poles, we now regard the zone of continental extension that passes northward into shortening to have been located through western New Zealand, having diverged westward from the trend of the spreading ridge in the Emerald Basin. In South Island and north to Taranaki Peninsula, this initial plate boundary zone lies within the Western Province, whereas north of the Peninsula, it lies across both the Western Province and, in places, western parts of the Eastern Province (Murihiku Supergroup). Thus the initial plate boundary zone through continental New Zealand exploited pre-existing and favourably striking fault zones. From 30 Ma, the initial Australia-Pacific plate boundary zone through western New Zealand shifted east, forming the southern Tonga-Kermadec subduction zone, which connected southward with the Hikurangi subduction zone along the ocean-continent boundary offshore of Northland and the East Coast of North Island (Kamp Citation1986b; Herzer and Mortimer Citation1998; Mortimer et al. Citation1998; King Citation2000; Van de Lagemaat et al. Citation2022, Citation2023) ().
King Country Basin
The northern part of the King Country Basin, located immediately east of the Taranaki Fault Zone, accumulated Waikato Coal Measures during the Late Eocene (Early Kaiatian and Runangan stages c. 39.1–34.6 Ma) ( and ) (Edbrooke et al. Citation1994). During the Oligocene the basin became regionally extensive, accumulating shelf marine mixed siliciclastic and carbonate facies of the Te Kuiti Group () (Nelson Citation1973; Citation1978; Kamp et al. Citation2014). During the earliest Miocene (Late Waitakian and Otaian stages, c. 23–18.7 Ma) the basin rapidly subsided from shelf to bathyal depths, accumulating mudstone facies of the Mahoenui Group () (Nelson and Hume Citation1977).
Figure. 5. Chronostratigraphic chart for the Te Kuiti Group in northern King Country Basin between Awakino Gorge in the south and Port Waikato in the north (from Kamp et al. Citation2014). Highlighted are the Ahirau Sandstone Member and the Hauturu Sandstone Member, both sampled for zircon U–Pb geochronology in this study.
NW Nelson Cretaceous – Cenozoic sedimentary cover rocks
In NW Nelson, eroded remnants of Late Cretaceous to Eocene strata, including coal measures, overlie basement on the margins of basins whereas Late Oligocene sandstone and limestone facies occur farther inland along fault-bounded valleys (Rattenbury et al. Citation1998, Citation2006). The strata in north-westernmost South Island, immediately south of Farewell Spit and in the Golden Bay area, are part of the Taranaki Basin succession (King and Thrasher Citation1996; Strogen et al. Citation2014) (). These cover rocks provide key stratigraphic constraints for inverse thermal history modelling of apatite fission track data derived from basement samples in this study.
Results
Our dating methods and analytical details are described in Supplementary File 1, which also includes sample location details, stratigraphic logs, tabulated fission track results, and text additional to the main text in the paper. Files 2–8 contain spreadsheets of U-Pb data and figures for NW Nelson basement units, and Taranaki and King Country basin sediments. File S8 is a table of AFT erosion amounts for NW Nelson and S9 contains U–Pb age standards results.
Separation Point Suite zircon U–Pb and ZFT ages
We acquired 18 zircon U–Pb ages from the SPS (). Twelve samples are from the main outcrop belt between Separation Point in the north and Mt Murchison in the south (9008-1, -3, -22, -34, -36, -39, -45, -47, -54, -60, -66 and 9201-55), with one sample (9501-35) located to the west and a further six samples are from SPS intruding the Rotoroa Complex in the vicinity of Lake Rotoroa () (1201-3, -5, -6, -8, -12, and 9414-27). The primary zircon U–Pb data and plots are available in Supplementary File 2.
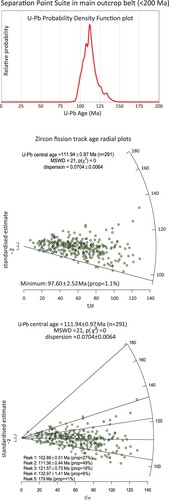
An aggregate of the individual zircon U–Pb age data across the 12 SPS samples from the main outcrop belt shows a dominant Early Cretaceous peak at 110.4 ± 0.19 Ma, together with four minor components with much older (inheritance) age (Supplementary 2). A second aggregate analysis and plot, across a more limited range of crystal ages (<200 Ma), enables detail to be revealed in the age structure of the younger plutons (). This analysis yields three component ages within the SPS for the main outcrop belt of 102.9 ± 0.5 Ma, 111.6 ± 0.4 Ma and 121.6 ± 0.7 Ma (). The 133.0 ± 1.4 Ma and 180.0 ± 9.5 Ma age components are xenocrysts that overlap with Darran Suite magmas.
Figure. 6. Zircon U–Pb probability distribution for Separation Point Suite age data <200 Ma from samples collected from the main outcrop belt between Separation Point and Mt. Murchison in the south (). The two radial plots are for the same data, one showing the minimum age and the other, five component ages. The younger three age components are attributed to the Separation Point Suite and the other two are SPS xenocrysts that appear to have Darran Suite ages. The full age distribution is illustrated in S2. The end of SPS magmatism, as judged from modern surface samples, is inferred here to be 102.9 ± 0.5 Ma from the youngest component age. The radial plots were prepared with IsoplotR (Vermeesch Citation2018).
In the vicinity of Lake Rotoroa, where the Separation Point Suite has intruded the Rotoroa Complex (), zircon U–Pb age data for the six SPS samples show youngest component ages in the range 119 ± 1.5 Ma to 125 ± 0.8 Ma (S2). An aggregate of the six SPS samples yields a youngest component age of 124.1 ± 0.6 Ma. The four older age components (143.0 ± 0.4 Ma; 197.4 ± 15.0 Ma; 291.0 ± 6.8 Ma and 342.9 ± 3.5 Ma) amounting to 25.6% of the crystals analysed, are xenocrysts.
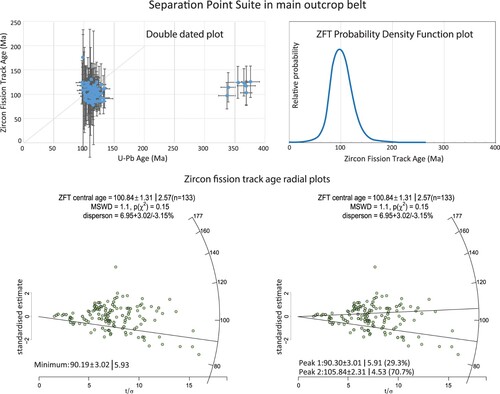
Double dating (DD) was undertaken on zircon crystals from seven samples (9008-1, 3, 22, 36, 45, 54; 9201-55) of the SPS in the main outcrop belt (), one sample of an SPS outlier to the west (9501-35), and one sample of SPS intruded into the Darran Suite (9414-27). An aggregate plot of 206Pb/238U and zircon fission track ages (‘DD plot’) for the SPS main outcrop belt shows two clusters, one with mid Cretaceous U–Pb and ZFT ages, and the other with Late Devonian – early Carboniferous U–Pb ages and mid-Cretaceous ZFT ages (). The ZFT age data for each sample have only one age component (S2). In an aggregate analysis of all of the individual ZFT ages from those samples, the minimum ZFT age is 90.2 ± 3.0 Ma, with two component ages of 90.3 ± 3.0 Ma and 105.8 ± 2.3 ().
Figure. 7. Plot of double-dated (DD) zircon U–Pb and ZFT ages of Separation Point Suite samples (9008-1, -3, -22, -36, 45, 54, 9201-55) in the main outcrop belt, and a probability density function plot of the ZFT ages represented in the DD plot. In the lower level are two related ZFT radial plots, one showing the minimum age and the other two age components in the distribution.
The DD plot for sample 9414-27 (S2) has two zircon U–Pb age components (120.6 ± 1.1 Ma and 126.8 ± 0.8 Ma) and one ZFT age component (96.8 ± 2.4 Ma) (Supplementary 2), which is statistically within the cooling age of the main SPS outcrop belt (). Separation Point Suite sample 9501-35 () has a tight Cretaceous DD cluster and two zircons with older U–Pb and ZFT ages (Supplementary 2). One has a U–Pb age of 571.0 ± 3.2 Ma and a ZFT age of 234.5 ± 59.5 Ma; the other has a U–Pb age of 733.0 ± 51.0 Ma and a ZFT age of 186.1 ± 47.6 Ma.
Darran Suite zircon U–Pb and ZFT ages
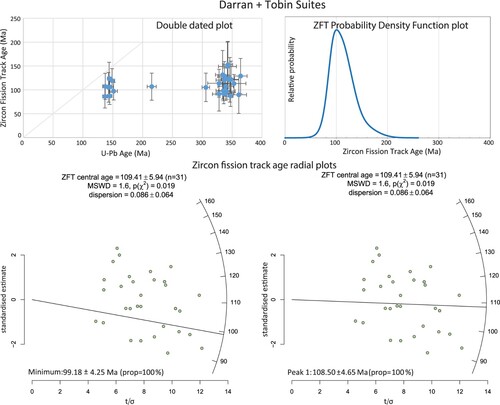
The results of four new zircon U–Pb ages for the Darran Suite in the Lake Rotoroa area of NW Nelson are given in Supplementary 3. The dominant age components in the Darran Suite samples are: 140.1 ± 0.8 Ma (1201-2), 144.8 ± 1.0 Ma (1201-7), 143.5 ± 0.8 Ma (9414-28) and 204.2 ± 1.2 Ma (1201-4). There are a few older zircon crystals giving component ages of 165, 215 and 327 Ma in 1201-7, and 321 and 550 Ma in 9414-28. In an aggregate radial plot, the two main component ages are: 143.1 ± 1.0 Ma (63%) and 203.8 ± 2.6 Ma (34%). These Early Cretaceous and Late Triassic ages are similar to those reported by Kimbrough et al. (Citation1993, Citation1994) for the Darran Suite in NW Nelson. Zircon crystals in one sample (9414-28) from the Darran Suite and one sample from the Tobin Suite (9414-26) were double-dated. In the Darran Suite (9414-28) DD plot (), the cluster has a U–Pb age centred on 143.5 ± 0.8 Ma, with the corresponding ZFT ages centred on 107.4 ± 3.9 Ma.
Figure. 8. Plot of double-dated (DD) zircon U–Pb and ZFT ages of Darran and Tobin suite samples 9414-26 and 9414-28 from the vicinity of Lake Rotoroa, and a probability density function plot of the ZFT ages used in the DD plot. The lower level shows two radial plots of ZFT ages, the minimum age in one and two component ages in the other.
Tobin Suite zircon U–Pb and ZFT ages
The dominant component age in three samples within the Tobin Suite from the Median Batholith in the vicinity of Darran Suite rocks in the Rotoroa Complex (Supplementary 3) are 328.4 ± 2.0 Ma (Sample 1201-10), 321.7 ± 1.0 Ma (9008-65) and 337.1 ± 2.3 Ma (9414-26). In an aggregate radial plot for the Tobin Suite samples, the three main component ages are: 323.1 ± 2.2 Ma (51%); 345.4 ± 2.8 Ma (29%); and 311.2 ± 2.9 Ma (17%). These sample and component ages overlap with the range of published ages for the Tobin and Ridge suites noted earlier, with some being younger than this age range. As the Tobin Suite has a younger age limit than the Ridge Suite, we follow earlier work (Kimbrough et al. Citation1993) in classifying these samples in the Rotoroa Complex as Tobin Suite. In the DD plot (S3) there is a 215.5 ± 3.7 Ma U–Pb single crystal U–Pb age that originates from Darren Suite material introduced during the Late Triassic. The main cluster in the DD plot comprises two age components (337.1 ± 2.3 Ma and 349.3 ± 2.0 Ma) (). The ZFT age is centred on 109.1 ± 2.9 Ma.
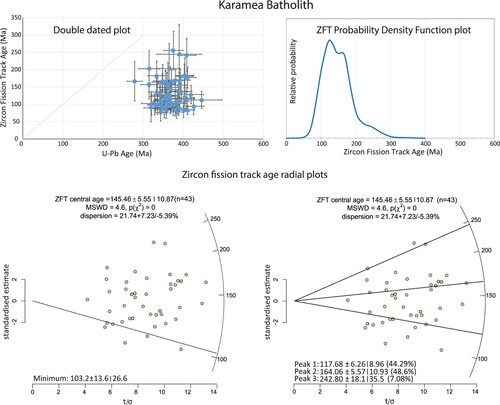
Karamea Batholith and Foulwind Suite U–Pb and ZFT ages
Zircon crystals from four samples of the Karamea Batholith (9008-30, 9501-14, 9501-26, 9109-5) were double-dated. The age data for individual samples, including a DD plot and radial plots for U–Pb and ZFT ages, are available in Supplementary 4. A combined DD plot of these data shows a distinct cluster with U–Pb ages mostly in the range 300–420 Ma and ZFT ages mostly between 90 and 200 Ma (). Sample 9008-30 has one ZFT age component (91.9 ± 2.4 Ma). Sample 9109-5 (Foulwind Suite) also has a young ZFT age component (106.9 ± 4.8 Ma). There is also a much older age component of 173.4 ± 8.0 Ma. Samples 9501-14 and 9501-26 have a similar spread in ZFT ages with three age components from Early Cretaceous to Triassic (S4). Radiation damage in zircon crystals may have an influence upon fission track annealing (Rahn et al. Citation2004). To test this notion, we calculated the alpha radiation dose for each crystal using an equation in Dröllner et al. (Citation2022), with mildly conclusive results (see text in Supplementary 1 and figures in Supplementary 4).
Figure. 9. Plot of double-dated (DD) zircon U–Pb and ZFT ages of Karamea Batholith samples (9109-5; 9501-14, -26 and-30) and a probability density function plot of the ZFT ages used in the DD plot. In the lower level are two ZFT radial plots, one showing the minimum age and the other, three age components.
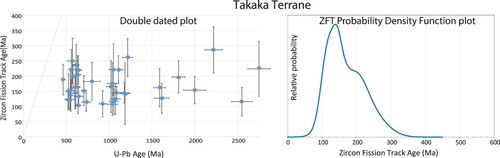
Takaka Terrane U–Pb detrital zircon and ZFT ages
Zircon crystals in three samples from the central part of the Takaka Terrane (Wangapeka Formation quartzite; samples 9008-8 & 9008-40) and the Junction Formation quartzite (sample 9008-11) were double dated (Supplementary 5). The stratigraphic age of the Wangapeka Formation is 450–470 Ma and for the Junction Formation is c. 500 Ma (Rattenbury et al. Citation1998). A double dating plot of the U–Pb and ZFT ages for these samples shows a wide spread of U–Pb ages from 463–2750 Ma with a more limited spread in the corresponding ZFT ages (mid-Cretaceous to Permian) () (S5). Radial plots of the aggregated ZFT data indicate a younger age component of 135.6 ± 9.2 Ma. The other ZFT age component is 217.4 ± 16.8 Ma (S5). The youngest ZFT age component occurs in sample 9008-11 as 135.1 ± 7.9 Ma.
Figure 10. Plot of double-dated (DD) zircon U–Pb and ZFT ages for Takaka Terrane samples (9008-08, -11 and -40) and a probability density function plot of the ZFT data used in the DD plot.
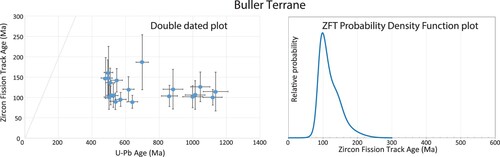
Buller Terrane U–Pb detrita zircon and ZFT ages
One sample (9109-2) of Buller Terrane (Ordovician Greenland Group) sandstone from a locality immediately north of the Buller River in the Lower Buller Gorge () was double-dated in this study. The resulting plot () shows a wide spread of U–Pb ages from 481–1136 Ma with ZFT age components of 100.6 ± 4.2 and 140.2 ± 9.6 Ma (S6). Sixty one percent of the ZFT grain ages occur in the younger age component (100.6 ± 4.2 Ma) that we infer to have been totally annealed leading up to the peak in burial of its host rock. This age is the same as the c.100 Ma peak of extension in the Paparoa Core Complex, exposed in the Paparoa Range immediately south of the lower Buller River (Tulloch and Kimbrough Citation1989; Spell et al. Citation2000). The second ZFT age component is interpreted to comprise partially annealed ZFT ages.
Figure 11. Plot of double-dated (DD) zircon U–Pb and ZFT ages of Buller Terrane sample (9109-2) and a probability density function plot of the ZFT ages used in the DD plot.
Paleogene exhumation across northern NW Nelson from apatite fission track analysis
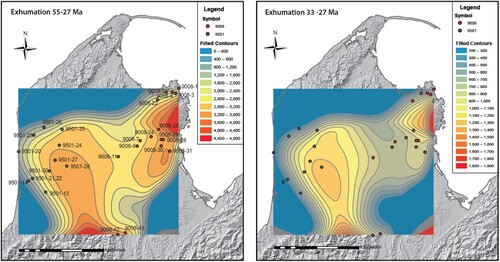
We report apatite fission track results for 29 samples of basement rocks from northern NW Nelson ( and Supplementary 1). The AFT ages range from 30.0 +/- 4.0 to 79.6 +/- 6.2 Ma. The sample mean track lengths range from 13 to 15 microns (, see the table in Supplementary 1 and track length distributions in Supplementary 8). As there are track lengths as short as 10 microns in many sample distributions, the Late Cretaceous and Paleogene AFT ages are partial ages with no direct meaning in terms of the timing of a geological event. This information, in particular the timing and magnitude of sample host rock exhumation, has been derived from the AFT data by inverse modelling described in Supplementary 1. The models in all cases show that the track length shortening mainly arises from an early Neogene (23–10 Ma) phase of burial heating. A table of the exhumation values for each of the AFT sample sites covering the periods 55–27 Ma and 33–27 Ma is available in Supplementary 1. These values have been contoured using a kriging algorithm in GIS ().
Figure 12. Thermal history plots from apatite fission track analysis (AFT) and inverse modelling using HeFTy software for two Separation Point Suite samples (9008-3 and 9501-35), showing the Late Cretaceous to present-day Time-temperature modelled best path (in black) and the average path (in blue). Inset: histograms of AFT length distributions as measured in the respective samples and the inverse model as a curve superimposed on the histogram. The age of the start of cooling is set at temperature and time values well before it is constrained by apatite fission track data (c. 110 - 100°C) and depends upon the measured age and track length distribution for each sample. Cooling of the basement sample host rocks, achieved by exhumation, is constrained from about 55 Ma until 27 Ma. Note the episode of burial heating from c. 27 Ma until the Late Miocene, which represents sediment accumulation in a marine basin above the basement sample site. A second episode of cooling due to erosion mainly of the basin sediments, started during the Late Miocene and has continued to the present day. It has resulted in late re-exhumation of basement units to the surface across most of NW Nelson.
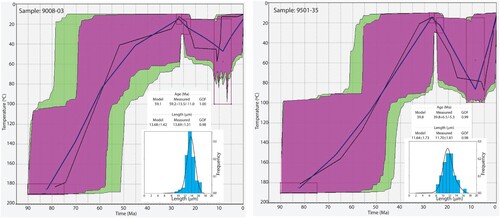
Figure 13. Maps showing estimates of the distribution of erosion for 55–27 Ma and 33–27 Ma across NW Nelson derived from inverse modeling of apatite fission track data for basement samples (see Table in S8 for the exhumation value for each sample). The uneven distribution of the sample locations within the modelled area, together with the samples not having extended to the natural boundaries of the exhumed area, mean that the contour maps show model artifacts and therefore only give a general indication of the distribution and amount of Eocene to Early Oligocene exhumation and erosion. The two belts of more marked exhumation coincide with the Pikikiruna and the broader Haupiri Dome (Lillie Citation1980), which may reflect more marked Late Neogene erosion of basement.
Detrital zircon U–Pb and ZFT ages from Taranaki and King Country basins
Late Cretaceous North Cape Formation
Zircon grains from three North Cape Formation samples (8694-9, -11 & -14) were double dated by U–Pb and ZFT methods. These samples were obtained from Fresne-1, located in the southern Taranaki Basin () and from depths of 1049 to 2480 m below the drilling platform (Supplementary 1). The sample lithology is conglomeratic sandstone, which accumulated close to the Whakaramarama Fault that bounded a Late Cretaceous – Paleocene rift basin. The age of the North Cape Formation lies in the upper part of the Haumurian Stage (83.6–66.0 Ma). The zircon U–Pb and ZFT age data and individual sample figures (PDP and radial plots) illustrating them are available in Supplementary 7.
The three Fresne-1 samples show similar zircon U–Pb age distributions and hence we illustrate all of their grain age data (n = 162) in an aggregated PDP and in radial plots (). The youngest age component is 114.0 ± 0.5 Ma (52% of grains), followed by 151.9 ± 1.0 Ma, (25%), 288.3 ± 4.0 Ma (5%), 340.8 ± 2.3 Ma (16%) and 511.4 ± 15.6 Ma (2%). Adams et al. (Citation2017) reported zircon U–Pb age data (n = 28) for one sample from Fresne-1 (North Cape Formation). These data have a minimum age of 100.8 ± 3.2 Ma and age components of 111.5 ± 0.9 Ma, 132.5 ± 0.6 Ma, 159.3 ± 1.1 Ma and 283.2 ± 3.1 Ma (Supplementary 7).
Figure 14. Aggregate detrital zircon U–Pb ages for three samples (8694-9, -11 and -14) from the Late Cretaceous North Cape Formation. Drill hole Fresne-1 is located in southern Taranaki Basin (). The detrital zircon U–Pb ages are illustrated as a probability density function plot as well as in two radial plots, one showing the minimum U–Pb age and the other, five U–Pb age components within the distribution.
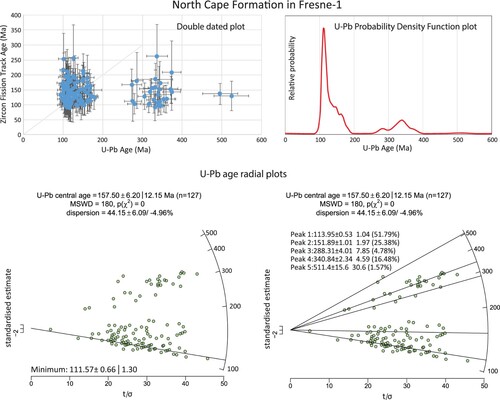
The double dating plot () for the Fresne-1 samples reported here shows three clusters. Of the 133 ZFT ages in the DD plot, four of them lie outside 2s error and a further four are within a few million years of lying within 2s. The second cluster has Carboniferous and Devonian ages. The third cluster, with data for just two grains, has ages around 500 Ma.
Late Eocene to mid-Oligocene Taranaki and King Country basin strata
We processed 30 samples from Late Eocene to Oligocene sandstone units from the Taranaki and King Country basins and one sample from the Wellington region (). Seven samples (2021-14; 2021-25 to 28; 2021-30 & 31) were obtained from Late Eocene to Early Oligocene well-sorted medium quartzofeldspathic sandstone facies that accumulated on the contemporary Taranaki Basin coastal plain () (see Taranaki Basin well logs for sample positions in Supplementary 1). Eight samples (2021-15 to 20; -23 & -24) with essentially the same texture were obtained from the Late Eocene and earliest Oligocene Tangaroa Formation submarine fan and correlative sandstone beds in northern Taranaki Basin () (S1, Taranaki Basin well logs), considered to have been sourced from the coastal plain to the south (King and Thrasher Citation1996). Three samples (2021-11 to -13) (S7) were collected from the Late Oligocene Tariki Sandstone Member (Otaraoa Formation), which accumulated in submarine fans along the eastern margin of Taranaki Basin during the Late Oligocene (de Bock et al. Citation1990). Three sandstone samples of Late Eocene age (2021-21, -22 and -29) were collected as unwashed cuttings (from Opito-1 and Te Ranga-1) from sedimentary rocks sandwiched between basement thrust sheets in the Taranaki Fault Zone () (S1, Taranaki Basin logs).
From the King Country Basin, we collected and processed seven samples () (Supplementary 1, see Te Kuiti Group outcrop logs for sample positions). Four of them (2021-4 to 7) comprised moderately sorted, fine calcareous grey sandstone from the Ahirau Sandstone Member and two of well-sorted fine calcareous yellowish sandstone from the Hauturu Sandstone Member (2021-2 & -3) () (Kamp et al. Citation2008). In addition, we collected sample 2021-8 from Oligocene quartz sandstone in the Waikato Coal Measures in southern King Country Basin east of Taumarunui (), and samples 2101-9 & 10 of quartz sandstone from the Oligocene Otaihanga outlier located north of Wellington () (Begg and Johnston Citation2000). The sample locations are given in Supplementary 1 and zircon U–Pb age data in S7.
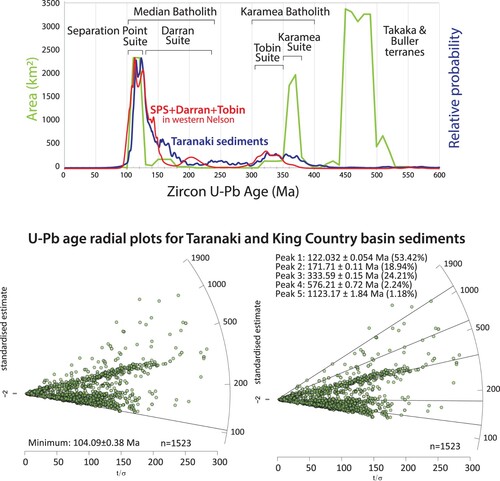
shows the detrital zircon U–Pb ages (n = 1523) in a series of PDPs for Late Eocene and Oligocene Taranaki and King Country formations arranged in stratigraphic order. The zircon U–Pb age content of the Ahirau Sandstone Member differs from other sample data illustrated in in having high frequency peaks in the 150–300 Ma age range. The otherwise close similarity in the age spectra between the various formations and members is shown by (i) the dominance of a young U–Pb age peak (103–124 Ma), (ii) a second peak of older ages (130–235 Ma), (iii) peak(s) between c. 300–400 Ma, and (iv), the occurrence of U–Pb ages older than 400 Ma. These peak U–Pb ages are consistent with the five age components revealed in the radial plot in . The radial plot shows that 53% of the grain ages align with the age of the SPS, 19% with the Darran and Tobin Suite, 24%, with the Karamea Batholith, and ∼4% with the Buller and Takaka terranes. The minimum zircon U–Pb age across the 1523 detrital grains analysed is 104.1 ± 0.4 Ma.
Figure 15. A stack of detrital zircon U–Pb age probability density function distributions for samples from Late Eocene to Oligocene formations in Taranaki and northern King Country basins, arranged in stratigraphic order. Each distribution represents an aggregate of zircon U–Pb age data for two or more samples, except for the Turi Formation, for which only one sample was analysed. The samples aggregated into each distribution are shown in a table in S1. Sample 2021-2014, from the Matapo Sandstone Member (Ngatoro-1), has a different U-Pb age spectra to the other Taranaki Basin samples, possibly reflecting its origin as a transgressive systems tract (King and Thrasher Citation1996) and hence it was not included in this figure. The vertical grey bands mark the age range of the Separation Point Suite (c. 124–103 Ma) and the Karamea Batholith (c. 400–300 Ma) in NW Nelson.
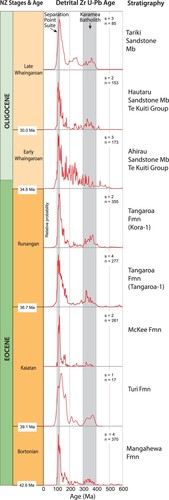
Figure 16. Comparison of NW Nelson sample zircon U–Pb ages obtained in this study from the Median Batholith (Separation Point, and Darran suites), and the Karamea Batholith (Tobin and Karamea suites), shown in the red curve, with detrital zircon U–Pb ages from Taranaki and King Country basin sediment samples in the blue curve. Both curves are aggregate probability density function plots of the ages for their respective samples. The areas of exposed plutonic suites and basement terranes in NW Nelson are shown in the green curve, those areas derived from QMaps (Rattenbury et al. Citation1998, Citation2006; Nathan et al. Citation2002) north of 42 degrees south, and west of Nelson City (). There are two radial plots with aggregated zircon U–Pb ages of Taranaki and King Country sediment samples shown as a stack of probability density function plots in . One radial plot shows the minimum detrital U–Pb age, calculated by the maximum likelihood method (Galbraith Citation2005), and the other shows five detrital U–Pb age components calculated from the distribution by the normal likelihood method (Galbraith and Laslett 1993).
Late Eocene sediments within the Taranaki Fault Zone
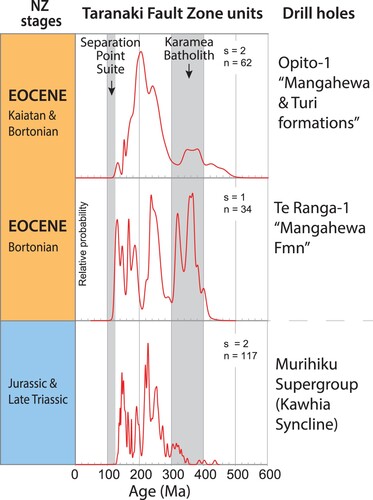
Late Eocene sedimentary rocks considered correlatives of the Turi and Mangahewa formations in Taranaki Basin are sandwiched between basement Murihiku Supergroup thrust sheets in the Taranaki Fault Zone (King and Thrasher Citation1996; Bierbrauer et al. Citation2008), and were intersected in Te Ranga-1 (sample 2021-29) and Opito-1 (samples 2021-21 and 22) drill holes (; Supplementary 1). illustrates aggregated PDPs of the age distributions in these formations. No 103–124 Ma U–Pb zircon grain ages occur in these formation data. Devonian - Carboniferous zircon U–Pb ages do occur, but with different relative abundances from those observed in the Taranaki Basin dataset (). Zircon ages corresponding to those of the Darran Suite (235–130 Ma) occur in variable abundance between samples, which is uncharacteristic of the pattern in the Taranaki Basin data. When compared with the zircon U–Pb ages from Murihiku Supergroup basement reported in Adams et al. (Citation2007, samples Plox5, Hurw4), there is a reasonable similarity with the zircon U–Pb age distributions for the Turi and Mangahewa formations, although there are some differences such as the absence of the Early Cretaceous peak at c.145 Ma in the Murihiku spectra. Nevertheless, there are marked differences between the age distributions for the Turi and Mangahewa formations in Opito-1 and Te Ranga-1 () versus the age spectra in the grand aggregate PDP for Late Eocene to Oligocene zircons from the Taranaki and King Country basin samples ().
Figure 17. Aggregated detrital zircon U–Pb ages in a probability density function plot of a sample from each of the Mangahewa Formation and the Turi Formation, both from Opito-1. Below it is a similar plot of detrital zircon U–Pb ages for a Mangahewa Formation sample from Te Ranga-1 … The spectra in each of those two plots can be compared with a detrital zircon U–Pb age distribution of the Murihiku Supergroup sediment samples from sites in the Kawhia Syncline (data from Adams et al. Citation2007). The grey bands mark the age range of the Separation Point Suite (c. 124–103 Ma) and the Karamea Batholith (400–300 Ma).
Oligocene quartzite in two western North Island outliers
There are at least two occurrences of Oligocene quartzose sediments in western North Island, one known as the Otaihanga Outlier, located north of Wellington (Begg and Johnston Citation2000), and another occurring as facies within the Waikato Coal Measures in outcrops east of Taumarunui (Cartwright Citation2003) (). The reason for undertaking zircon U–Pb analyses on samples from these sites was to establish whether or not these sandstone units could be part of an Oligocene sediment pathway northward from NW Nelson to the Te Kuiti Group sandstone members.
At the Otaihanga locality, a 2–3 m-thick quartzite bed (sample 2021-9) unconformably overlies Rakaia Terrane basement (Begg and Johnston Citation2000). This quartzite is overlain by a 60 m-thick grey-green glauconitic silty sandstone succession (Muaupoko Greensand; sample 2021-10). The U–Pb age distribution of these two samples are similar (S7). An aggregated probability distribution for them () and a comparative detrital zircon U–Pb age PDP of the underlying Rakaia Terrane basement for a site nearby at Otaki Forks from data reported in Adams et al. (Citation2007, sample OTQ1), show that samples 2021-09 and 2021-10 have the Late Permian – Triassic age peak (200–270 Ma), and peaks of 380–320 Ma and 600–450 Ma, characteristic of the Rakaia Terrane. Features common to the basement zircon U-Pb age spectra of NW Nelson, such as the Early Cretaceous (c. 124 - 103 Ma) and the Early Cretaceous – Triassic (235–130 Ma) age groupings are completely absent.
Figure 18. In the uppermost panel is as aggregated probability density function plot of detrital zircon U–Pb ages of a sample from each of the Otaihanga Quartzite and the Muaupoko Greensand from a site at Paraumu, north of Wellington (). Below it is a similar plot of U–Pb ages of a sample of Rakaia Terrane basement from Otaki Forks (data from Adams et al. Citation2007). The grey band from 260–200 Ma is the main Rakaia Terrane peak. Below that is a probability density function plot of detrital zircon U–Pb ages of a quartz sandstone sample of Waikato Coal Measures from a site east of Taumarunui. This age spectra compares closely with that for detrital zircon U–Pb ages of a sample of Early Cretaceous Waipapa Terrane basement in the Waikato region (data from Adams et al. Citation2013a). The 260–200 Ma grey band is the main recycled Rakaia Terrane peak and the 130–180 Ma grey band defines detrital zircon U–Pb ages originally derived from the Darran Suite into the Waipapa Terrane, which were recycled during the Oligocene into the Waikato Coal Measures.
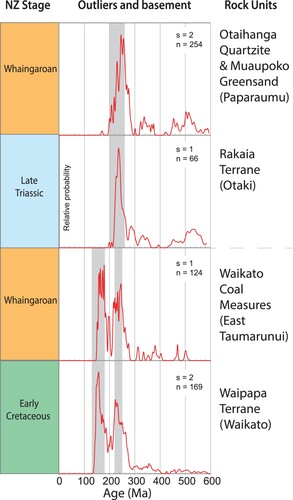
The quartzite at the base of the Waikato Coal Measures east of Taumarunui has a thickness of up to 5 m (Cartwright Citation2003) and this unit unconformably overlies Waipapa Terrane basement (Edbrooke Citation2005). shows a zircon U–Pb age PDP plot for the quartzite sample data (2021-08) (S7), together with comparative data from Adams et al. (Citation2013a, samples TWXX1, TPWX1, RGPX2) for the Waipapa Terrane basement in the Waikato Region. The Late Permian-Triassic age peak (250–220 Ma) is common to both the coal measure sample data as well as the basement data. The Jurassic – Early Cretaceous zircon U–Pb age peak (180–140 Ma) is also common to both data sets but lacks the younger Cretaceous zircon ages observed in other datasets.
Discussion
Sediment sources: exhumation of the Separation Point Suite and its duration
The abundance of Separation Point Suite-aged zircon in the Taranaki and King Country basin formations requires an actively eroding source for a long period. Here we consider the factors that led to this duration. Firstly, we establish the timing of the start of sediment supply from the SPS, which is best judged from the stratigraphic age of the first appearance of zircon grains with SPS U–Pb ages. This occurs in the Pahau Terrane (Mortimer Citation2004) in North Canterbury-Marlborough and eastern North Island. The inboard Pahau Terrane in North Canterbury has an Aptian (125–113 Ma) stratigraphic age (Edbrooke Citation2017) and contains zircon U–Pb grain ages of 119 ± 4 Ma (12% of age distribution) and 118 ± 3 Ma (8%), respectively, for the Adams et al. (Citation2013b) samples 26 and 28. Inboard Pahau samples in eastern North Island yield 121 ± 1 (19%) and 118 ± 1 Ma (36%) ages for the Adams et al. (Citation2013b) samples 9A and 9B, respectively. Ages for several outboard Pahau samples from Marlborough are in the age range 114–104 Ma and for eastern North Island are 114–100 Ma (Cawood et al. Citation1999; Adams et al. Citation2013b). Active erosion of the SPS was therefore ongoing from a minimum age of 113 Ma until 27 Ma, a minimum duration of 86 m.y, based on the combined zircon U–Pb age provenance records in the Early Cretaceous Pahau Terrane and the Late Cretaceous to Oligocene formations of Taranaki Basin.
Secondly, we consider the thickness of the magmatically enhanced SPS crustal thickness. From published SPS sample U–Pb ages for NW Nelson (Kimbrough et al. Citation1994, Citation1994; Muir et al. Citation1994, Citation1995; Bolhar et al. Citation2008a; Scott et al. Citation2014) and new age data reported here, SPS magma emplacement into pre-existing crust in NW Nelson occurred from 124 to 103 Ma. This compares with 129–105 Ma in Fiordland and Stewart Island, which includes the Western Fiordland Orthogneiss (Kimbrough et al. Citation1994; Muir et al. Citation1995, Citation1998; Tulloch and Kimbrough Citation2003; Klepeis et al. Citation2004; Scott and Palin Citation2008; Allibone et al. Citation2009; Klepeis et al. Citation2016; Schwartz et al. Citation2017). This duration reflects the opportunity to construct a thick crustal root, also known to have occurred for the SPS in Fiordland (e.g. Brown Citation1996; Tulloch and Kimbrough Citation2003; Scott et al. Citation2011). Milan et al. (Citation2017) estimated a thickness for the crustal root of 30 km. Additional information comes from estimates of the depths of SPS pluton emplacement within the crust (27 and 8 km depth; Tulloch and Challis Citation2000), although this may relate more to the amount of exhumation.
Thirdly, we consider the amount of exhumation of the Separation Point Suite in NW Nelson during >113 to 27 Ma. Estimation of the magnitude of exhumation from thermochronology data is complicated in arc settings by (i) the impact of elevated heat flow in the crust from the emplacement of plutons and the difficulty of establishing the time when conductive cooling of plutons gave way to cooling due to exhumation, and (ii), the impact of rapid rates of exhumation upon the advection of heat towards the surface. These features of magmatic arcs impact upon the depth at which various thermochronometers start to accumulate age, so as to determine the amount of exhumation. Comprehensive modelling of these dynamics requires whole of crust thermal modelling (Murray et al. Citation2018), which is beyond the scope of this study and is more typically applied in nonmagmatic terrains to establish the rates of exhumation and landscape evolution (e.g. Braun Citation2003; Furlong et al. Citation2021). Murray et al. (Citation2018) modelled the conductive timescale of cooling from 750°C following pluton emplacement at a mid-crustal level. After about 15 m.y. the conductive temperature anomaly had decayed to prior conditions. Pluton emplacement in the SPS was more complicated than the modelling of a single pluton as multiple plutons where emplaced over a long duration. Here, we necessarily make conservative assumptions with respect to the depth of sample host rocks when ZFT age started to accumulate. We combine those data with the amounts of late cooling from AFT modelling (Ketcham Citation2005).
Our apatite fission track results (; Supplementary 8) indicate 2–2.5 km of erosion of the SPS during 55 to 27 Ma (). As 55 Ma is 47 m.y. after arc magmatism had ended (103 Ma), conductive cooling may have given way to exhumation cooling and hence for the period of AFT modelling (55–27 Ma), the isotherms in the upper crust were close to the present day geothermal gradient value of 29°C/km (Townend Citation1999). To extend the magnitude of SPS erosion farther back in time, we assume a notional and conservative exhumation amount of 2 km across the SPS for the period 124 Ma to 90 Ma; 90 Ma being the minimum age in the main SPS outcrop belt () when zircon fission tracks had started to accumulate age, corresponding to a temperature of 300°C (Supplementary 1: text for the temperature limits of the ZFT partial annealing zone adopted here). For the interval 90 to 55 Ma, the amount of cooling is the difference between 300°C and 80°C (the paleotemperature at 55 Ma – see, for example, the AFT model in , and the AFT erosion table in Supplementary 8). For a geothermal gradient of 30°C/km, the exhumation amount between 90 and 55 Ma could have been 7.3 km. The total exhumation during 113 to 27 Ma would then be 11.8 km. For a more elevated average geothermal gradient of 40°C/km through the 35 m.y. period from 90–55 Ma would give 5.5 km in place of 7.3 km, giving a total exhumation amount of about 10 km. Some 10 km of exhumation is around the upper depth of pluton emplacement for the SPS estimated by Tulloch and Challis (Citation2000). Gravity mapping across NW Nelson shows no current bouguer anomaly along or across the SPS plutonic belt (Reilly Citation1972), which may suggest that any crustal root has since equilibrated to normal crustal thickness of about 28 km for the region.
Summarising this information, the fundamental reason that the SPS in NW Nelson could source substantial amounts of sediment to surrounding basins during an 86 million year-long period (>113–27 Ma) was the development of a thick SPS crustal root during the latter part of the Early Cretaceous (124–103 Ma), together with subsequent long-lived isostatic rebound linked to about 10 km of erosion at the surface. An 86 m.y. longevity for a mountain belt is not excessive compared with other mountain belts where the rebound of crustal roots is accompanied by erosion (Fischer Citation2002). During the early part of that period (>113 to 103 Ma) there would have been competition between overall crustal thickening by ongoing magma emplacement and the start of crustal thinning by erosion, resulting in mountainous topography across the region; thereafter, the rate of exhumation and erosion persisted for a period before slowing as the crust overall thinned and buoyance decreased, possibly aided by metamorphic reactions in any remaining crustal root that would increase its density (Fischer Citation2002), and/or other factors such as climate-driven changes in erosion efficiency (Wolf et al. Citation2022). The stratigraphic evidence that the SPS in NW Nelson was at least partially onlapped by shelf marine limestone and sandstone at around 27 Ma (Nathan et al. Citation1986; Rattenbury et al. Citation1998) suggests that by then the SPS crust had equilibrated to normal crustal thickness and its mountainous topography had been reduced to one of low relief. Subsequent crustal loading to the east at the boundary of the Western and Eastern provinces from about 27 Ma, enabled coastal marine onlap of the SPS and adjacent basement units to occur. From 12–10 Ma, stresses driven by ongoing crustal shortening to the east from evolution of the modern plate boundary, started to invert the Taranaki foreland basin, as well as the basement more widely across NW Nelson (Kamp and Green Citation1990; Kamp et al. Citation1996; Crowhurst et al. Citation2002; Ghisetti et al. Citation2014, Citation2016) (), leading to incision of the Late Oligocene basement erosion surface and the present topography.
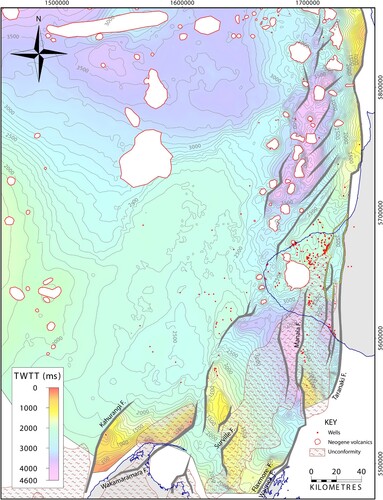
Figure 19. Structure Contour map of Taranaki Basin, showing TWTT (ms) to the Early Whaingaroan erosion surface and its correlative conformity. This map was prepared from an in-house Todd Energy database. In some areas the erosion surface (named unconformity in the map Key) is mapped as the top of the underlying stratigraphic unit and elsewhere as the base of the overlying stratigraphic unit, depending upon the more pronounced reflector marking the erosion surface. In the Taranaki Peninsula area the structure contour surface is the top Mangahewa Formation and in southern Taranaki Basin the surface is the top Kapuni Group or Pakawau Group, or top of basement progressively farther south from Taranaki Peninsula. Beyond the erosion surface in southern Taranaki Basin, the surface mapped is the base of the Late Oligocene (Waitakian) horizon; in North Taranaki Basin and elsewhere it is the base of the Oligocene horizon following King and Thrasher (Citation1996).
Sediment sources: exhumation outboard of the SPS
In NW Nelson, the Darran Suite and the Tobin Suite that it intrudes lie mainly to the east of the present-day SPS and thus closer to the former trench location. Zircon fission track ages for Darran and Tobin suite samples now at the surface are reset ages of 108 Ma, indicating cooling from about 300°C (the base of the ZFT PAZ) and exhumation of about 10 km between c. 108 Ma, or earlier, and the present day. As zircon grains with Darren Suite U–Pb ages occur in the inboard Pahau Terrane (Adams et al. Citation2013b) their exhumation started during an earlier exhumation phase, well before 108 Ma, as the samples with 108 Ma age should have been at about 10 km depth when zircon from this source first appeared in the Pahau Terrane. Hence, Cretaceous-Cenozoic exhumation of the Darran Suite in NW Nelson could amount to much more than 10 km, and it could have started earlier there than for the SPS. As AFT ages for samples from these suites are reset with Early Miocene ages (P. Kamp unpublished data), there would have been at least 110°C of cooling since 23 Ma (equivalent to 3 km of exhumation for a surface temperature of 20°C and a geothermal gradient of 30°C/km), which diminishes the amount of Early Cretaceous to Late Oligocene exhumation somewhat, but it will be around 10 km. This suggests that the Darran and Tobin suites in eastern parts of NW Nelson were part of the same mountain belt as the SPS and had a similar exhumation and erosion scenario.
Sediment sources: exhumation inboard of the SPS
In the Karamea Batholith, which was inboard from the Cretaceous arc magmatism, sample 9008-30 has a reset ZFT age, indicating cooling to the surface from about 300°C after the mid-Cretaceous for a 30°C/km geothermal gradient. During 55 to 27 Ma, the sample host rock was exhumed by about 2.6 km (S8 table), leaving 7.4 km of exhumation between the ZFT age of c. 92 and 55 Ma. The other two samples cooled by c. 270–260°C to the surface from residence initially within a ZFT PAZ, amounting to total exhumation of about 8.8 km, probably from c. 92 Ma onwards. The exhumation amounts during 55 to 27 Ma are 1.2 km for 9501-14 and 0.8 km for 9501-26 (Supplementary 8 table). For an average of 1.0 km across these two samples host rocks and a surface temperature of 20°C and geothermal gradient of 30°C/km, the exhumation amount during 92 to 55 Ma was 7.8 km. The development of a ZFT PAZ implies stable thermal conditions and minimal exhumation prior to the mid-Cretaceous. Beyond the Cretaceous – Paleogene exhumation, the Karamea Batholith was probably exhumed to the surface before the Jurassic, judged from the partially annealed ages in samples 9501-14 and -26 (S4).
In the Takaka Terrane, the spread in ZFT ages within each sample indicates residence in a ZFT PAZ prior to a probable mid-Cretaceous start of cooling. This depositional and thermal history suggests that the zircon grains we dated may have had moderate levels of radiation damage leading up to the period of partial track annealing. The ZFT PAZ temperature limits we have adopted here are 250 to 170°C for low to moderately radiation damaged zircons for 100 m.y. of annealing (see text in Supplementary 1). Hence, we estimate 230 to 220°C as the maximum burial temperature range for the Takaka Terrane sample host rocks. For a 30°C/km geothermal gradient and a 20°C surface temperature, the total exhumation amount was 7.5 km, some 2 km of this occurring during 55–27 Ma, and the balance of 5.5 km during the mid-Cretaceous to 55 Ma.
Only one sample (9109-2) of Buller Terrane was double dated in this study. The main ZFT component age is reset at 106.6 ± 4.2 Ma, whereas the other component is partially annealed, indicating a maximum temperature of ∼240 - 230°C, near the upper limit of a ZFT PAZ appropriate to the sedimentary zircons in this sample. For a 30°C/km geothermal gradient and a 20°C surface temperature, the total exhumation amount was around 7.3 km. The location of this sample close to a detachment fault of the Paparoa Core Complex suggests that the degree of Cretaceous cooling is unlikely to be representative of the Buller Terrane rocks farther north in NW Nelson (), which may have had less burial heating. Both the Takaka and Buller terranes and the Karamea Batholith were part of the late–Early Cretaceous to Paleogene mountain belt through NW Nelson centred along the main SPS outcrop belt and extending from the Rotoroa Complex in the east to the present day western coastline ().
Paleogeography of the sedimentary system from NW Nelson to Taranaki and Northern King Country basins
The Taranaki Basin and King Country Basin detrital zircon U-Pb age populations compare remarkably well with the zircon U-Pb ages of the plutonic suites and basement terranes in NW Nelson (). Differences in the proportion of Darran Suite zircon U–Pb age between the blue and red curves () possibly reflects the lesser number of samples dated from this suite versus its mapped area. The outstanding anomaly in is the proportionate under representation in the sedimentary archive of zircon ages corresponding to the mapped areas of the Karamea Batholith and the Western Province Takaka and Buller terranes. The new detrital zircon U-Pb age data for the basin sediments enables us to reconsider the sediment transport routes in the basins, and accordingly revise parts of the Oligocene paleogeographic maps (Strogen Citation2011) for central-western New Zealand. The Late Eocene to the Oligocene is a critical period in Zealandia, during which large portions were inundated by the sea (Landis et al. Citation2008), although probably not completely (e.g. Kamp et al. Citation2014; Strogen et al. Citation2014).
Late Eocene 35 Ma paleogeography
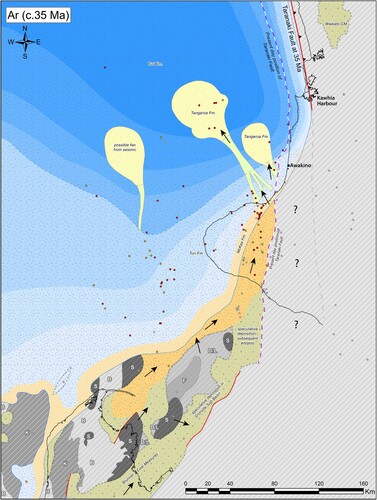
illustrates a revised Late Eocene (35 Ma) paleogeography showing the sedimentary system from NW Nelson to Taranaki Basin at that time. It is based on the 35 Ma map in Strogen (Citation2011), modified by including the extent of basement units beneath highs in southern Taranaki Basin (Mortimer et al. Citation1997; Tulloch and Mortimer Citation2017; Higgs and King Citation2018). We also show the palinspastic position and inferred extent of the Taranaki Fault Zone. Extensional sub-basins in southern Taranaki Basin developed during c. 38 to 27 Ma (King and Thrasher Citation1996; Strogen Citation2011, Citation2014, Citation2019). In southernmost Taranaki Basin, overfilling of these extensional basins contributed sediment derived from NW Nelson to more northern parts of the basin. Between 37 and 35 Ma, a marine transgression shifted a coastal plain environment (Mangahewa Formation) from northwest to southeast, resulting in the accumulation of shoreface facies of the McKee Formation along the eastern part of Taranaki Peninsula () from where it was transported across a narrow shelf into bathyal northern Taranaki Basin to accumulate as submarine fans (Tangaroa Formation; King and Thrasher Citation1996). Concurrently, shelfal Turi Formation siltstone facies accumulated above Mangahewa Formation over western Taranaki Peninsula and then across the McKee Formation ().
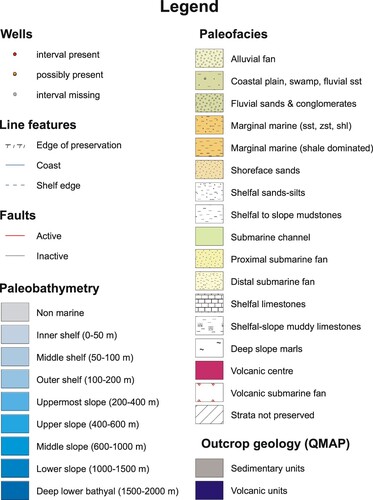
Figure 20. Thirty five Ma (Late Eocene) paleogeographic map of central-western New Zealand, including Taranaki Basin (modified from Strogen Citation2011) and early development of the northern King Country Basin (Waikato Coal Measures). The basement geological units exposed at this time in southern Taranaki Basin and in NW Nelson are mapped from Mortimer et al. (Citation1997), Tulloch and Mortimer (Citation2017) and Higgs and King (Citation2018). Sediment was transported northward from NW Nelson via the coastal plain to northern Taranaki Peninsula, thereafter channelled across the shelf and slope to Tangaroa Formation submarine fans in a foredeep, as mapped by King and Thrasher (Citation1996) and Strogen (Citation2011). B, for Buller and Takaka terranes; K, for Karamea Batholith; D/L, for Darran and Longwood suites; S, for Separation Point Suite. (b). Legend for the three paleogeographic maps (Figs 20, 21 and 23).
The case for Late Eocene thrust displacement within the Taranaki Fault Zone has previously been established (e.g. Bierbrauer et al. Citation2008; Stagpoole and Nicol Citation2008; Strogen et al. Citation2017). Stagpoole and Nicol (Citation2008) regarded the entire length of the Taranaki Fault Zone and the Taranaki Fault System along the eastern margin of Taranaki Basin as having become active within 43–40 Ma (Late Eocene). This was proposed in part from Late Eocene syn-sedimentary displacement on the Manaia Fault, as reported by Voggenreiter (Citation1993). In our seismic mapping (), we were unable to confirm reverse offset of Late Eocene strata on the Manaia Fault or related faults and therefore we doubt that the whole of the length of the Taranaki Fault Zone and System developed during the Late Eocene. Bierbrauer et al. (Citation2008) inferred Late Eocene thrust faulting within the Taranaki Fault Zone in Te Ranga-1 from the occurrence of Late Eocene Mangahewa Formation between two thrust sheets of Murihiku Supergroup basement within the fault zone. The age of Mangahewa Formation, and both Mangahewa and Turi formations in Opito-1, defines a maximum age of basement thrusting, but not the minimum age, which could be Oligocene. Strogen et al. (Citation2017) drew attention to the bathyal water depth in northern Taranaki Basin for this interval and associated some stratal thickening towards the fault zone as representing the possible development of a foredeep. For now, we adopt a southern end of an active Late Eocene Taranaki Fault Zone as lying just south of Kawhia Harbour ().
Early Oligocene (Early Whaingaroan) paleogeography
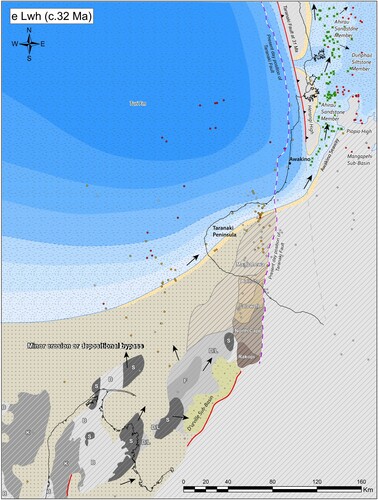
The Early Oligocene 32 Ma paleogeographic map () is drawn for the mid-point of the Early Whaingaroan (New Zealand) Stage (34.6–30 Ma; Cooper ed.; 2004; Raine et al. Citation2015) and is based on the Strogen (Citation2011) map for this interval. The late–Early Whaingaroan (c. 32–30 Ma) is when Ahirau Sandstone accumulated, having a NW Nelson provenance as evidenced by its high content of zircons with SPS U–Pb ages ( and ). In , we have mapped the distribution of the Ahirau Sandstone and the underlying Dunphail Siltstone members of the Te Kuiti Group, based on the stratigraphic and paleogeographic information in Kamp et al. (Citation2008; Citation2014), together with the extent of the Herangi High, the Piopio High and the Taranaki Fault Zone.
Figure 21. Thirty two Ma (Early Oligocene, Early Whaingaroan) paleogeographic map for central-western New Zealand modified from the Early Whaingaroan map in Strogen (Citation2011) and Kamp et al. (Citation2014), showing the areas of basement units (from Mortimer et al. Citation1997; Tulloch and Mortimer Citation2017; Higgs and King Citation2018) exposed in southern Taranaki Basin and in NW Nelson at that time. Circles with red dots mark drill holes that intersect Early Whaingaroan strata and green crosses are outcrop sections (Kamp et al. Citation2008). Note the Awakino Seaway south of the Herangi basement high through which coastal sand was transported from Taranaki Basin into the northern King Country Basin, accumulating as Ahirau Sandstone Member in the Te Kuiti Group. Note also the wide area of uplift and exhumation in eastern Taranaki Peninsula and in southern Taranaki Basin, corresponding to the Early Whaingaroan unconformity mapped on the structure contour map (), including exhumation of Mangahewa to Rakopi formations south of Taranaki Peninsula and north of the extensional D’Urville Sub-basin.
It has long been inferred that a seaway connected the King Country Basin to the Taranaki Basin in the vicinity of the present day Awakino Gorge during the Early Whaingaroan (Nelson Citation1973, Citation1978; Kamp et al. Citation2004; Anastas et al. Citation2006; Kamp et al. Citation2014). This is based chiefly on the middle to outer shelf facies of the Dunphail Siltstone, which underlies the Ahirau Sandstone in the basin and crops out along the eastern half of the Awakino River Gorge. The Ahirau Sandstone does not actually occur as far southwest as the Awakino Gorge (Kamp et al. Citation2008) as it was eroded when the unconformity developed between the Dunphail Siltstone and the Aotea Formation (). The Te Kuiti Group is mapped only along the eastern half of the Awakino Gorge (Edbrooke Citation2005) and hence stratigraphic evidence for connection of the seaway between the two basins is lacking due to Late Oligocene and Early Miocene reverse displacement on the Manganui Fault (Campbell and Raine Citation1989) and associated uplift of the southern end of the Herangi High (Nelson et al. Citation1994). Nevertheless, we link a seaway between the two basins as shoreface facies of the McKee Formation has been mapped (Strogen Citation2011) to the Taranaki Fault Zone immediately east of the occurrence of Dunphail Siltstone along the eastern half of Awakino Gorge (). A shoreline along the eastern flank of the Herangi High at that time provided the coastal attachment for this sediment to move northward by longshore drift as far as Port Waikato (South Auckland) (Kamp et al. Citation2014). An alternative source for the dispersal of SPS zircons into the northern King Country Basin, such as the reworking of Early Cretaceous sediments previously deposited in the Kawhia Syncline (Adams and Campbell Citation2020) in the King Country-Waikato region, is unlikely as the quartz sandstone in the Waikato Coal Measures () does not contain zircon grains with SPS ages (). Most of an Early Cretaceous succession had been eroded well before the Whaingaroa (Kamp and Liddell Citation2000) when the Awakino Seaway transported NW Nelson-derived sediment directly into the northern King Country-Waikato region. For Ahirau Sandstone with SPS zircons within it to have reached Port Waikato, the sand had to be transported across an ancestral Raglan Harbour (Tripathi Citation2008). Active uplift of the Herangi High started at around 29 Ma in the vicinity of Awakino Gorge. In we show the Taranaki Fault Zone as having been lengthened southward during the Early Whaingaroan from south of Kawhia Harbour to north of Awakino.
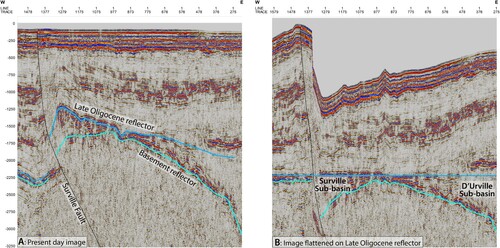
The southern Taranaki Basin was extensional during the Early Whaingaroan until the Late Oligocene. Extensional faults bounding the sub-basins have all had their sense of throw reversed during the Late Miocene (e.g. Reilly et al. Citation2015). includes a west to east seismic line (cs-3, located on ) through the Surville and D’Urville sub-basins, as well as an image that has been flattened on the latest Oligocene Takaka Limestone reflector, which clearly shows that the Surville Sub-basin was originally an asymmetric extensional sub-basin until the early Waitakian (25–23 Ma) (Strogen et al. Citation2014); this is likely to have also been the case for the D’Urville Sub-basin, but seismic lines do not extend as far east as the sub-basin boundary fault.
Figure 22. Seismic reflection profile (cs3) in southern Taranaki Basin (see for the line of this seismic section) (after Strogen et al. Citation2014), showing in panel A the native profile and in B the section flattened on the base of the Late Oligocene Takaka Limestone reflector. In the restored section in panel B, the Surville Fault is clearly a normal fault, indicative of extension until the Late Oligocene start of Takaka Limestone accumulation; thereafter, crustal shortening in southern Taranaki Basin reversed the sense of displacement on the Surville Fault.
The extent of long wavelength Early Whaingaroan uplift in southern Taranaki Basin is conservatively shown in and . During the Early Whaingaroan, this uplift was associated with significant northwestward progradation of the shoreline (Strogen Citation2011). The area of uplift corresponds to the extent of an unconformity below Late Whaingaroan strata. In the 32 Ma paleogeographic map (), we have mapped west of Taranaki Fault (in its present-day position) the extent of the Late Cretaceous and Paleogene formations immediately beneath the unconformity. These formations were uplifted and exhumed by erosion and a key feature is that the amount of exhumation increases to the south, such that Late Eocene Mangahewa Formation lies beneath the unconformity in eastern Taranaki Peninsula, and the Late Cretaceous Rakopi Formation () lies beneath the unconformity south of Taranaki Peninsula (see also in Strogen et al. Citation2014).
If the uplift was driven by shortening across the Taranaki Fault Zone, then one would expect the deeper structural level of exhumation to have occurred beneath the unconformity in the north, rather than in the south, but that is not observed. Hence, we interpret the Early Whaingaroan broad uplift, erosion and exhumation of eastern parts of Taranaki Peninsula and southern Taranaki Basin as being due to extensional doming that possibly had a thermal origin in the underlying mantle lithosphere. In this study, we have documented uplift and erosion of basement in NW Nelson during 55 to 27 Ma (see above), which includes the Early Whaingaroan, which was more substantial than observed in southern Taranaki Basin. These areas of broad uplift may represent to an extent the northern expression of the continental extension within the initial (43–30 Ma) south–north trending Australia-Pacific plate boundary zone through western New Zealand ().
Mid-Oligocene (Late Whaingaroan) 28 Ma paleogeography
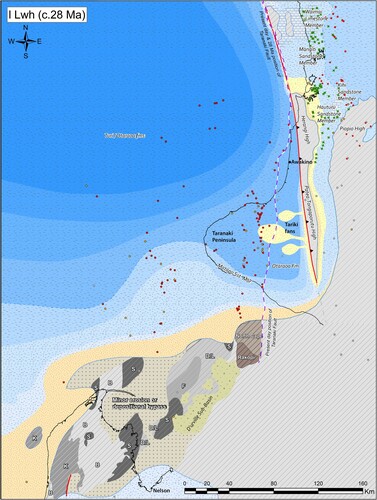
The Hauturu Sandstone Member, which we have interpreted as having a very strong NW Nelson basement provenance (), started to accumulate in the northern King Country Basin during the Late Whaingaroan (). The 28 Ma paleogeographic map () is built upon the Strogen (Citation2011) map for this interval. We show the distribution of the Hauturu Sandstone, Kihi Sandstone, Mangiti Sandstone and Waimai Limestone members of the Aotea Formation (Te Kuiti Group; and ) from stratigraphic and paleogeographic information in Waterhouse and White (Citation1994), Tripathi (Citation2008) and Kamp et al. (Citation2014). The thickest (50 m) and most northern occurrence of Hauturu Sandstone is in the vicinity of Aotea Harbour (Taranaki Point; Tripathi Citation2008). Both the Mangiti Sandstone and the Kihi Sandstone members are shelfal correlatives of the shoreline to inner shelf Hauturu Sandstone.
Figure 23. Twenty eight Ma paleogeographic map for central-western New Zealand modified from the Late Whaingaroan map in Strogen (Citation2011) and Kamp et al. (Citation2014), showing the areas of basement units (from Mortimer et al. Citation1997; Tulloch and Mortimer Citation2017; Higgs and King Citation2018) exposed in Southern Taranaki Basin and in NW Nelson at this time. Note the Taranaki Peninsula extent of the foredeep that developed from 29 Ma, accumulating Otaraoa Formation and its Tariki Sandstone Member. Also, the location of the seaway south of the Patea-Tongaporutu High along which, on its eastern flank, coastal sand was possibly transported from Taranaki Basin into the King Country region, accumulating as Hauturu Sandstone Member in the Te Kuiti Group. Note also the diminishing area of exposure of North Cape and Rakopi formations and basement in southern Taranaki Basin (c.f. ) due to marine onlap, reflecting the start of tectonic overprinting of the zone of continental extension within the initial (43–30 Ma) Australia-Pacific plate boundary zone through western New Zealand (). Note also the difference between the present day location of the Taranaki Fault Zone and its inferred palinspastic position during the Late Whaingaroan, which shows the amount of westward thrust displacement on the Taranaki Fault System during the Neogene.
There were significant changes in the paleogeography of central-western North Island between 32 and 28 Ma ( c.f. 23). One expression of this is the marked subsidence across Taranaki Peninsula that developed between 29 and 28 Ma from the subsidence history of Tawa-B1 (Strogen et al. Citation2014). This marks the start of rapid foredeep subsidence across Taranaki Peninsula, and a phase around 29 Ma of uplift of the southern end of the Herangi High and erosion of Whaingaroa Formation along its eastern flank (), which resulted in closure of the western end of the Awakino Seaway (). The subsidence across Taranaki Peninsula () led to accumulation of Matapo Sandstone Member () as a transgressive systems tract across the Early Whaingaroan unconformity surface, which was followed by rapid deepening to bathyal conditions. The Otaraoa Formation accumulated at a rate that maintained bathyal conditions, yet built a thickness of 800 m through the Late Whaingaroan and Duntroonian. These strata thicken towards the Taranaki Fault Zone (Strogen et al. Citation2019). It has been considered for some time that this foredeep resulted from loading by thickened crust within the Taranaki Fault Zone (Raine et al. Citation2005), expressed as the Patea-Tongaporutu High (Mills Citation1990). The Tariki Sandstone Member, low in the Otaraoa Formation, accumulated as submarine fans (de Bock et al. Citation1990), the sediment transported by longshore drift along the western shoreline of the Patea-Tongaporutu High. The dramatic deepening of the foredeep, coupled with growth of the Patea-Tongaporutu High during 29–28 Ma, marks southward lengthening of the Taranaki Fault Zone from north of Awakino to the southern (present day) coast of Taranaki Peninsula (), a distance of about 120 km.
In response to foredeep development across Taranaki Peninsula, the northeastern end of the coastal sedimentary system is inferred to have been displaced southward (). A new seaway south of the Patea-Tongaporutu High at c. 28 Ma, is shown as joining a shallow marine embayment to the east, the extent conservatively shown in . This new seaway was needed to transport sediment derived from NW Nelson into the northern King Country Basin, to accumulate as the Hauturu Sandstone. The subsidence of the southern King Country Basin is poorly dated. It may include Late Whaingaroan to Early Waitakian age strata but this is yet to be established. A thick Early and Middle Miocene marine sedimentary succession (Mahoenui and Mokau groups and Otunui Formation) overlies a Late Oligocene succession in outcrop in the southern part of the King Country Basin (Kamp et al. Citation2004; Edbrooke Citation2005; Townsend et al. Citation2008).
The area in southern Taranaki Basin that had been uplifted during the Early Whaingaroan diminished in extent during the late–Late Whaingaroan and Duntroonian, as shown by marine onlap from the west and subsequently from the east, indicating that the rate of uplift had slowed and even ended (). During 28–26 Ma, the bathyal foredeep across Taranaki Peninsula lengthened southward to about the present day location of Nelson City (Strogen Citation2011, ; Citation2014, d; Citation2019, ), a distance of about 220 km. We attribute the foredeep subsidence to crustal thickening by thrust faulting within the Taranaki Fault System and loading of the eastern basin margin (e.g. Pettinga and Wise Citation1994). At the same time (c. 27 Ma) in northern King Country Basin, a marked unconformity developed between Aotea Formation and Orahiri Formation east of the Herangi High (Nelson et al. Citation1994) between Awakino Tunnel and Kawhia Harbour ( and ) (Kamp et al. Citation2014, I), which we attribute to further uplift of the Herangi High south of Kawhia Harbour. Together with the southward lengthening of the Taranaki Fault System to Nelson, some 360 km length of this structure (Kawhia Harbour to Nelson) was active from 29–26 Ma.
Reconciling zircon U–Pb age spectra for the sedimentary archive versus source areas
Differences in the directions of sediment transport away from NW Nelson for detritus sourced from the SPS and Darran suites versus detritus from the Karamea Batholith and the Takaka and Buller terranes may be a factor in the lack of zircon provided from the latter three rock groups (). A striking regional feature is the northerly slope at the structural level of the base Oligocene unconformity on land in NW Nelson and the increasing depth (up to 3 km) of the same horizon northwards to North Taranaki Basin (). This slope has progressively developed since the Late Cretaceous due to differential Taranaki Basin subsidence, whereas NW Nelson basement persisted as a structural high. However, during the Late Eocene and Oligocene there was a comparable slope to the south, also defined by the base Oligocene horizon (Nathan et al. Citation1986). Sagar et al. (Citation2022) have shown the dominance of Karamea Batholith and Rahu Suite grain ages from zircon U–Pb dating of Late Eocene to Middle Miocene sandstone samples from western Murchison Basin. Hence, a proportion of the material eroded from the Karamea Batholith in NW Nelson was dispersed to the south into Murchison Basin. Although we have focused upon zircon data derived from sandstone facies, there is a much greater volume of mudstone compared with sandstone in Taranaki Basin Late Cretaceous – Oligocene stratigraphic units (), and much of this could have been derived from the Takaka and Buller terranes.
The source-to-sink sedimentary system in an evolving Late Eocene – Early Oligocene plate boundary zone
The Late Eocene to Late Oligocene part of the sedimentary system studied here transferred considerable amounts of sediment axially from NW Nelson to the north along the central part of the 43–30 Ma initial trend of the Australia-Pacific plate boundary zone through western New Zealand (, , , ). Northwest Nelson and southern Taranaki Basin lay at the northern end of the continental rift system part of the plate boundary zone, characterised by a structural high (NW Nelson) with asymmetrical rift sub-basins (e.g. ) around its margins to the north, west and south (Laird Citation1968; Kamp Citation1986b; King and Thrasher Citation1996; Riordan et al. Citation2014; Strogen et al. Citation2014; Ring et al. Citation2021). Sediment sourced from NW Nelson also reached the northern Taranaki foreland basin (as Tangaroa Formation), as well as the piggyback northern King Country Basin, located east of the Taranaki Fault Zone. There is no sign of distinctive Eastern Province (Torlesse composite terrane or Waipapa Terrane) zircon U–Pb age material in this system, likely to have been the case if a Late Eocene – Oligocene plate boundary zone trended through central to eastern New Zealand.
Termination of the source-to-sink sedimentary system
The first manifestations of interruption to the Late Cretaceous to Oligocene source-to-sink sedimentary system in central-western New Zealand occurred at about 29 Ma, involving closure of the Early Whaingaroan Awakino Seaway and concurrent foredeep subsidence in eastern Taranaki Peninsula, both due to thrusting on the Taranaki Fault Zone. The paleogeography of the NW Nelson region also changed dramatically from the Duntroonian Stage (27.3–25.2 Ma) onward due to the start of pronounced marine onlap of shelfal Takaka Limestone across its basement platform (Nathan et al. Citation1986; Rattenbury et al. Citation1998), probably due to flexural loading to the east within the Taranaki Fault System as the modern plate boundary started to develop to the east (Pettinga and Wise Citation1994). Low rates of accumulation of Takaka Limestone continued until the mid-Waitakian (c. 23 Ma). This was followed by rapid Late Waitakian and Otaian accumulation of Kaipuke Siltstone (Strogen at el. 2014) and its correlative in Murchison Basin (Mangles Formation, Nathan et al. Citation1986) and in the Grey Valley Trough (Inangahua Formation, Nathan et al. Citation1986). Hence, Late Oligocene marine flooding of the NW Nelson structural high terminated erosion across the prior source of sediment to the Taranaki and northern King Country basins. By 21 Ma the foredeep had widened into a fully developed foreland basin (Bull et al. Citation2018).
Implications for timing of subduction initiation along the Hikurangi Margin
Van de Lagemaat et al. (Citation2022) constrained the timing of the initiation of Hikurangi margin subduction outboard of Raukumara Peninsula () to lie between 30 and 27 Ma from U–Pb dating of vein calcite in Late Cretaceous turbidite sandstone at Waihau Bay together with inverse modelling of AFT data from associated sandstone. Earlier, we highlighted the Oligocene lengthening of the Taranaki Fault System from Kawhia Harbour to southern Taranaki Peninsula during 29–28 Ma and then farther south to Nelson during c. 28 - 26 Ma, based on interpretation of the Oligocene stratigraphy of Taranaki and northern King Country basins and sediment transport routes between them. We follow earlier work in regarding the Taranaki Fault as a back-thrust to the Hikurangi margin subduction zone by virtue of it being a whole-of-crust structure (Stern and Davey Citation1990; Holt and Stern Citation1994; Stagpoole and Nicol Citation2008), but differ in the timing and amounts of its southward lengthening. On we have mapped how the lengthening of the Taranaki Fault System could match the southward lengthening of the Hikurangi margin, taking into account the age information in Van de Lagemaat et al. (Citation2022). In particular, the 28–26 Ma fault lengthening to Nelson (220 km) matches the distance from northern Raukumara to Cape Palliser in a 27 Ma restoration of New Zealand (). The dip direction of the Taranaki Fault System opposed the dip direction of the subduction interface. Initial relative motion between the subducting Pacific plate and the overriding Australia plate was probably partitioned between the subduction thrust and the Taranaki Fault Zone and System. The scale and importance of this fault cannot be overstated: aside from the Alpine Fault and the Hikurangi subduction thrust, it is the longest and deepest Cenozoic structure in New Zealand. Its displacement cannot be explained by local deformation; it requires tectonic forces on the scale of plate boundary interactions. It follows that the proposed 29–26 Ma timing of its lengthening relates directly to the timing of initiation of subduction along the Hikurangi margin, where the primary plate boundary stresses built up ().
Our timing for subduction initiation is three to seven million years earlier than the timing (mid-Waitakian, c. 23 Ma) inferred from studies of earliest Miocene sedimentary successions along the Hikurangi margin (e.g. Field and Uruski Citation1997; Bailleul et al. Citation2013; Bland et al. Citation2022). The c. 23 Ma age marks when terrigenous mudstone accumulated over calcareous mudstone and marl (Weber Formation). This lithofacies boundary, observed from inboard and upper plate parts of the accretionary slope, will be a minimum age of subduction initiation. By comparison, the Van de Lagemaat et al. (Citation2022) 30 to 27 Ma timing of subduction initiation offshore northern Raukumara Peninsula is from a lower slope basin record close to the plate interface where subduction actually started. A delay of 3–7 m.y. between subduction initiation and fully formed subduction for the Hikurangi margin is shorter than that inferred for subduction initiation along the Puysegur margin (Shuck et al. Citation2021, Citation2022) farther south along the modern Australia-Pacific plate boundary.
One or two successive Australia-Pacific plate boundary trends through New Zealand?
The seafloor mapping of Late Eocene – Oligocene spreading in the Emerald Basin (Weissel et al. Citation1977) was a key discovery that led to two models of plate boundary development through continental New Zealand. Norris et al. (Citation1978) advanced the tectonic concept of an aulacogen as explaining the Eocene and Oligocene stratigraphic and structural development of the Waiau and Te Anau basins east of Fiordland in the context of the spreading plate boundary to the south; that is, they considered that the tectonics were consistent with a failed rift with limited propagation into continental crust. Seebeck et al. (Citation2023) did not explicitly define a Late Eocene – Oligocene plate boundary through central New Zealand to the East Coast Basin in their reconstruction model, although it is clearly illustrated as a zone of Late Eocene – Oligocene (43.79–26.55 Ma) extension northeast of Emerald Basin to their ‘Deformed Central Region’ (Seebeck et al. Citation2023, ) near where their stage pole is located. Convergence is shown in their northeast of the wedge of extension for the same period, as would be expected if both zones and the spreading ridge were located on the same great circle. It is also clear that their Late Eocene to present day model of plate boundary development involves a single zone through Zealandia.
The alternative model viewed the spreading in the Emerald Basin as the southernmost part of a through-going plate boundary zone through western New Zealand (Kamp Citation1986b). With the increasing acquisition and release of petroleum exploration data for northern Taranaki Basin during the late 1980s onwards, it became evident that Late Eocene – Oligocene rifting did not continue north of southern Taranaki Basin as previously envisaged, and that the eastern margin of North Taranaki Basin was rather characterised by a thrust belt and adjacent foredeep to the west (King and Thrasher Citation1996; King Citation2000; Stagpoole and Nicol Citation2008; Bierbrauer et al. Citation2008; Strogen et al. Citation2019). More recent evidence for widespread Eocene – Oligocene shortening and associated uplift north of Taranaki Basin within the Reinga Basin and across to the New Caledonia Trough (Bache et al. Citation2012; Etienne et al. Citation2018; Orr et al. Citation2020), together with integrated analysis of plate motions and boundaries in the Southwest Pacific region (Schellart et al. Citation2006; Van de Lagemaat et al. Citation2018, Citation2023), suggests that the Late Eocene and Early Oligocene plate boundary north of Emerald Basin is best placed through western New Zealand, consistent with geological observations (Figure 2).
This leaves a question around the relationship between the initial plate boundary and the modern one, which trends NE-SW through the continent. An early tectonic model proposed that the modern plate boundary started to cut obliquely across the trend of the Late Eocene – Early Oligocene continental rift system in South Island at 23 Ma (Kamp Citation1986b). We hold here to this plate boundary succession, but now consider that the first manifestation of overprinting of the initial plate boundary zone and the start of formation of the second one occurred earlier, close to the Early to Late Oligocene boundary, rather than at the Oligocene-Miocene boundary (23 Ma). Subduction began during 30 and 28 Ma in the southern Tonga-Kermadec arc-trench system (Van de Lagemaat et al. Citation2023) and during 30–27 Ma at the Hikurangi margin east of northern Raukumara Peninsula (Van de Lagemaat et al. Citation2022). A 29–26 Ma transition from extension to transpression within sedimentary basins across New Zealand proximal to the modern plate boundary zone through southern North Island and South Island, is documented in Furlong and Kamp (Citation2013, ). In Emerald Basin, there is a transition from orthogonal to oblique spreading during 30–26 Ma (Shuck et al. Citation2021, Citation2022). Hence there may have been two (successive) separate Australia-Pacific plate boundary zones through the New Zealand continent during the Cenozoic, which helps explain the origin of Late Oligocene – Neogene oblique shortening that has pervasively overprinted Late Eocene – Early Oligocene extensional structures and basin successions in Westland, western Southland and southern Taranaki basins. Any plate boundary reconstruction model with a single Australia-Pacific plate boundary zone taking up all of the plate motions in the region since the Late Eocene will have geological shortcomings.
Concluding remarks
While conventional petrographic studies of Late Cretaceous to Oligocene sandstone samples from Taranaki Basin have attributed their source to NW Nelson basement (e.g. King and Thrasher Citation1996; Higgs and King Citation2018; Smithies et al. Citation2019), our study shows direct source-to sink linkage of specific suites and terranes in NW Nelson to Late Cretaceous – Oligocene formations in Taranaki and King Country basins via their respective component and detrital U–Pb zircon ages, even uniquely yielding the proportional contributions from particular suites and terranes to the sediment archive. In addition, establishment of the 124–103 duration of the SPS magma flare-up episode in NW Nelson by zircon U–Pb dating of SPS samples in successive studies, together with the results of zircon U–Pb and ZFT double dating on single crystals, and AFT analysis of the same SPS samples, has established an approximate 10 km magnitude of SPS exhumation between the Early Cretaceous and Late Oligocene. A similar magnitude and timing of exhumation occurred within the outboard Darran Suite. It was a lesser 8 - 10 km for the Karamea Batholith and about 7.5 km for the Takaka and Buller terranes. These magnitudes of exhumation are consistent with the uplift of a substantial mountain range oriented north–south along, and east to west across, NW Nelson, centred on the SPS and Darran suites.
From the occurrence of detrital SPS grains within Aptian Pahau Terrane sedimentary rocks in the forearc region, an 86 m.y. period (>113–27 Ma) of erosion of the SPS indicates that NW Nelson was a viable sediment source throughout the late-Early Cretaceous to Late Oligocene. Isostatic rebound of the thickened crust, possibly starting during the period of pluton emplacement (124–103 Ma), and certainly subsequent to it (103–27 Ma), together with the 113–27 Ma period of erosion at the surface, likely drove the crustal uplift in NW Nelson and the supply of sediment to surrounding basins. Climate-driven variations in erosion efficiency during the 86 m.y. period of erosion may have led to variations in sedimentation rate in the Taranaki Basin succession, particularly during the Paleogene.
The NW Nelson provenance of two sandstone members in the Te Kuiti Group in northern King Country Basin has required new thinking around Oligocene sediment transport routes between the Taranaki and King Country basins, which is expressed here in revised Oligocene paleogeographic maps. The 29–26 Ma termination of this source-to-sink system, chiefly by thrusting along the Taranaki Fault System, dates the initiation of subduction along the Hikurangi margin of the modern (Late Oligocene – present day) Australia-Pacific plate boundary zone, whereas shortening across the modern plate boundary zone in South Island, obliquely overprinted the earlier (Late Eocene – Early Oligocene) plate boundary zone.
Acknowledgements
We wish to acknowledge Cam Nelson, who reasoned an exotic source for the Hauturu Sandstone in his 1973 PhD thesis on the Te Kuiti Group, which ultimately led to this study. We also wish to acknowledge the foundational work by D. Strogen on the paleogeography of Taranaki Basin, which assisted our interpretations. We are grateful to D. Bridgwater, Xu Ganqing, M. Saunders, Z. Lyon, I. Liddell and J. White for technical assistance in the UOW fission track and U–Pb geochronology laboratories during various phases of this study; the assistance of C. Spaninga in the collection of SPS samples; and the kind provision of Karamea Batholith rock samples by R.J. Muir, S. D. Weaver and J. D. Bradshaw. We are grateful to S. Coenen (UOW) for assistance with GIS mapping, and Dean Ingles (Todd Energy) and Betty-Ann Kamp for assistance with cartography. We thank Mac Beggs for a helpful pre-submission review of the manuscript, journal reviewer Matt Sagar and an anonymous reviewer for their constructive comments. We are very grateful to James Scott for his helpful editing of the manuscript. We also acknowledge Todd Energy for permission to use a compilation of TWTT data to undertake the reflection mapping in Taranaki Basin.
Disclosure statement
No potential conflict of interest was reported by the author(s).
Data availability statement
Supplemental material is available from https://doi.org/10.6084/m9.figshare.26156683
.Additional information
Funding
References
- Adams CJ, Campbell HJ. 2020. Detrital zircon age constraints on depositional history and provenance of the Murihiku Supergroup, Murihiku Supergroup, North Island, New Zealand. Gondwana Research. 87:107–117.
- Adams CJ, Campbell HJ, Griffin WL. 2007. Provenance comparisons of Permian to Jurassic tectonostratigraphic terranes in New Zealand: perspectives from detrital zircon age patterns. Geological Magazine. 144:701–729.
- Adams CJ, Campbell HJ, Mortimer N, Griffin WL. 2015. Detrital zircon ages in Buller and Takaka terranes, New Zealand: constraints on early Zealandia history. New Zealand Journal of Geology and Geophysics. 58:176–201.
- Adams CJ, Mortimer N, Campbell HJ, Griffin WL. 2013a. Detrital zircon geochronology and sandstone provenance of basement Waipapa Terrane (Triassic-Cretaceous) and Cretaceous cover rocks (Northland Allochthon and Houhora Complex) in northern North Island, New Zealand. Geological Magazine. 150:89–109.
- Adams CJ, Mortimer N, Campbell HJ, Griffin WL. 2013b. The mid-cretaceous transition from basement to cover within sedimentary rocks in eastern New Zealand: evidence from detrital zircon age patterns. Geological Magazine. 150:455–478.
- Adams CJD, Campbell HJ, Mortimer N, Griffin WL. 2017. Perspectives on cretaceous gondwana break-up from detrital zircon provenance of southern Zealandia sandstones. Geological Magazine. 154(4):661–682.
- Allibone AH, Jongens R, Scott JM, Tulloch AJ, Turnbull IM, Cooper AF, Powell NG, Ladley EB, King RP, Rattenbury, MS. 2009. Plutonic rocks of the median batholith in eastern and central Fiordland, New Zealand: field relations, geochemistry, correlation, and nomenclature. New Zealand Journal of Geology and Geophysics. 52:101–148.
- Anastas A, Dalrymple RW, James NP, Nelson CS. 2006. Lithofacies and dynamics of a cool-water carbonate seaway: mid-tertiary, Te Kuiti Group, New Zealand. In: Pedley HM, Carannante G, editor. Cool-Water carbonates: depositional systems and paleoenvironmental controls. London: Geological Society; p. 245–268.
- Bache F, Sutherland R, Stagpoole V, Herzer R, Collot J, Rouillard P. 2012. Stratigraphy of the southern Norfolk Ridge and the Reinga Basin: a record of initiation of Tonga–Kermadec–Northland subduction in the southwest Pacific. Earth and Planetary Science Letters. 321–322:41–53.
- Bailleul J, Chanier F, Ferrière J, Robin C, Nicol A, Mahieux G, Caron V. 2013. Neogene evolution of lower trench-slope basins and wedge development in the central Hikurangi subduction margin, New Zealand. Tectonophysics. 591:152–174.
- Begg JG, Johnston MR. 2000. Geology of the Wellington Area; scale 1:250 000. Lower Hutt: Institute of geological & Nuclear Sciences. Institute of Geological & Nuclear Sciences 1: 250 000 geological map 10. 64 p + 1 folder map.
- Bierbrauer K, Herdy TJ, Rek A, Mills K. 2008. Exploring the greater Taranaki Basin north of the established hydrocarbon fairway. PESA Eastern Australasian Basins Symposium. Sydney, 14–17.
- Bland KJ, Morgans HEG, Strogen DP, Harvey H. 2022. Litho- and biostratigraphy of a late Oligocene–Early Miocene succession in the Weber area, southern Hawke’s Bay, and implications for early Hikurangi subduction-margin evolution. New Zealand journal of Geology and Geophysics. doi:10.1080/00288306.2022.2108069
- Bolhar R, Weaver SD, Palin JM, Cole JW, Paterson LA. 2008. Systematics of zircon crystallisation in the Cretaceous Separation Point Suite, New Zealand, using U/Pb isotopes, REE and Ti geothermometry. Contributions to Mineralogy and Petrology. 156:133–160.
- Braun J. 2003. Pecube: a new finite-element code to solve the 3D heat transport equation, including the effects of a time-varying, finite amplitude surface topography. Comput. Geosci. 29:787–794. doi:10.1016/s0098-3004(03)00052-9.
- Brown EH. 1996. High pressure metamorphism caused by magma loading in Fiordland. Journal of Metamorphic Geology. 14(4):441–452.
- Bull S, Nicol A, Strogen DP, Kroeger KF, Seebeck HS. 2018. Tectonic controls on Miocene sedimentation in the Southern Taranaki Basin and implications for New Zealand plate boundary deformation. Basin Research. 31:253–273.
- Campbell HJ, Mortimer N, Turnbull IM. 2003. Murihiku Supergroup, New Zealand: redefined. Journal of the Royal Society of New Zealand. 33:85–95.
- Campbell HJ, Raine JI. 1989. Biostratigraphic evidence for the Manganui Fault, near Awakino, southwest Auckland. Journal of the Royal Society of New Zealand. 19:43–53.
- Cartwright SJ. 2003. Cenozoic geological evolution of the central-eastern King Country Basin, North Island [Unpublished MSc thesis]. Hamilton, University of Waikato. 214 p.
- Cawood PA, Nemchin AA, Leverenz A, Saeed A, Ballance PF. 1999. U/Pb dating of detrital zircons: implications for the provenance record of Gondwana margin terranes. Geological Society of America Bulletin.111: 1107–1119.
- Challis GA, Johnston MR, Lauder WR, Suggate RP. 1994. SheetM29BD — Nelson. Geology of the Lake Rotoroa area, scale 1: 50 000. Institute of Geological & Nuclear Sciences Geological Map 8. Lower Hutt, Institute of Geological and Nuclear Sciences. 1 sheet + 32 p.
- Cooper RA. 1989. Early Paleozoic terranes of New Zealand. Journal of the Royal Society of New Zealand. 19:73–112.
- Cooper RA. 2004. The New Zealand geological timescale. Institute of Geological and Nuclear Sciences Monograph 22. 284 p.
- Crowhurst P, Green PF, Kamp PJJ. 2002. Appraisal of (U–Th)/He apatite thermochronology as a thermal history tool for hydrocarbon exploration: an example from the Taranaki Basin, New Zealand. American Association of Petroleum Geologists Bulletin. 86(10):1801–1819.
- de Bock JF, Palmer JA, Lock RG. 1990. Tariki Sandstone Early Oligocene hydrocarbon reservoir, eastern Taranaki, New Zealand. In New Zealand Petroleum Conference Proceedings 1989. Wellington: Ministry of Economic Development; p. 214–224.
- Dröllner M, Barham M, Kirkland CL. 2022. Gaining from loss: detrital zircon source-normalized α-dose discriminates first- versus multi-cycle grain histories. Earth and Planetary Science Letters. 579:117346.
- Edbrooke SW. 2005. Geology of the Waikato area; scale 1: 250 000. Lower Hutt: Institute of Geological & Nuclear Sciences Limited. Institute of Geological & Nuclear Sciences 1: 250 000 geological map 4. 68 p. + 1 folder map.
- Edbrooke SW. 2017. The Geological Map of New Zealand: To accompany Geological Map of New Zealand 1:1 000 000. GNS Science Geological Map 2. 183 pp. 2 sheets. Lower Hutt, New Zealand GNS Science.
- Edbrooke SW, Sykes R, Pocknall DT. 1994. Geology of the Waikato coal measures, Waikato Coal region, New Zealand. Institute of Geological & Nuclear Sciences Monograph. 6:236 p.
- Etienne S, Collot J, Sutherland R, Patriat M, Bache F, Rouillard P, Henrys S, Barker D, Juan C. 2018. Deepwater sedimentation and Cenozoic deformation in the Southern New Caledonia trough (Northern Zealandia, SW Pacific). Marine and Petroleum Geology. 92:764–779.
- Field BD, Uruski CI. 1997. Cretaceous-Cenozoic geology and petroleum systems of the east coast region, New Zealand. Institute of Geological & Nuclear Sciences Monograph. 19:301p.
- Fischer KM. 2002. Waning buoyancy in the crustal roots of old mountains. Nature. 2017:933–936.
- Furlong KP, Kamp PJJ. 2013. Changes in plate boundary kinematics: punctuated or smoothly varying—evidence from the Mid-Cenozoic transition from lithospheric extension to shortening in New Zealand. Tectonophysics. 608:1328–1342.
- Furlong KP, Kirby E, Creason CG, Kamp PJJ, Xu G, Danisík M, Shi X, Hodges KV. 2021. Exploiting thermochronology to quantify exhumation histories and patterns of uplift along the margins of Tibet. Frontiers in Earth Science. 9:688374. doi:10.3389/feart.2021.688374.
- Galbraith RF. 2005. Statistics for fission track analysis. Boca Raton: Taylor and Francis.
- Ghisetti F, Barnes P, Sibson R. 2014. Deformation of the top basement unconformity west of the Alpine Fault (South Island, New Zealand): seismotectonic implications. New Zealand J Geol Geophys. 57:271–294. doi:10.1080/00288306.2013.876433.
- Ghisetti F, Sibson RH, Hamling I. 2016. Deformed Neogene basins, active faulting and topography in Westland: distributed crustal mobility west of the Alpine fault transpressive plate boundary (South Island, New Zealand). Tectonophysics. 693:340–362.
- Harrison TM, McDougall I. 1980. Investigation of an intrusive contact, northwest Nelson, New Zealand—1. Thermal, chronological and isotopic constraints. Geochimica Cosmochimica Acta. 44:1985–2003.
- Hayes GP, Furlong KP, Ammon C J. 2009. Intraplate deformation adjacent to the Macquarie Ridge south of New Zealand—the tectonic evolution of a complex plate boundary. Tectonophysics. 463:1–14.
- Herzer RH, Mortimer N. 1998. Miocene spreading in the South Fiji Basin? Geological Society of New Zealand Newsletter. 17:10–16.
- Higgs KE, King PR. 2018. Reservoir sandstone provenance and sediment dispersal in a complex tectonic setting: Taranaki Basin, New Zealand. Sedimentary Geology. 372:112–139.
- Holt WE, Stern TA. 1994. Subduction, platform subsidence, and foreland thrust loading: the late Tertiary development of Taranaki Basin, New Zealand. Tectonics. 13:1068–1092.
- Kamp PJJ. 1986a. Late Cretaceous-Cenozoic tectonic development of the southwest Pacific region. Tectonophysics. 121(2-4):225–251. doi:10.1016/0040-1951(86)90045-4.
- Kamp PJJ. 1986b. The mid-Cenozoic Challenger Rift System of western New Zealand and its implications for the age of Alpine Fault inception. The Geological Society of America Bulletin. 97(3):255–281.
- Kamp PJJ, Green PF. 1990. Thermal and tectonic history of selected Taranaki Basin (New Zealand) wells assessed by apatite fission track analysis. American Association of Petroleum Geologists Bulletin. 74(9):1401–1419.
- Kamp PJJ, Liddell IJ. 2000. Thermochronology of northern Murihuku terrane, derived from apatite FT analysis. Journal of the Geological Society of London. 157:345–354.
- Kamp PJJ, Tripathi A, Nelson CS. 2008. Stratigraphic columns and correlations for the late eocene – Oligocene Te Kuiti Group, central-western North Island, New Zealand. MBIE New Zealand Petroleum and Minerals Petroleum Report. PR3901:257.
- Kamp PJJ, Tripathi ARP, Nelson CS. 2014. Paleogeography of late Eocene to earliest Miocene Te Kuiti Group, central-Western North Island, New Zealand. New Zealand Journal of Geology and Geophysics. 57(2):128–148.
- Kamp PJJ, Vonk AJ, Bland KJ, Hansen RJ, Hendy AJW, McIntyre AP, Ngatai M, Cartwright SJ, Hayton S, Nelson CS. 2004. Neogene stratigraphic architecture and tectonic evolution of Wanganui, King Country, and eastern Taranaki basins, New Zealand. New Zealand Journal of Geology and Geophysics. 47:625–644.
- Kamp PJJ, Webster KS, Nathan S. 1996. Thermal history analysis by integrated modelling of apatite fission track and vitrinite reflectance data: application to an inverted basin (Buller Coalfield, New Zealand). Basin Research. 8:383–402.
- Keller WR. 2004. Cenozoic plate tectonic reconstructions and plate boundary processes in the Southwest Pacific [PhD thesis]. California Institute of Technology. Retrieved from ProQuest Dissertations Publishing.
- Ketcham RA. 2005. Forward and inverse modeling of low-temperature thermochronometry data. Reviews in Mineralogy and Geochemistry. 58(1):275–314.
- Kimbrough DL, Tulloch AJ, Coombs DS, Landis CA, Johnston MR, Mattinson JM. 1994. Uranium-lead zircon ages from the Median Tectonic Zone, New Zealand. New Zealand Journal of Geology and Geophysics. 37:393–419.
- Kimbrough DL, Tulloch AJ, Geary E, Coombs DS, Landis CA. 1993. Isotopic ages from the Nelson region of South Island, New Zealand: crustal structure and the definition of the Median Tectonic Zone. Tectonophysics. 225:433–448.
- King PR. 2000. Tectonic reconstruction of New Zealand: 40 Ma to the present. New Zealand Journal of Geology and Geophysics. 43:611–638.
- King PR, Thrasher GP. 1996. Cretaceous–Cenozoic geology and petroleum systems of the Taranaki Basin, New Zealand. Institute of Geological and Nuclear Sciences Monograph 13. Lower Hutt: Institute of Geological and Nuclear Sciences, 243 pp.
- Klepeis KA, Clarke GL, Gehrels G, Vervoort J. 2004. Processes controlling vertical coupling and decoupling between the upper and lower crust of orogens: results from Fiordland. New Zealand: Journal of Structural Geology. 26:765–791.
- Klepeis KA, Schwartz J, Stowell H, Tulloch A. 2016. Gneiss domes, vertical and horizontal mass transfer, and the initiation of extension in the hot lower-crustal root of a continental arc, Fiordland. New Zealand: Lithosphere. 8:116–140.
- Laird MG. 1968. The Paparoa Tectonic Zone. New Zealand Journal of Geology and Geophysics. 11:435–452.
- Landis C A, Campbell H J, Begg J G, Mildenhall D C, Paterson A M, Trewick S A. 2008. The Waipounamu erosion surface: questioning the antiquity of the New Zealand land surface and terrestrial fauna and flora. Geological Magazine. 145:173–197.
- Lihou JC. 1993. The structure and deformation of the Murchison Basin, South Island, New Zealand. New Zealand Journal of Geology and Geophysics. 36:95–105.
- Lillie AR. 1980. Strata and structure of New Zealand. The Tohunga Press, Auckland. 441p.
- Mason CC, Romans BW, Patterson MO, et al. 2022. Cycles of Andean mountain building archived in the Amazon Fan. Nature Communications. 13:6983. doi:10.1038/s41467-022-34561-6.
- Milan LA, Daczko NR, Clarke GL, Stockli DF, Fildani A. 2017. Cordillera Zealandia: A Mesozoic arc flare-up on the palaeo-Pacific Gondwana margin. Scientific Reports. 7:261. doi:10.1038/s41598-017-00347-w.
- Mills C. 1990. Gravity expression of the Patea-Tongaporutu High and subsequent model for Taranaki Basin margin. In: 1989 New Zealand Oil Exploration Conference proceedings. Wellington: Ministry of Commerce; p. 191–200.
- Morgans HEG, Raine JI, Schiøler P, Hollis CJ. 2007. Paleoenvironmental and paleogeographic review of nine wells from North Taranaki Bight. New Zealand Unpublished Openfile Petroleum Report PR4585. 67 p.
- Mortimer N. 2004. New Zealand’s geological foundations. Gondwana Research. 7:261–272.
- Mortimer N, Herzer RH, Gans PB, Parkinson DL, Seward D. 1998. Basement geology from Three Kings Ridge to West Norfolk Ridge, southwest Pacific Ocean: evidence from petrology, geochemistry, and isotopic dating of dredge samples. Marine Geology. 148:135–162.
- Mortimer N, Tulloch AJ, Ireland TR. 1997. Basement geology of Taranaki and Wanganui basins, New Zealand. New Zealand Journal of Geology and Geophysics. 40:223–236.
- Mortimer N, Tulloch AJ, Spark RN, Walker NW, Ladley E, Allibone A, Kimbrough DL. 1999. Overview of the Median Batholith, New Zealand: a new interpretation of the geology of the median tectonic zone and adjacent rocks. Journal of African Earth Sciences. 29(1):257–268.
- Muir RJ, Ireland TR, Weaver SD, Bradshaw JD. 1994. Ion microprobe U–Pb zircon geochronology of granitic magmatism in the Western Province of the South Island, New Zealand. Chemical Geology (Isotope Geoscience Section). 113:171–189.
- Muir RJ, Ireland TR, Weaver SD, Bradshaw JD. 1996. Ion microprobe dating of Paleozoic granitoids: Devonian magmatism in New Zealand and correlations with Australia and Antarctica. Chemical Geology. 127:191–210.
- Muir RJ, Ireland TR, Weaver SD, Bradshaw JD, Evans JA, Eby JA, Shelley D. 1998. Geochronology and geochemistry of a Mesozoic magmatic arc system, Fiordland, New Zealand. Journal of the Geological Society of London. 155:1037–1053.
- Muir RJ, Weaver SD, Bradshaw JD, Eby GN, Evans JA. 1995. The Cretaceous Separation Point Batholith, New Zealand: granitoid magmas formed by melting of mafic lithosphere. Journal Geological Society of London. 152:689–701.
- Murray KE, Braun J, Reiners PW. 2018. Towards robust interpretation of low-temperature thermochroometers in magmatic terranes. Geochemistry, Geophysics, Geosystems. 19(10):3739–3763. doi:10.1029/2018GC007595.
- Nathan S, Anderson HJ, Cook RA, Herzer RH, Hoskins RH, Raine JI, Smale D. 1986. Cretaceous and Cenozoic sedimentary basins of the West Coast Region, South Island, New Zealand. New Zealand Geological Survey Basin Studies 1. Wellington: Department of Scientific and Industrial Research. 89 pp.
- Nathan S, Rattenbury MS, Jongens R, Suggate RP. 2002. Geology of the Greymouth area. Institute of Geological & Nuclear Sciences 1: 250 000 Geological Map 12. 1 sheet+58 p. Lower Hutt, New Zealand. Institute of Geological & Nuclear Sciences Ltd.
- Nelson CS. 1973. Stratigraphy and sedimentology of the Te Kuiti Group in Waitomo County, South Auckland [Unpublished Ph.D. thesis lodged in the Library]. University of Auckland, New Zealand.
- Nelson CS. 1978. Stratigraphy and paleontology of Oligocene Te Kuiti Group, Waitomo County, South Auckland, New Zealand. New Zealand Journal of Geology and Geophysics. 21:553–594.
- Nelson CS, Hume TM. 1977. Relative intensity of tectonic events revealed by the Tertiary sedimentary record in the North Wanganui Basin and adjacent areas, New Zealand. New Zealand Journal of Geology and Geophysics. 20(2):369–392.
- Nelson CS, Kamp PJJ, Young HR. 1994. Sedimentology and petrography of mass-emplaced limestone (Orahiri Limestone) on a Late Oligocene shelf, western North Island, and tectonic implications for eastern margin development of Taranaki Basin. New Zealand Journal of Geology and Geophysics. 37:269–285.
- New Zealand Petroluem & Minerals. 2014. New Zealand petroleum basins. Wellington: Ministry of Business, Innovation and Employment.
- Norris R J, Carter R M, Turnbull I M. Cainozoic sedimentation in basins adjacent to a major continental transform boundary in southern New Zealand. Journal of the Geological Society. 135:191–205.
- Orr D, Sutherland R, Stratford WR. 2020. Eocene to Miocene subduction initiation recorded in stratigraphy of Reinga Basin, northwest New Zealand. Tectonics 1–21. doi:10.1029/2019TC005899.
- Pettinga JR, Wise DU. 1994. Paleostress adjacent to the Alpine Fault: Broader implications from fault analysis near Nelson, South Island, New Zealand. Journal of Geophysical Research. 99:2727–2736.
- Rahn MK, Brandon MT, Batt GE, Garver JI. 2004. A zero-damage model for fission-track annealing in zircon. American Mineralogist. 89:473–484.
- Raine JI, Beu AG, Boyes AF, Campbell HJ, Cooper RA, Crampton J, Crundwell MP, Hollis CJ, Morgans HEG, Mortimer N. 2015. New Zealand geological timescale NZGT 2015/1. New Zealand Journal of Geology and Geophysics. 58:398–403.
- Raine JI, Cook RA, Strong CP. 2005. Eastern Taranaki boundary fault paleontology and timing of thrusting. Lower Hutt: Institute of Geological & Nuclear Sciences. Institute of Geological & Nuclear Sciences science report 2004.12:57 p.
- Rattenbury MS, Cooper RA, Johnston MR.1998. Geology of the Nelson area: scale 1: 250 000. Lower Hutt: Institute of Geological & Nuclear Sciences Limited. Institute of Geological & Nuclear Sciences 1: 250 000 geological Map 9. 67 pp. + 1 folded map.
- Rattenbury MS, Townsend D, Johnston MR. 2006. Geology of the Kaikoura area: scale 1: 250 000. Lower Hutt: Institute of Geological & Nuclear Sciences Limited. Institute of Geological & Nuclear Sciences 1: 250 000 geological map 13. 70 pp. + 1 folded map.
- Reilly C, Nicol A, Walsh JJ, Seebeck H. 2015. Evolution of faulting and plate boundary deformation in the Southern Taranaki Basin, New Zealand. Tectonophysics. 651–652:1-18.
- Reilly WI. 1972. New Zealand gravity map series. New Zealand Journal of Geology and Geophysics. 15:3–15.
- Ring U, Ibrahim IT, Tong K, Todd A. 2021. K-Ar fault-gouge dating in the lower Buller Gorge constrains the formation of the Paparoa Trough, West Coast, New Zealand. New Zealand Journal of Geology and Geophysics. 64:49–61. doi:10.1080/00288306.2020.1808025.
- Riordan NK, Reid CM, Bassett KN, Bradshaw JD. 2014. Reconsidering basin geometries of the West Coast: the influence of the Paparoa Core Complex on Oligocene rift systems. New Zealand Journal of Geology and Geophysics. 57:170–184.
- Sagar MW, Higgs KE, Strogen DP, Bland JK, Browne GH. 2022. Sediment provenance in the Murchison and Maruia basins, Aotearoa/New Zealand: a record of Neogene strike-slip displacement, convergence, and basement exhumation along the Australian–Pacific plate boundary. New Zealand Journal of Geology and Geophysics. 67(1):45–83. doi:10.1080/00288306.2022.2108067.
- Sagar MW, Palin JM. 2013. Carboniferous U–Pb zircon age for S-type Karamea Suite Redjacket Granite, Paparoa Metamorphic Core Complex lower plate, northern Westland. New Zealand Journal of Geology and Geophysics. 56:109–120.
- Schellart WP, Lister GS, Toy VG. 2006. A late Cretaceous and Cenozoic reconstruction of the Southwest Pacific region: tectonics controlled by subduction and slab rollback processes. Earth-Science Reviews. 76(3–4):191–233.
- Schoene B. 2014. U-Th-Pb geochronology. In: Holland HD, Turekian KK, editors. Treatise on geochemistry. 2nd ed. Oxford: Elsevier; p. 378.
- Schwartz JJ, Klepeis KA, Sadorski1 JF, Stowell HH, Tulloch AJ, Coble MA. 2017. The tempo of continental arc construction in the Mesozoic Median Batolith, Fiordland, New Zealand. Lithosphere. 9(3):343–365.
- Scott JM, Borcovsky DA, Palin JM, Toy VG. 2014. Localisation of deformation in the thermal contrast at a granite batholith margin. New Zealand. Journal of Structural Geology. 64:149–163.
- Scott JM, Cooper AF, Palin JM, Tulloch AJ, Kula J, Jongens R, Spell TL, Pearson NJ. 2009. Tracking the influence of a continental margin on growth of a magmatic arc (Fiordland, New Zealand) using thermobarometry, thermochronology, and zircon U–Pb and Hf isotopes. Tectonics. 28:20 p.
- Scott JM, Cooper AF, Tulloch AJ, Spell TL. 2011. Crustal thickening of the Early Cretaceous paleo-Pacific Gondwana margin. Gondwana Research. 20:380–394.
- Scott JM, Palin JM. 2008. La-ICP-MS U–Pb zircon ages from Mesozoic plutonic rocks in eastern Fiordland, New Zealand. New Zealand Journal of Geology and Geophysics. 51:105–113.
- Seebeck H, Strogen DP, Nicol A, Hines BR, Bland KJ. 2023. A tectonic reconstruction model for Aotearoa-New Zealand from the mid-Late Cretaceous to the present day. New Zealand Journal of Geology and Geophysics:1–24. doi:10.1080/00288306.2023.2239175.
- Shuck B, Gilick SPS, Van Avendonk, HJA, Gurnis, M, Sutherland R, Stock J, Hightower E. 2022. Stress transition from horizontal to vertical forces during subduction initiation. Nature Geoscience 15: 149-155. doi:10.1038/s41561-O21-00880-4.
- Shuck B, Van Avendonk H, Gulick SPS, Gurnis M, Sutherland R, Stock J, Patel J, Hightower E, Saustrup S, Hess H. 2021. Strike-slip enables subduction initiation beneath a failed rift: new seismic constraints from Puysegur margin, New Zealand. Tectonics. 40.5 e2020TC006436. doi:10.1029/2020TC006436.
- Smithies SL, Bassett KN, Browne GH, Nichols ARL. 2019. Provenance of the Pakawau Group and Farewell Formation (Late Cretaceous – Paleocene), Taranaki Basin, northwest Nelson, New Zealand. New Zealand Journal of Geology and Geophysics. 63(1):1–34.
- Spell TL, McDougall I, Tulloch AJ. 2000. Thermochronologc constraints on the breakup of the Pacific Gondwana margin: the Paparoa metamorphic core complex, South Island, New Zealand. Tectonics. 3:433–351.
- Stagpoole V, Nicol A. 2008. Regional structure and kinematic history of a large subduction back thrust: Taranaki Fault, New Zealand. Journal of Geophysical Research. 113(B1):B01403.
- Stern TA, Davey FJ. 1990. Deep seismic expression of a foreland basin: Taranaki Basin, New Zealand. Geology. 18(10):979–982.
- Strogen DP. 2011. Updated Paleogeographic maps for the Taranaki Basin and surrounds. GNS Science Report 2010/53. Lower Hutt: GNS Science: 83 pp.
- Strogen DP, Bland KJ, King, PR. 2014. Paleogeography of the Taranaki Basin region during the latest Eocene–Early Miocene and implications for the ‘total drowning’ of Zealandia. New Zealand Journal of Geology and Geophysics. 57:110–127.
- Strogen, DP, Higgs KE, Griffin AG, Morgans HE. 2019. Late eocene–early miocene facies and stratigraphic development, Taranak Basin, New Zealand: the transition to plate boundary tectonics during regional transgression. Geological Magazine. 156(10):1751–1770.
- Strogen DP, Seebeck H, Nicol A, King PR. 2017. Two-phase Cretaceous–Paleocene rifting in the Taranaki Basin region, New Zealand; implications for Gondwana break-up. Journal of the Geological Society, London. 174:929–946.
- Townend J. 1999. Heat flow through the West Coast, South Island, New Zealand. New Zealand Journal of Geology and Geophysics. 42:21–31. doi:10.1080/00288306.1999.9514829.
- Townsend D, Vonk K, Kamp PJJ. 2008. Geology of the Taranaki area: scale 1: 250 000. Institute of Geological & Nuclear Sciences 1: 250 000 geological map 7. + 1 sheet + 77p. Lower Hutt, New Zealand. GNS Science.
- Tripathi ARP. 2008. Basin analysis of the Late Eocene–Oligocene Te Kuiti Group, western North Island, New Zealand. [Unpublished PhD thesis]. Hamilton: University of Waikato.
- Tulloch AJ. 1988. Batholiths, plutons, and suites: nomenclature for granitoid rocks of Westland-Nelson, New Zealand. New Zealand Journal of Geology and Geophysics. 31:505–509.
- Tulloch AJ, Challis GA. 2000. Emplacement depths of Paleozoic-Mesozoic plutons from western New Zealand estimated by hornblende-AI geobarometry. New Zealand Journal of Geology and Geophysics. 43:555–567.
- Tulloch AJ, Kimbrough DL. 1989. The Paparoa Metamorphic Core Complex, New Zealand: Cretaceous extension associated with fragmentation of the Pacific margin of Gondwana. Tectonics. 8:1217–1234.
- Tulloch AJ, Kimbrough DL. 2003. Paired plutonic belts in convergent margins and the development of high Sr/Y magmatism: Peninsular Ranges Batholith of Baja California and Median Batholith of New Zealand In Johnson SE, Paterson SR, Fletcher JM, Girty GH, Kimbrough DL, Martin-Barajas A. Tectonic evolution of northwestern Mexico and the southwestern USA: Boulder, Colorado. Geological Society of America Special Paper 374:275–295.
- Tulloch AJ, Mortimer N. 2017. New basement map of Taranaki Basin. 2nd New Zealand Petroleum Geoscience Workshop 28–29 September 2017. GNS Science, Lower Hutt. https://data.gns.cri.nz/mapservice/Content/outputs/Petro_wrkshp_2017/Poster&per;2010_Tulloch&per;20&&per;20Mortimer&per;202017b_2nd&per;20NZPGW.pdf
- Tulloch AJ, Ramezani J, Kimbrough DL, Faure K, Allibone AH. 2009. U–Pb geochronology of mid-Paleozoic plutonism in western New Zealand: implications for S-type granite generation and growth of the east Gondwana margin. GSA Bulletin. 121:1236–1261.
- Turnbull RE, Schwartz JJ, Fiorentini ML, Klepeis KA, Jongens R, Miranda E, Evans NJ, Ludwig T, Waight T, Faure K, McDonald BJ. 2023. Mapping the 4D lithospheric architecture of Zealandia using zircon O and Hf isotopes in plutonic rocks. Gondwana Research. 121:436–471.
- Turnbull RE, Tulloch AJ, Ramezani J, Jongens R. 2016. Extension-facilitated pulsed S-I-A-type “flare-up” magmatism at 370 Ma along the southeast Gondwana margin in New Zealand: insights from U–Pb geochronology and geochemistry. Geological Society of America Bulletin. 128(9–10):1500–1520.
- Turnbull RE, van der Meer QHA, Tulloch AJ, Ramezani J, Whitehouse MJ, Andersen TH, Waight TE. 2018. Recognition of mid-Paleozoic volcanism in New Zealand. New Zealand Journal of Geology and Geophysics. 61:413–427.
- Van de Lagemaat SHA, Kamp PJJ, Boschman LM, Van Hinsbergen DJJ. 2023. Reconciling the Cretaceous breakup and demise of the Phoenix Plate with East Gondwana orogenesis in New Zealand. Earth Science Reviews. 236:22 p. doi:10.1016/j.earscirev.2022.104276.
- Van de Lagemaat SHA, Mering JA, Kamp PJJ. 2022. Geochemistry of syntectonic carbonate veins within Late Cretaceous turbidites, Hikurangi Margin (New Zealand): implications for a mid-Oligocene age of subduction initiation. Geochemistry, Geophysics, Geosystems. 23:e2021GC010125.
- Van de Lagemaat SHA, Van Hinsbergen, DJJ, Boschman, LM, Kamp PJJ, Spakman, W. 2018. Southwest Pacific absolute plate kinematic reconstruction reveals major Cenozoic Tonga-Kermadec slab dragging. Tectonics. 37(8): 2647–2674.
- Vermeesch P. 2018. IsoplotR: a free and open toolbox for geochronology. Geoscience Frontiers. 9:1479–1493.
- Voggenreiter WR. 1993. Structure and evolution of the Kapuni Anticline, Taranaki Basin, New Zealand: evidence from Kapuni 3D seismic survey. New Zealand Journal of Geology and Geophysics. 36:77–94.
- Waterhouse BC, White PJ. 1994. Geology of the Raglan-Kawhia area. Scale 1:50 000. Institute of Geological & Nuclear Sciences geological map 13. 1 sheet and 48 p. Lower Hutt, New Zealand. Institute of Geological and Nuclear Sciences Limited.
- Weissel JK, Hayes DE, Herron EM. 1977. Plate tectonic synthesis: the displacements between Australia, New Zealand and Antarctica since the Late Cretaceous. Marine Geology. 25(1–3): 231–227.
- Wolf SG, Huismans RS, Braun J, Yuan X. 2022. Topography of mountain belts controlled by rheology and surface processes. Nature. 606(7914):516–521. doi:10.1038/s41586-022-04700-6.