
ABSTRACT
Despite being endangered internationally and protected nationally, little consideration has been given to the occurrence of green turtles (Chelonia mydas) in New Zealand. New Zealand lies on the southern boundary of the distributional range of green turtles in the southwestern Pacific, with individuals found within these waters historically considered to be occasional visitors or stragglers incidentally carried by ocean currents. However, the present work shows that green turtles are present year round in New Zealand’s northern waters (c. 34°–38° S). A review of sighting, stranding and incidental capture data collected between 1895 and 2013 illustrate New Zealand’s green turtle population comprises post-pelagic immature juveniles to large subadults. The female:male sex ratio of 1.7:1 is similar to those reported from warm temperate foraging grounds in eastern Australia. A subsample of new recruits indicates green turtles recruit to neritic habitats at approximately 40.8 cm curved carapace length. This study suggests that New Zealand’s neritic habitats constitute a transitional developmental ground for post-pelagic immature green turtles. We observed an exponential increase in the number of documented records over time, though whether this is due to increased numbers of turtles or increased reporting rates, or both, is unclear and warrants further investigation. More broadly, this work provides a baseline understanding of the ecology of green turtles at the edge of their range, providing opportunities to investigate regional niche modelling and connectivity of this highly mobile species, while also monitoring broad-scale effects of climate-induced environmental change.
Introduction
The green turtle (Chelonia mydas) has a circum-global distribution, ranging throughout tropical and subtropical seas (Hirth Citation1997). They exhibit complex life history patterns which are marked by distinct ontogenetic habitat shifts, coupled with long-distance breeding and foraging migrations (Bjorndal Citation1997; Bolten Citation2003). Accordingly, a population’s total range can be extensive, dispersing widely to encompass coastal nesting areas, neritic foraging grounds, oceanic habitats and migratory pathways (Balazs Citation1976; Hirth Citation1997; Bolten Citation2003; Luschi et al. Citation2003; Boyle & Limpus Citation2008). Upon entering the ocean for the first time, neonate hatchlings immediately disperse away from shallow predator-rich coastal waters into oceanic habitats where they forage as opportunistic omnivorous macro-planktivores in the epipelagic zone (Bjorndal Citation1997; Boyle & Limpus Citation2008). During this life stage, they will remain in the oceanic habitat for a period of 3 to 10 years, before settling into neritic foraging and developmental habitats at approximately 30–45 cm curved carapace length (CCL) (Balazs Citation1985; Musick & Limpus Citation1997; Zug et al. Citation2002; Bolten Citation2003; Limpus et al. Citation2005; Arthur et al. Citation2008). Once juveniles recruit and take up residence in neritic habitats, they may remain geographically localised, possibly for decades, until they reach maturity (Balazs et al. Citation1987; Limpus & Chaloupka Citation1997; Seminoff et al. Citation2002; Koch et al. Citation2007; Senko et al. Citation2010). At the onset of maturity, adult green turtles undertake repeated breeding migrations to nesting rookeries, eventually returning to preferred foraging grounds in between breeding episodes (Hirth Citation1997).
Despite a wide global distribution, the geographic range of green turtles is generally constrained by the subtropical 20 °C surface isotherm (Marquez Citation1990; Davenport Citation1997; Hirth Citation1997). This is because, as with many marine ectotherms, marine turtles rely on the ambient environmental temperature to support digestion rates and ultimately growth and survival (Avery et al. Citation1993). Therefore, temperature is one of the key environmental factors that regulate the physiological performance and ultimately the spatio-temporal distribution of green turtles (Spotila et al. Citation1997). If exposed to temperatures below their thermal tolerance for extended periods, adverse effects can lead to pathological and potentially fatal conditions (Schwartz Citation1978; Witherington & Ehrhart Citation1989; Spotila et al. Citation1997; Sadove & Pisciotta Citation1998; Southwood et al. Citation2003). Rapid decreases in temperature to below 10 °C can result in ‘cold stunning’ and potentially stranding, while the lethal temperature for chelonid marine turtles in experimental conditions is c. 8 °C (Schwartz Citation1978; Ogren & McVea Citation1995).
Temperate New Zealand is one habitat that falls outside the preferred thermal envelope (at least seasonally) for this species; where the average sea surface temperature (SST) in northern New Zealand ranges between 20–23 °C in summer and 14 °C in winter (Chiswell Citation1994; Duffy Citation2002). Early published reports considered green turtles found in New Zealand waters as ‘waifs or strays’ (McCann Citation1966a) or occasional visitors (McCann Citation1966b). The most recent review of green turtle occurrences in New Zealand waters (Gill Citation1997), reviewed sparse sighting and stranding data spanning 125 years and reported an absence of green turtles in austral winter (July) and a significant bi-modal seasonal peak in abundance (summer and spring). Although this review did acknowledge that a small sample size and seasonal observer bias limited the strength of the results, this work concluded that green turtles were ‘stragglers’ from Australia or further north (Gill Citation1997). Green turtles were mostly found during warmer seasonal months within northern New Zealand waters (Northland), with their influx coinciding with El Niño Southern Oscillation (ENSO) La Niña periods when SSTs were higher than the average for this region of New Zealand.
In temperate regions where SST gradually decreases to around 15 °C during winter, populations can persist year round. For example, at Moreton Bay, Australia (an important warm temperate foraging ground), green turtles actively feed at 15 °C (Read et al. Citation1996), while further south in New South Wales, green turtles remain active in water as low as 12 °C (C.J. Limpus, pers. obs). These winter temperatures are similar to those experienced in northern New Zealand (Chiswell Citation1994), with the SST regime characterised by the 20 °C isotherm seasonally expanding and retracting across the North Island. To our knowledge there are no recent reviews that have examined the distribution and occurrence of green turtles throughout New Zealand waters. The aim of this study, therefore, was to revisit the straggler or occasional visitor hypothesis by compiling 118 years of sighting and stranding data to determine the spatio-temporal distribution and population structure of green turtles in New Zealand. More specifically, we evaluated evidence for: 1. an increase in records of turtles over recent decades; 2. persistent, year-round presence of turtles; 3. variation in turtle records with seasons, coasts (west vs. east coast of northern New Zealand) and anomalies in SST.
Methods
Sighting, stranding and incidental capture data
Sighting, stranding and incidental capture data from New Zealand between 1895 and 2013 were compiled to form the New Zealand Marine Turtle Sightings and Stranding Database (NZMTSSD) for this study. Compiled data included date, location, record type (sighting, stranding or incidental capture) and biometric data (CCL). All records from Gill (Citation1997) were combined with validated records of sightings or strandings collected between 1997 and 2013. Sources included published and unpublished (grey) literature, validated reports from individuals of the public, and records from government and non-government organisations. In this work, ‘New Zealand’ refers to both North and South Islands, encompassing those outlying islands on the continental shelf within the 200 m isobath and the seas out to the 200 nm Economic Exclusion Zone (EEZ). Records from New Zealand’s territorial Kermadec Islands (c. 900 km northeast of New Zealand at c. 30° S) were omitted from this study because this subtropical island group is biogeographically distinct from mainland New Zealand.
Records were initially categorised into three ‘types’: ‘Sighting’ (sightings of live, free-ranging green turtles); ‘Stranding’ (green turtles found alive or dead, either as beach cast or floating at sea); or ‘Incidental’ capture (by-caught green turtles in recreational or commercial fishery activities). For the present analysis, Incidental captures were included with all Sightings data, as both record types were considered to represent live, free-ranging turtles at the time of capture.
To determine variation in the mean number of records through time (within each quarter [season]-year) R software (R Development Core Team Citation2014) was used to fit a generalised linear model (McCullagh & Nelder Citation1989), assuming a log-link function and a Poisson error distribution. Counts of records were modelled using the predictors T: Type (factor with two levels: Sighting/Incidental capture and Stranding), C: Coast (factor with two levels: East and West), Y: Year (continuous), Q: Quarter (factor with four levels: Jan–Mar, Apr–Jun, Jul–Sep, Oct–Dec), QTA: Quarterly Temperature Anomaly (continuous), and ENSO: El Niño Southern Oscillation Multivariate Index (continuous). The most complex model involved fitting three-way interactions between Type, Coast and each of the other four predictors (i.e. Y×T×C, Q×T×C, ENSO×T×C and QTA×T×C). A backwards stepwise procedure based on the AIC criterion was subsequently applied to remove extraneous predictors. Consequently, all terms involving ENSO were removed from the model. Many two-way interactions and two three-way interactions (i.e. C×T×Y and C×T×Q) were retained in the model. Eight records from prior to 1983 were removed from this analysis because they were too temporally sparse to be informative.
Some specific hypotheses regarding interaction terms were tested in post-hoc analyses using the phia package in R (De Rosario-Martinez Citation2015). Where Year interacted with other terms in the model, a significant effect of Year within and across the levels of the interacting term was tested. Specifically, a significant effect of Year was tested within each combination of Coast and Type, while a difference in the Year-slope between Coasts within each Type was also tested. Interactions between Quarter (season) and Type and Coast were also investigated.
QTA was calculated using a 47 year time series of the SST taken at University of Auckland’s Leigh Marine Laboratory (c. 36.3° S, 174.8° E) on the east coast north of Auckland. Averages were calculated for each quarter in each year and then the anomaly was taken by subtracting the respective mean for each quarter across all years, giving the deviation from the expected long-term average for that quarter. Although the Leigh coastal SST dataset was collected from a single location, the data is accordant with the range, amplitude and variability described for northern New Zealand by Chiswell (Citation1994) and Duffy (Citation2002). Therefore the Leigh coastal SST dataset was chosen as a suitable broad-scale regional proxy for the average long-term inshore SST regime for both coasts of northern North Island.
To investigate seasonal variations in Sighting and Stranding patterns between the west and east coasts of New Zealand, we applied a two-dimensional Pearson’s χ2 test. A one-way analysis of variance (ANOVA) was used to compare season (Jan–Mar, Apr–Jun, Jul–Sep, Oct–Dec) and the size of stranded turtles (CCL) to investigate the influence of SST (season) upon the stranding of different size classes. Distribution maps were created using ESRI ArcMap v10.1.
Size-class, sex ratio and maturity
Standard CCL measurements (± 0.1 cm) were recorded for all turtles recovered during the course of this study (Limpus et al. Citation1994; Bolten Citation1999). Biometric data was then augmented with CCL data obtained from the New Zealand Department of Conservation Herpetofauna Database, marine turtle rehabilitation records from Kelly Tarlton’s Sea Life Aquarium (Auckland) and Gill (Citation1997). To examine the green turtle population structure CCL measurements were grouped into 5 cm size class categories and the frequency distribution described (Limpus et al. Citation1994; Seminoff et al. Citation2002; Arthur & Balazs Citation2008). In addition, ‘new’ and ‘recent’ recruits were identified following the descriptions of Limpus et al. (Citation2005).
Where dead stranded turtles were recovered during the course of the study gross examinations were undertaken, with sex and maturity status determined by in situ examination of the gonads and associated ducts, following the criteria of Rainey (Citation1981) and Limpus & Reed (Citation1985). Maturity status was categorised as immature or mature (Limpus et al. Citation2005; Meylan et al. Citation2011). Sex ratio was calculated as the proportion of identifiable females in the sample. To test the null hypothesis that there was no significant departure from a sex ratio of 2:1 within the samples—the demonstrated sex ratio for green turtles within eastern Australia (Limpus et al. Citation2005; Limpus Citation2008)—a χ2 test with Yates correction factor was applied.
Results
Green turtle spatial distribution in New Zealand
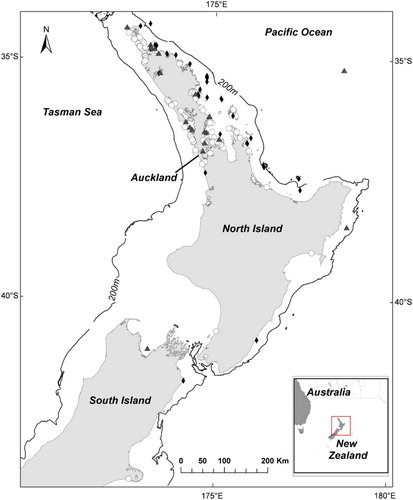
In total, 194 green turtle records were obtained, comprising 36 previously published records (Gill Citation1997, encompassing records from 1895 to 1996) and 158 unpublished records (encompassing records from 1997 to 2013). Records were mostly from the North Island (north of c. 41° S); only three records were reported from the South Island, with the most southerly record from Birdlings Flat, Canterbury (c. 43.8° S). Ninety-two percent (n = 178) of all records were from Auckland northward (c. 37° S) (). Stranded turtles comprised 65% (n = 126) of records, while sightings and incidentally captured turtles comprised 25% (n = 49) and 10% (n = 20), respectively. A large proportion of records (69% of those between 1895 and 2013) were from the east coast of the North Island. More specifically, nearly all sightings of free-ranging turtles (98%, n = 48) and almost two thirds of all strandings (66%, n = 83) occurred on the east coast of the North Island. There was only one reported sighting of a free-ranging turtle from the west coast. Of the 20 documented incidental captures, seven occurred on the west coast and 13 occurred on the east coast. All records (except two) were recorded within New Zealand’s inshore waters (0–200 m). The two records of green turtles offshore were from northeast of New Zealand; a sighting approximately 24 km west of North Cape (at c. 570 m water depth) and an incidental capture by a commercial shallow long-line fishing vessel approximately 300 km west of Whangarei (at c. 35° S and c. 2000 m water depth). The incidentally captured turtle was a juvenile estimated at < 45 cm CCL and clearly exhibited pronounced plastron ridges, white ventral surface and sharp carapace edges characteristic of an oceanic phase individual.
Figure 1. Distribution of green turtle records from New Zealand from 1895 to July 2013 (n = 194). Stranded turtles (○); Sightings (♦); Incidental captures (▴).
Size-class, sex ratio and maturity
The size-class frequency distribution of all measured turtles (CCL) encompassed a range of 17.6–94.6 cm (μ = 51.9 cm, SD = 11.6, n = 86) (). The smallest turtle recorded was considered an oceanic-phase turtle based on size (17.6 cm CCL) and morphological characteristics. The next smallest turtle had a CCL of 37.3 cm. No green turtles in the hatchling size range were observed. Of 64 turtles examined externally, 8% (n = 5) of turtles exhibited morphological characteristics of ‘new’ recruits (μ = 40.8 cm CCL, SD = 3.3, range 37.3–44.8 cm), while a further 39% (n = 25) turtles were defined as ‘recent’ recruits (μ = 45.6 cm CCL, SD = 2.5, range 41.9–52.5 cm); new and recent recruits comprised 47% (μ = 44.8 cm CCL, SD = 3.2, range 37.3–52.5 cm, n = 30) of all turtles examined externally. New or recent recruits were encountered every month of the year, suggesting no temporal pattern of settlement.
Figure 2. Size-class frequency distribution of green turtles in New Zealand recorded from 1895 to 2013. Mean curved carapace length (CCL) = 51.9 cm (SD ± 11.6 cm, n = 86).
Of 41 green turtles examined, 15 were males, 25 were females and one was undetermined. All turtles examined were immature juveniles. In all males the testes were undeveloped and inactive, while in all females the ovaries were inactive, with unexpanded stroma with no sign of vitellogenesis. Expressed as a F:M sex ratio (1.7:1), there was no significant difference from 2:1 (χ2 = 0.3, P = 0.58, d.f. = 1 with Yates correction factor). A t-test revealed no significant difference in the size (CCL) between male and female turtles (t = 0.97, P = 0.34).
Seasonal patterns
The generalised linear model (GLM) selected by the AIC contained the predictors Type, Coast, Year, Quarter, QTA and a number of interactions (). Quarter (season) effects were different among combinations of Type and Coast (). This three-way interaction was not significant at the 5% level; however, the AIC model selection process favoured retaining it in the model. Quarter had a significant effect on east coast sightings (χ2 = 12.00, P = 0.0296; C) with July–September (winter) being significantly more likely to have low sightings. However, there was no significant effect of Quarter on strandings on the west coast (χ2 = 8.58, P = 0.1064; A) and east coast (χ2 = 3.32, P = 0.6899; B), and sightings on the west coast (χ2 = 0.90, P = 0.8255), though it is likely that these tests were low powered. Two-way interactions showed that, overall (across coasts), quarterly effects were not significant for either Sightings (χ2 = 5.78, P = 0.2457) or Strandings (χ2 = 5.25, P = 0.2457). However, Quarter did show a strongly significant effect on the east coast overall (χ2 = 14.07, P = 0.0056), with records significantly less likely to occur during July–September (winter). This effect corresponds to the pattern of sightings described above. Quarter did not significantly affect west coast records (χ2 = 2.03, P= 0.5654). The one-way ANOVA showed no significant differences in the CCL of stranded turtles and season within which they stranded (F3,72 = 1.141, P = 0.338; ).
Figure 3. Predicted means from a Poisson generalised linear model of the number of sightings and strandings per quarter for 2014, assuming typical temperatures. Error bars represent 95% confidence intervals around the means. A, West coast strandings; B, east coast strandings; C, east coast sightings and captures.

Table 1. Analysis of deviance table for a Poisson generalised linear model of the number of green turtle records.
Table 2. One-way ANOVA comparing curved carapace length (CCL) of stranded turtles and the seasons in which they were recorded (Jan–Mar, Apr–Jun, Jul–Sep, Oct–Dec; n = 76).
Sea surface temperature
The coastal SST regime for northern North Island calculated from the Leigh dataset had a range average of 14 °C (August) to 20.6 °C (February), giving an amplitude of 6.6 °C for the North Island’s northeast. The lowest recorded temperature at Leigh was 12.3 °C and the highest was 23.9 °C, with an average annual long-term mean of 17.2 °C. There was a significant negative effect of QTA (χ2 = 4.27, P = 0.0389; ) on the number of records overall, suggesting there were fewer records when it was unusually warm. The QTA effect interacted with the predictor Coast (χ2 = 5.85, P = 0.0156) and, when tested within Coasts, the result was significant for the west (χ2 = 9.42, P = 0.0043) but not the east coast (χ2 = 0.40, P = 0.5271). This suggests that there were more strandings on the west coast when there were unusually low temperatures recorded at Leigh. There was no evidence of more strandings on the east coast during unusually low SSTs; however, strandings were predicted to be more consistent throughout the year (B). In addition, there was no evidence of a difference in the effect of QTA between strandings and sightings; therefore, the QTA:Type interaction was excluded by the model. There was also no detectable relationship between the ENSO Multivariate Index and records of turtles.
Annual trends
The number of green turtle reports has increased each decade since records began, with 98% of all records reported since 1983. From 1983, green turtles were reported every year, with the greatest number recorded during 2011 (18) and 2012 (25). Overall, there were more strandings than sightings (Likelihood ratio χ2 = 16.4, P = 0.0001; ). There was a significant overall linear increase in the log-mean number of records over the 30 years of this study (χ2 = 107.0, P < 0.0001; ). This corresponds to an exponential increase on the untransformed scale (). Overall, there was no significant difference between the Year-slopes of the east and west coasts for strandings (χ2 = 1.49, P = 0.2223). However, the rates of increase in sightings over time were marginally different between the east and west coasts (χ2 = 5.06, P = 0.0496).
Figure 4. Predictions from a Poisson generalised linear model of the mean of the quarterly counts of turtle records between 1983 and 2013. Circles represent the number of counts recorded, the black lines are the predicted means, and the grey areas show the 95% confidence bounds for the means. A, West coast strandings; B, east coast strandings; C, east coast sightings and captures.
Discussion
Distribution
Sighting, stranding and incidental capture data reveal a concentration of green turtle occurrence across northern New Zealand; a region of New Zealand’s landmass that dissects the western boundary of the South Pacific subtropical gyre system (SPSG). The SPSG and its associated currents in the southwest Pacific (Southern Equatorial Current [SEC], East Australian Current [EAC] and Tasman Front [TF]) have been described as the key transport mechanism for post-hatchling marine turtles dispersing from southwest Pacific rookeries (Boyle Citation2006; Boyle et al. Citation2009). Therefore, it seems likely that oceanic-phase juvenile green turtles passively entrained in the SPSG would eventually arrive in New Zealand via the TF and the subtropical East Auckland Current (EAUC)—a natural extension of the TF within the SPSG system. The influence of the TF and EAUC upon the influx of marine reptiles was initially suggested by Gill (Citation1997). Data presented herein support this, with 69% of the total records of green turtles originating from the northeast inshore region of the North Island. This northeast region of New Zealand is where the EAUC (and associated eddies) are the dominant oceanographic transport system (Roemmich & Sutton Citation1998; Stanton & Sutton Citation2003). The TF and EUAC have also been identified as the primary mechanism responsible for the influx of tropical fish species to New Zealand (Francis & Evans Citation1993; Francis et al. Citation1999).
Size-class, sex ratio and maturity
Our data support the hypothesis that oceanic-phase juvenile green turtles are settling into nearshore neritic habitats following a natural dispersal and settlement pattern. Size-class frequency and sexual maturity data show the New Zealand population comprises a discrete assemblage of post-settlement immature turtles ranging from small juveniles to large subadults (µ = 51.9 cm CCL, SD = 11.6, range 17.6–94.6 cm, n = 86). Size at recruitment and a female-biased proportional sex ratio of 0.63 (F:M sex ratio of 1.7:1) within this study are similar to the expected sex ratio for eastern Australian foraging populations (Limpus & Walter Citation1980; Limpus & Reed Citation1985; Limpus et al. Citation1994). The identification of five new recruits in the range of 37.3–44.8 cm CCL indicates settlement occurs at c. 40.8 cm CCL.
Only 35% of examined turtles were new or recent recruits, with the remaining 65% (n = 34) comprised of older age classes up to large subadults (µ = 63 cm CCL, SD = 9.9, range 46.5–94.6 cm). If turtles settle at c. 40.8 cm CCL as shown, this suggests these older age classes have occupied coastal neritic habitats for some time, hence exhibiting a degree of residency. However, if residency does occur, the absence of mature adult turtles does suggest that turtles are departing from New Zealand coastal areas prior to the onset of puberty. Similarly, discrete assemblages of immature age classes at neritic foraging grounds and puberty related migrations have been observed in other regions (Koch et al. Citation2007; Meylan et al. Citation2011). Immature-dominated cohorts occupying neritic foraging areas were initially identified by Carr & Caldwell (Citation1956) and later defined by the term ‘developmental migrations’ (Carr et al. Citation1978). This concept denotes the post-settlement progression of juveniles transitioning through a series of developmental habitats as they change in size and ecological requirements prior to ultimately settling at an adult foraging ground (Carr Citation1980; Musick & Limpus Citation1997; Bolten Citation2003; Moncada et al. Citation2006; Meylan et al. Citation2011). In these studies, size-class partitioning was influenced by differing habitat requirements between age classes (e.g. food availability, predation risk, and dispersal and migratory behaviour; Moncada et al. Citation2006; Koch et al. Citation2007; Bresette et al. Citation2010; Meylan et al. Citation2011). Such patterns in size-class partitioning may then be occurring in New Zealand waters, where northern neritic habitats constitute a temporary developmental habitat, with juvenile green turtles dispersing across the southwestern Pacific transitioning through this habitat for a period of time.
Seasonality
Further evidence supporting a temporary developmental habitat in northern New Zealand was the consistent year round occurrence of green turtles shown in the present work. Contrasting with the previous review by Gill (Citation1997) this work found no correlation between ENSO (La Niña periods) and the influx of green turtles, and, despite an average winter SST of 14 °C, sightings of live free-ranging turtles were recorded in all seasons. This contradicts the currently accepted view that green turtles appear incidentally as stragglers or occasional visitors (McCann Citation1966b, Citation1966a; Gill Citation1997). Nevertheless, data presented here detected a significant decrease in sightings on the east coast during winter, despite stranding rates remaining relatively stable throughout the year. Several possibilities may lead to lower detection probability during colder seasons: 1. a seasonal reduction in marine observers (e.g. recreational fishers and divers) during winter (Gill Citation1997); 2. a compensatory response to cooler water by temporarily migrating to warmer water (offshore) during winter (Mendonca Citation1983; Epperly et al. Citation1995; Ogren & McVea Citation1995); and 3. turtles employing a ‘sit and wait’ behaviour during winter, where turtles undergo long quiescent dives of up to several hours with very short surface intervals (Hochscheid et al. Citation2005). Despite this, the present work does indicate a more permanent occurrence of green turtles in New Zealand’s neritic habitats than previously concluded (Gill Citation1997). The temperature regime described by the Leigh dataset does suggest overwintering turtles would experience some degree of temperature related stress; however, their occurrence in similarly cool winter temperatures has been observed in Australia. For example, at Moreton Bay, Australia (a permanent warm temperate foraging ground), green turtles have been shown to actively feed at 15 °C (Read et al. Citation1996), while in New South Wales, green turtles remain active in water as cool as 12 °C (C.J. Limpus, pers. obs).
Although season did not affect the occurrence of green turtles overall, strandings on the west coast were significantly affected by QTA. On the west coast there was an increase in strandings during winter, and this was found to be significantly higher during unusually cold winters (reflected by the QTA at Leigh). A correlation between westerlies and southerlies, and colder SST at Leigh has been observed in other studies (Greig et al. Citation1988). Therefore, we suggest the prevalence of stronger westerly winds and higher storm frequency during winter may substantially impact green turtle populations within the west coast, resulting in higher incidence of stranded turtles within this region. Correspondingly, a marginal decrease in stranded turtles on the east coast during winter may reflect an inverse effect, where stronger offshore westerly winds reduce the probability of stranding incidence. Similarly, a correlation between onshore storm events and turtle strandings has been observed on the east Australian coast (Boyle Citation2006). One unexpected result was the negative effect of the QTA where fewer records were observed when the SST (based on the QTA) was unusually warm. However, the negative effect of the QTA could be attributed to the fact that the majority of records were of stranded animals; hence, when SST are unusually warm, fewer temperature-related strandings will result in fewer stranding numbers overall during these periods. Also, no relationship between CCL and season was detected; suggesting environmental conditions are exerting equal influence across the population.
Annual trends
The strandings and sightings data show an exponential increase in the number of green turtle records over the time period examined. This increase in records is attributed at least in part to an increase in the number of observers reporting sightings and strandings as a result of public awareness efforts during the course of this study. Similarly, increased observer presence (e.g. SCUBA divers, game fishers and commercial fisheries) over the last 30 years has resulted in increased numbers of newly recorded tropical and subtropical fishes from northeastern North Island (Francis et al. Citation1999). Nevertheless, other factors that may influence the observed increase should not be discounted. For example, the observed increase may parallel conservation efforts in the region. In the southwestern Pacific, the nearest potential source populations are those at the Southern Great Barrier Reef off Australia’s east coast. These populations have recovered over the last several decades following significant declines due to human over exploitation and other anthropogenic mortality (Limpus Citation2008). Consequently, if New Zealand green turtles do derive from these populations, we would expect the increase in abundance of oceanic-phase juveniles dispersing through the region as a result would eventually be reflected in the number of observations in New Zealand waters.
Increasing evidence shows that climate change is leading to rapid poleward shifts in the distributional range of marine species (Sorte et al. Citation2010; Burrows et al. Citation2011; Feary et al. Citation2014). These climate-mediated extensions have been observed in a range of tropical fish populations, though most substantially throughout the east coast of Australia, driven by an associated strengthening of the subtropical gyre and poleward penetration of the EAC over the last 60 years (Booth et al. Citation2007; Ridgway Citation2007; Last et al. Citation2011). The strengthening of the EAC has resulted not only in the broadening and extension of this boundary current and its associated eddy system but also led to an increase in the SST of the Tasman Sea (Cai et al. Citation2005; Neuheimer et al. Citation2011). Hence, such changes in oceanographic conditions could theoretically transport more juvenile green turtles from eastern Australian rookeries (or farther afield) toward New Zealand waters. Once they disperse to this region of the south Pacific, they would remain in this oceanic developmental habitat until they settle into neritic habitats in northern New Zealand at the size observed here in this study.
Conclusions
Empirical evidence presented here supports the hypothesis that green turtles occurring in New Zealand neritic habitats reflect a natural post-oceanic settlement behaviour rather than oceanic-phase stragglers incidentally blown ashore by storm and other stochastic events. We propose that New Zealand comprises a temperate intermediary habitat where oceanic-phase green turtles dispersing across the southwest Pacific settle and transition through this habitat for a period of time before departing to other regions. This contrasts with the prevailing view that green turtles represent stragglers incidentally blown off course or occasional visitors that seasonally inhabit New Zealand’s inshore waters. Although this study has provided some important insights into our understanding of green turtles in New Zealand, several questions still remain. Investigating residency and foraging behaviour would provide further insight into temporal occupancy and habitat use. Furthermore, identifying the genetic origin of the population will assist with establishing region-wide population connectivity. This is particularly important for defining dispersal patterns and migratory pathways. Additionally, for green turtles along the edge of their range, monitoring their response to temperature shifts in relation to rising global temperatures (as noted in Pilcher et al. Citation2014) will be of fundamental importance for managing this species in the southwest Pacific.
Acknowledgements
We are grateful to the Department of Conservation and Kelly Tarlton’s Sea Life Aquarium for their logistical support during the course of this work. Special thanks to B Gill for providing his original dataset and research discussions early on. Thanks to Coastal-Marine Research Group (C-MRG) research assistants B Outhwaite and C Lea, and C Blomfield for their assistance during necropsies. Coastal sea surface temperature data were kindly provided by the Auckland University Leigh Marine Laboratory. We thank D Feary for comments on earlier versions of the manuscript. We also acknowledge the comments from two anonymous reviewers. This research was authorised by the Department of Conservation Research Permits AK-30931-FAU, NO-2611-RES, AK-26280-RES, and AK-26092-RES; and Massey University Animal Ethics approved protocols 10/05, 11/62 and 14/73.
Associate Editor: Associate Professor Bruce Robertson.
Disclosure statement
No potential conflict of interest was reported by the authors.
ORCiD
DA Godoy http://orcid.org/0000-0003-2944-1961
Additional information
Funding
References
- Arthur KE, Balazs GH. 2008. A comparison of immature green turtle (Chelonia mydas) diets among seven sites in the main Hawaiian Islands. Pac Sci. 62:205–217. doi: 10.2984/1534-6188(2008)62[205:ACOIGT]2.0.CO;2
- Arthur KE, Boyle MC, Limpus CJ. 2008. Ontogenetic changes in diet and habitat use in green sea turtle (Chelonia mydas) life history. Mar Ecol Prog Ser. 362:303–311. doi: 10.3354/meps07440
- Avery HW, Spotila JR, Congdon JD, Fischer Jr RU, Standora EA, Avery SB. 1993. Roles of diet protein and temperature in the growth and nutritional energetics of juvenile slider turtles, Trachemys scripta. Physiol Zool. 66:902–925. doi: 10.1086/physzool.66.6.30163746
- Balazs GH. 1976. Green turtle migrations in the Hawaiian archipelago. Biol Cons. 9:125–140. doi: 10.1016/0006-3207(76)90045-8
- Balazs GH. 1985. Status and ecology of marine turtles at Johnston Atoll. Atoll Research Bulletin. The Smithsonian Institute, Washington, D.C. 285. 49 p.
- Balazs GH, Forsyth RG, Kam AKH. 1987. Preliminary assessment of habitat utilization by Hawaiian green turtles in their resident foraging pastures. U.S. Department of Commerce, Honolulu. NOAA Technical Memorandum, NOAA-TM-NMFS-SWFC-71. 107p.
- Bjorndal KA. 1997. Foraging ecology and nutrition of sea turtles. In: Lutz PL, Musick JA, editor. The biology of sea turtles. Boca Raton, Florida: CRC Press; p. 199–231.
- Bolten AB. 1999. Techniques for measuring sea turtles. In: Eckert KL, Bjorndal KA, Abreu-Grobois FA, Donnelly M, editors. Research and management techniques for the conservation of sea turtles. Washington, D.C.: IUCN/SSC Marine Turtle Specialist Group Publication No.4.; p. 110–114.
- Bolten AB. 2003. Variation in sea turtle life history patterns: neritic vs. oceanic developmental stages. In: Lutz PL, Musick JA, Wyneken J, editor. The biology of sea turtles, volume II. Boca Raton, Florida: CRC Press; p. 243–257.
- Booth DJ, Figueira WF, Gregson MA, Brown L, Beretta G. 2007. Occurrence of tropical fishes in temperate southeastern Australia: role of the East Australian Current. Estuarine, Coastal and Shelf Science. 72:102–114. doi: 10.1016/j.ecss.2006.10.003
- Boyle MC. 2006. Post-hatchling sea turtle biology. [Unpublished PhD thesis]. Townsville, Queensland, Australia: James Cook University, 128p.
- Boyle MC, FitzSimmons NN, Limpus CJ, Kelez S, Velez-Zuazo X, Waycott M. 2009. Evidence for transoceanic migrations by loggerhead sea turtles in the southern Pacific Ocean. Proceedings of the Royal Society B: Biological Sciences. 276:1993–1999.
- Boyle MC, Limpus CJ. 2008. The stomach contents of post-hatchling green and loggerhead sea turtles in the southwest Pacific: an insight into habitat association. Mar Biol. 155:233–241. doi: 10.1007/s00227-008-1022-z
- Bresette MJ, Witherington BE, Herren RM, Bagley DA, Gorham JC, Traxler SL, Crady CK, Hardy R. 2010. Size-class partitioning and herding in a foraging group of green turtles Chelonia mydas. Endangered Species Research. 9:105–116. doi: 10.3354/esr00245
- Burrows MT, Schoeman DS, Buckley LB, Moore P, Poloczanska ES, Brander KM, Brown C, Bruno JF, Duarte CM, Halpern BS, et al. 2011. The pace of shifting climate in marine and terrestrial ecosystems. Science. 334:652–655. doi: 10.1126/science.1210288
- Cai W, Shi G, Cowan T, Bi D, Ribbe J. 2005. The response of the Southern Annular Mode, the East Australian Current, and the southern mid-latitude ocean circulation to global warming. Geophys Res Lett. 32:1–4.
- Carr A. 1980. Some problems of sea turtle ecology. American Zoologist. 20:489–498. doi: 10.1093/icb/20.3.489
- Carr A, Caldwell DK. 1956. The ecology and migrations of sea turtles, 1: results of field work in FLorida, 1955. Am Mus Novit. 1793:1–24.
- Carr A, Carr MH, Meylan AB. 1978. The ecology and migrations of sea turtles, 7: The West Caribbean green turtle colony. B Am Mus Nat Hist. 162:1–48.
- Chiswell SM. 1994. Variability in sea surface temperature around New Zealand from AVHRR images. New Zeal J Mar Fresh. 28:179–192. doi: 10.1080/00288330.1994.9516606
- Davenport J. 1997. Temperature and the life-history strategies of sea turtles. J Therm Biol. 22:479–488. doi: 10.1016/S0306-4565(97)00066-1
- De Rosario-Martinez H. 2015. phia: Post-Hoc Interaction Analysis. [cited 2015 August 14] Available from: http://cran.r-project.org/package = phia.
- Duffy CAJ. 2002. Distribution, seasonality, lengths, and feeding behaviour of whale sharks (Rhincodon typus) observed in New Zealand waters. New Zeal J Mar Fresh. 36:565–570. doi: 10.1080/00288330.2002.9517112
- Epperly SP, Braun J, Veishlow A. 1995. Sea turtles in North Carolina waters. Conserv Biol. 9:384–394. doi: 10.1046/j.1523-1739.1995.9020384.x
- Feary DA, Pratchett MS, Emslie MJ, Fowler AM, Figueira WF, Luiz OJ, Nakamura Y, Booth DJ. 2014. Latitudinal shifts in coral reef fishes: why some species do and others do not shift. Fish Fish. 15:593–615. doi: 10.1111/faf.12036
- Francis MP, Evans J. 1993. Immigration of subtropical and tropical animals into north-eastern New Zealand. In: Battershill CN, Schiel DR, Jones GP, Creese RG, MacDiarmid AB, editor. Proceedings of the Second International Annual Temperate Reef Symposium, Auckland, New Zealand 7-10 January 1992; p. 131–136.
- Francis MP, Worthington CJ, Saul P, Clements KD. 1999. New and rare tropical and subtropical fishes from northern New Zealand. New Zeal J Mar Fresh. 33:571–586. doi: 10.1080/00288330.1999.9516901
- Gill BJ. 1997. Records of turtles and sea snakes in New Zealand, 1837-1996. New Zeal J Mar Fresh. 31:477–486. doi: 10.1080/00288330.1997.9516781
- Greig MJ, Ridgway NM, Shakespeare BS. 1988. Sea surface temperature variations at coastal sites around New Zealand. New Zeal J Mar Fresh. 22:391–400. doi: 10.1080/00288330.1988.9516310
- Hirth HF. 1997. Synopsis of biological data on the green turtle Chelonia mydas (Linnaeus 1758). Biological Report 97. Fish and Wildlife Service, Washington, D. C. 128 p.
- Hochscheid S, Bentivegna F, Hays GC. 2005. First records of dive durations for a hibernating sea turtle. Biol Letters. 1:82–86. doi: 10.1098/rsbl.2004.0250
- Koch V, Brooks LB, Nichols WJ. 2007. Population ecology of the green/black turtle (Chelonia mydas) in Bahía Magdalena, Mexico. Mar Biol. 153:35–46. doi: 10.1007/s00227-007-0782-1
- Last PR, White WT, Gledhill DC, Hobday AJ, Brown R, Edgar GJ, Pecl G. 2011. Long-term shifts in abundance and distribution of a temperate fish fauna: a response to climate change and fishing practices. Global Ecol Biogeogr. 20:58–72. doi: 10.1111/j.1466-8238.2010.00575.x
- Limpus CJ. 2008. A biological review of Australian marine turtle species. 2. Green turtle, Chelonia mydas (Linnaeus). Queensland Environmental Protection Agency, Brisbane. 95 p.
- Limpus CJ, Chaloupka MY. 1997. Nonparametric regression modelling of green sea turtle growth rates (southern Great Barrier Reef). Mar Ecol Prog Ser. 149:23–34. doi: 10.3354/meps149023
- Limpus CJ, Couper PJ, Read MA. 1994. The green turtle, Chelonia mydas, in Queensland: population structure in a warm temperate feeding area. Memoirs of the Queensland Museum. 35:139–154.
- Limpus CJ, Limpus DJ, Arthur KE, Parmenter CJ. 2005. Monitoring of green turtle population dynamics in Shoalwater Bay: 2000–2004. Great Barrier Reef Marine Park Authority Research Publication Series 83. Great Barrier Reef Marine Park Authority, Townsville. 60 p.
- Limpus CJ, Reed PC. 1985. The green turtle, Chelonia mydas, in Queensland: a preliminary description of the population structure in a coral reef feeding ground. In: Grigg GC, Shine R, Ehmann H, editors. The biology of Australasian frogs and reptiles. New South Wales: Surrey Beatty & Sons; p. 47–52.
- Limpus CJ, Walter DG. 1980. The growth of immature green turtles (Chelonia mydas) under natural conditions. Herpetologica. 36:162–165.
- Luschi P, Hays GC, Papi F. 2003. A review of long-distance movements by marine turtles, and the possible role of ocean currents. Oikos. 103:293–302. doi: 10.1034/j.1600-0706.2003.12123.x
- Marquez RM. 1990. FAO species catalogue. Vol. 11: Sea turtles of the world. An annotated and illustrated catalogue of sea turtle species known to date. FAO Fisheries Synopsis No. 125. Rome, FAO. 81 p.
- McCann C. 1966a. Key to the marine turtles and snakes occurring in New Zealand. Tuatara. 14:73–81.
- McCann C. 1966b. The marine turtles and snakes occurring in New Zealand. Tuatara. 5:201–215.
- McCullagh P, Nelder JA. 1989. Generalized linear models. 2nd ed. Boca Raton, FL: Chapman & Hall.
- Mendonca MT. 1983. Movements and feeding ecology of immature green turtles (Chelonia mydas) in a Florida lagoon. Copeia. 1983:1013–1023. doi: 10.2307/1445104
- Meylan PA, Meylan AB, Gray JA. 2011. The ecology and migrations of sea turtles: 8. Tests of the developmental habitat hypothesis. B Am Mus Nat Hist. 357:1–70. doi: 10.1206/357.1
- Moncada F, Abreu-Grobois FA, Muhlia-Melo A, Bell C, Tröeng S, Bjorndal KA, Bolten AB, Meylan AB, Zurita J, Espinosa G, et al. 2006. Movement patterns of green turtles (Chelonia mydas) in Cuba and adjacent Caribbean waters inferred from flipper tag recaptures. J Herpetol. 40:22–34. doi: 10.1670/39-05A.1
- Musick JA, Limpus CJ. 1997. Habitat utilization and migration in juvenile sea turtles. In: Lutz PL, Musick JA, editors. The biology of sea turtles. Boca Raton, Florida: CRC Press; p. 137–163.
- Neuheimer AB, Thresher RE, Lyle JM, Semmens JM. 2011. Tolerance limit for fish growth exceeded by warming waters. Nat Clim Change. 1:110–113. doi: 10.1038/nclimate1084
- Ogren LH, McVea C. 1995. Apparent hibernation by sea turtles in North American waters. In: Bjorndal KA, editor. Biology and conservation of sea turtles. Washington, D.C.: Smithsonian Institution Press; p. 127–132.
- Pilcher NJ, Perry L, Antonopoulou M, Abdel-Moati MA, Al Abdessalaam TZ, Albeldawi M, Al Ansi M, Al-Mohannadi SF, Baldwin R, Chikhi A, et al. 2014. Short-term behavioural responses to thermal stress by hawksbill turtles in the Arabian region. J Exp Mar Biol Ecol. 457:190–198. doi: 10.1016/j.jembe.2014.04.002
- Rainey W. 1981. Guide to sea turtle visceral anatomy. U.S. Department of Commerce, Miami. NOAA Technical Memorandum, NOAA NMFS-SEFSC-82. 87p.
- R Development Core Team. 2014. R: a language and environment for statistical computing. [cited 2015 August 3] Available from http://www.r-project.org/.
- Read MA, Grigg GC, Limpus CJ. 1996. Body temperatures and winter feeding in immature green turtles, Chelonia mydas, in Moreton Bay, Southeastern Queensland. J Herpetol. 30:262–265. doi: 10.2307/1565520
- Ridgway KR. 2007. Long-term trend and decadal variability of the southward penetration of the East Australian Current. Geophys Res Lett. 34:1–5.
- Roemmich D, Sutton P. 1998. The mean and variability of ocean circulation past northern New Zealand: determining the representativeness of hydrographic climatologies. Journal of Geophysical Research: Oceans. 103:13041–13054. doi: 10.1029/98JC00583
- Sadove SS, Pisciotta R. 1998. Assessment and initial treatment of cold-stunned sea turtles. Chelonian Conserv Bi. 3:84–87.
- Schwartz FJ. 1978. Behavioral and tolerance responses to cold water temperatures by three species of sea turtles (Reptilia, Cheloniidae) in North Carolina. Proceedings of the Florida and interregional conference on sea turtles, Jensen Beach, Florida 24-25 July 1976. Pp. 16-18.
- Seminoff JA, Resendiz A, Nichols WJ. 2002. Diet of east Pacific green turtles (Chelonia mydas) in the central Gulf of California, México. J Herpetol. 36:447–453. doi: 10.1670/0022-1511(2002)036[0447:DOEPGT]2.0.CO;2
- Seminoff JA, Resendiz A, Nichols WJ, Jones TT. 2002. Growth rates of wild green turtles (Chelonia mydas) at a temperate foraging area in the Gulf of California, México. Copeia. 2002:610–617. doi: 10.1643/0045-8511(2002)002[0610:GROWGT]2.0.CO;2
- Senko J, López-Castro MC, Koch V, Nichols WJ. 2010. Immature east Pacific green turtles (Chelonia mydas) use multiple foraging areas off the Pacific Coast of Baja California Sur, Mexico: first evidence from mark-recapture data. Pac Sci. 64:125–130. doi: 10.2984/64.1.125
- Sorte CJB, Williams SL, Carlton JT. 2010. Marine range shifts and species introductions: comparative spread rates and community impacts. Global Ecol Biogeogr. 19:303–316. doi: 10.1111/j.1466-8238.2009.00519.x
- Southwood AL, Darveau CA, Jones DR. 2003. Metabolic and cardiovascular adjustments of juvenile green turtles to seasonal changes in temperature and photoperiod. J Exp Biol. 206:4521–4531. doi: 10.1242/jeb.00689
- Spotila JR, O’Connor MP, Paladino FV. 1997. Thermal biology. In: Lutz PL, Musick JA, editors. The biology of sea turtles. Boca Raton, Florida: CRC Press; p. 297–314.
- Stanton BR, Sutton P. 2003. Velocity measurements in the East Auckland Current north-east of North Cape, New Zealand. New Zeal J Mar Fresh. 37:195–204. doi: 10.1080/00288330.2003.9517157
- Witherington BE, Ehrhart LM. 1989. Hypothermic stunning and mortality of marine turtles in the Indian River Lagoon system, Florida. Copeia. 1989:696–703. doi: 10.2307/1445497
- Zug GR, Balazs GH, Wetherall JA, Parker DM, Murakawa SKK. 2002. Age and growth of Hawaiian green seaturtles (Chelonia mydas): an analysis based on skeletochronology. Fish B-NOAA. 100:117–127.