
ABSTRACT
This study aimed to develop quantitative relationships for Maori cultural values supported by streamflow. We examined the results of a Cultural Flow Preference Study (CFPS) for five streams in Canterbury, New Zealand, and used mixed effects models to quantify how observed streamflow supported scores for Overall Health (OH). Relationships between streamflow and OH differed between sites and assessors within each site. Ignoring differences between sites and assessors, there was a positive relationship that explained 5% of the variation between streamflow and OH. After accounting for differences between sites and assessors, there was a positive relationship that explained 53% and 62% of the variation respectively. Flow attributes sustaining cultural values are based on the characteristics of the site and relationships change between rivers. Our study provides a transferable framework for developing cultural health–flow relationships that will enable Maori to be involved from the outset of any environmental flow assessment.
Introduction
New Zealand has some of the world’s highest quality and quantity of fresh water [ranked in the top ten for both its abundance and cleanliness (United Nations Citation2003)], but management of this resource is still a pressing issue. Despite having the second highest volume of renewable fresh water per capita of all the countries in the OECD, New Zealand has one of the highest water uses per capita (Gluckman Citation2017). This water shortage in some areas of New Zealand because the water is in the wrong place at the wrong time (Gluckman Citation2017). Water shortages will only increase because the demand and competition for water is increasing (Vörösmarty et al. Citation2010). Fresh water in New Zealand supports a multitude of values, but the primary extractive use of the resource is for economic gain through irrigation and hydroelectric generation (Booker Citation2016b; Gluckman Citation2017). From the perspective of Maori (the indigenous people of New Zealand) cultural values, beliefs and practices supported by fresh water can be seen to compete with these economic uses. If the interests of Maori are to be weighed alongside the many other uses, and if environmental streamflow assessments and allocative decision-making are to benefit from the knowledge of whanau (family), hapū (sub-tribe) and iwi (tribe), new techniques are needed to assess the appropriateness of streamflows in culturally sensitive ways. This need is clearly identified within the National Policy Statement for Freshwater Management (NPS-FM) because it recognises the national significance of fresh water and Te Mana o te Wai (Ministry for the Environment Citation2014), which emphasises the importance of identifying tāngata whenua (people of the land) values that collectively recognise the significance of fresh water.
Water allocation is often based on the outcomes of decision support tools that develop relationships between aspects of the flow regime and instream values, but these are often expressed as biophysical relationships. Examples of biophysical variables that have been related to streamflow in New Zealand include, wetted width (Booker Citation2010), invertebrate communities (Clapcott et al. Citation2012; Booker et al. Citation2015; Greenwood and Booker Citation2015), physical habitat for fish (Booker Citation2016a), and the probability of occurrence of various fish species (Crow et al. Citation2013). These relationships may be useful to river managers when applied within a flow-setting framework such as the In-stream Flow Incremental Methodology (IFIM; Bovee et al. Citation1998) or the ecological limits of hydrologic alteration (ELOHA; Poff et al. Citation2010). For example, in New Zealand, physical habitat models have often been applied within the IFIM framework, allowing a repeatable methodology to calibrate a suite of numerical models that then display how physical stream habitat changes with flow (discharge) (Jowett and Biggs Citation2009). The outputs of these models can then be used to assess the availability of suitable habitat for different biota (e.g. fish and invertebrates) across different flow management scenarios. Managers can then interpret these results to assess trade-offs between water allocation and sustaining in-stream values. These IFIM relationships are the primary decision support tool used to guide flow management decisions throughout the world (Tharme Citation2003) and also in New Zealand (Jowett and Biggs Citation2009). While frameworks such as IFIM and ELOHA are capable of integrating social, recreational and cultural relationships, this is yet to be completed. These biophysical methodologies do not assess how cultural values of indigenous communities will be influenced by flow allocations (Craig Citation2006), a significant short-fall given the multitude of cultural values and beliefs that are supported by fresh water (Langton Citation2006). Arthington et al. (Citation2018) contends that new research is needed to increase the understanding of the ecological and societal outcomes from environmental flow management, which requires improved empirical processes. However, Finn and Jackson, (Citation2011) acknowledge that while there has been some progress in understanding and quantifying the societal values supported by water (e.g. natural flood control, water supply, transportation), more work is required on understanding the heritage and cultural importance of water. The limited information on how cultural values change with flow, puts indigenous values at a disadvantage in affecting water policy and management (Burmil et al. Citation1999), which is a crucial knowledge gap given the multidimensional dependence of indigenous cultures on aquatic systems (King et al. Citation2008; Tipa and Associates Citation2013; Tipa and Nelson Citation2013; Jackson Citation2017).
In New Zealand, a growing body of literature documents the association of Maori with freshwater (Tipa Citation1999; Goodall Citation2003; Harmsworth et al. Citation2011; Tipa and Nelson Citation2013). To help Maori engage with resource management decisions of freshwater a Cultural Flow Preference Study (CFPS) can be used (e.g. Tipa and Severne Citation2010; Tipa and Nelson Citation2012). This allows Maori to identify their flow preferences and their cultural dependencies on specific flow conditions (Tipa and Nelson Citation2012). The CFPS responds to the suggestions of other researchers that water management needs to consider human wellbeing, indigenous communities and river cultures (Meijer Citation2007; Finn and Jackson Citation2011; Wantzen et al. Citation2016). The remaining step in the CFPS process is to develop an approach for analysing and presenting these data so that Maori can graphically identify and communicate preferences to other resource managers and communities.
In this paper, we aim to provide an overview of the CFPS methodology before using mixed-effects models to show how cultural values change with stream flow. The CFPS and associated analysis are a transferrable framework that can be utilised by other Maori to calibrate these relationships within their own rohe (tribal territory). The goal was to develop a transferrable process and not transferrable relationships because cultural values are not transferrable between whanau, iwi or between different areas within a specific rohe. This means that the numerical relationships between flows and cultural values generated in the present study do not apply to other areas outside of the study sites.
Methods
A series of hui (meetings) with Maori were necessary to discuss and secure support for completing a CFPS in South Canterbury, New Zealand. The initial case studies and hui were aided by one of the co-authors of the present manuscript belonging to the same hapu and iwi, and having an intimate knowledge of the flow management issues that the hapu was facing. Hui focussed on informing the hapu of the steps involved with the CFPS process, data collection, and importantly, how the data was to be used.
Overview of the Cultural Flow Preference Study process
The steps completed as part of a CFPS are detailed in (). A CFPS is undertaken by mandated representatives of the hapu or iwi, who have a history of interacting with the wetlands, streams and rivers within their rohe. It is this matauranga (Maori knowledge and expertise) that they bring to the assessment process. A challenge may arise, however, if the mandated individuals have been alienated from the lands and waters following European settlement in the nineteenth century. From experience to date, sites that whanau select are typically those with which they have retained association. This observation is based on the studies across 40 streams in the South Island.
Figure 1. A process for developing a Cultural Flow Preference Study and utilising this process to inform flow management decisions (adapted from Tipa and Nelson Citation2008; Tipa and Severne Citation2010). The focus of the present study is on Step 6.
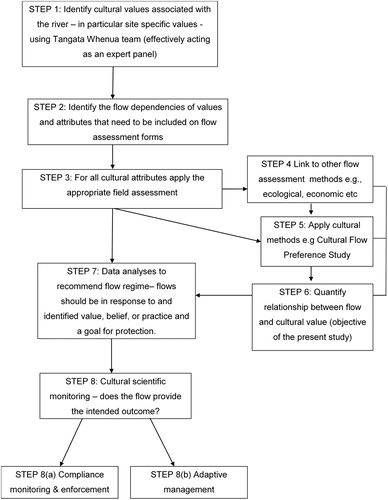
Step 1–2: Descriptions of cultural values, beliefs and practices are derived from Maori via a series of interviews and site visits with mandated representatives. During these hui and site visits, the individuals provide descriptions of river flows, and how the river is used. After the interviews the attributes of river flow are defined that, from their perspective, describe a healthy vibrant waterway supporting a range of cultural values. Qualitative data are also collected as members are encouraged to talk about their experiences at each site and how their experiences have changed over time. Spatial information on cultural values is also mapped at three levels of specificity.
Tipa and Nelson (Citation2012) distinguish three types of mapping:
Cultural mapping – This requires preparation of a base map or aerial photograph upon which sites throughout a catchment are identified together with the cultural values associated with them – in other words, the reasons for the site being of cultural significance are recorded.
Cultural opportunity mapping – Opportunities (e.g. food gathering, bathing) sought by tribal members (given the nature and extent of the values they mapped) are then recorded. Mapping opportunities also enables tangata whenua to identify management actions conducive to their continued association with aquatic sites.
Finally, mandated representatives identify water-related concerns they perceive to impact the provision of cultural opportunities at each site. These can be represented as a conceptual diagram or a concept map which are recognised as an effective tool to elicit the belief systems that are used for perceiving and analysing situations (Weick Citation1979, Citation1995; El Sawy and Pauchant Citation1988).
From these data, ‘flow attributes’ are extracted and included in an assessment form that mandated representatives use when undertaking the fieldwork component. The assessment form for the present study included 19 of these flow attributes (see for an example), but not all attributes were appropriate for all sites. For each flow attribute, there is a 7-point Likert scale and open-ended questions.
Table 1. An example of cultural themes and their attributes, and the overall health scores used in the Cultural Flow Preference Studya.
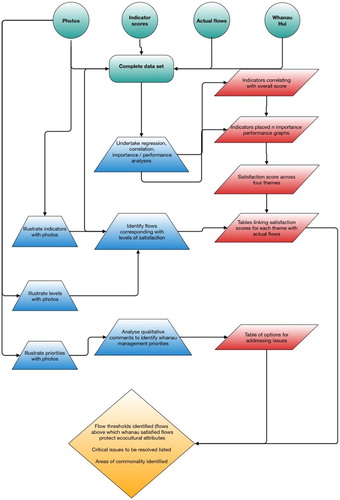
Steps 3–5: The primary component of the dataset is the information collected in the field when values are recorded across different streamflows by all the mandated individuals. Mandated representatives are asked to rate their level of satisfaction with the flow they were observing on a 1–7 scale, for all of the attributes identified in Step 1. Recording data on up to 19 attributes to record can be quite time consuming so we also categorise attributes under a series of themes or components as shown in . In addition to the cultural values identified in Steps 1–2, a range of additional data are collected and analysed ().
Figure 2. An overview of the dataset and the types of analyses completed during a Cultural Flow Preference Study (Tipa Citation2013).
Selected sites in the study catchment are assessed fortnightly over the period November – April and monthly from May to October. Sampling only occurred monthly from May-October because of logistical constraints associated with transportation and access to sites. Over the course of a year, 15–18 assessments are completed for each site. The team of assessors are unaware of the flow magnitude at the time of sampling, but this is later accessed via the relevant regional council. In addition to rating each individual attribute, mandated individuals are often asked to rate their overall level of satisfaction that the flow is sufficient to protect their cultural interests at the site they are observing. This is also rated on a 1–7 scale.
Finally, while on site, the team also completes an assessment of overall stream health using the Cultural Health Index (Tipa and Teirney Citation2003, Citation2006). As part of this assessment, they are asked to rate the overall health of the site. This score is important as we need to be assured that the flow is a factor determining the scores rather than a more general concern about the health of the site.
Canterbury Cultural Flow Preference Study
We selected five streams where the CFPS process outlined above has been applied in Canterbury, New Zealand (). The CFPS was initially developed in collaboration with Te Rununga o Arowhenua and Te Rununga o Moeraki. However, since its development it has been applied by multiple hapu and iwi.
Figure 3. Locations of the five streams selected by whanau for the present study: Selwyn River (black square), Irwell River (grey circle) Buchannan’s Creek (black triangle), Merrys Stream (grey diamond), Waikouaiti River (black circle).
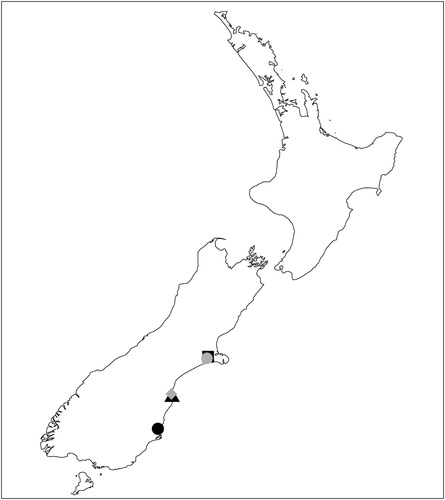
Hapu and iwi mandated 3–6 individuals for each of the five sites assessed using the flow attribute list (Steps 1:2 in the CFPS). The flow attribute scores for all sites were recorded on 15–17 different occasions between 1/11/2011 – 30/12/2012. The frequency of the visits varied depending on logistical constraints, but were completed approximately every 3–4 weeks. Each site was located near to (within 200 m) a streamflow gauging station from which a continuous record of river flow was available (), with the exception of the Irwell River. Only spot gauges were available for the Irwell River, but flow guagings were undertaken on the same days that the CFPS scores were completed. For the remaining sites, the continuous flow records were used to link CFPS scores directly to river flow by matching the dates of site visit to the continuous flow data at the appropriate gauging station. For those rivers with flow records, the 7-day mean annual low flow (MALF) and median flow were for each water year (year starting 1st October) with at least 300 recorded flow days. Where available, current minimum flows (the flow below which consented abstractions must cease) for each site were also derived from inspecting regional plans ().
Table 2. Site and gauging station details.
Quantifying relationships between cultural scores and flow
Raw data from CFPS comprising observed scores at particular flows may be used directly to inform the flow setting process (see Tipa and Nelson Citation2012). However, these paired data can also be used to quantify a statistical relationship between cultural preference score and flow by fitting a regression model. Here we report the method and results for a regression model used to quantify the relationship between streamflow and Overall Health attributes from . Overall health is derived from an assessment done at the end of the CFPS visit by each assessor, which represents overall satisfaction with the observed flow. The same analysis method could be applied to any of the CFPS attribute scores. A generalised linear mixed-effects model (glmm) was applied because this approach allows a relationship to be quantified at various levels of a nested hierarchy. The results take the form of fixed-effects and random-effects. Within a glmm fixed-effects describe the overall relationship, whereas random-effects describe variation around this overall relationship. In this case, fixed-effects described the relationship between Overall Health and standardised streamflow. Streamflow was standardised for river size by dividing by median flow and then applying a log10 transformation. Where median flow was the median of all flows from the appropriate gauging station for each site, except for the Irwell River, the median of the observed flows was used. Overall Health scores of one to seven were transformed to range between zero and one. A glmm with a binomial distribution was applied as is appropriate for modelling proportion data. This approach has the advantage of constraining calculated transformed values to be between zero and one. Calculated overall health scores were then back-transformed to range from one to seven. Nested random-effects were specified such that the relationship between overall health and flow were allowed to vary between sites but also between assessors within sites. The method was therefore able to quantify the Overall Health-streamflow relationship whilst taking account of differences between sites and differences between assessors within sites. Nested rather than crossed random-effects were applied to treat each set of assessors within a site as independent from the assessors at other sites. Overall Health-flow relationships were therefore calculated for three nested levels of a hierarchy: a) the Overall Health-flow relationship (defined by the fixed-effects); b) the Overall Health-flow relationship for each site (defined by the first level of random effects); and c) the Overall Health-flow relationship for each assessor within each site. Model performance was assessed for each of these three sets of calculated Overall Health values. Following the method of Piñeiro et al. (Citation2008), scatterplots were used to display the relationship between observed versus predicted values. We then fitted a linear regression to the observed versus predicted values for each site (all data pooled together) and examined the percent of variation correctly explained by the linear regression.
Results
Assessments for Overall Health were observed at flows ranging from just above the MALF to above the median flow (). The observed flows therefore represented a broad range of low to median flow conditions.
Figure 4. Recorded flows on the day of each visit for each site, compared to the 7-day mean annual low flow (MALF) and median flow.

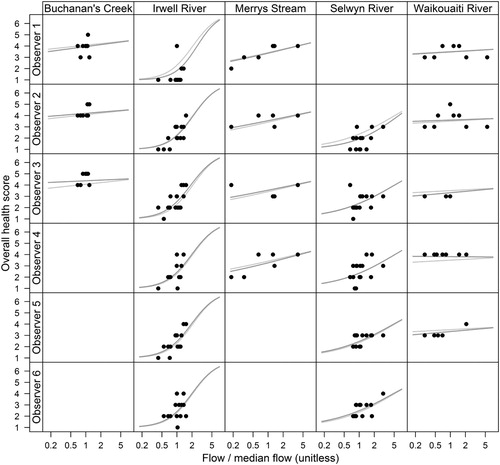
Visual inspection of recorded Overall Health scores suggested that relationships between flow and Overall Health differed between sites and between assessors within each site (). The sensitivity of Overall Health to flow changes differed mostly between sites and to a lesser degree between assessors. Generally, most of the individual assessor relationships were very similar within each of the sites, with the largest difference being observed for Assessor 1 in the Irwell River. At the site level, Buchannan’s Creek and the Waikouaiti River showed the smallest change in Overall Health with flow, while the remaining three sites showed larger changes in Overall Health with flow. The Irwell River showed the largest changes in Overall Health with flow, suggesting that alterations to flow regimes could have a large influence on the Overall Health of this site.
Figure 5. Observed and fitted relationships between overall health score and river flow. Dots represent observed values. Light grey lines represent calculated values at the site level. Dark grey lines represent calculated values at the assessor level within site level.
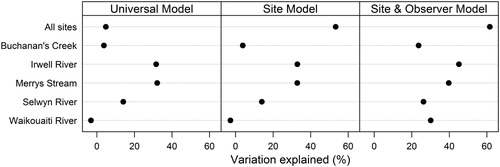
The fixed-effects of the fitted glmm did not account for differences between sites and assessors. At this highest level, there was a positive relationship that explained only 5% of the variation between streamflow and Overall Health when all data were pooled together ( and ). If differences between sites were accounted for in the analysis, there was a positive relationship that explained 53% of the variation between streamflow and Overall Health in the pooled dataset (). When differences between sites and assessors were both accounted for in the analysis, there was a positive relationship that explained 62% of the variation between streamflow and Overall Health.
Figure 6. Performance of mixed-effects models for the relationship between overall health and flow at different levels of resolution. Although scores ranged from 1 to 7, we show only observed vs. predicted relationships between 1 and 5 because this is the range of observations that were recorded. Thick dashed grey line represents linear regression. Thin dashed grey line represents the 90% confidence prediction interval. Data have been jittered to avoid overplotting of symbols.
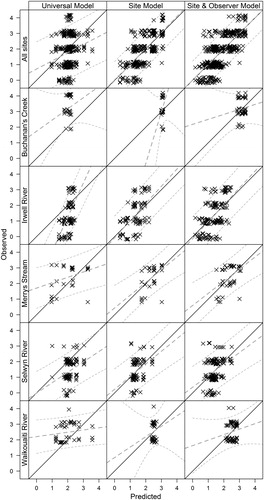
Figure 7. Percent variation explained for models for the relationship between overall health and flow at three nested levels of the mixed-effects model for each site separately and all data pooled together.
Discussion
How well did the analysis reflect relationships between cultural values and flow?
The present study outlines a process for developing cultural scores (CFPS) associated with river sites, and then developing numerical relationships between these scores and different streamflow magnitudes. A generalised mixed-effects model was used to describe the relationship between Overall Health scores and streamflow at three different levels. The highest level (fixed-effects) represented a relationship between all Overall Health and streamflow and ignored site and observer differences, but this explained very little variation in observed Overall Health scores. Much more variation in observed Overall Health scores was explained when differences between sites were accounted for. This increase in explanatory power suggests that there are significant differences in Overall Health scores between sites and that the relationship between Overall Health scores and streamflow differ between sites. A relatively minor increase in explanatory power eventuated when differences between assessors within sites was accounted for. This suggests that variation in Overall Health score was primarily driven by differences between sites and changes in streamflow within each site, rather than differences between assessors. This pattern was particularly true for the Irwell River, Merrys Stream and Selwyn River sites, and less so for the Waikouaiti River and Buchanan’s Creek sites.
The fact that the universal relationship between Overall Health and streamflow did not explain a large amount of variation in observed scores, reinforces the concept that cultural health and its relationship with streamflow are unique to individual locations and cannot be generalised across entire regions. The unique relationships seen at each location are likely to be generated because there are different cultural values supported by each site, and these values will differ between hapu and iwi. While cultural value-flow relationships will change between hapu and iwi or catchments and are therefore not transferrable, the process for developing a CFPS and the analysis we have presented is transferrable. The process can be implemented for a range of different flow management situations in a similar process to calibrating a physical habitat model for a particular stream/river.
How could the analysis in the present study be improved?
The present analysis treated each regression developed at the assessor level equally, but it would be possible to weight each of the assessor level regressions. For example, if one of the assessor(s) was less familiar with one of the sites compared to other assessor(s), then the less experienced assessor could receive a lower weighting compared to the more experienced assessor(s). An advantage of this approach is that rangatahi (children) are afforded the opportunity to engage in the process without the risk of their assessments impacting on the results of the final assessment. Weighting ensures that the predictions for the site would be primarily based on the assessors with the most experience or customary knowledge of the site. The weighting would need to be agreed by the hapu and iwi who are mandating the study.
Integrating cultural-flow relationships into holistic flow management decisions
The outputs of this analysis will not only help Maori visualise the impacts of flow allocation on their values, but also help communicate the cultural impacts of streamflow allocation to other water resource managers. The present study examined only the relationship between a single cultural value (Overall Health) and streamflow, but there were other (14–16 values) cultural values recorded at each site that should also be considered during flow management assessments. We simply selected a single cultural flows value to illustrate our analysis approach, but this could also be applied to attribute scores for other values recorded during the CFPS.
It is important to note that the CFPS (Tipa and Nelson Citation2012) is a critical pre-cursory step and that the present analysis cannot proceed without it. Ensuring the values are appropriately identified and clarified by hapu and iwi throughout the CFPS process is integral to developing meaningful relationships for Maori to use. The multiple cultural values present at a site may have different responses to flow than those reported in the present study. Further work is required to develop the best decision support tool to help with this process, such as Bayesian Belief networks (Stewart-Koster et al. Citation2010) or fuzzy cognitive models (Gray et al. Citation2014, Citation2015).
The present study presents a method that can be used to develop relationships between aspects of the flow regime and cultural values, which could be a complementary analysis used alongside other biophysically focussed decision support tools (e.g. IFIM). The present analysis is transferrable and can be calibrated by other Maori to examine and communicate the influence of low regime changes on their cultural values. Flow allocation will impact on a variety of values (Tharme Citation2003), and the present study illustrates one approach that can help resource managers preserve cultural values. While this information is of value to Maori, the intent of the analysis is not to identify the flows that will maximise their level of satisfaction. Rather, the results will help highlight the range of flows Maori will be satisfied with. Philosophically, this means that the flows may be lower than the flows that they aspire to see in the river. Drawing this distinction to the attention of whanau is another important aspect of the study.
The present study took one year to complete, but we are currently investigating if this timeframe could be condensed. The key aspect is to score the flow attributes across a variety of streamflow magnitudes. If a range of flows naturally occurred at a site within a few weeks or months then enough data could be collected much quicker than in the present study if the mandated individuals are available. The present study recorded attribute scores for cultural values across streamflow ranging from MALF to slightly above median flow, which was a good range for recording these data. We recommended that these ranges of flows should also be recorded at other sites if possible.
While the present study focused on the development of the Overall Health-flow relationship, other data collected during the CFPS process can be used to assist Maori with flow management decisions. Descriptions of cultural values, beliefs and practices collected during Steps 1 and 2 of (i.e. hui and site visits) of a CFPS study can help describe the enduring relationship of Maori with the waters of their takiwa (tribal territory). These descriptions can be developed based on historical knowledge retained across generations, enabling values and beliefs to be communicated despite recent (i.e. last 100 years) land loss and degradation of waters. This allows both current practices supported by the site to be documented (e.g. fishing, gathering resources, camping, swimming) along with historical uses of the waterway. Importantly, aspirations for future use of the sites are also recorded such as restoring gathering sites and bathing sites (Tipa and Nelson Citation2013). These cultural uses for the site can then be communicated to other resource managers to highlight the importance of the waterway to tangata whenua. Similarly, the data collected during the CFPS can also help Maori understand how any flow preferences they identify relates to the aspirations of other resource managers and hydrological parameters. For example, data from the CFPS can be presented that compares cultural flow preferences with other hydrological parameters, such as 7 day mean annual low flow (MALF), or ecological flows based on the methods set out in the National Standard for Ecological Flows (BECA Citation2008). The data gathered during the early stages of the CFPS and the outcomes of the present study are aligned with a wider international movement to highlight the values that indigenous communities ascribe to freshwater (Jackson et al. Citation2009; Barber and Jackson Citation2012; Nania and Guarino Citation2014; Cochran et al. Citation2016).
Conclusions
We found positive relationship between cultural health scores and flow after differences between sites and assessors were accounted for using mixed-effects models. Our results suggest that relationships between cultural values and river flows are based on the characteristics of the site, and that Overall Health-flow relationships change between sites. Differences between assessors were relatively low compared to differences between sites. The present study provides a method for recording and analysing relationships between cultural values and streamflow at different sites, which can help Maori and other flow managers set flow regimes. Results suggest that these relationships could help Maori be involved from the outset of any environmental flow assessment. Finally, increasingly collaborative processes are being encouraged in New Zealand’s resource management, for example the Environment Canterbury zone committee model. The analysis described in this paper is a practical illustration of how biophysical and statistical expertise, and matauranga Maori can complement and enrich each other, and hopefully enhance freshwater management.
Acknowledgements
The present study could not have been completed without the involvement of Te Rununga o Moeraki, Te Rununga o Arowhenua and Te Runanga o Taumutu whose members helped during the design of the CFPS. Those who participated in the studies reported in this paper included representatives of Kati Huirapa ki Pukerteraki (Waikouaiti), Te Runanga o Waihao (Buchanan, Merry) and representatives of the papatipu runanga of Horomaka (Banks Peninsula) for the Waihora study (Irwell, Selwyn). We thank two anonymous referees for their useful feedback on an earlier version of the present manuscript.
Disclosure statement
No potential conflict of interest was reported by the authors.
Additional information
Funding
References
- Arthington AH, Kennen JG, Stein ED, Webb JA. 2018. Recent advances in environmental flows science and water management—innovation in the Anthropocene. Freshwater Biology. 1–13. https://doi.org/10.1111/fwb.13108.
- Barber M, Jackson S. 2012. Indigenous water management in the upper Roper River, Northern Territory: history and implications for contemporary water planning. Darwin: CSIRO; 110 p.
- BECA. 2008. Draft guidelines for the selection of methods to determine ecological flows and water levels. Report prepared by BECA Infrastructure Ltd for Ministry for the Environment. 159 p.
- Booker DJ. 2010. Predicting wetted width in any river at any discharge. Earth Surface Processes and Landforms. 35:828–841.
- Booker DJ. 2016a. Generalized models of riverine fish hydraulic habitat. Journal of Ecohydraulics. 1:31–49. doi: 10.1080/24705357.2016.1229141
- Booker DJ. 2016b. National water allocation statistics for environmental reporting. National Institute of Water & Atmospheric Research client report 2017065CH, 21 p.
- Booker DJ, Snelder TH, Greenwood MJ, Crow SK. 2015. Relationships between invertebrate communities and both hydrological regime and other environmental factors across New Zealand’s rivers. Ecohydrology. 8:13–32. doi: 10.1002/eco.1481
- Bovee KD, Lamb BL, Bartholow JM, Stalnaker CB, Taylor J, Henriksen J. 1998. Stream habitat analysis using the instream flow incremental methodology. US Geological Survey, Biological Resources Division, Information and Technology Report USGS/BRD-1998-0004. 139 p.
- Burmil S, Daniel T, Hetherington J. 1999. Human values and perceptions of water in arid landscapes. Landscape and Urban Planning. 44:99–109. doi: 10.1016/S0169-2046(99)00007-9
- Clapcott JE, Collier KJ, Death RG, Goodwin EO, Harding JS, Kelly D, Leathwick JR, Young RG. 2012. Quantifying relationships between land-use gradients and structural and functional indicators of stream ecological integrity. Freshwater Biology. 57:74–90. doi: 10.1111/j.1365-2427.2011.02696.x
- Cochran F, Brunsell N, Cabalzar A, van der Veld P, Azevedo E, Azevedo F, Pedrosa R, Winegar L. 2016. Indigenous ecological calendars define scales for climate change and sustainability assessments. Sustainability Science. 11:69–89. http://doi.org/10.1007/s11625-015-0303-y.
- Craig D. 2006. Indigenous property rights to water: environmental flows, cultural values and tradeable property rights. In: Smajgl A, Larson S, editors. Adapting rules for sustainable resource use. Townsville: CSIRO Sustainable Ecosystems; p. 153–172.
- Crow SK, Booker DJ, Snelder TH. 2013. Contrasting influence of flow regime on freshwater fishes displaying diadromous and nondiadromous life histories. Ecology of Freshwater Fish. 22:82–94. doi: 10.1111/eff.12004
- El Sawy O, Pauchant T. 1988. Triggers, templates, and twitches in the tracking of emerging strategic issues. Strategic Management Journal. 9:455–473. doi: 10.1002/smj.4250090506
- Finn M, Jackson S. 2011. Protecting indigenous values in water management: a challenge to conventional environmental flow assessments. Ecosystems. 14:1232–1248. http://doi.org/10.1007/s10021-011-9476-0.
- Gluckman PD. 2017. New Zealands fresh waters: values, state, trends and human impacts. Office of the Prime Minister’s Chief Science Advisor, 120 p. http://www.pmcsa.org.nz/wp-content/uploads/PMCSA-Freshwater-Report.pdf.
- Goodall A. 2003. Ashburton/Hakatere river, lakes and tributaries – Tangata Whenua values. Report prepared for Environment Canterbury. September 2001. 31p.
- Gray SA, Gray S, De Kok JL, Helfgott AER, O’Dwyer B, Jordan R, Nyaki A. 2015. Using fuzzy cognitive mapping as a participatory approach to analyze change, preferred states, and perceived resilience of social-ecological systems. Ecology and Society. 20:11. http://doi.org/10.5751/ES-07396-200211.
- Gray SA, Zanre E, Gray SRJ. 2014. Fuzzy cognitive maps as representations of mental models and group beliefs. In Papageorgiou E editor. Fuzzy cognitive maps for applied sciences and engineering. Intelligent Systems Reference Library, vol. 54. Berlin: Springer. http://doi.org/10.1007/978-3-642-39739-4_2.
- Greenwood MJ, Booker DJ. 2015. The influence of antecedent floods on aquatic invertebrate diversity, abundance and community composition. Ecohydrology. 8:188–203. doi: 10.1002/eco.1499
- Harmsworth GR, Young RG, Walker D, Clapcott JE, James T. 2011. Linkages between cultural and scientific indicators of river and stream health. New Zealand Journal of Marine and Freshwater Research. 45:423–436. doi: 10.1080/00288330.2011.570767
- Jackson S. 2017. How much water does a culture need? Environmental water management’s cultural challenge and indigenous responses. In: Horne A, Webb A, Stewardson M, Richter B, Acreman M, editors. Water for the environment. Cambridge (MA): Elsevier; p. 173–188.
- Jackson S, Finn M, Featherston P. 2009. Aquatic resource use by indigenous Australians in two tropical river catchments: the Fitzroy River and Daly River. Human Ecology. 37:893–908. http://doi.org/10.1007/s10745-012-9518.
- Jowett IG, Biggs BJF. 2009. Application of the ‘natural flow paradigm’ in a New Zealand context. River Research and Applications. 25:1126–1135. doi: 10.1002/rra.1208
- King JM, Tharme RE, de Villiers MS. 2008. Development of the Building Block Methodology for instream flow assessments, and supporting research on the effects of different magnitude flows on riverine ecosystems. Water Research Commission Report No. 576/1/98. 452 p.
- Langton M. 2006. Earth, wind, fire and water: the social and spiritual construction of water in Aboriginal societies. In: David B, Barker B, McNiven I, editors. The social archaeology of Australian indigenous landscapes. Canberra: Aboriginal Studies Press; p. 139–160.
- Meijer KS. 2007. Human Well-being values of environmental flows enhancing social equity in integrated water resources management. Delft Hydraulics Select Series (Book 10), 208 p.
- Ministry for the Environment. 2014. National policy statement for freshwater management 2014, 34 p.
- Nania J, Guarino J. 2014. Restoring sacred waters, a guide to protecting tribal non-consumptive water uses in the Colorado River basin. Center for Natural Resources, Energy, and the Boulder (CO): Environment IOS Press. 114 p.
- Piñeiro G, Perelman S, Guerschman J, Paruelo J. 2008. How to evaluate models: observed vs. predicted or predicted vs. observed? Ecological Modelling. 216:316–322. doi: 10.1016/j.ecolmodel.2008.05.006
- Poff NL, Richter BD, Arthington AH, Bunn SE, Naiman RJ, Kendy E, Acreman M, Apse C, Bledsoe BP, Freeman Mc., Henriksen J, et al. 2010. The ecological limits of hydrologic alteration (ELOHA): a new framework for developing regional environmental flow standards. Freshwater Biology. 55:147–170. doi: 10.1111/j.1365-2427.2009.02204.x
- Stewart-Koster B, Bunn SE, Mackay SJ, Poff NL, Naiman RJ, Lake PS. 2010. The use of Bayesian networks to guide investments in flow and catchment restoration for impaired river ecosystems. Freshwater Biology. 55:243–260. doi: 10.1111/j.1365-2427.2009.02219.x
- Tharme RE. 2003. A global perspective on environmental flow assessment: emerging trends in the development and application of environmental flow methodologies for rivers. River Research and Applications. 16:1–45.
- Tipa G. 1999. Taieri River case study, Ministry for the Environment Technical Paper No 58, Environmental performance indicators: Māori Indicators Case Study.
- Tipa and Associates. 2013. Cultural values, flow and water management issues for the Waikirikiri/Selwyn-Te Waihora catchments. Data collected by the Taumutu/Tuahuriri COMAR Team and Horomaka COMAR Team. Report prepared by Tipa and Associates for Environment Canterbury Regional Council, Christchurch, New Zealand. 134 p. [online]. http://files.ecan.govt.nz/public/lwrp/variation1/cultural-values-flow-water-managementissues-waikirikiri-selwyn-te-waihora-catchments.pdf.
- Tipa G, Nelson K. 2008. Introducing cultural opportunities: a framework for incorporating cultural perspectives in contemporary resource management. Journal of Environmental Policy & Planning. 10:313–337. doi: 10.1080/15239080802529472
- Tipa G, Nelson K. 2012. Identifying cultural flow preferences: The Kakaunui River case study where Manawhenua identified their flow preferences. Journal of Water Resources Planning and Management. 138:660–670. doi: 10.1061/(ASCE)WR.1943-5452.0000211
- Tipa G, Nelson K. 2013. Bringing the past into our future—using historic data to inform contemporary freshwater management. Kotuitui: New Zealand Journal of Social Sciences. 8:40–63. http://doi.org/10.1080/1177083x.2013.837080.
- Tipa G, Severne C. 2010. Including Mātauranga Māori in environmental flow setting decisions National Institute of Water and Atmospheric Research Client Report: HAM2010-030, 26 p.
- Tipa G, Teirney L. 2003. A cultural health index for steams and waterways: indicators for recognising and expressing cultural values. Ministry for Environment Technical Paper 75. ME number 475, 58 p.
- Tipa G, Teirney L. 2006. Using the cultural health index: how the assess the health of streams and waterways. Ministry for Environment Reference ME711, 62 p.
- United Nations. 2003. 1st United Nations World Water Development Report, 36 p.
- Vörösmarty CJ, McIntyre PB, Gessner MO, Dudgeon D, Prusevich A, Green P, Glidden S, Bunn SE, Sullivan CA, Reidy Liermann C, et al. 2010. Global threats to human water security and river biodiversity. Nature. 467:555–561. doi: 10.1038/nature09440
- Wantzen KM, Ballouche A, Longuet I, Bao I, Bocoum H, Cisse L, Chauhan M, Girard P, Gopal B, Kane A, et al. 2016. River culture: an eco-social approach to mitigate the biological and cultural diversity crisis in riverscapes. Ecohydrology & Hydrobiology. 16:7–18. doi: 10.1016/j.ecohyd.2015.12.003
- Weick K. 1979. Cognitive processes in organizations. Research in Organizational Behaviour. 1:41–74.
- Weick K. 1995. Sensemaking in organizations. Thousand Oaks (CA): Sage; 321 p.