
 ?Mathematical formulae have been encoded as MathML and are displayed in this HTML version using MathJax in order to improve their display. Uncheck the box to turn MathJax off. This feature requires Javascript. Click on a formula to zoom.
ABSTRACT
Knowledge of trophic status is fundamental to understanding the condition and function of lake ecosystems. We developed regression models to predict chlorophyll a concentrations (chl a) in New Zealand lakes for reference and current states, based on an existing dataset of total nitrogen (TN) and total phosphorus (TP) concentrations for 1031 lakes. Models were then developed to predict Secchi depth based on chl a and a sediment resuspension term applicable to shallow lakes. Estimates of all four Trophic Level Index (TLI) variables (chl a, TN, TP and Secchi depth) were analysed to estimate reference and current state TLI for the nationally representative sample of 1031 lakes. There was a trend of eutrophication between reference and current states, with systematic differences among lake geomorphic types. Mean chl a increased 3.5-fold (2.42 mg m−3 vs. 8.32 mg m−3) and mean Secchi depth decreased (indicating lower clarity) by approximately one-third (9.62 m vs. 6.48 m) between reference and current states. On average, TLI increased by 0.67, with the TLI increase >1 in approximately one-third (31%) of lakes. This study informs the status of lake ecosystems in NZ and provides benchmarks to guide management and assessment.
Introduction
Knowledge of trophic status is fundamental to understanding the condition and function of lake ecosystems. Lake trophic status can be considered a ‘master variable’ that corresponds to important lake attributes such as the prevalence of harmful cyanobacteria blooms, depletion rate of deep-water oxygen, biomass of aquatic vascular plants, invertebrate and vertebrate species composition, and perceived aesthetic values (Smith Citation2009; Angradi et al. Citation2018). In New Zealand (NZ), multiple lake characteristics have been shown to correlate with lake trophic status, including denitrification potential (Bruesewitz et al. Citation2011), bottom-sediment accumulation rate (Trolle et al. Citation2008; Santoso et al. Citation2017), CO2 efflux (Santoso et al. Citation2017), prokaryotic picoplankton density (Burns and Stockner Citation1991), crustacean zooplankton density (Chapman et al. Citation1985), rotifer assemblage composition (Duggan et al. Citation2001), food chain length (Kelly and Schallenberg Citation2019), the mass and quality of consumer trophic resources (Collier et al. Citation2018), and the distribution of kōura (Paranephrops planifrons) (Kusabs et al. Citation2015).
In NZ, lake trophic status is commonly measured using the Trophic Level Index (TLI), which comprises a value of 0 to ∼7 that relates to seven classes ranging from ultra-microtrophic to hypertrophic (Burns et al. Citation1999). The TLI is calculated using annual average measurements of chlorophyll a concentration (chl a), Secchi depth (Secchi), and concentrations of total nitrogen (TN) and total phosphorus (TP). The TLI is analogous to the Trophic State Index (TSI; Carlson Citation1977) applied in the USA although, unlike the TSI, the TLI includes nitrogen concentrations in the calculation. This inclusion reflects that nitrogen, in addition to phosphorus, frequently limits phytoplankton biomass accumulation in NZ lakes, with nitrogen limitation seemingly more prevalent in NZ than in the northern hemisphere (White Citation1983; Abell et al. Citation2010). The TLI is routinely measured by NZ regional councils, with measurements also used to characterise state and trends of lake water quality at a national scale (Gluckman Citation2017; Ministry for the Environment & Stats NZ Citation2019). National legislation requires objectives to be set for three of the four constituent TLI variables in lakes (New Zealand Government Citation2017), and some regional agencies have enacted statutory rules that require establishment of TLI targets for important lakes, with changes to catchment management required if targets are not met (BOPRC Citation2008).
The four constituent TLI variables are highly inter-correlated, although the relationships between variables varies among lakes depending on lake characteristics (Burns et al. Citation1999). Chl a is strongly controlled by nutrient concentrations in temperate lakes and is commonly predicted based on TN and/or TP concentrations, although the strength and form of the relationship varies depending on factors that include nutrient limitation status and top-down controls such as zooplankton grazing (Abell et al. Citation2012). Secchi is inversely correlated with chl a, although the relationship between these variables is affected by the presence of other light attenuating substances (Davies-Colley and Smith Citation2001). In particular, Secchi is often lower in shallow lakes due to reduced clarity caused by wind driven resuspension of fine sediments (Hamilton and Mitchell Citation1997).
Many lakes in NZ have been affected by anthropogenic (cultural) eutrophication, with nutrient and sediment pollution from pastoral agriculture identified as a major causal factor (Gluckman Citation2017). Quantifying and managing human influences on lake trophic status requires knowledge of natural variability in trophic status among lakes, thereby allowing the magnitude of anthropogenic eutrophication to be quantified and providing context for setting management objectives and targets. Lake trophic status varies naturally due to a range of catchment and within-lake factors. At the catchment scale, geology can affect lake trophic status (Dillon and Kirchner Citation1975). In NZ, there is a geological influence associated with elevated contributions of phosphorus from areas with volcanic geology such as the Taupō volcanic zone (Timperley Citation1983), whereas streams that drain areas with alluvium or sedimentary geology have naturally lower phosphorus concentrations (McDowell et al. Citation2013).
Catchment climate and hydrology are also important factors that influence lake trophic status by regulating the erosion and transport of nutrients and light attenuating substances (Lohse et al. Citation2009). At the lake scale, basin morphometry affects lake trophic status, and morphometric variables can be inter-correlated (Håkanson Citation2005). Hydraulic residence time (τw; influenced by morphometry and hydrology) affects particle settling and flushing losses of plankton, with τw inversely correlated with lake trophic status (Vollenweider Citation1971). Shallower lakes tend to have lower τw (Håkanson Citation2005) and are naturally susceptible to sediment resuspension by wind waves, which can increase trophic status by mobilising nutrients and light attenuating sediments (Hamilton and Mitchell Citation1997). Lake fetch (correlated with area) affects the mixing depth (Davies-Colley Citation1988; Hanna Citation1990) and the potential for wind driven resuspension of sediments (Hamilton and Mitchell Citation1997); thus, sediment resuspension is typicaly greatest in large shallow lakes, especially those that are elongated with the longest axis aligned parallel to the dominant wind direction.
Reference states relating to pristine conditions in the absence of human disturbance provide benchmarks against which to assess environmental impacts and inform management (Hawkins et al. Citation2010). Due to the influences of catchment and within-lake factors, reference conditions for lake trophic status variables should ideally be developed for lakes on an individual basis, although reference conditions for similar lakes can be grouped to develop ranges of values for lake categories (e.g. Carvalho et al. Citation2008; Poikāne et al. Citation2010). Recently, Abell et al. (Citation2019) used a modelling approach to estimate annual mean TN and TP concentrations for the surface waters of ∼1030 NZ lakes, with concentrations estimated separately for reference and current states. Their approach built on work by McDowell et al. (Citation2013), who derived median reference concentrations for nutrients in categories of NZ streams and rivers that accounted for climate, topography and geology. This previous work provided an opportunity to extend existing research to predict other trophic status variables in a nationally representative sample of lakes across NZ.
The objective of this study was to use the TN and TP concentrations estimated by Abell et al. (Citation2019), alongside other variables, to predict reference and current values of chl a and Secchi, which could then be used to estimate reference and current TLI values for a sample of >1000 NZ lakes. We hypothesised that predicting reference and current lake trophic status for individual lake types could provide benchmarks to guide lake management and enhance understanding of the magnitude of anthropogenic changes to lake water quality in NZ.
Methods
Overview of analysis sequence and model fitting
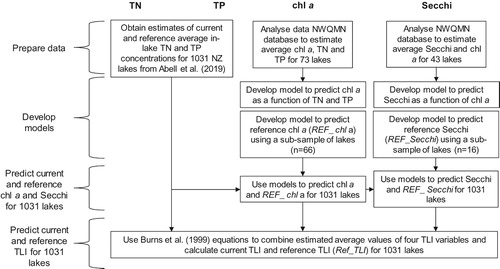
Analysis steps are summarised in and described further in the sections below. All analyses and data manipulation were conducted using R (R Core Team Citation2017). Linear models (lm function) were fitted to predict chl a and Secchi, with the following metrics used to compare performance when trialling models: standard error of the estimate, sum of squared errors (SSE), R2, Akaike’s Information Criterion (AIC; Burnham and Anderson Citation2002) and the root-mean-square error (RMSE) of a 10-fold cross validation. Overall, AIC (a measure of model fit) and RMSE (a measure of model error) were the primary performance metrics used to select optimum models. Bias was examined by visually inspecting observed and predicted values plotted alongside a 1:1 line.
Figure 1. Summary of analysis steps to predict current and reference Trophic Level Index (TLI) values for 1031 lakes in New Zealand. Acronyms are defined in the text.
A detailed residual analysis was undertaken to check that model assumptions were met and to confirm the necessity of transformations (required for most variables). Residual analysis involved reviewing a range of diagnostic plots (e.g. Q-Q plots) to examine whether residuals were normally distributed, and violin plots to compare residuals among depth and geomorphic classes (hypothesised covariates). Residual plots and detailed results of model evaluation are provided in Supplementary Information.
National Water Quality Monitoring Network dataset
Lake water quality data () were obtained from the National Water Quality Monitoring Network (NWQMN) database compiled by NZ regional government agencies. Data were provided via the Land, Air, Water Aotearoa partnership, with additional information about lake geomorphic type and morphometric variables, including maximum depth (zmax) and fetch, obtained from the Freshwater Ecosystems of New Zealand (FENZ) database (Leathwick et al. Citation2010). Measurements from the NWQMN were collected from the surface or within the epilimnion in stratified lakes, with sampling typically undertaken monthly (Burns et al. Citation2000; Davies-Colley et al. Citation2012). The NWQMN database (1976–2014) was first screened, primarily to remove measurements collected prior to 2000 and to identify lakes with ≥10 measurements of TN, TP and chlorophyll a (see Abell et al. (Citation2019) for details of additional screening criteria). This sample was used to develop models to predict chl a (n = 73; ), and then screened further to identify lakes with ≥10 measurements of Secchi (not available for 30 of the lakes) to create a sample to develop models to predict Secchi (n = 43; ).
Table 1. Summary of NWQMN lake water quality data used to develop models to predict annual mean chlorophyll a (chl a) concentrations and annual mean Secchi depth (Secchi).
Reference and current nutrient concentrations
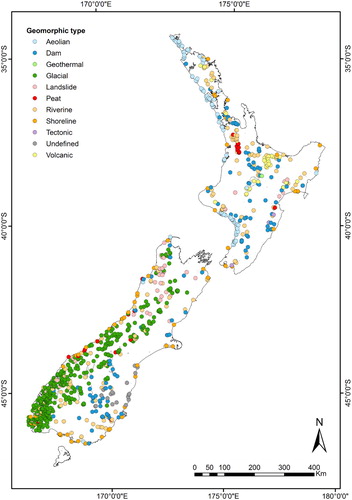
We used the existing dataset of modelled TN and TP concentrations in NZ lake surface waters developed during a previous study by Abell et al. (Citation2019), which we briefly summarise in this section. The authors used nutrient mass loading models (‘box models’) to estimate annual average lake nutrient concentrations that corresponded to reference (REF_TNlake and REF_TPlake) and current states (TNlake and TPlake). Estimates of both sets of TN and TP concentrations were derived for a sample of 1031 lakes included in the Waters of National Importance (WONI) database (), which comprises spatial, land use and physical data for all 3820 mapped lakes in NZ with area >1 ha (Snelder Citation2006; Leathwick et al. Citation2010).
Figure 2. Locations and geomorphic type of the 1031 lakes for which current and reference Trophic Level Index values were estimated in this study. Adapted from Abell et al. (Citation2019).
Models were developed using a training dataset comprising measurements for lakes included in the NWQMN database. Following a model screening process, models were selected to predict TN and TP concentrations based on lake inflow concentrations and morphometric variables (τw for TP and maximum depth (zmax) for TN). To predict current concentrations, lake inflow concentrations were estimated using the Catchment Land Use for Environmental Sustainability (CLUES) model (Elliott et al. Citation2016). To predict reference concentrations, lake inflow concentrations were derived from the stream reference concentrations estimated by McDowell et al. (Citation2013) and streamflow modelled with CLUES.
Chlorophyll a concentrations
Current chlorophyll a concentrations
A model to predict chl a was fitted using data in the NWQMN dataset (). Chl a was strongly correlated with TN (Spearman’s r = 0.91) and TP (Spearman’s r = 0.90). Based on these relationships, the following combinations of predictor variables were trialled: (1) TN; (2) TP; (3) TN + TP, and; (4) TN + TP + TN·TP, with the latter model including an interaction term between TN and TP. It was necessary to log10-transform all variables to meet linear model assumptions. Based on performance, the best chl a model included the terms TN and TP (the third model listed above), with RMSE of 0.21 mg m−3 (in transformed units) and r2 of 0.89 (). Model performance (AIC) could not be improved by adding depth (zmax) or geomorphic type and a residual analysis confirmed that the residuals were not correlated with these hypothesised covariates.
Table 2. Summary of models used to predict current and reference state values of chlorophyll a and Secchi depth in 1031 New Zealand lakes.
Confidence intervals were calculated for the chl a model estimates with a parametric bootstrap (n = 1000) that accounted for the propagation of errors in multiple models (note that, for unmonitored lakes, chl a was modelled based on nutrient concentrations that were in turn modelled based on other variables). On each iteration i of the bootstrap, new values of chl a () were drawn randomly from a normal distribution with mean equal to chl a estimated with the fitted model and standard deviation equal to the standard error of the estimate of the fitted model. We then refit the original model to
, adding model uncertainty to the coefficient estimates (
). Finally, we predicted chl a* values for each iteration of the bootstrap as:
(1)
(1) where
and
are the bootstrapped predicted TNlake and TPlake values for iteration i from the previous bootstrap exercise. Specifically, values of
and
were recalculated to account for estimated error in the lake inflow nutrient concentrations used by Abell et al. (Citation2019) by recalculating TNlake and TPlake using lake inflow nutrient concentrations that were adjusted by adding a random error term based on the standard error of lake inflow nutrient concentrations (see Abell et al. Citation2019). Each iteration of the bootstrap therefore accounted for uncertainty in the model (e.g. structural error) through the refitting of the model coefficients, as well as the uncertainty in the predicted lake inflow nutrient concentration (errors in variables) that were used to predict
and
during the previous step. The ranges of the 95% confidence intervals were then defined based on the 2.5% and 97.5% quantiles of the 1000 bootstrapped iterations.
Reference chlorophyll a concentrations
A model to predict annual mean reference chl a concentrations (Ref_chl a) was fitted using the same approach as described above except a smaller (n = 66 vs. 73) NWQMN dataset was used. This smaller sample was created by omitting lakes with estimates of TNlake and TPlake that were higher than the upper bounds of the 95% confidence intervals of Ref_TNlake and Ref_TPlake estimates for the sample of 1031 lakes; i.e. it was considered logical to omit lakes with current nutrient concentrations greater than those expected in NZ lakes under a reference state when predicting Ref_chl a. Model performance and parameter coefficients for this model were highly similar to the model used to predict current chl a concentrations (). Confidence intervals were calculated for Ref_chl a estimates with a parametric bootstrap, as described above for chl a.
Secchi depth
Current Secchi depth
Models were trialled to estimate mean Secchi (m). Chl a was included as a predictor variable in candidate models as there is generally a strong correlation between Secchi and chl a in temperate lakes (Vant and Davies-Colley Citation1984; Abell et al. Citation2012). Concentrations of non-algal suspended sediment and coloured dissolved organic matter influence Secchi (Vant and Davies-Colley Citation1984; Swift et al. Citation2006). Resuspension of non-algal sediment is expected to increase in significance with declining depth in shallow lakes. For deep lakes, where the depth of most of the bed exceeds a threshold related to potential wave height, wind-driven resuspension is expected to be negligible, although we recognise that high levels of light-attenuating fine sediment (inorganic glacial flour) occur in several glacial lakes (Rose et al. Citation2014), which may be an exception to this. The influence of non-algal suspended sediment on Secchi in shallow lakes is generally expected to be greater in lakes under current conditions than under a reference state because many shallow lakes in NZ have undergone a unidirectional regime shift involving increases in turbidity (Schallenberg and Sorell Citation2009).
Examination of the relationship between Secchi and chl a showed no evidence of a systematic difference in the relationship among lake geomorphic types, but there was a systematic difference between shallow and deep lakes; in general, the Secchi value at a given chl a value was higher (i.e. greater clarity) in deep lakes compared with shallow lakes. To represent the potential influence of sediment resuspension in shallow lakes, we trialled including as a predictor variable, in addition to the following variables that we hypothesised would be positively correlated with wind wave height: surface area in ha (Area), maximum lake fetch in m (Fetch) and the dynamic ratio calculated as
(Håkanson Citation1982). Further, we also trialled inclusion of a ‘resuspension’ term, defined as
where U is mean windspeed (m s−1) at each lake based on analysis of regional climate data by Leathwick et al. (Citation2010). The resuspension term, with units of m2 s−2 (equivalent to J kg−1; the energy provided relative to weight), was hypothesised to be proportional to the mean wind wave height in a lake.
Unlike wind-driven resuspension, it was not possible to include continuous variables in the candidate models to represent the effect of coloured dissolved organic matter on Secchi. To consider the potential influence of this factor, we instead analysed the residual values from a Secchi = f(chl a) linear regression model to confirm whether peat lakes and/or riverine lakes were outliers based on a hypothesis that organic-rich soils in catchments of these lakes could lead to high coloured dissolved organic matter concentrations (Vant and Davies-Colley Citation1984). We also examined whether glacial lakes were outliers, which we hypothesised would be the case due to the influence of fine glacial sediments on light scattering. However, this data exploration did not indicate that lakes with these geomorphic types were outliers, although the analysis was constrained by small sample sizes (e.g. only four peat lakes were included). Based on this, the potential effect of coloured dissolved organic matter or glacial sediments on Secchi was not modelled and therefore this factor is implicitly included in the model error (quantified using bootstrapping, as described below).
Residual analysis and a Box Cox power test (Box and Cox Citation1964) showed that linear model assumptions (Quinn and Keough Citation2002) were best met when Secchi was square-root transformed; i.e. Secchi0.5 was the dependent variable in the models that were trialled. Comparison of model performance among candidate models that included the predictor variables described above showed that the best performing model included chl a and the resuspension term as predictor variables. This model was therefore applied to predict Secchi. This model was piecewise as the fitted parameter values varied depending on whether a lake is shallow or deep, with the resuspension term only used for shallow lakes (). Shallow (n = 466) and deep (n = 565) lakes were distinguished based on a threshold of zmax = 20 m, which was determined iteratively by trailing a range of thresholds and selecting the threshold that optimised model performance. Predictions of Secchi0.5 had RMSE of 1.68 m and r2 of 0.89 ().
For both Secchi and Ref_Secchi (see below), model uncertainty was quantified by refitting the data to response variables drawn from a normal distribution with variance equal to the variance of the estimated values. Confidence intervals for model predictions were quantified using bootstrapping methods consistent with those described for chl a. For each lake, developing these predictions entailed recalculating Secchi model coefficients based on bootstrapped values (Secchi*) randomly drawn from a normal distribution centred on Secchi, with a standard deviation equal to the standard error of the estimate for the model. Bootstrapped chl a* values calculated in the previous step using Equation 1 were then used in the model shown in . 95% confidence intervals were calculated as the 2.5% and 97.5% quantiles of 1000 bootstrapped iterations.
Reference Secchi depth
To predict reference condition Secchi depth (Ref_Secchi), we assumed that chl a was the sole determinant of Ref_Secchi. We recognise that sediment resuspension would also presumably influence Ref_Secchi in shallow lakes; however, we expect that the magnitude of this effect would be lower as the presence of healthy macrophyte communities would stabilise sediments. Also, sediment loads would generally be lower, and benthivorous non-indigenous fish such as common carp (Cyprinis carpio) would be absent, under a reference state. For all lakes, Ref_Secchi was therefore estimated using a linear regression with chl a as the sole predictor variable. The model was fitted to a sub-sample comprising only deep lakes (defined based on zmax > 20 m, as described above) and with chl a ≤ 33 mg m−3, which corresponds to the upper bound of the confidence intervals fitted to the Ref_Chl a estimates. Ref_Secchi was square root transformed during model fitting. The resulting regression model has similar predictive performance and fitted parameter values as the model described above to predict Secchi in deep lakes ().
TLI predictions
The optimum models to predict chl a and Ref_Chl a were applied with the current and reference TN and TP concentrations for 1031 lakes estimated by Abell et al. (Citation2019). The transformed model predictions of chl a and Ref_Chl a were back-transformed, with a correction factor used where relevant to convert log10-transformed variables back to a linear scale to account for log-transformation bias (Sprugel Citation1983). Secchi and Ref_Secchi were then derived using the optimum models based on chl a and Ref_Chl a estimates. Finally, the current and reference TN and TP concentrations estimated by Abell et al. (Citation2019) were combined with the chl a and Secchi estimates derived in this study to estimate TLI for 1031 lakes throughout NZ, using the following equations in Burns et al. (Citation1999), where TLI is the average of the four components ,
,
and
:
(2)
(2)
(3)
(3)
(4)
(4)
(5)
(5)
Current TLI was estimated by substituting estimated current values of water quality variables into Equations 2–5 whereas reference TLI was estimated using estimated reference values of water quality variables. Confidence intervals for TLI predictions were estimated by recalculating TLI 1000 times for each lake using the bootstrapped distributions of all individual TLI variables. 95% confidence intervals for lake-specific TLI estimates were then estimated based on the 2.5% and 97.5% quantiles of the bootstrapped values.
Results
There were marked differences between reference state and current values of chl a; e.g. mean chl a for current state (8.32 mg m−3) was ∼3.5 times higher than for reference state (2.42 mg m−3; ). Predicted current chl a concentrations exceeded reference concentrations in 88% of lakes (see Supplementary Information for results for all lakes, including 95% confidence intervals). For 22% of lakes, the lower bound of the 95% confidence interval for the chl a prediction exceeded the upper bound of the 95% confidence interval for the Ref_Chl a prediction; i.e. chl a was higher than Ref_Chl a and the confidence intervals did not overlap in just over one-fifth of the lakes.
Table 3. Summary of estimated values of Trophic Level Index (TLI) variables for 1031 lakes.
Mean Secchi under a reference state (9.62 m) was ∼1.5 times higher (indicating greater clarity) than the current state (6.48 m; ). Predicted current Secchi was lower than reference Secchi in 89% of lakes. For 41% of lakes, the upper bound of the 95% confidence interval for the Secchi prediction was lower than the lower bound of the 95% confidence interval for the Ref_Secchi prediction; thus, current Secchi was higher and the confidence intervals did not overlap in approximately two-fifths of the lakes.
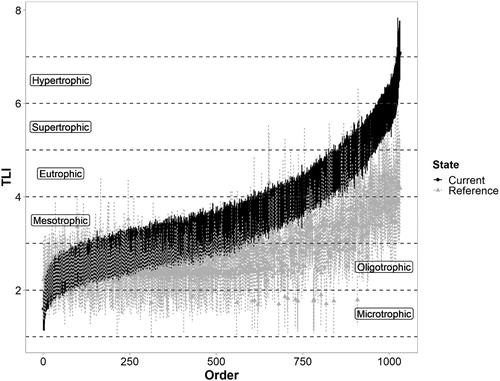
Predictions of current TLI exceeded reference TLI in 88% of lakes (). For 27% of lakes, the lower bound of the 95% confidence interval for the current TLI prediction exceeded the upper bound of the 95% confidence interval for the reference TLI prediction. That is, in about one-quarter of the lakes, current TLI was greater than reference TLI with no overlap in the confidence intervals. Overall, the median and mean TLI values for a reference state both corresponded to an oligotrophic lake state (TLI = 2.0–3.0), whereas the median and mean TLI values for a current state both corresponded to a mesotrophic state (TLI = 3.0–4.0; ).
Figure 3. Predicted TLI for 1031 New Zealand lakes corresponding to current and reference states. Vertical lines denote 95% confidence intervals. Lakes are ordered by ascending current TLI values.
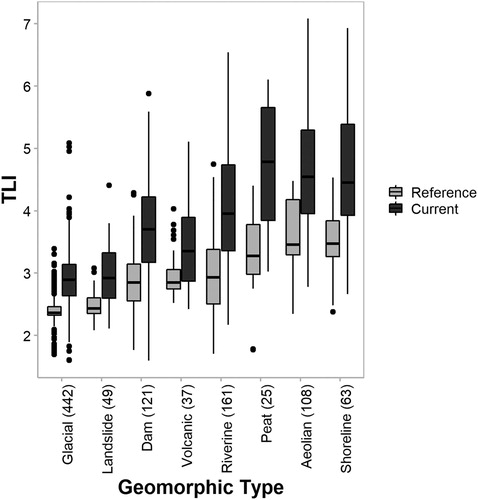
The predominant lake trophic status under a reference state was oligotrophic (68% of lakes), while the most common lake trophic status under current conditions was mesotrophic (38% of lakes) followed by oligotrophic (32% of lakes). Approximately 5% of lakes corresponded to a eutrophic status under a reference state, while the current status of 16% of lakes was eutrophic. No lakes corresponded to supertrophic or hypertrophic conditions under a reference state, while the current status of approximately 15% of lakes corresponded to these trophic status classifications. Reference TLI values varied among lakes with different geomorphic types (). Reference TLI values were generally lowest for glacial, landslide, volcanic and dam-formed lakes; median reference TLI values for each of these four geomorphic types corresponded to an oligotrophic status. Reference TLI values were generally highest for aeolian (dune), peat and shoreline lakes, with median reference TLI values corresponding to a mesotrophic status.
Figure 4. Estimated TLI for New Zealand lakes corresponding to reference and current conditions, differentiated by lake geomorphic type. Sample sizes are shown in parentheses. Only types with sample size ≥25 are presented and lakes with an undefined geomorphic type (n = 42) are not shown.
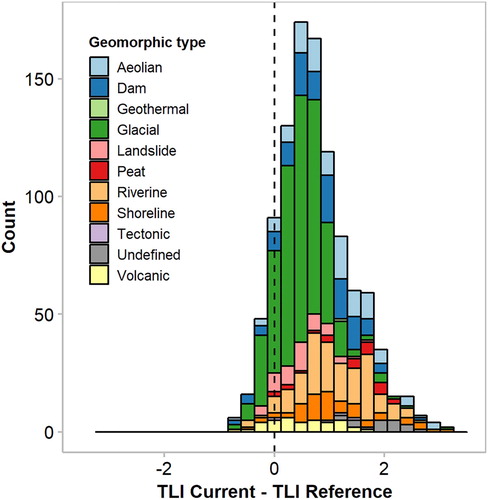
Change in TLI (current minus reference TLI) ranged from −0.84 to 3.31 (). The mean change was an increase of 0.67 and the median change was 0.77, with a standard deviation of 0.67. TLI was estimated to have decreased in 11% of lakes, with glacial lakes comprising a large proportion of these lakes (). TLI was estimated to have increased by 0–1 TLI units in 58% of lakes, by 1–2 TLI units in 26% of lakes and by >2 TLI units in the remaining 5% of lakes (). The lakes with the greatest increases in TLI (>1 TLI unit) encompassed multiple geomorphic types, although riverine lakes were frequently among the lakes with the greatest departure from reference state (). Further, the greatest increases in TLI tended to correspond to shallower lakes and there was a negative correlation between zmax and change in TLI (Spearman’s R = −0.52).
Figure 5. Frequency (counts) distribution of estimated departure from reference Trophic Level Index (TLI) for 1031 New Zealand lakes categorised based on geomorphic type.
Discussion
By building on work of other researchers (Snelder Citation2006; Leathwick et al. Citation2010; McDowell et al. Citation2013; Elliott et al. Citation2016; Abell et al. Citation2019), this study has derived estimates of chl a, Secchi and TLI for a national-scale sample of 1031 NZ lakes. These estimates are lake-specific and account for variability in factors that include geology, lake morphometry, hydrology, land cover and climate. This specificity means that we expect the reference state predictions to be more accurate than estimates derived from percentiles of measured data; e.g. as evaluated (alongside other methods) by Dodds et al. (Citation2006) in relation to lakes and reservoirs in Kansas (USA) and by Huo et al. (Citation2012) for lakes in southwest China. However, our results are likely less accurate than analysis of water samples collected from minimally disturbed lakes that are representative of the lake types considered; e.g. as undertaken to inform the National Lake Assessment to develop reference nutrient and chl a concentrations for different ecoregions in the USA (USEPA Citation2016), or as used to develop reference chl a concentrations for lake types in Europe based on analysing a dataset of 540 lakes deemed to be undisturbed (Carvalho et al. Citation2008). However, the pervasive extent of land use intensification and associated increases in catchment nutrient loads in NZ (Gluckman Citation2017; Snelder et al. Citation2018) means it is not possible to identify and sample adequate numbers of lakes that currently approximate a reference state in order to generate statistically reliable estimates that are representative of different typologies (see Schallenberg et al. (Citation2018) for further review of the applicability of techniques to estimate lake reference conditions). Our methods are an extension of landscape-context statistical modelling approaches, which are recommended to derive reference condition estimates for lakes that lack reference state or paleolimnological measurements (Soranno et al. Citation2011). By incorporating databases and results from spatial modelling tools that are specific to NZ (Snelder Citation2006; Leathwick et al. Citation2010; McDowell et al. Citation2013; Elliott et al. Citation2016), and by striving to account for variability in lake processes, the TLI estimates derived in this study apply to a large and nationally representative sample of lakes, yet also reflect environmental variability and specific characteristics of lakes that are not routinely sampled.
The accuracy of the chl a, Secchi and TLI estimates will vary among the sample, reflecting that limited information was available for several factors. In particular, although a resuspension term was included in the Secchi model applied to shallow lakes, the models did not account for variability in coloured dissolved organic matter (e.g. expected to be high in peat lakes) or inorganic glacial flour that can influence water clarity (Vant and Davies-Colley Citation1984; Rose et al. Citation2014). This was justified as our analysis showed that developing separate Secchi – chl a relationships for these lake types did not improve model performance (based on AIC). However, as acknowledged above, evaluation of these groups was constrained by small sample sizes. Further, we acknowledge that geomorphic type is based on lake formation and limnological characteristics can vary substantially within individual groups; e.g. several ‘glacial’ lakes included in the sample are subject to limited influence by glacial flour and had average Secchi > 10 m (e.g. lakes Te Anau and Manapouri). With further analysis, catchment predictors such as wetland coverage might provide a suitable proxy for coloured dissolved organic matter in lakes or, alternatively, satellite remote sensing could be used to estimate optical characteristics of lake water (Lehmann et al. Citation2019). However, such characteristics are likely to be substantially different (but unknown) for several lake types under pristine conditions, limiting the value of these approaches to estimate reference state conditions. Alternatively, with greater statistical power (i.e. a larger sample size of monitored lakes), it may be possible to develop improved models that account for systematic variability among lake geomorphic types in light attenuation characteristics; e.g. to develop different models to predict Secchi in peat or glacial lakes. Overall, the TLI estimates are highly dependent on the estimated nutrient concentrations; e.g. the chl a component of TLI (; Equation 4) is solely a function of the estimated nutrient concentrations, with chl a then used as a key predictor of Secchi. A simpler approach to estimating TLI is to take the average of
(Equation 2) and
(Equation 3); however, this would not allow lake specific chl a and Secchi values to be estimated and would also yield less accurate (albeit similar) TLI estimates (note that lake-specific values of three variables, in addition to chl a, are used to estimate Secchi in shallow lakes). A quantitative comparison of the two methods is presented in the Supplementary Information.
There is also uncertainty regarding the estimate that TLI has decreased in 11% of lakes, based on analysis of the median estimated TLI values for each lake. In some rare instances, improvements in trophic status (oligotrophication) may have occurred in NZ lakes as a consequence of hydrological manipulations; e.g. in reservoirs where historical dam construction has increased depth and water residence time of a pre-existing lake, thereby increasing nutrient attenuation due to settling and reducing the influence of sediment resuspension. However, our methods assumed that there was no change in hydrology or morphometry between reference and current states, hence the results are insensitive to such changes. Instead, the estimate that TLI decreased in 11% of lakes () may be biased high and potentially reflects a small number of lakes with estimated current nutrient concentrations that are anomalously low due to under-estimation of lake inflow nutrient concentrations using CLUES (especially TN; see Abell et al. (Citation2019) for details of how nutrient concentrations were estimated). Uncertainty in TLI estimates is accounted for by the confidence intervals fitted using bootstrapping and it is notable that all confidence intervals on the left-hand side (low end of TLI range) of overlap, whereas this is not the case for the confidence intervals on the right-hand side (high end of TLI range) of . This separation indicates that trophic status has changed little in lakes that currently have the lowest TLI values, whereas there has been a clear shift to higher TLI in the most eutrophic lakes in NZ. Uncertainty is higher (confidence intervals are wider) for the reference TLI estimates than the current TLI estimates () because the fit was poorer for the models used to predict reference state variables than models used to predict current state variables ().
Differences among geomorphic types in reference TLI estimates () are intuitive; generally, reference state TLI values were lowest in glacial lakes, which are typically deep and located in high elevation South Island catchments with low fertility soils. By contrast, reference state TLI values were highest in shoreline, dune, and peat lakes, which are typically shallower and present in lowland areas that receive higher subsidies of organic material from upstream catchments. Such trends are consistent with those described by Abell et al. (Citation2019) in relation to nutrients (see that paper for further discussion).
The finding that change in TLI was generally greater for shallow lakes is consistent with recognition that many shallow lakes in NZ, especially in lowland areas, have been particularly influenced by human pressures (Schallenberg and Sorell Citation2009). This finding is also consistent with Özkundakci et al. (Citation2014) who showed that indicators of ecological integrity were only weakly associated with human pressure indicators in deep NZ lakes. Our demonstration that the Secchi – chl a relationship varies between shallow and deep lakes (generally lower Secchi at a specific chl a value in shallow lakes) is intuitive given that resuspension of non-algal suspended sediment can make a substantial contribution to light attenuation in shallow lakes (e.g. Phlips et al. Citation1995). Variability among lakes in the Secchi – chl a relationship has long been recognised (Lorenzen Citation1980) and multiple studies have derived and contrasted Secchi – chl a relationships for different lake types (e.g. Canfield and Bachmann Citation1981; Mazumder and Havens Citation1998). However, previous studies that have used regression methods to predict Secchi in groups of lakes have generally not considered the contribution of non-algal particles; therefore, our approach of including a resuspension term in the model to predict Secchi in shallow lakes represents an improvement on the use of standard Secchi = f(chl a) regression models as it seeks to also account for the influence of sediment resuspension in a semi-mechanistic way. There is uncertainty about the threshold used to define ‘shallow’ lakes (zmax < 20 m); although this threshold was shown to minimise error in the estimates, it intuitively seems high as we are aware of lakes with zmax that approaches the threshold yet are not considered functionally shallow. It is possible therefore that this threshold is biased high to specifically account for sediment resuspension and its determination may have been confounded by the presence of multiple lakes in our sample with high TLI (low Secchi and high chl a) and moderate zmax (e.g. Lake Okaro, Bay of Plenty; zmax = 18 m) that are distinct from lakes with much lower TLI (high Secchi and low chl a) and much higher zmax, such as glacial lakes in the South Island with zmax > 100 m (e.g. Lake Wanaka, Otago). We recognise that mean depth () is superior to zmax for characterising lake typology based on depth; however,
had not been estimated for most of the lakes in the WONI sample. For reference, the average ratio of zmax to
for lakes with a defined
in the NWQMN sample was 2.8 (n = 37, standard deviation = 1.7), indicating that, on average, a lake with zmax of 20 m has
of ∼7 m. The definition of the fetch variable used in our Secchi model should be noted because we chose to use maximum lake fetch (i.e. maximum length) rather than proxies based on the square root of lake surface area (A0.5) or half of the sum of the effective length (L) and effective width (W) (Davies-Colley Citation1988; L and W defined by Welch Citation1948). Compared with values of fetch derived from other proxies (A, L, W), our approach may differentially alter (reduce) fetch values of lakes with circular morphology compared with those that are long and narrow. Detailed studies to examine directionally dependent fetch would need to be integrated with comprehensive bathymetric mapping at an individual lake scale to improve definition of the fetch variable, and were considered to be beyond the scope of the current study. We expect that any model error associated with our definition of fetch is similar or smaller than error associated with estimates of mean wind speed for each lake.
Reservoirs (i.e. dam-formed lakes in and ) were retained in the lake sample, although we recognise that a reference state is not directly applicable to these systems. We chose to retain reservoirs in the analysis as they include highly valued lakes that require management (Schallenberg et al. Citation2018). Reference condition estimates for a specific reservoir provide an indication of reference state that would apply to a natural lake that otherwise has similar morphometric and catchment characteristics. Thus, the finding that there are multiple reservoirs with current TLI greater than a reference value (by up to ∼2 TLI units; ) indicates that external nutrient load reductions in these systems could be undertaken to reduce TLI.
The estimates derived in this study provide benchmarks to inform lake and catchment management and restoration. These estimates may be complemented by broader metrics of freshwater ecological integrity (Özkundakci et al. Citation2014; Schallenberg et al. Citation2018; Kelly and Schallenberg Citation2019) to assess the state of lake ecosystems and develop restoration targets. Given the uncertainties described above, we recommend caution if using lake-specific reference values (see Supplementary Information) to inform restoration targets for individual lakes. Instead, it is preferable to consider ranges of values (including confidence intervals) for relevant lake classes (e.g. geomorphic types), as well as other lines of evidence that could include paleolimnological studies of similar lakes or traditional ecological knowledge. Additionally, other approaches, including deterministic lake ecosystem modelling (Schallenberg et al. Citation2017; Lehmann and Hamilton Citation2018) or extensions of other statistical modelling approaches could be used to predict reference water quality, particularly in unmonitored NZ lakes (Snelder et al. Citation2016), while remote sensing can be used to derive alternate estimates of current water quality in unmonitored lakes (Lehmann et al. Citation2019). Further, major changes in some catchments severely hinder the attainment of restoration targets that correspond to reference conditions prior to human disturbance; e.g. land management changes in agricultural areas such as the Waikato region have greatly enriched benthic sediment nutrient stores and considerably reduced depth and area of some lowland lakes (Hamilton et al. Citation2010). In such highly disturbed systems, conditions that correspond to a slightly altered state are likely to be the most ecologically ambitious targets that could be achieved (i.e. ‘Anthropocene baselines’; Kopf et al. Citation2015), with climate change a ‘shifting driver’ (Gillon et al. Citation2016) expected to modify the baseline ecological conditions that environmental managers can aim for in many lake ecosystems (Bennion et al. Citation2011; Me et al. Citation2018). A challenge for further research is therefore to develop restoration targets that are sufficiently protective, yet also technically and politically feasible in the face of global change.
Conclusion
This study quantified reference and current trophic state in a nationally representative sample of 1031 NZ lakes. It demonstrated a general trend of eutrophication in a broad sample of NZ lakes, reflecting pressures that include nutrient and sediment pollution associated with land use intensification. This study informs the status of lake ecosystems in NZ and provides valuable benchmarks to inform future management and assessment. These benchmarks will help to better quantify baseline ecological conditions and targets for restoration that will be achievable with global change.
All Final Results
Download Comma-Separated Values File (860.3 KB)Reference and current Trophic Level Index of New Zealand lakes
Download MS Word (339.6 KB)Acknowledgements
We thank the New Zealand Ministry of the Environment, Regional Councils and their field staff who provided lake monitoring data via the Land, Air, Water Aotearoa partnership. Kevin Collier provided direction and insightful reviews that improved the manuscript. Britta Deichmann helped to make the map.
Disclosure statement
No potential conflict of interest was reported by the author(s).
Additional information
Funding
Related Research Data
References
- Abell JM, Özkundakci D, Hamilton DP. 2010. Nitrogen and phosphorus limitation of phytoplankton growth in New Zealand lakes: Implications for eutrophication control. Ecosystems. 13:966–977. doi: 10.1007/s10021-010-9367-9
- Abell JM, Özkundakci D, Hamilton DP, Jones J. 2012. Latitudinal variation in nutrient stoichiometry and chlorophyll-nutrient relationships in lakes: A global study. Fundamental and Applied Limnology. 181(1):1–14. doi: 10.1127/1863-9135/2012/0272
- Abell JM, Özkundakci D, Hamilton DP, van Dam-Bates P, McDowell RW. 2019. Quantifying the extent of anthropogenic eutrophication of lakes at a national scale in New Zealand. Environmental Science & Technology. 53:9439–9452. doi: 10.1021/acs.est.9b03120
- Angradi TR, Ringold PL, Hall K. 2018. Water clarity measures as indicators of recreational benefits provided by U.S. lakes: swimming and aesthetics. Ecological Indicators. 93:1005–1019. doi: 10.1016/j.ecolind.2018.06.001
- Bennion H, Battarbee RW, Sayer CD, Simpson GL, Davidson TA. 2011. Defining reference conditions and restoration targets for lake ecosystems using palaeolimnology: a synthesis. Journal of Paleolimnology. 45:533–544. doi: 10.1007/s10933-010-9419-3
- BOPRC (Bay of Plenty Regional Council). 2008. Bay of Plenty Regional Natural Resources Plan. Whakatane: Bay of Plenty Regional Council. https://atlas.boprc.govt.nz/api/v1/edms/document/A2853128/content.
- Box GEP, Cox DR. 1964. An analysis of transformations. Journal of the Royal Statistical Society, Series B. 26:211–243.
- Bruesewitz DA, Hamilton DP, Schipper LA. 2011. Denitrification potential in lake sediment increases across a gradient of catchment agriculture. Ecosystems. 14:341–352. doi: 10.1007/s10021-011-9413-2
- Burnham KP, Anderson DR. 2002. Model selection and multimodel inference. New York (USA): Springer-Verlag.
- Burns N, Bryers G, Bowman E. 2000. Protocol for monitoring lake trophic levels and assessing trends in trophic state. Wellington (New Zealand): Ministry for the Environment.
- Burns NM, Clayton JS, Rutherford JC. 1999. A monitoring and classification system for New Zealand lakes and reservoir. Lake Reserv Manage. 15:225–271. doi: 10.1080/07438149909354122
- Burns CW, Stockner JG. 1991. Picoplankton in six New Zealand lakes: abundance in relation to season and trophic state. Internationale Revue der Gesamten Hydrobiologie und Hydrographie. 76:523–536. doi: 10.1002/iroh.19910760405
- Canfield Jr. DE, Bachmann RW. 1981. Prediction of total phosphorus concentrations, chlorophyll a, and Secchi depths in natural and artificial lakes. Canadian Journal of Fisheries and Aquatic Sciences. 38:414–423. doi: 10.1139/f81-058
- Carlson RE. 1977. A trophic state index for lakes. Limnology and Oceanography. 22:361–369. doi: 10.4319/lo.1977.22.2.0361
- Carvalho L, Solimini A, Phillips G, van den Berg M, Pietiläinen O-P, Lyche Solheim A, Poikane S, Mischke U. 2008. Chlorophyll reference conditions for European lake types used for intercalibration of ecological status. Aquatic Ecology. 42:203–211. doi: 10.1007/s10452-008-9189-4
- Chapman MA, Green JD, Jolly VH. 1985. Relationships between zooplankton abundance and trophic state in seven New Zealand lakes. Hydrobiologia. 123:119–136. doi: 10.1007/BF00018974
- Collier KJ, Garrett-Walker J, Özkundakci D, Pingram MA. 2018. Characteristics of consumer trophic resources for Waikato shallow lake food webs. New Zealand Journal of Marine and Freshwater Research. 53(4):588–602. doi: 10.1080/00288330.2018.1517098
- Davies-Colley RJ. 1988. Mixing depths in New Zealand lakes. New Zealand Journal of Marine and Freshwater Research. 22:517–528. doi: 10.1080/00288330.1988.9516322
- Davies-Colley RJ, Hughes AO, Verburg P, Storey R. 2012. Freshwater monitoring protocols and quality assurance (QA) national environmental monitoring and reporting (NEMaR) variables step 2. Report prepared for the Ministry for the Environment by NIWA, NIWA client report HAM2012-092. p. 104.
- Davies-Colley RJ, Smith DG. 2001. Turbidity suspended sediment, and water clarity: a review. Journal of the American Water Resources Association. 37:1085–1101. doi: 10.1111/j.1752-1688.2001.tb03624.x
- Dillon PJ, Kirchner WB. 1975. The effects of geology and land use on the export of phosphorus from watersheds. Water Research. 9:135–148. doi: 10.1016/0043-1354(75)90002-0
- Dodds WK, Carney E, Angelo RT. 2006. Determining ecoregional reference conditions for nutrients, Secchi depth and chlorophyll a in Kansas lakes and reservoirs. Lake and Reservoir Management. 22:151–159. doi: 10.1080/07438140609353892
- Duggan IC, Green JD, Shiel RJ. 2001. Distribution of rotifers in North Island, New Zealand, and their potential use as bioindicators of lake trophic state. Hydrobiologia. 446/447:155–164. doi: 10.1023/A:1017503407240
- Elliott AH, Semadeni-Davies AF, Shankar U, Zeldis JR, Wheeler DM, Plew DR, Rys GJ, Harris SR. 2016. A national-scale GIS-based system for modelling impacts of land use on water quality. Environmental Modelling & Software. 86:131–144. doi: 10.1016/j.envsoft.2016.09.011
- Gillon S, Booth EG, Rissman AR. 2016. Shifting drivers and static baselines in environmental governance: challenges for improving and proving water quality outcomes. Regional Environmental Change. 16:759–775. doi: 10.1007/s10113-015-0787-0
- Gluckman P. 2017. New Zealand’s fresh waters: values, state, trends and human impacts. Office of the Prime Minister’s Chief Science Advisor, Auckland.
- Håkanson L. 1982. Lake bottom dynamics and morphometry: the dynamic ratio. Water Resources Research. 18:1444–1450. doi: 10.1029/WR018i005p01444
- Håkanson L. 2005. The importance of lake morphometry and catchment characteristics in limnology - ranking based on statistical analyses. Hydrobiologia. 541:117–137. doi: 10.1007/s10750-004-5032-7
- Hamilton DP, Mitchell SF. 1997. Wave-induced shear stresses, plant nutrients and chlorophyll in seven shallow lakes. Freshwater Biology. 38:159–168. doi: 10.1046/j.1365-2427.1997.00202.x
- Hamilton DP, Vant WN, Neilson KA. 2010. Lowland lakes. In: Collier KJ, Hamilton DP, Vant WNB, Howard Williams C, editors. The waters of the Waikato: ecology of New Zealand's longest river. Hamilton (New Zealand): Environment Waikato and the Centre for Biodiversity and Ecology Research (The University of Waikato); p. 245–264.
- Hanna M. 1990. Evaluation of models predicting mixing depth. Canadian Journal of Fisheries and Aquatic Sciences. 47:940–947. doi: 10.1139/f90-108
- Hawkins CP, Olson JR, Hill RA. 2010. The reference condition: predicting benchmarks for ecological and water-quality assessments. Journal of the North American Benthological Society. 29:312–343. doi: 10.1899/09-092.1
- Huo S, Zan F, Chen Q, Xi B, Su J, Ji D, Xu Q. 2012. Determining reference conditions for nutrients, chlorophyll a and Secchi depth in Yungui Plateau ecoregion lakes, China. Water and Environment Journal. 26:324–334. doi: 10.1111/j.1747-6593.2011.00292.x
- Kelly DJ, Schallenberg M. 2019. Assessing food web structure in relation to nutrient enrichment, macrophyte collapse and lake resilience in shallow lowland lakes. New Zealand Journal of Marine and Freshwater Research. 53(4):603–619. doi: 10.1080/00288330.2019.1606021
- Kopf RK, Finlayson CM, Humphries P, Sims NC, Hladyz S. 2015. Anthropocene baselines: assessing change and managing biodiversity in human-dominated aquatic ecosystems. Bioscience. 65:798–811. doi: 10.1093/biosci/biv092
- Kusabs IA, Quinn JM, Hamilton DP. 2015. Effects of benthic substrate, nutrient enrichment and predatory fish on freshwater crayfish (kōura, Paranephrops planifrons) population characteristics in seven Te Arawa (Rotorua) lakes, North Island, New Zealand. Marine and Freshwater Research. 66:631–643. doi: 10.1071/MF14148
- Leathwick JR, West D, Gerbeaux P, Kelly D, Robertson H, Brown D, Chadderton WL, Ausseil AG. 2010. Freshwater Ecosystems of New Zealand (FENZ) geodatabase version one user guide. Wellington, (New Zealand): Department of Conservation.
- Lehmann MK, Hamilton DP. 2018. Modelling water quality to support lake restoration. In: Hamilton DP, Collier KJ, Quinn JM, Howard-Williams C, editors. Lake restoration handbook: a New Zealand perspective. Cham: Springer; p. 67–105.
- Lehmann MK, Nguyen U, Muraoka K, Allan MG. 2019. Regional trends in remotely sensed water clarity over 18 years in the Rotorua Lakes, New Zealand. New Zealand Journal of Marine and Freshwater Research. 53:513–535. doi: 10.1080/00288330.2019.1609051
- Lohse KA, Brooks PD, McIntosh JC, Meixner T, Huxman TE. 2009. Interactions between biogeochemistry and hydrologic systems. Annual Review of Environment and Resources. 34:65–96. doi: 10.1146/annurev.environ.33.031207.111141
- Lorenzen MW. 1980. Use of chlorophyll-Secchi disk relationships. Limnology and Oceanography. 25:371–372. doi: 10.4319/lo.1980.25.2.0371
- Mazumder A, Havens KE. 1998. Nutrient-chlorophyll-Secchi relationships under contrasting grazer communities of temperate versus subtropical lakes. Canadian Journal of Fisheries and Aquatic Sciences. 55:1652–1662. doi: 10.1139/f98-050
- McDowell RW, Snelder TH, Cox N, Booker DJ, Wilcock RJ. 2013. Establishment of reference or baseline conditions of chemical indicators in New Zealand streams and rivers relative to present conditions. Marine and Freshwater Research. 64:387–400. doi: 10.1071/MF12153
- Me W, Hamilton DP, McBride CG, Abell JM, Hicks BJ. 2018. Modelling hydrology and water quality in a mixed land use catchment and eutrophic lake: effects of nutrient load reductions and climate change. Environmental Modelling & Software. 109:114–133. doi: 10.1016/j.envsoft.2018.08.001
- Ministry for the Environment & Stats NZ. 2019. New Zealand’s environmental reporting series: environment aotearoa 2019.
- New Zealand Government. 2017. National policy statement for freshwater management 2014 (updated 2017). Wellington. p. 47.
- Özkundakci D, Hamilton DP, Kelly D, Schallenberg M, De Winton M, Verburg P, Trolle D. 2014. Ecological integrity of deep lakes in New Zealand across anthropogenic pressure gradients. Ecological Indicators. 37:45–57. doi: 10.1016/j.ecolind.2013.10.005
- Phlips EJ, Aldridge FJ, Schelske CL, Crisman TL. 1995. Relationships between light availability, chlorophyll a, and tripton in a large, shallow subtropical lake. Limnology and Oceanography. 40:416–421. doi: 10.4319/lo.1995.40.2.0416
- Poikāne S, Alves MH, Argillier C, van den Berg M, Buzzi F, Hoehn E, de Hoyos C, Karottki I, Laplace-Treyture C, Solheim AL, et al. 2010. Defining chlorophyll-a reference conditions in European lakes. Environmental Management. 45:1286–1298. doi: 10.1007/s00267-010-9484-4
- Quinn GP, Keough MJ. 2002. Experimental design and data analysis for biologists. Cambridge (UK): Cambridge University Press.
- R Core Team. 2017. R: a language and environment for statistical computing. https://www.r-project.org/.
- Rose KC, Hamilton DP, Williamson CE, McBride CG, Fischer JM, Olson MH, Saros JE, Allan MG, Cabrol N. 2014. Light attenuation characteristics of glacially-fed lakes. Journal of Geophysical Research: Biogeosciences. 119:1446–1457.
- Santoso A, Hamilton DP, Hendy CH, Schipper LA. 2017. Carbon dioxide emissions and sediment organic carbon burials across a gradient of trophic state in eleven New Zealand lakes. Hydrobiologia. 795:341–354. doi: 10.1007/s10750-017-3158-7
- Schallenberg M, de Winton MD, Kelly DJ. 2018. Indicators of ecological integrity. In: Hamilton DP, Collier KJ, Quinn JM, Howard-Williams C, editors. Lake restoration handbook: a New Zealand perspective. Cham: Springer; p. 367–393.
- Schallenberg M, Hamilton DP, Hicks AS, Robertson HA, Scarsbrook M, Robertson B, Wilson K, Whaanga D, Jones HFE, Hamill K. 2017. Multiple lines of evidence determine robust nutrient load limits required to safeguard a threatened lake/lagoon system. New Zealand Journal of Marine and Freshwater Research. 51:78–95. doi: 10.1080/00288330.2016.1267651
- Schallenberg M, Sorell B. 2009. Regime shifts between clear and turbid water in New Zealand lakes: environmental correlates and implications for management and restoration. New Zealand Journal of Marine and Freshwater Research. 43:701–712. doi: 10.1080/00288330909510035
- Smith VH. 2009. Eutrophication. In: Likens GE, editor. Encyclopedia of inland waters. Vol. 3. Amsterdam: Elsevier Inc; p. 61–73.
- Snelder TH. 2006. Definition of a multivariate classification of New Zealand lakes. NIWA client report CHC2006-084, prepared for the Department of Conservation.
- Snelder TH, Larned ST, McDowell RW. 2018. Anthropogenic increases of catchment nitrogen and phosphorus loads in New Zealand. New Zealand Journal of Marine and Freshwater Research. 52:336–361. doi: 10.1080/00288330.2017.1393758
- Snelder T, Wood S, Atalah J. 2016. Strategic assessment of New Zealand’s freshwaters for recreational use: a human health perspective. Land Water People Client Report 2016-011. https://www.mfe.govt.nz/publications/fresh-water/strategic-assessment-of-new-zealand%E2%80%99s-freshwaters-recreational-use-human.
- Soranno PA, Wagner T, Martin SL, McLean C, Novitski LN, Provence CD, Rober AR. 2011. Quantifying regional reference conditions for freshwater ecosystem management: a comparison of approaches and future research needs. Lake and Reservoir Management. 27:138–148. doi: 10.1080/07438141.2011.573614
- Sprugel DG. 1983. Correcting for bias in log-transformed allometric equations. Ecology. 64:209–210. doi: 10.2307/1937343
- Swift TJ, Perez-Losada J, Schladow SG, Reuter JE, Jassby AD, Goldman CR. 2006. Water clarity modeling in Lake Tahoe: linking suspended matter characteristics to Secchi depth. Aquatic Sciences. 68:1–15. doi: 10.1007/s00027-005-0798-x
- Timperley MHH. 1983. Phosphorus in spring waters of the Taupo Volcanic Zone, North Island, New Zealand. Chemical Geology. 38:287–306. doi: 10.1016/0009-2541(83)90060-8
- Trolle D, Hamilton DP, Hendy C, Pilditch C. 2008. Sediment and nutrient accumulation rates in sediments of twelve New Zealand lakes: Influence of lake morphology, catchment characteristics and trophic state. Marine and Freshwater Research. 59:1067–1078. doi: 10.1071/MF08131
- USEPA. 2016. National lakes assessment 2012: a collaborative survey of lakes in the United States. Washington, DC: U.S. Environmental Protection Agency.
- Vant WN, Davies-Colley RJ. 1984. Factors affecting clarity of New Zealand lakes. New Zealand Journal of Marine and Freshwater Research. 18:367–377. doi: 10.1080/00288330.1984.9516057
- Vollenweider RA. 1971. Scientific fundamentals of the eutrophication of lakes and flowing waters, with particular reference to nitrogen and phosphorus as factors in eutrophication. Paris: Organisation for Economic Co-operation and Development.
- Welch PS. 1948. Limnological methods. New York, NY: McGraw-Hill; p. 381.
- White E. 1983. Lake eutrophication in New Zealand - a comparison with other countries of the organisation for economic co-operation and development. New Zealand Journal of Marine and Freshwater Research. 17:437–444. doi: 10.1080/00288330.1983.9516018