
Abstract
With the concept of affordance at its core and a method developed to assess settlement site locations using GIS, this paper aims to provide an improved and more nuanced understanding of the placement of longhouse settlements in the landscape during the Late Neolithic (LN) and Bronze Age (BA), and address what these locations can tell us about past human–environment relationships. While the results align with many of the criteria outlined in previous research on site locations, the study also reveals some temporal and spatial differences within the study area of southeast Norway, suggested to reflect specific relations and local affordances visible through the composition of site location variables. The results strongly indicate that the region’s woodlands heavily influenced LN/BA people and that the many different affordances of the forest likely were fundamental constituents of their life. The developed method and the results of the analysis also indicate the existence of some meaningful distances between where people situated their houses and certain variables, albeit varying slightly over time.
INTRODUCTION
If we knew which conditions made Bronze Age farmers decide to settle down, it would undoubtedly become easier to find traces of them; if we, on the other hand, knew how to find these settlements, it would likely give grounds for better assessing why they are located as they are. (Østmo Citation1991, p. 10, author’s translation)
Three decades ago, the above statement was written in a void. At the time, there was a total absence of houses dating to the Late Neolithic (LN, 2350–1700 BCE, see ) and the Bronze Age (BA, 1700–500 BCE) in southeast Norway (). Today, however, the situation is very different, with a database consisting of 145 buildings from 56 sites. Although a small account compared with the number of LN-BA houses from other parts of southern Scandinavia, it is sufficient to finally return to the opening statement.
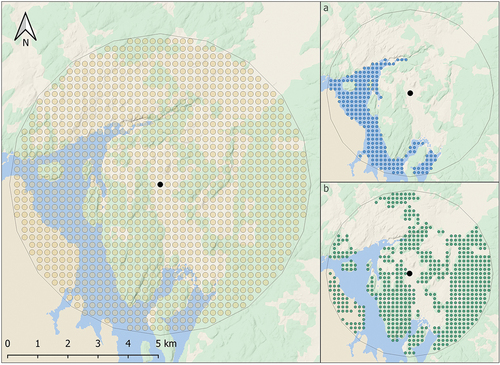
Fig. 1. Selected sites for analysis, numbers correspond with () (map by author).
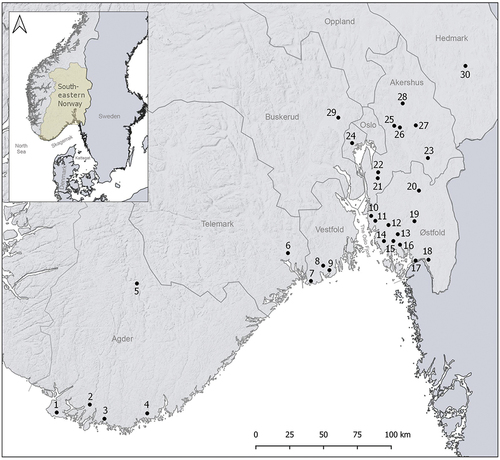
Table 1. Chronology of the periods in the study (after Vandkilde Citation1996.).
Table 2. Selected settlement sites for analysis according to districts (representing administrative counties in Norway until 2021). Links to excavation reports available in online repository.
Table 3. Selection criteria of sites based on scaling systems of the definability of the house ground plans and the number of dates from the site. Further information and details on the scaling system are available in another paper in the online repository.
Based on the present data, it seems likely we have gained an ability to find a certain number of LN-BA settlements. What remains, however, is to analyse what conditions made people settle in specific areas, and through this get closer to the where and the why behind these LN and BA settlement locations in southeast Norway. More specifically, I pose the question of how a quantitative analysis of these locations can improve our understating of past human–environmental engagements through applying Gibson’s (Citation1979) ‘Theory of Affordance’ – meaning what the environment offers the organisms and how they perceive it and act accordingly (Gibson Citation1979, p. 127).
I first approach the environmental and cultural conditions, consisting of 12 variables analysed within a selection of 30 sites (). The applied methodology, developed for this study, consists of a ‘reading’ of the presence of variables through a point grid. This quantitatively obtained information on the variables is further treated through data analysis in two stages, with the overall aim to look for trends and potential patterning, as well as to detect eventual variation in the settlement locations in a temporal and spatial perspective. Through the developed method, the study has the objective of creating a more nuanced and informed picture of the landscape factors and environmental conditions surrounding (different) settlements, which it is hoped will contribute to a broadened idea of likely everyday experiences (Ingold Citation1992). This will further function as stepping-stones for the discussion of affordances, supported by different relevant data types.
BACKGROUND
The Scandinavian longhouses dating to the LN and BA are well studied in many parts of the region, and are often used to discuss economic, social, and political organisations (e.g., Kristiansen Citation2006, Artursson Citation2009). Even though such institutions contribute to frame patterns of settlement locations, their placement in the landscape is also argued to have been governed by the environment, and that locations were sought out according to certain natural resources (e.g., Trigger Citation1968, Kvamme Citation2020).
PREVIOUS RESEARCH
A central work on the placement of settlements in Scandinavian archaeology based on landscape features is Olausson’s (Citation1992) study of Bronze Age cultural landscapes in southern Sweden. In her study, Olausson implicitly formulates a set of criteria that can be summarised as ollows: settlements were situated on a south-facing slope, surrounded by wetlands or open water. Sandy soil was preferred, but settlements on clay occur. Clay was also an important raw material, as were timber and fresh water. Another influencing factor was the settlements’ proximity to graves, and Olausson (Citation1992, p. 262) points out that there should be at least one barrow within 1 km of the site. There is a long tradition in Scandinavian archaeology of proposing close links between mounds and settlement sites during the BA, most of which is in agreement with Olausson’s suggestion of 1 km (e.g., Møllerop Citation1963, Ambrosiani Citation1964, Kristiansen Citation1978, Citation1998). However, there is no real consensus on whether they represent the centre of a territory or its boundaries, or whether they were monumental displays of power or collectiveness (e.g., Johansen et al. Citation2004, Kristiansen Citation2010).
Although few have formulated similar sets of criteria to Olausson’s, several scholars have shown interest in how the physical environment governed the placement of settlement sites and emphasised many of the same variables (e.g., Tesch Citation1980, Østmo Citation1988, Citation1991, Prøsch-Danielsen et al. Citation2018). Concerning southeast Norway specifically, it is settlements on sandy soils that have been stressed, as they were particularly important for agricultural means, and closeness to terminal moraines with nutritional and fertile soil, particularly Raet, has been seen as significant (Johansen Citation1956, p. 49, Østmo Citation1988, p. 101, 113). Another important feature is that the settlements moved around within delimited catchment areas (Artursson Citation2009, p. 46, 108, 121, with further references), and for coastal western Sweden in the BA it has been suggested that there was one household per 2 km2 (Ling et al. Citation2018, p. 499), which for peripheral southeast Norway is likely to have been even more sparsely populated. A distance of around 5 km, i.e., a 1-hour walk (Vita-Finiz and Higgs Citation1970, Hamilton et al. Citation2006), is suggested to be a suitable distance for catchment areas in southern Norway and Sweden (Østmo Citation1988 −134, pp. 133, Olausson Citation1992, p. 264), with the most crucial resources situated within 2 km from the site (Østmo Citation1991, p. 29).
MOVING BEYOND MEASUREMENT
The above outline show that previous studies have contributed to an adequate outline of the kinds of places where settlements are likely to occur; nevertheless, I argue, it has created a somewhat one-dimensional picture. In general, we lack a more nuanced understanding of how LN/BA people weighed various landscape factors in their decision-making processes when settling down and engaging with the environment across time and space. Moreover, site-catchment analysis, perhaps particularly that connected to food, often assumes that all available resources would be consumed, failing ‘to take into account that people are cultural beings with culturally informed, historically situated perceptions of what constitutes food’ (Oma Citation2018, p. 13). Just as Kristin Armstrong Oma (Citation2018, p. 13, with further references) reflects on how it is important to go ‘beyond subsistence’, remembering that all does not necessarily have to be food, I also aim at going beyond simple measurements of landscape features. First, we must be open to the notion that closeness to a variable can be highly significant for a variety of reasons, including those that are not economic, and that distance can be equally as meaningful as vicinity. Second, I do not see landscapes as passive features of resources, but approach them as co-constituted by humans and the environment (Heras-Escribano and De Pinedo-García Citation2018). For this, I hypothesise that the analysed variables can entail complex, dynamic, and reinforcing more-than-human relations. Although I am aware that it is unlikely that people operated within neatly encircled areas, I nevertheless regard a 5 km radius around the settlement as an appropriate distance for analysing the environment in which people living in these settlements were likely to spend and experience much of their everyday life.
GEOGRAPHY AND ENVIRONMENT
Southeast Norway is a vast and varied region, stretching approximately 540 km north-to-south and 300 km east-to-west. In the north and west, the region is separated from other parts of the country by mountainous landscapes. Although one of the loftiest lands in Europe, water also dominates Norway. In the south, the region has a c.400 km coastal zone towards the Skagerrak strait, which during the LN and Early Bronze Age (EBA) was at a higher level than today. On both sides of the Oslo Fjord, for instance, the relative sea-level was c.15–20 m higher (Sørensen Citation2002, Sørensen et al. Citation2014), while it was much less dramatic towards the west and southernmost parts of the study area, about 4 m in the LN (Prøsch-Danielsen Citation1997, Romundset et al. Citation2014). From the shore, several lakes and numerous rivers stretch inwards in all directions, offering rich varieties of lacustrine resources, as well as creating arteries for regional movement across the region.
The geography and environment between the shore and the mountains is separated into different landscape regions and vegetation zones (, for further details see Moen Citation1999, Puschmann Citation2005). While sharing overall characteristics, the regions are not uniform landscapes. Simple references to these landscape regions can therefore, I argue, reinforce the one-dimensional picture of the environments in which the settlements occur. Most LN and BA settlement sites, for example, are found in parts referred to as the lowlands, with low-lying plains rich in marine deposits, rarely surpassing 200 MASL While this landscape region has the overall characteristic of being regarded as an area especially suitable for agriculture in Norway, both in terms of soil qualities and mean annual temperatures (Puschmann Citation2005, p. 19), it does not have to mean that settlement site locations within this area are similar or that the LN/BA settlements occurred within agricultural environments. Considering that, even today, only 3–4% of Norway consist of cultivated land, the traditional agricultural orientated explanations for why people settled down and became sedentary, and how actually they lived their everyday life in southeast Norway during the LN/BA could be considered a simplification.
Fig. 2. Map of landscape regions and vegetations zones of southeast Norway, with the 5 km zones surrounding the sites that will be analysed (map by author based on information from Moen Citation1999, Puschmann Citation2005).
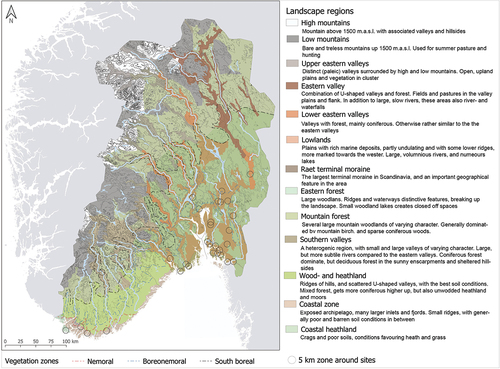
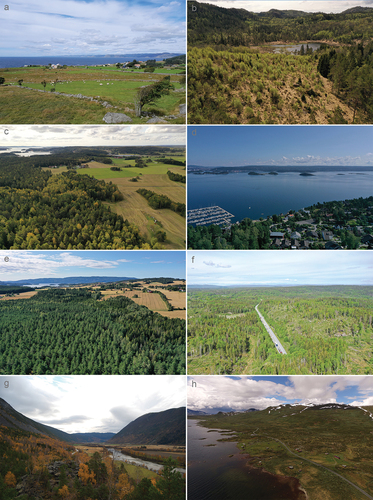
Fig. 3. Examples from some of the landscape regions and vegetation zones in southeast Norway. a: the coastal heathland in southernmost Norway; b: the inland wood- and heathland, with a small forest lake; c: low-lying, but fertile coastal landscape looking out towards the sea; d: vista towards the Oslo Fjord; e: slightly more undulating inland lowlands, with a large lake and mountains in the background; f: the wide stretching eastern forest; g: the eastern valleys; h: from the vinstra waters situated at around 1000 MASL. In the mountainous regions (except for a, which was taken by the author, all photos have been taken in connection with archaeological excavations by MCH).
THEORETICAL PERSPECTIVES
AFFORDANCE AND PHENOMENOLOGY
The concept of affordance was introduced by Gibson (Citation1979) to describe the relationship between organisms and their environments in regard to what the environment offers and how an organism living in the environment directly perceives it and acts accordingly (Gibson Citation1979, p. 127). Because affordance is applied and accounted for in numerous archaeological studies (for overview see, e.g., Johnson Citation2012), I will offer only a brief account of the concept – drawing some overall lines while also highlighting matters central to this study.
Affordance is often exemplified by a chair, which holds the potential for sitting. According to Gibson, the potential of an object with four legs and a seat to sit on can be directly perceived without first categorising the object as ‘a chair’, hence suggesting that information resides in the environment. This has been criticised by many as too one-sided, as a chair does not afford sitting to all (e.g., Knappett Citation2004). For a child, a chair is in many situations more climb-able then sit-able, while if the chair is full of papers is has lost its affordance of being sit-able to all (Sjöstrand Citation2011, pp. 76–78). Moreover, certain information can also be derived from association and internal categorisation. This can be exemplified by a post-box, which affords the posting of mail, while a similar looking litterbin does not, hence implying that a post-box has affordance that is ‘indirectly perceived’ (Knappett Citation2004, pp. 44–45). This means that people do not act directly upon the environment but through the medium of cultural representations. While agreeing with the above example, such views also have, as argued by T. Ingold, roots in a western dualistic worldview. With regard to the landscape, and with reference to Gibson’s affordance, he suggests a notion of human–environment mutualism, advocating that people do in fact acquire direct knowledge from their surroundings (Ingold Citation1992, p. 40). Although humans always can adopt ‘designer orientations’, Ingold argues, this is not how we perceive the environment during our everyday life. Rather, he believes ‘that our immediate perception of the environment is in terms of what it affords’ (Ingold Citation1992, p. 44). Following Ingold’s way of thought, I regard GIS analyses of mapped variables as means for reproducible and robust characterisation of human–environmental engagements of affordances.
Here, my study is inspired by the work accomplished by Hamilton et al. (Citation2006), who developed a method for phenomenological archaeological fieldwork and catchment analysis. Their aim was to explore the more everyday experiences and domestic contexts of past lives and they were among the first to study secular and domestic spaces phenomenologically. Through field work recordings and experiments, they developed an explicit and replicable method, including a phenomenological site catchment analysis (Hamilton et al. Citation2006, pp. 54–58). Where they walked systematically in cardinal directions and periodically recorded observations, such as soil types and vegetations, I have developed a method to quantitatively analyse many of the same features using GIS, which I postulate reflects affordances. Affordance-based analyses were first adapted to archaeological GIS by Llobera (Citation1996, however, see Gaffney and Stančič Citation1991, Wheatley Citation1993), and later developed upon by several scholars (Lake and Woodman Citation2003, Gillings Citation2012, Eve and Crema Citation2014, Wernke et al. Citation2017). The most common way to analyse affordance using GIS is through visual affordance as locational factors – such as the importance of an ocean view in placement of monuments (e.g. Gillings Citation2009, Risbøl et al. Citation2013) or viewsheds to/from rock art sites (e.g. Bradley Citation1991, Gjerde Citation2002), or even the lack there off (Jerpåsen Citation2009). Although valuable, it is not what people might have seen from the settlement or when approaching the site I seek to explore, but rather to implement a wider awareness of the physical environment the sites where located in. As such, the study hope to contribute to with an approach to landscape studies that is not centred around the sense of sight.
Although we can never really know what someone sensed, the GIS analysis can provide some underpinnings and give insight into what environments humans experienced within, hence having resonance with phenomenological approaches to landscape (Ingold Citation1993, Citation2000, Citation2007, Tilley Citation1994). The results of the analysis can possibly help us to get a little closer to past individuals ‘being-in-the-world’ (Heidegger Citation1962), albeit necessarily somewhat abstract. Where Hamilton et al. (Citation2006, pp. 54–55) aimed to develop a method to rethink traditional site catchment and territory analysis from the perspective of, for instance, age, and gender, this study aims to quantitatively uncover how various conditions can have been weighted in the past based on their affordances.
MATERIAL AND METHOD
This section will describe the most important aspects of the methodology and decisions regarding selections of both the settlement material and variables, while further details and descriptions, including access to the underlying datasets and codes, are available in the following online repository: https://github.com/sanderiksen/exploring-affordances.
SETTLEMENT MATERIAL
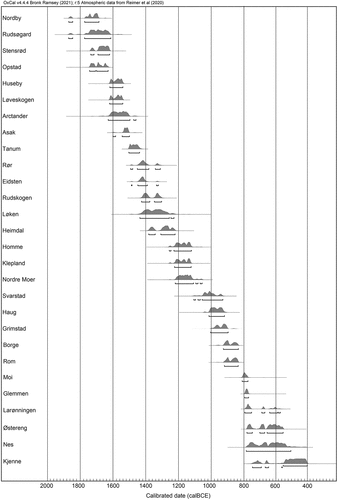
The 30 sites () were chosen from a larger dataset collected through reviewing excavation reports from the Museum of Cultural History (MCH). The sample of sites makes up a little more than half of the settlement material, chosen based on a combination of an established scaling system of the material () but most importantly to ensure spatial and temporal representativity within the dataset. The dates presented in the curve plot () are calibrations of all available and relevant dates (n = 288) from the settlement sites. The calibrations were performed using the IntCal 20 calibration curve (Reimer et al. Citation2020).
Fig. 4. Radiocarbon multiplot of all 288 dates (5055–2305 BP) from the selected sites arranged chronologically. Individual dates available in online repository.
VARIABLES
The selection of the condition variables for this study is mainly based on the previous research outlined earlier. Contrary to most previous studies, however, this study is quantitative, treating the presence and absence of different variables occurring within the 5 km zone. This means that data on-site variables, such as soil conditions and slope aspect, which necessarily would only have been counted once, are excluded from the point grid analysis. This does not mean that I regard them as unimportant when deciding where to settle, and information on these two variables is provided within a section of ‘on-site’ conditions.
Of the 12 variables (), four are categorised as cultural and derived from different archaeological databases, while eight are categorised as natural. With the exception of sea level, where digital elevation models (DEM) have been clipped to the site’s contemporary sea-level, data on the natural variables are derived from freely available datasets retrieved from the Norwegian Mapping Authority.
Table 4. Variables chosen for analysis with sources. The upper eight natural variables are freely available mapped datasets retrieved from the Norwegian Mapping Authority (https://data.norge.no/nlod/en/2.0), while the bottom four are cultural variables retrieved from semi-open archaeological databases belonging to Norwegian cultural resource management. Further information and details are available in the online repository.
Although the variables are separated into two categories, it is necessary to stress that natural variables, from an individual’s perspective, may not be simply limited to the strict definition of ‘nature’. A forest can afford more than timber; it can also be dark and scary or calm and relaxing, on which I shall reflect on later. Moreover, natural variables are also part of seasonal landscapes, which potentially can change drastically, reflecting the complexity of human–environmental engagements (Jones Citation2007, p. 49).
METHODOLOGY
For this study, a method was developed to assess the site locations in relation to mapped variables through an analysis of set points within delimited grids using QGIS. To acquire information on the variables from the source data, a grid with 250 m lag between the points was created inside the previously discussed 5 km zone surrounding the settlement site ().
Fig. 5. The entire grid to the left, with information on (top) point IDs and demonstration of how the points can be used to read the cardinal directions, and the grid clipped to layers of the variables sea (a) and forest (b) from one of the analysed settlement sites. The clipped data are exported as tables, holding information on the site numbers, variable numbers, individual point IDs, and the points distance from the site, and unified in access. The individual point IDs increase from left to right, making it possible to derive information on the cardinal direction of variables in relation to the settlement site, but also to each other – either at a large or on a more singular level (illustration by author).
After reading the source data, the point grid is clipped according to its overlay with the variables (exemplified in ). While the lag of the point grid can be scaled up and down, all depending on wanted level of details, I found 250 m sufficient to not ignore linear features, such as rivers, or the smaller (cultural) variables. However, the correspondence with grid and variables should be double-checked. After each variable was clipped, their individual attribute tables could be exported and unified, resulting in a total of 48,130 individual observations from all sites forming the underlying data of the analysis. This combined dataset includes information on the site numbers, variable numbers and text information, individual point IDs, and the individual points’ set distance from the settlement site. It is important to point out that the above approach is just one method for analysing and modelling the patterns of settlement location and subsistence strategies (see e.g., Spencer and Bevan Citation2018). Through the usage of the point grid compared with, for instance, calculations of areal coverages of the variables (either within the entire 5 km zone or through a division of it into smaller set areas, e.g., at every 1 km mark) this method offers the possibility to derive information on the cardinal direction of variables in relation to the settlement site (as demonstrated in ), but also to search for direct overlap between variables rather easily through the point IDs. This would allow for a detailed analysis of variable relations and compositions, which is beyond the scope of this study. Most importantly for this study at least, and one of the main reasons why I set out to develop a method, is its ability to provide information on distances off all observations, individually and combined.
To first gain an overview of the observed data, I employed correspondence analysis (CA) using the FactoMineR package (Lê et al. Citation2008), developed for the R programming language (R Core Team Citation2020). CA is useful when moving from the singular to the general within a dataset to look for degrees of association between variables and sites (for details see e.g. Shennan Citation1997). However, since CA compresses and reduces multivariate information into a particular (two-dimensional) point of view, some information is necessarily lost. This, alongside CA’s inability to present the important data on distances, resulted in the second analytical component of exploratory and statistical analysis of the observations.
RESULTS
STAGE ONE
The patterning derivable from the row plot of the sites () can partly be explained by the districts in which the sites are located (). The fact that the sites cluster according to districts in the CA implies that they have different compositions of variables, which could be related to specific affordances. However, there are also sites from not only the same district, but which also are situated only a few kilometres away from each other that end up uncorrelated, such as Norby and Løveskogen, which could indicate that different environments were also sought after within close vicinity of each other. On the other hand, the mixing of sites from widely different vegetation zones, within and between districts (see ), such as the close connection between Moi and Romsletta or Nes and Østereng, could indicate that specific landscape affordances were sought after across vast areas. By moving to the row plot, where the sites are differentiated by dates (), it becomes evident that several correlations, for instance Moi/Romsletta and Nes/Østereng, also have a temporal explanation. This could also be the explanation for Nordy and Løveskogen, with the former being LN and the latter EBA. To further evaluate the significant of these clusters, I have also checked whether there are any suits of artefacts or finds common between sites (). Apart from expect time-related variations, such as lithics being more pronounced at the LN-EBA sites compared with those from the LBA, there are few significant correlations among the finds to further explain the clusters.
Fig. 6. Correspondence plots of sites differentiated according to both districts (a) and dates (b). The two first dimensions account for 61.8% of the inertia. The district plot shows that the sites cluster spatially, implying that they have different compositions of variables, while the date plot show that the distribution has a temporal explanation. The dates are based on the same dataset as in ; however, as R needs a single number and not a range, I have used a calculated median and therefore some of the temporal distribution of the sites is not reflected in the plot. Further evaluation of temporal trends has therefore been doubled-checked against the real site dating as reflected in .
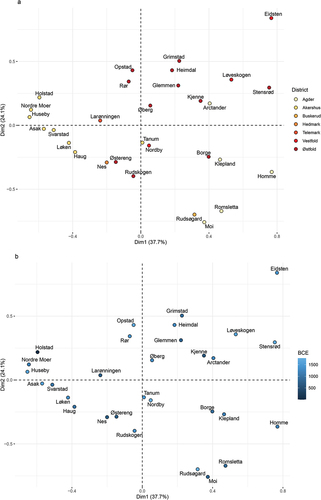
Table 5. Schematic overview of finds from sites according to information in reports (references available in ). Apart from acorn at the site Løveskogen, the category ‘nuts’ consists of hazelnuts. ‘*’ indicates that the find cannot automatically be connected with LN-BA activity at the site based on information in the report and ‘?’ refers to insecurity in the interpretation of the find.
Within the district cluster, there is also a tendency for earlier sites to correlate more strongly among themselves than those dated to the LBA. This could indicate that there is more variance in location between sites dating to the LBA compared with the LN–EBA. To get a better understanding of these temporal and spatial tendencies in the site locations, it is valuable to review the results of the column and row plots together (), including a presentation of the patterning derivable from the column plot.
Fig. 7. Correspondence plot of variables biplotted alongside the sites to gain a better understanding of the temporal and spatial tendencies of the site location variables. Simply put, and as elaborated on in the text, variables and sites that are close together are more strongly correlated; conversely, those that are farther apart are negatively correlation.
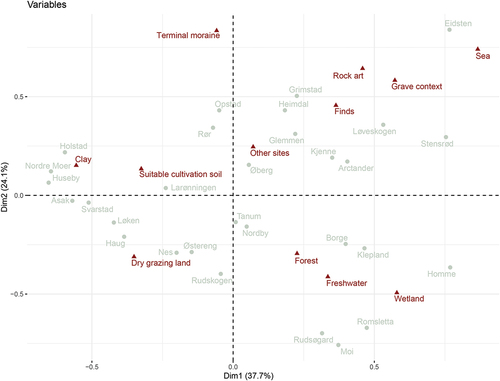
The column plot () demonstrates a cluster of the cultural variables, all of which are correlated with each other and to the natural variable ‘sea’. Although rather strongly connected to the cultural variables, sea is differentiated from the other natural variables. It is negatively correlated to ‘dry grazing’ landscape, while it has no correlation with ‘clay’ and ‘suitable cultivation soil’. These again are all strongly correlated with each other. Sea has only moderate to no relation with ‘forest’, ‘fresh water’, and ‘wetland’, which also are correlated with each other. Although difficult to conclude based on the CA, such correlations could be indicative of bundles of affordances, meaning that they are not completely independent, but interactive and arising from relations. It is also worth noting that ‘forest’ and ‘clay’ are positioned opposite each other, meaning that they are negatively correlated. Forest is also the natural variable closest to plot intersections, hence the less distinct or least differentiated condition in the data, while ‘sea’ is at the other end of the scale. By looking at the site proximity to specific variables and their mentioned clustering, the LBA sites seem to be closer to ‘finds’, ‘fresh water’, ‘wetland’, and ‘dry grazing’ than earlier sites, while the opposite seems to hold for ‘sea’, ‘rock art’, and ‘grave context’, which are closer to the LN/EBA sites. However, these two plots are symmetrical, meaning that although their distributions are based on exactly the same information, they are not defined by each other but obtained from different spaces in the data. The strength of these above observations needs to be evaluated more closely.
STAGE TWO
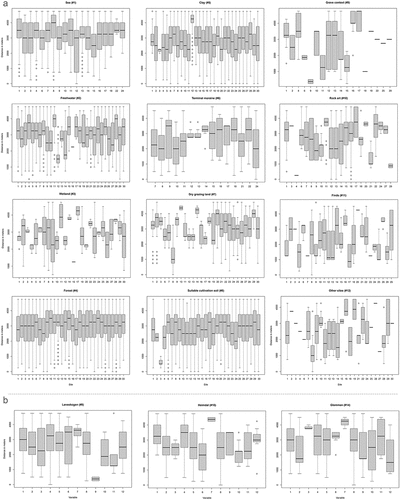
At an overall level, the box plots of the variables () support the tendency of more variance between the younger settlement locations. If the variables are collected at site level, the temporal trend between sites becomes more pronounced (). Here, the settlements dating to the LN and earliest part of the EBA are wider, accounting for a broader variable composition and are generally closer to the natural variables, albeit with individual differences possibly reflecting some variance in environmental setting, also between those that are relatively close such as Nordby and Løveskogen, while later in the BA the location becomes narrower. At an overall level, the distance measurements of the data provided by the developed method, as visualised in the boxplot presentations, also support the tendency of LN and EBA sites situated closer to the sea than those from LBA.
Fig. 8. Box plots of variables structured in running order after site IDs (a), with examples of box plots of all variables collected according to sites (b) to demonstrate the wide–narrow tendency in site location over time.
While the CA plot indicated a clustering of certain sites around the variable ‘clay’, an evaluation of the box plots demonstrates that most sites have a rather similar distance to this variable. Individual site box plots of the relevant sites (available in the online repository) make evident that while ‘clay’ is the dominating variable at these sites, they also have other similarities, all with the strong presence of ‘suitable agricultural soil’, but also with regard to what is lacking. Both Nordre Moer and Huseby do not have the presence of ‘sea’, while Holstad only has this in low numbers and in the outer part of the analysed zone. This demonstrates the importance of this second stage of the analysis, and that the above interrelating interpretations need to be treated with care and double-checked by returning to the raw data (Shennan Citation1997, pp. 323–324).
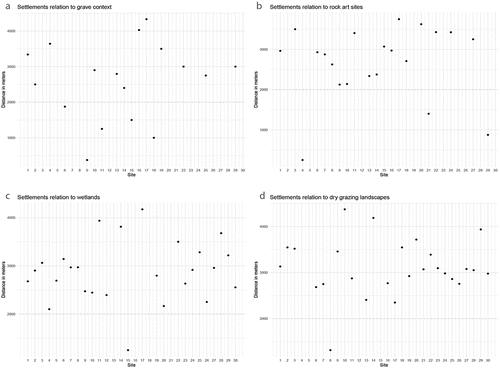
Contrasting previous studies from other regions in southern Scandinavia, ‘grave context’ seldom appears within that distance from the sites in southeast Norway. Here, graves appear, on average, in the outer parts of the analysed zones () if present within 5 km of the site at all ()Footnote1. As the correspondences plot indicates, there is a stronger connection between grave context and sites dated to the LBA or the latter part of the EBA, whereas an in-depth analysis of the data reveals that graves, in the few cases where they occur within 1–2 km of the sites, are most often associated with sites dated to EBA I–III. However, due to many of the sites’ wide-ranging dates, as well as the rather coarse dating of the graves within periods, e.g., to the BA and not necessarily to a specified sub-period, any temporal discussions of the correlation between sites and graves must be treated with caution. The results do nevertheless portray a tendency on distances, which I hypothesise could be meaningful. This is even more pronounced in distance relation between settlements and ‘rock art’ sites () but is also evident in both ‘dry grazing’ landscape and ‘wetlands’ (). On average, however, such calculations are only meaningful if the point count is relatively low, which is the case for the above variables. A similar calculation would be less suitable when variables are counted by the hundreds, such as ‘sea’, ‘forest’, and ‘clay’ (see, e.g., ).
Fig. 9. Average distance relations between settlement sites and grave context (a), rock art sites (b), wetlands (c), and dry grazing landscapes (d). Based on the results, I suggest the presence of meaningful distances between the settlement and these variables, possibly at around 2 km. There might also be a temporal shift evident in the distance between settlements and graves.
The variable ‘fresh water’ on the other hand is generally present within 1 km of the sites, some a bit closer, although seldomly statistically significant before 750–1250 m, or further away. As pointed out in the first stage of the analysis, there is a somewhat stronger correlation between fresh water and later sites compared with earlier ones. To evaluate the strength of these observations, I have checked statistics by returning to the original point dataset, confirming the above chronological tendency. Although vital to life, it is also preferred to maintain a certain distance from water so as to avoid flooding events in rivers brought on by heavy rainfalls or snowmelts. The statistical presence of fresh water 1 km or more from the sites could also reflect a deliberate or meaningful distance, such as people being aware of flooding possibilities and taking precautions. Following these results further, it is worth pointing out that even though 750–1250 m could be counted as a rather manageable walking distance, carrying water for daily use for both humans and animals is historically regarded as one of the heaviest tasks connected with farm work (Weiser-Aall Citation1953, see also Østigård Citation2021, pp. 89–90). Seeking measures to avoid transporting water over this distance was likely necessary, for instance by digging wells. I have therefore checked available data on groundwater levelsFootnote2, hence moving on to an evaluation of some on-site variables as locational features.
ON-SITE VARIABLES
The groundwater level stations corresponding rather directly with selected sites had levels between 0 and −1 m, while those situated 10–20 km from the sites mostly fell between −1 to −3 m. Although levels around the latter seem to be rather average for most stations in southeast Norway, some had levels at −3 or more, even as much as −12 m. A type of archaeological structure commonly recognised at excavations within MCH administrative areas, but seldom further dealt with, is varying embedments referred to as ’pit unknown function’ (nedgravning ukjent funksjon). Although unlikely homogeneous, some could have been drinking pools or water pits, functioning as sort of groundwater wells (see also Arnoldussen Citation2008, p. 264). High groundwater levels could therefore have been a decisive factor when settling somewhere, to ensure the water needed on-site (e.g., for drinking or cultivation practices), while fresh water available in rivers and lakes was sought after more secondarily, i.e., due to its affordances of rich varieties of lacustrine resources. The tendency to compensate for no access to the sea with a generally closer connection to fresh water in the data supports this interpretation.
Other on-site variables of importance, as pointed out by previous research, are soil conditions and slope aspects. Based on information available in excavation reports and DEM, the LN and BA settlement sites in southeast Norway were most often placed on drainable sandy soil (57%, n = 17), at the juncture or close to clay (26.5%, n = 8), and preferably on a south-facing slope (70%, n = 21). No sites were situated facing directly north, but 13.5% faced northeast/northwest (n = 4) and 16.5% west or east (n = 5). There are no distinct differences between the on-site variables in time or space.
DISCUSSION
At a more general level, the study has demonstrated more variance in settlement locations between sites dating to the LBA, but also that individual site variable compositions are narrower for these younger sites compared with those from the LN and EBA, which are wider and have a more general presence of all variables. This temporal difference between wider and narrower settlement locations could be the expression of changing economies, at least at a domestic, subsistence level, but which again is likely intertwined with social, ritual, and political sides of society (Earle and Kristiansen Citation2010, p. 15). In the following, I will further delve into some of these differences more thematically, exploring affordances around the settlement locations, while drawing on wider archaeological material for both biofacts and artefacts.
IN THE FOREST
Regardless of temporal and spatial settings, the results demonstrate that sites are most closely connected to the forest, and data on distances indicates that they were located within a forest environment, as also suggested by studies of pollen and wood charcoal records (e.g., Høeg Citation2003, Citation2021, Mjærum et al. Citation2022, p. 697). Based on the fact that the radiocarbon dated charcoal from the selected sites is heavily dominated by deciduous treesFootnote3, and following the principle of least effort (Shackleton and Prins Citation1992), it is likely that the surrounding forests were deciduous (see also Wieckowska-Lüth et al. Citation2017, Høeg et al. Citation2019). This is not to say that the woodlands in the region were homogenous, but more that particular forest assemblages were sought after when settling down.
Because a forest is likely to become denser and more homogenous further away from watercourses (Noble Citation2017, p. 78), the close connection between forest and fresh water, and the relative set distance between settlement and fresh water at around 1 km, also supports the idea that particular woodland environment were sought after, hence directly exemplifying how different landscape factors could have been weighed up when deciding where to settle. Although scant, pollen data confirm that several sites were situated within a forest landscape, in which agricultural indicators are also generally low (Høeg Citation2003, Citation2021). Both oak and hazel, which are common species in the wood material in this study and in the periods in general across southern Norway (Mjærum et al. Citation2022), have also been suggested as indicators of more open woodlands (Vera and Vera Citation2000, Eriksson et al. Citation2002, p. 745).
These empirical data could point towards how people sought out the more open or lighter parts of the forest when settling down in a landscape generally dominated by woodland, with all the affordances of a forest nearby. Although most archaeologists agree that timber was an important raw material throughout prehistory, wood and woodlands nevertheless rarely figure in their minds (Noble Citation2017, p. 3). In the following sections, I will attempt to draw attention to how some different affordances of a forest, as a major part of the environment people experienced, must have influenced LN/BA life in southeast Norway significantly.
From Small-Scale Forest Farming to Agricultural Growth
Prior to the massive third millennium deforestations in Denmark, it has been suggested that the initial systems of farming in Denmark were closely adapted to a forest environment (Madsen and Jensen Citation1982, p. 84), something which could be relevant when exploring the affordances of the forest environment in southeast Norway as well. Although anthropogenic effects become more evident in southeast Norway from the LN, indicating some degree of deforestation (Wieckowska-Lüth et al. Citation2017, Citation2018, Mjærum et al. Citation2022), they are far from as extensive as further south (e.g., Ling et al. Citation2018). Moreover, they can seldom be set in connection with the establishment of permanent pastures and major cultivation practices (Wieckowska-Lüth et al. Citation2017, 1939). Although scant evidence of crop cultivation exists from c.2200–2000 BCE in southeast Norway, data on cereal grains and fossil tilled soils demonstrated that agriculture first started to grow c.1800 BCE but not extensively. What is suggested for the LN–EBA, then, is a farming practice consisting of more long-lasting, small-scale field systems, as is also evident in the long sedentary tendencies of the settlement data (Sand-Eriksen and Mjærum Citation2023). This is further suggested not to be in compliance with what is to be expected of slash-and-burn farming (see also Bogaard Citation2002, Gron and Rowley-Conwy Citation2017). Based on the results of this study, I want to suggest that such small-scale field systems could have been reliant on a forest ecology rather than getting rid of it, hence echoing the proposal for the initial farming systems in Denmark at the beginning of this section.
To support this, similar ranges of isotopic values in grains and wood charcoal, indicating that cereals and trees grew in the same soil (see e.g., Bishop et al. Citation2022, p. 6), could, for example, demonstrate that forests were a fully integrated part of the farming landscape, as suggested elsewhere (Mjærum et al. Citation2022, p. 697), and hence indicate some level of agroforestry. If we take into account that experiments on sustainable and regenerative farming show incredible results in the usage of tree debris and droppings as ‘green manure’ (e.g., Monbiot Citation2022, p. 111), where an agroforestry system increases crop yields (Bertrand and Roberts Citation2022), we might, I argue, be on to a possible forest-specific adaptation of cultivation – at least in particular areas and climates.
To cause leaves to quickly decompose and provide CO2, humidity is required. The usage of tree debris would therefore be reliant on regular rainfall, which would be the case in Norway. Through utilisation of ‘green manure’, the experiments show surprisingly long-lasting, fertile fields, where no other soil additives are needed. In southeast Norway there is no evidence of additives (e.g., manure) to improve soil conditions dating to the LN and EBA, and this is argued to have first been introduced at around c.1000 BCE, but not fully implemented before the turn to the Iron Age around 500 BCE (Mjærum Citation2020). Other studies also show that the soils used in the initial farming phases were sufficiently productive, with no additional fertilisers needed (Bishop et al. Citation2022, pp. 4–5). As that same study showed that cereals and trees grew in the same soil, perhaps this was due to the agriculture being reliant on a forest ecology, leaving the soils sufficiently fertile until more extensive forms of cultivation were needed. Based on the changes in site location variables in this study, I suggest that we see a slow intensification from 1500 BCE in southeast Norway, as visible in the stronger relation between settlement sites and clay from c.1500 BCE onwards. Compared with sandy soils, which warm up and cool down quickly, clay or loamy soil tends to hold heat longer (Olausson Citation1992, p. 271), hence affording the possibility of elongating the growing season of cereals, something that would have been crucial when attempting to intensify agriculture in colder environments.
Data on cereal grains dated to the LN-BA from southeast Norway are limited (n = 102, retrieved from Solheim Citation2021). An assessment of them nevertheless show that barley (Hordeum vulgare) dominates throughout all periods. However, there is a wider spectrum of crops (including naked barley (Hordeum vulgare var. nudum), oats (Avena), and different types of wheat (Triticum), e.g., spelt, emmer, and bread wheat, but mostly as single or few finds) in the earlier LN–EBA phases before barley more or less became the sole crop type from the end of the EBA and during the LBA. The trend thus echoes that of southern Scandinavia, although demonstrating a somewhat reduced spectrum of crops throughout the BA, as has been pointed out also to be the case for northern Bohuslän compared with the more fertile regions further south in Sweden as well (Vretemark Citation2010, p. 164). Since southernmost Scandinavia has a slightly longer growing season, and hence the possibility of a later harvest than most parts of southeast Norway (Moen Citation1999, p. 21), this could mean that existed a more distinct summer–winter economic system existed in southeast Norway compared with further south, which likely would call for a stronger need for a mixed economic orientation (see also Wehlin et al. Citation2023) than we often give due credit. While this necessarily is a result of agriculture being more present than simply traces of wild plant gathering or even tending, our lack of understanding of a more mixed mode of production could also be a result of some level of ‘plant blindness’ (Sandilands Citation2021), not only in how plants tend to receive less attention than animals (Wandersee and Schussler Citation1999), but also between plants, in which we focus more on the domesticated species than the wild ones.
Winter Hunting and Other Human–Animal Relations
A change to autumn and perhaps even more so to winter could actually affect hunting positively; the hunter could see game much further away due to the lack of foliage, but also trace and track animals more easily in the presence of snow. While game would be slimmer, changes in fur compositions for greater insulation during winter could have been sought after. These changes also differentiate between species, where fur on some becomes thicker, denser and longer, while others become more fatty (Eriksson et al. Citation1986, p. 50). Hide, pelts, and furs are often hypothesised as important tradable goods exported from Norway during the LN and BA (e.g., Ling et al. Citation2018, with reponses), and hunting of large game in mountains or inland regions is well studied in Norway (e.g., Nesje et al. Citation2011, Olsen Citation2020, Post-Melby and Bergstøl Citation2020). Comparatively, we have less knowledge of the lowland hunting activities, which perhaps were connected to the more daily routines in the vicinity of the settlements.
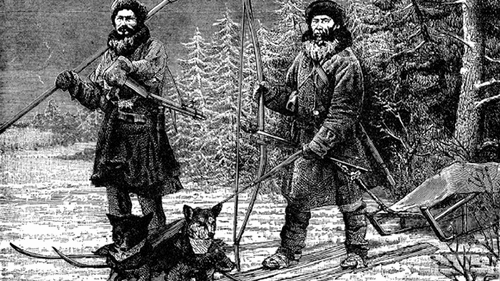
The lowland hunting would to a greater extent have included smaller game than for instance reindeer and elk, although the latter can be encountered in large parts of southeast Norway, as can roe deer. During winter the landscape can also become locked in ice, with lakes and wetlands more easily traversed – representing just one of the many possible new affordances snow and ice bring to the landscape (Olsen Citation2014, p. 18). These snow-covered landscapes would in many cases make it easier to transport game, particularly if using sleds (). Perhaps even more importantly, winter would also have afforded LN/BA people the possibility of more long-time storage of meat through freezing (e.g., Cummings Citation2013, p. 15). I suggest that hunting, with associated activities, in the lowland and forest could have been a wintertime activity, supplementing hunting and trapping of big game in the mountains and inland during autumn, as well as the agro-pastoral modes of production connected to the summer season of the year.
Fig. 10. The winter hunters. Using skis and sled to move around effectively in the snowy landscape, perhaps even utilising the snow to track down prey. Moreover, the colder temperatures would also aid in storing and preserving food (public domain).
Although the archaeological record to directly support this is scant, mainly consisting of a single or a few bifacial arrowheads and tens to a hundred small pieces of unidentifiable or partially identifiable (e.g., ‘mammal’ or ‘ungulate’) burnt faunal remain at the individual sites, there is a distinct artefact type that could be connected to hunting activities. The Nøklegård pointsFootnote4 are small bifacially produced LN–EBA drilling tools used to perforate and carve bones and antlers, but they are also interpreted as tools used to maintain complex traps for small game (Jaksland and Bugge Citation2012, pp. 224–226), and suggested to be a unique south Norwegian artefact (Nyland et al. Citation2023, p. 12). Although recognised at settlement sites in part of this study as well, such as Løveskogen in Vestfold, they are mainly found at sites dug with the assumption of being costal Mesolithic sites, but which in fact were LN–BA ‘outland’ sites. Most of them are situated in the vicinity of the studied settlement sites, several within the 5 km zone, hence supporting early suggestions of these sites as camps or stations connected to a more sedentary settlement (Østmo Citation1993, Fossum Citation2014), and demonstrating how becoming more sedentary does not mean that mobility necessarily is renounced.
Moreover, hunters would also encounter completely different animals in the lowland compared with the uplands, such as beavers (Castor fibre), remains of which have been identified at two of the settlement sites. Beavers are mainly hunted for their fur, meat, tails, claws, teeth, and fats (e.g., Bondetti et al. Citation2021, p. 9), but are also often just observed by humans for their exceptional environmental engineering (Hjørungdal Citation2019, p. 60). The most obvious example could be to do exactly like the beavers – to build dams – for example, the ability to float timber in smaller rivers through gathering up of water from snowmelt or spring thaw, as is known from historical sources (Kaldal Citation2022, p. 155). Prehistory must have been full of such complex and multidimensional human–animal relationships, which archaeology holds the potential to tell (Oma Citation2018, pp. 10–11). The presence of beaver remains at these settlement sites might indicate the presence of a wider way of living with animals that is not as one-way as human–animal relations are often considered (Ingold Citation1994, Haraway Citation2008). Another such multidimensional relation visible in the settlement material could have been with pigs/boars (Sus scrofa), which also have deciduous or mixed woodlands as their natural habitat, and which existed naturally in Norway during the BA (Rosvold et al. Citation2010).
Even though the faunal assemblages from southeast Norway dating to the LN–BA are of limited potential, pigs are one of the species most often identified, although we do not know whether they were wild or domesticated (as this is inherently hard to decide, see e.g., Rowley-Conwy et al. Citation2012). This does not necessarily matter, as there are studies (e.g., Maring and Riede Citation2019) that demonstrate how this conventional division into ‘wild’ and ‘domestic’ pigs may be an oversimplification (Rowley-Conwy and Dobney Citation2007, p. 6). Pigs are, I argue, animals whose relation to humans could have been rather complex, perhaps even mutualistic. As opportunistic feeders and committed omnivores, pigs will browse for shoots and fruit, and dig for roots within the forest, but also eat the faeces of other animals, including humans, and scavenge meat. This ability to eat anything has been suggested as an initial cause of the domestication process (Clutton-Brock Citation2012, p. 90), where pigs initially sought out human settlements for easy food access. A reason for this could be changes in the natural environment of wild boars as a response to human interference. As highly adaptable beings, it could have been the wild boars’ own optimal foraging strategy leading to domestication, and not necessarily humans actively seeking out and capturing boars to keep. Humans could, however, very well have encouraged further wild boar opportunistic visits – e.g., to handle their settlement waste. With changes in conditions, such as humans settling more permanently in the woodlands, the wild boars had to respond, resulting in a reinforcing mutualistic relationship between humans and pigs, created in the sweet spot between an optimal foraging strategy and niche construction (e.g., Stiner and Kuhn Citation2016).
THE PRESENCE OF SOME MEANINGFUL DISTANCES AND PLACES
If we are to move out from the forest realm, the results from the study also demonstrated a strong correlation between the sea and the cultural variables, as well as a stronger connection between the sea and sites prior to 1500 BCE. Sites younger than 1500 BCE, do, on the other hand, have a stronger connection to the cultural variables. The LN/BA sites, then, have a twofold relationship to the sea, which I interpret as a reflection of a particular shift in the use of the landscape during the BA. During the LN–BA I, the sites are more directly connected to the sea, but this becomes more indirect later in the BA. This could indicate a more mixed economic orientation in the LN and earliest parts of the BA, for example to include fishing (also see e.g., Nielsen et al. Citation2023), while the LBA settlements’ relationship to the sea via graves and rock art sites could reflect how the sea became of more indirect economic importance. This may, for instance, be related to how rock art sites, which are so strongly correlated to the sea, are interpreted as different loci for interaction (Ling Citation2005, p. 453), such as ports of exchange, but also seasonal meeting grounds, and/or ritual, social, and political arenas (see also Goldhahn and Ling Citation2013, Melheim and Sand-Eriksen Citation2020). Although only speculative, as more detailed studies of such sites including palaeoecological sources are neede, it could be that traces of deforestation and clearing were also done in relation to highlighting areas with mounds and/or rock art. The creation of open spaces around them would alter both visual and aural qualities of these places, which in a landscape dominated by woodlands would have made the place particularly significant (Bogaard and Jones Citation2007, Noble Citation2017).
As permanent features of the landscape, both rock art sites and mounds also encompass a certain temporality, and are part of, in the words of Ingold (Citation1993, p. 153), ‘an environment that is itself pregnant with the past’. As such, they contain and conserve cultural memory within the landscape (see e.g., Brink Citation2008, Lund and Arwill-Nordenbladh Citation2016). Most sites where graves were situated within the vicinity of 1–2 km from the site () are dated to EBA I–III, which is in compliance with the general idea of intensified barrow construction between 1500 and 1100 BCE in Scandinavia (Holst et al. Citation2013). From the end of the EBA and throughout the LBA, on the other hand, people seem to have put more distance between themselves and graves. While it is commonly agreed that mounds signal significance, there is no real consensus on whether they represent the centre of a territory and its boundaries (Olausson Citation1992, for different takes, see e.g., Johansen et al. Citation2004, Kristiansen Citation2010). Perhaps the differing relations between settlement and graves over time, made evident in this study, demonstrate a shift in what they represent and hence how people related to mounds in the long term?
Even though burial practices change, with cremation being introduced and becoming dominant from around BA III–IV (Harding Citation2000, p. 11), mounds are, as already mentioned, still part of the landscape and hence part of people’s life in later periods. Therefore, the results of the analysis could reflect the process of how mounds first mark a centre, whereas the later and greater distance to the graves could reflect how they are turned into boundaries. This demonstrates one of the strengths of the developed method, where its ability to provide data on distances through the point grid can give insight into social factors and arrangements in a territory. The point data could, for example, be reassessed with the ambition of addressing ordering of the landscape. A simple reading of the data, such as demonstrated in , indicates that while rock art sites have a generally southward orientation, grave contexts are equally often oriented northward of the settlements. While any confirmation of such interpretations would call for a more thorough analysis of the data, which is outside the scope of this paper, it indicates the likelihood of different zones in the landscape surrounding the sites (e.g., Morter and Robb Citation1998).
CONCLUDING REMARKS
Through the developed method this paper set out to examine what conditions made LN/BA people settle down, and through the analysis to explore the where and the why behind the settlement locations in southeast Norway. Although the results of the study align with several criteria outlined in previous research, it has also revealed some temporal and spatial differences of significance, with some suggested changing human–environmental engagements and land-use patterns over time. In the LN and earliest parts of the EBA, people lived closer to the sea than in later periods, while clay, as a material and economic resource, played a more decisive role later in the BA, possibly related to the presence of a more intensive mode of cultivation and the introduction of the wattle-and-daub building technique. At an overarching level, the composition of the variables is wide during the LN/EBA, meaning that all or most of them are present within 5 km of the site, while during the LBA the composition becomes narrower, with certain variables more scantily present or completely absent within the analysed area. This temporal trend indicates some sort of economic change, I argue, such as the aforementioned agricultural intensification towards the latter part of the EBA and the LBA, while the prior periods were more reliant on a mixed economic subsistence.
A reliance on different occupational practices than is generally associated with the BA is also supported in the most notable, but perhaps not that surprising result from this study, namely the settlements’ close relation to the forest. Based on the results of this study and the examples of woodland affordances, it become evident that the LN/BA people in southeast Norway lived in and close to the forest. Through applying a seasonal aspect, I have also attempted to bring winter out of hibernation. It has been argued that archaeologists have a tendency to present winter as an anomaly, making it marginal in our research (Olsen Citation2014, p. 14). Winter makes up a significant part of the year in this part of southern Scandinavia, and by not including it in our research, we are missing out on large parts of past people’s lives. So, if I am to return to the opening statement, then, which as it stands is strongly aimed towards the existence of a BA society rooted in agriculture, the results of this study and the highly seasonal affordances of the woodland demonstrate the likelihood of an equally strong reliance on other occupational practices, such as hunting, fishing, and gathering, albeit with some differences between the EBA and LBA.
Based on the results of the grave context generally found in the outer parts of the analysed zones, and only a relatively low number within 1 km of the settlements and then mainly within the EBA, the social organisation existing in southeast Norway during the LN/BA does not seem to be equally reliant on a similarly tight relationship between settlements and mounds as demonstrated for other parts of southern Scandinavia. The temporal change, however, with BA I–III sites situated slightly closer to the grave context than later sites, is something I see as meaningful. To my knowledge, traditional studies of catchment areas do not address the possibilities of such meaningful distances, and the latter is something I regard as an advantage of the developed method and the quantitative variable analysis of the study.
Acknowledgements
The author would like to thank all who have commented on oral and written presentationson different parts of the paper during conferences and seminars, which has been highly valuable for exploring ideas presented in the paper. Thanks are also due to Mark Haughton, who provided very helpful comments on an earlier draft, and Isak Roalkvam for comments on the method and help with R, as well as Justin Kimball for proofreading the text. Lastly, thanks are offered to the editor and the two anonymous reviewers for insightful and thorough comments that helped improve the manuscript greatly. Any errors and deficiencies remain entirely the author’s own.
Disclosure statement
No potential conflict of interest was reported by the author.
Correction Statement
This article was originally published with errors, which have now been corrected in the online version. Please see Correction (http://dx.doi.org/10.1080/00293652.2023.2302234)
Notes
1 To account for the possibility of mounds being, for example, ploughed away, I have looked for likely traces of grave goods within the find category (see online repository for details). Among these finds, there are a few cases of possible high-status objects or what is typically associated with grave goods, of which there could be one ‘grave context’ within 1 km of the site Arctander in Agder, while the other possible occurrences are situated in the other parts of the analysed zone.
2 Groundwater level stations available from: https://sildre.nve.no/
3 Around 70% of the dates (n = 213) during which birch (Betula, n = 85), hazel (Corylus, n = 26), and oak (Quercus, n = 20) are most common. This tendency is also supported by the general trend within all determined wood charcoal from the excavations (most external scientific reports should be enclosed or mentioned in the excavation reports, available from duo.uio.no).
4 183 Nøklegård points from southeast Norway are listed in Unimus (February 2023) The artefact type is only searchable in archaeological records from 2004, so hidden statistics are likely. The type has, for instance, been recognised in material predating the Nøklegård excavation, but is not formalised in the database. For example, at both Sandtrahelleren and Løve Øvre (ID77378 and ID100762 in Askeladden respectively, Mjærum personal communication), both of which are situated less than 1.5 km from the Løveskogen settlement site.
REFERENCES
- Ambrosiani, B., 1964. Fornlämningar och bebyggelse. Stockholm: Kungliga vitenhets historie och antikvitets akademien.
- Arnoldussen, S., 2008. A living landscape. Bronze age settlement sites in the Dutch river area (c. 2000-800 BC). Leiden: Sidestone Press.
- Artursson, M., 2009. Bebyggelse och samhällsstruktur. Södra och mellersta Skandinavien under senneolitikum och bronsålder 2300-500 f.Kr. Gothenburg: Riksantikvarieämbetet.
- Bertrand, S., and Roberts, A.S. 2022. Adding trees to farms can mitigate climate change and increase Resilience. Environmental and Energy Study Institute [online]. https://www.eesi.org/articles/view/adding-trees-to-farms-can-mitigate-climate-change-and-increase-resilience. [Accessed 27 July 2023].
- Bishop, R.R., et al., 2022. Scotland’s first farmers: new insights into early farming practices in North-west Europe. Antiquity, 98 (389), 1–18. doi:10.15184/aqy.2022.107.
- Bogaard, A., 2002. Questioning the relevance of shifting cultivation to Neolithic farming in the loess belt of Europe: evidence from the Hambach Forest experiment. Vegetation History and Archaeobotany, 11 (1–2), 155–168. doi:10.1007/s003340200017.
- Bogaard, A., and Jones, G., 2007. Neolithic farming in Britain and central Europe: contrast or continuity? In: A. Whittle and V. Cummings, eds. Going over: the mesolithic-neolithic transition in north-west Europe. London: British Academy, pp. 357–375.
- Bondetti, M., et al., 2021. Neolithic farmers or Neolithic foragers? Organic residue analysis of early pottery from Rakushechny Yar on the Lower Don (Russia). Archaeological and Anthropological Sciences, 13 (141), 1–16. doi:10.1007/s12520-021-01412-2.
- Bradley, R., 1991. Rock art and the perception of landscape. Cambridge Archaeological Journal, 1 (1), 77–101. doi:10.1017/S0959774300000263.
- Brink, S., 2008. Landskap och plats som mentala konstruktioner. In: K. Chilidis, J. Lund, and C. Prescott, eds. Facets of archeology. Essays in honour of Lotte Hedeager on her 60th Birthday. Oslo: UniPub, pp. 109–120.
- Clutton-Brock, J., 2012. Animals as domesticates. A world view through history. East Lansing, Mich: Michigan State University Press.
- Cummings, V., 2013. The anthropology of hunter-gatherers : key themes for archaeologists. London: Bloomsbury Academic.
- Earle, T., and Kristiansen, K., 2010. Introduction: theory and practice in the late prehistory of Europe. In: T. Earle and K. Kristiansen, eds. Organizing bronze age societies. Cambridge: Cambridge University Press, pp. 1–33.
- Eriksson, O., Cousins, S.A.O., and Bruun, H.H., 2002. Land-use history and fragmentation of traditionally managed grasslands in Scandinavia. Journal of Vegetation Science, 13 (5), 743–748. doi:10.1111/j.1654-1103.2002.tb02102.x.
- Eriksson, S., Wallentinus, H.-G., and Røe, K., 1986. Naturen om vinteren. Oslo: Cappelen.
- Eve, S.J., and Crema, E.R., 2014. A house with a view? multi-model inference, visibility fields, and point process analysis of a bronze age settlement on Leskernick Hill (Cornwall, UK). Journal of Archaeological Science, 43, 267–277. doi:10.1016/j.jas.2013.12.019
- Fossum, G., 2014. Solum 2 og Solum 3. Lokaliteter med Nøklegårdspisser fra senneolitikum/eldre bronsealder. In: G. Reitan and P. Persson, eds. Vestfoldbaneprosjektet. Arkeologiske undersøkelser i forbindelse med ny jernbane mellom Larvik og Porsgrunn. Bind 2. Seinmesolittiske, neolittiske og yngre lokaliteter i Vestfold og Telemark. Oslo: Portal forlag and Museum of Cultural History, University of Oslo, pp. 256–278. 10.23865/noasp.62.
- Gaffney, V., and Stančič, Z., 1991. GIS approaches to regional analysis: a case study of the island of Hvar. Ljubljana: Znanstveni institut Filozofske fakultete.
- Gibson, J.J., 1979. The ecological approach to visual perception. Hillsdale, N.J: Lawrence Erlbaum.
- Gillings, M., 2009. Visual affordance, landscape, and the megaliths of Alderney. Oxford Journal of Archaeology, 28 (4), 335–356. doi:10.1111/j.1468-0092.2009.00332.x.
- Gillings, M., 2012. Landscape phenomenology, GIS and the role of Affordance. Journal of Archaeological Method and Theory, 19 (4), 601–611. doi:10.1007/s10816-012-9137-4.
- Gjerde, J.M., 2002. Lokalisering av helleristninger i landskapet. In: J. Goldhahn, ed. Bilder av bronsålder - ett seminarium om förhistorisk kommunikation. Rapport från ett seminarium på Vitlycke Museum 19.e-22.e oktober 2000. Stockholm: Almqvist & Wiksell, pp. 23–51.
- Goldhahn, J., and Ling, J., 2013. Bronze age rock art in Northern Europe: contexts and interpretations. In: A. Harding and H. Fokkens, eds. The oxford handbook of the European bronze age. Oxford: Oxford University Press, pp. 270–290. 10.1093/oxfordhb/9780199572861.013.0015.
- Grimsrud, O., 1999. Rapport fra utgravning av boplasspor på Arctander, Bryne 21/242, 244 og 253, Farsund kommune, Vest-Agder. Museum of Cultural History, University of Oslo. http://urn.nb.no/URN:NBN:no-80931.
- Gron, K.J., and Rowley-Conwy, P., 2017. Herbivore diets and the anthropogenic environment of early farming in southern Scandinavia. The Holocene, 27 (1), 98–109. doi:10.1177/0959683616652705.
- Hamilton, S., et al., 2006. Phenomenology in practice: towards a methodology for a ‘subjective’ approach. European Journal of Archaeology, 9 (1), 31–71. doi:10.1177/1461957107077704.
- Haraway, D.J., 2008. When species meet. Minneapolis: University of Minnesota Press.
- Harding, A.F., 2000. European societies in the Bronze Age. Cambridge: Cambridge University Press.
- Hauge, S., 2007. Symbolsk alkymisme. Maktrelasjoner i bronsealderen i Farsund og Lyngdal. Master's Thesis, University of Oslo, Oslo. http://hdl.handle.net/10852/23155.
- Heidegger, M., 1962. Being and Time. Oxford: Blackwell.
- Heras-Escribano, M., and De Pinedo-García, M., 2018. Affordances and landscapes: overcoming the Nature–Culture Dichotomy through niche construction theory. Frontiers in Psychology, 8, 1–15. doi:10.3389/fpsyg.2017.02294
- Hjørungdal, T., 2019. Arkeologen möter bävern. Aspekter på en ambivalent bekantskap. In Situ Archaeologica, 13, 55–80. doi:10.58323/insi.v13.12637
- Høeg, H.I., 2003. Pollenanalytiske undersøkelser a liten myr og rydningsrøys på boplass Torpum 9 samt gammelåkerlag på Stensrød. In: H. Glørstad, ed. Svinesundprosjektet bind 2. Utgravninger avsluttet i 2002. Oslo: Museum of Cultural History, University of Oslo, pp. 331–346.
- Høeg, H.I., 2021. Standard pollendiagram for Tjølling, Larvik, Vestfold. In: A. Sand-Eriksen and Mjærum, A. eds., Rapport fra arkeologisk utgravning: Boplass fra seinneolitikum og eldre bronsealder. Løve Mellom 1045/226, Larvik kommune, Vesfold og Telemark. Excavation report. Oslo:Museum of Cultural History, University of Oslo, pp. 106–110.
- Høeg, H.I., Henningsmoen, K.E., and Sørensen, R., 2019. Utviklingen av sen-glasial og holocen vegetasjon på Sørøstlandet, presentert i et 14C-datert standard pollendiagram. Blyttia, 77 (2), 103–115.
- Holst, M.K., et al., 2013. Bronze age ‘herostrats’: ritual, political, and Domestic Economies in early bronze age Denmark. Proceedings of the Prehistoric Society, 79, 265–296. doi:10.1017/ppr.2013.14.
- Ingold, T., 1992. Culture and the perception of the environment. In: E. Croll and D. Bush, eds. Bush base, forest farm. culture, environment and development. London: Routledge, pp. 39–56.
- Ingold, T., 1993. The temporality of the landscape. World Archaeology, 25 (2), 152–174. doi:10.1080/00438243.1993.9980235.
- Ingold, T., 1994. Introduction. In: T. Ingold, ed. What is an animal?. London: Routledge, pp. 1–17. 10.1016/B978-1-85617-198-4.50004-7.
- Ingold, T., 2000. The perception of the environment. Essays on livelihood, dwelling and skill. London: Routledge.
- Ingold, T., 2007. Earth, sky, wind, and weather. The Journal of the Royal Anthropological Institute, 13 (s1), S19–S38. doi:10.1111/j.1467-9655.2007.00401.x.
- Jaksland, L., and Bugge, M.K., 2012. Nøklegård 1 - Lokalitet fra senneolitikum. In: L. Jaksland, ed. E18 Brunlanesprosjektet Bind III. Undersøkte lokaliteter fra tidligneolitkum og senere. Oslo: Museum of Cultural History, pp. 199–228.
- Jerpåsen, G.B., 2009. Application of visual archaeological landscape analysis: some results. Norwegian Archaeological Review, 42 (2), 123–145. doi:10.1080/00293650903351052.
- Johansen, E., 1956. Landskapet og den eldste historien. In: L. Opstad, ed. Rygge. Bind II. Bygdehistorie inntil 1800. Moss: Rygge Sparebank, pp. 7–151.
- Johansen, K.L., Laursen, S.T., and Kähler, M.H., 2004. Spatial patterns of social organization in the early bronze age of South Scandinavia. Journal of Anthropological Archaeology, 23 (1), 33–55. doi:10.1016/j.jaa.2003.10.002.
- Johnson, M.H., 2012. Phenomenological approaches in landscape archaeology. Annual Review of Anthropology, 41 (1), 269–284. doi:10.1146/annurev-anthro-092611-145840.
- Jones, M., 2007. Seasonality and landscape in Northern Europe: an introductory exploration. In: H. Palang, H. Sooväli, and A. Printsmann, eds. Seasonal landscapes. Dordrecht: Springer Netherlands, pp. 17–60. 10.1007/1-4020-4990-0_2.
- Kaldal, I., 2022. Skogens menn. Minner og myter om hoggere og fløtere. Oslo: Aschehoug.
- Kile-Vesvik, J., 2014. Bosetning, fotgrøft og produksjonspor. Rom Vestre, Vol. 156/1, 2, p. 154, Lyngdal, Vest-Agder. Museum of Cultural History, University of Oslo. http://urn.nb.no/URN:NBN:no-58609.
- Knappett, C., 2004. The affordances of things: a Post-Gibsonian Perspectiveon the Relationality of Mind and matter. In: E. DeMarrais, C. Gosden, and C. Renfrew, eds. Rethinking materiality : the engagement of mind with the material world. Cambridge: McDonald institute for archaeological research, pp. 43–51.
- Kristiansen, K., 1978. Bebyggelse, erhvervsstrategi of arealsudnyttelse i Danmarks bronzealder. Fortid og Nutid, 27, 320–345.
- Kristiansen, K., 1998. Europe before history. Cambridge: Cambridge University Press.
- Kristiansen, K., 2006. Cosmology, economy and long-term change in the bronze age of Northern Europe. In: K.-G. Sjögren ed. Ecology and Economy in Stone Age and bronze Age scania, pp. 171–193.
- Kristiansen, K., 2010. Decentralized complexity: the case of bronze age Northern Europe. In: T.D. Price and G.M. Feinman, eds. Pathways to power. New perspectives on the emergence of social inequality. New York: Springer New York, pp. 169–192. 10.1007/978-1-4419-6300-0_7.
- Kvamme, K., 2020. Analysing regional environmental relationships. In: M. Gillings, P. Hacıgüzeller, and G. Lock, eds. Archaeological spatial analysis. A methodological Guide. London: Routledge, pp. 212–230. 10.4324/9781351243858-12.
- Lake, M.W., and Woodman, P.E., 2003. Visibility studies in archaeology: a review and case study. Environment and Planning B: Planning and Design, 30 (5), 689–707. doi:10.1068/b29122.
- Lê, S., Josse, J., and Husson, F., 2008. FactoMineR: an R package for multivariate analysis. Journal of Statistical Software, 25 (1), 1–18. doi:10.18637/jss.v025.i01.
- Ling, J., 2005. The fluidity of rock art. In: J. Goldhahn, ed. Mellan sten och järn. Rapport från det 9:e nordiska bronsålderssymposiet. Gothenburg: University of Gothenburg, pp. 437–460.
- Ling, J., Earle, T., and Kristiansen, K., 2018. Maritime mode of production: raiding and trading in seafaring chiefdoms. Current Anthropology, 59 (5), 488–524. doi:10.1086/699613.
- Llobera, M., 1996. Exploring the topography of mind: GIS, social space and archaeology. Antiquity, 70 (269), 612–622. doi:10.1017/S0003598X00083745.
- Lund, J., and Arwill-Nordenbladh, E., 2016. Divergent ways of relating to the past in the Viking Age. European Journal of Archaeology, 19 (3), 415–438. doi:10.1080/14619571.2016.1193979.
- Madsen, T., and Jensen, H.J., 1982. Settlement and land use in early neolithic Denmark. Analecta Praehistorica Leidensia, 15, 63–86.
- Maring, R., and Riede, F., 2019. Possible wild boar management during the ertebølle period. A Carbon and Nitrogen Isotope Analysis of Mesolithic wild boar from Fannerup F, Denmark. Environmental Archaeology, 24 (1), 15–27. doi:10.1080/14614103.2018.1516328.
- Melheim, A.L., and Sand-Eriksen, A., 2020. Rock art and trade networks: from Scandinavia to the Italian alps. Open Archaeology, 6 (1), 86–106. doi:10.1515/opar-2020-0101.
- Mjærum, A., 2020. The emergence of mixed farming in eastern Norway. Agricultural History Review, 68 (1), 1–21.
- Mjærum, A., Loftsgarden, K., and Solheim, S., 2022. Human-vegetation dynamics in holocene south-eastern Norway based on radiocarbon dated charcoal from archaeological excavations. The Holocene, 32 (7), 690–702. doi:10.1177/09596836221088242.
- Moen, A., 1999. National atlas of Norway: vegetation. Hønefoss: National Mapping Authority.
- Møllerop, O., 1963. Fra Rogalands eldre bronsealder. Stavanger: Stavanger Mus. Årb.
- Monbiot, G., 2022. Regenesis. London: Penguin Books.
- Morter, J., and Robb, J., 1998. Space, gender and architecture in the southern Italian Neolithic. In: R. Whitehouse, ed. Gender and Italian archaeology. Challenging the stereotypes. London: Accordia Research Institute and Institute of Archaeology, UCL, pp. 83–94.
- Nesje, A., et al., 2011. The climatic significance of artefacts related to prehistoric reindeer hunting exposed at melting ice patches in southern Norway. The Holocene, 22 (4), 485–496. doi:10.1177/0959683611425552.
- Nielsen, S.V., et al., 2023. Hunting, fishing, gardening: re-evaluating middle neolithic mobility and cultural diversity on the Norwegian skagerrak coast. Journal of Archaeological Science: Reports, 51, 51. doi:10.1016/j.jasrep.2023.104139.
- Noble, G., 2017. Woodland in the neolithic of Northern Europe. The forest as ancestor. Cambridge: Cambridge University Press.
- Nyland, A., Hofmann, D., and Iversen, R., 2023. The blurry Third Millennium. “Neolithisation” in a Norwegian context. Open Archaeology, 9 (1), 1–32. doi:10.1515/opar-2022-0287.
- Olausson, D., 1992. The archaeology of the bronze age cultural landscape – research goals, methods, and results. In: L. Larsson, J. Callmer, and B. Stjernquist, eds. The Archaeology of the Cultural Landscape. Field work and research in a south Swedish rural region. Lund: Institute of Archaeology and the Historical Museum, pp. 251–282.
- Olsen, B., 2014. A sense of snow. In: H.C. Gulløv, P.A. Toft, and C.P. Hansgaard, eds. Northern worlds – challenges and solutions. Report from workshop 2 at the national museum, 1 November 2011. Denmark: The National Museum, pp. 9–23.
- Olsen, D.E.F., 2020. Jakt og fangst på Hardangervidda og Nordfjella 4000–1500 f.Kr. Regionalitet, kulturell variasjon og sosiale endringsprosesser i neolitikum og eldre bronsealder[online]. Thesis (PhD). Bergen: University of Bergen. Available from: https://hdl.handle.net/11250/3034157. [accessed 1 November 2022].
- Oma, K.A., 2018. The sheep people: the ontology of making lives, Building Homes and forging herds in early bronze age Norway. Sheffield: Equinox Publishing Limited.
- Østigård, T., 2021. Vinter og vår i vannets verden: Arkeologi om økologi og jordbrukskosmologi. Ödeshög: Uppsala Universitet.
- Østmo, E., 1988. Etableringen av jordbrukskulturen i Østfold i steinalderen. Oslo: Universitetets Oldsakssaming.
- Østmo, E., 1991. Gård og boplass i østnorsk oldtid og middelalder. Aktuelle oppgaver for forskning og forvaltning. Oslo: Universitetets Oldsaksamling.
- Østmo, E., 1993. Hellerbosetning i østnorsk yngre steinalder. Utgravingen av Sandtrahelleren i Tjølling, Larvik, Vestfold. Universitetets Oldsaksamling Årbok 1991/1992. Oslo: Oldsakssamlingens Forsknings og publiseringskomite, pp. 87–102.
- Post-Melby, J., and Bergstøl, J., 2020. Fangstgroper og ledegjerder fra steinalder til jernalder i Elverum. In: C. Rødsrud and A. Mjærum, eds. Ingen vei utenom. Arkeologiske undersøkelser i forbindelse med etablering av ny rv. 3/25 i Løten og Elverum kommuner, Innlandet. Oslo: Cappelen Damm Akademisk, pp. 297–309.
- Prøsch-Danielsen, L., 1997. New light on the holocene shore displacement curve on Lista, the southernmost part of Norway. Norsk Geografisk Tidsskrift - Norwegian Journal of Geography, 51 (2), 83–101. doi:10.1080/00291959708552368.
- Prøsch-Danielsen, L., Prescott, C., and Holst, M.K., 2018. Economic and social zones during the late Neolithic/Early bronze age in Jæren, Southwest Norway. Reconstructing large-scale land-use patterns. Praehistorische Zeitschrift, 93 (1), 48–88. doi:10.1515/pz-2018-0002.
- Puschmann, O., 2005. Nasjonalt referansesystem for landskap. Beskrivelse av Norges 45 landskapsregioner. NIJOS rapport 10/05. Ås: Norsk institutt for jord- og skogkartlegging
- R Core Team, 2020. R: a language and environment for statistical computing. R Foundation for Statistical Computing. Available from: https://www.R-project.org/.
- Reimer, P.J., et al., 2020. The IntCal20 northern hemisphere radiocarbon age calibration curve (0–55 cal kBP). Radiocarbon, 62 (4), 725–757. doi:10.1017/RDC.2020.41.
- Reitan, G., 2008. Bosetningsspor fra yngre bronsealder, eldre- og yngre jernalder og middelalder, dyrkningsspor fra jernalder, samt produksjonsplass med esser fra eldre jernalder. Moi (Gnr.12/1,2,3,4), Bygland kommune, Aust-Agder. Museum of Cultural History, University of Oslo. http://urn.nb.no/URN:NBN:no-58975.
- Risbøl, O., Petersen, T., and Jerpåsen, G.B., 2013. Approaching a mortuary monument landscape using GIS- and ALS-Generated 3D models. International Journal of Heritage in the Digital Era, 2 (4), 509–525. doi:10.1260/2047-4970.2.4.509.
- Røberg, F., 2012a. Bosetnings- og aktivitetsspor. Larønningen, Vol. 221/2138, Skien, Telemark. Museum of Cultural History, University of Oslo. http://urn.nb.no/URN:NBN:no-58582.
- Røberg, F., 2012b. Bosetnings- og aktivitetsspor. Larønningen vest, Bybakken, Vol. 221/2/3, Skien, Telemark. Museum of Cultural History, University of Oslo. http://urn.nb.no/URN:NBN:no-58584.
- Romundset, A., Fredin, O., and Høgaas, F., 2014. A holocene sea-level curve and revised isobase map based on isolation basins from near the southern tip of Norway. Boreas, 44 (2), 383–400. doi:10.1111/bor.12105.
- Rosvold, J., et al., 2010. The rise and fall of wild boar in a northern environment: evidence from stable isotopes and subfossil finds. The Holocene, 20 (7), 1113–1121. doi:10.1177/0959683610369505.
- Rowley-Conwy, P., Albarella, U., and Dobney, K., 2012. Distinguishing wild boar from domestic pigs in prehistory: a review of approaches and recent results. Journal of World Prehistory, 25 (1), 1–44. doi:10.1007/s10963-012-9055-0.
- Rowley-Conwy, P., and Dobney, K., 2007. Wild boar and domestic pigs in mesolithic and Neolithic southern Scandinavia. In: U. Albarella, K. Dobney, A. Ervynck, and P. Rowley-Conwy, eds. Pigs and humans. 10,000 years of interaction. Oxford: Oxford University Press, pp. 131–155. 10.1093/oso/9780199207046.003.0016.
- Russ, H., 2013. Gravfelt, bosetningsområde og kokegropfelt fra romertid til vikingtid, Klepland, 73/1, 2, 3 m.fl., Søgne kommune, Vest-Agder. Museum of Cultural History, University of Oslo. http://urn.nb.no/URN:NBN:no-54709.
- Sand-Eriksen, A., and Mjærum, A., 2023. Late neolithic and early bronze age settlements and agro-pastoral developments in the Oslo Fjord area, southeastern Norway. Danish Journal of Archaeology, 12 (1), 1–28. doi:10.7146/dja.v12i1.134206.
- Sandilands, C., 2021. Plants. In: J. Cohen and S. Foote, eds. The Cambridge Companion to Environmental Humanities. Cambridge: Cambridge University Press, pp. 156–169.
- Shackleton, C., and Prins, F.E., 1992. Charcoal analysis and the “principle of least effort”—A conceptual model. Journal of Archaeological Science, 19 (6), 631–637. doi:10.1016/0305-4403(92)90033-Y.
- Shennan, S., 1997. Quantifying archaeology. 2nd ed. Edinburg: Edinburgh University Press.
- Sjöstrand, Y., 2011. Med Algen i Huvudrollen. Om Fångstgropar, Hällbilder och Skärvstensvallar i Mellersta Norrland. Stockholm: Stockholm University.
- Solheim, S., 2021. Dataset timing the emergence and development of arable farming in Southeastern Norway by using summed probability distribution of radiocarbon dates and a Bayesian age model [online data repository]. Radiocarbon, 63 (5), 1503–1524. Accessed 16 February 2023 Available from 10.1017/RDC.2021.80
- Sørensen, R., 2002. Hurumlandskapets utvikling gjennom 300 millioner år. Det norske vitenskaps-Akademi. Årbok, 1999. Oslo: Universitetsforlaget, pp. 323–333.
- Sørensen, R., 2014. Holocene landhevningsstudier i søndre Vestfold of sørøstre Telemark – revidert kurve. In: S. Melvold and P. Persson, eds. Vestfoldbaneprosjektet. Arkeologiske undersøkelser i forbindelse med ny jernbane mellom Larvik og Porsgrunn. Bind 1. Tidlig- og mellommesolittiske lokaliteter i Vestfold og Telemark. Oslo: Oslo: Portal forlag and Museum of Cultural History, University of Oslo, pp. 36–47. 10.23865/noasp.61.
- Spencer, C., and Bevan, A., 2018. Settlement location models, archaeological survey data and social change in bronze age Crete. Journal of Anthropological Archaeology, 52, 71–86. doi:10.1016/j.jaa.2018.09.001
- Stiner, M.C., and Kuhn, S.L., 2016. Are we missing the “sweet spot” between optimality theory and niche construction theory in archaeology? Journal of Anthropological Archaeology, 44, 177–184. doi:10.1016/j.jaa.2016.07.006
- Stokke, J.S., 2020. Gravfelt, kokegropfelt og bosetningsspor. Eidsten 4103/12, Mellom Holhjem 4105/3, Nordre Holhjem 4106/2. Larvik, Vestfold: Museum of Cultural History, University of Oslo. http://urn.nb.no/URN:NBN:no-78684.
- Stokke, J.S., Viken, S. and Zawalska, J., 2019. Bosetningsspor, steinalderlokalitet og hellere. E39 Søgne 2017. Klepland, 73/2, 6, 7, 10, 21. Tangvall, 72/1, 112. Ospedalen, 49/4, 19. Tofteland, 74/75. Søgne, Vest-Agder. Museum of Cultural History, University of Oslo. http://urn.nb.no/URN:NBN:no-73986.
- Tesch, S., 1980. Ett par bronseåldermiljöer med huslämnigar i Skåne och Södermansland. In: H. Thane, ed. Broncealderbebyggelse i Norden. Beretninger fra det andet nordiske symposium for broncealderforskning. Odense 9.-11. april 1980. Odense: Skrifter fra historisk institut, Odense Universitet, pp. 83–101.
- Tilley, C., 1994. A phenomenology of landscape. Places, paths and monuments. Oxford: Berg.
- Trigger, B.G., 1968. The determinants of settlement patterns. In: K.C. Chang, ed. Settlement archaeology. Palo Alto, CA: National Press, pp. 53–78.
- Vandkilde, H., 1996. From stone to bronze : the metalwork of the late neolithic and earliest bronze age in Denmark. Aarhus: Aarhus University Press.
- Vera, F., and Vera, F.W.M., 2000. Grazing ecology and forest history. Oxford: CABI Publishing. doi:10.1079/9780851994420.0000.
- Viken, S., 2019. Bosetningsspor fra bronsealder og eldre jernalder. Homme, 52/25, Lindesnes, Vest-Agder. Museum of Cultural History, University of Oslo. http://urn.nb.no/URN:NBN:no-70485.
- Vita-Finiz, C., and Higgs, E.S., 1970. Prehistoric economy in the Mount Carmel Area of Palestine: site catchment analysis. Proceedings of the Prehistoric Society, 36, 1–37. doi:10.1017/S0079497X00013074.
- Vretemark, M., 2010. Subsistence Strategies. In: T. Earle and K. Kristiansen, eds. Organizing bronze age societies. Cambridge: Cambridge University Press, pp. 155–184.
- Wandersee, J.H., and Schussler, E.E., 1999. Preventing plant blindness. The American Biology Teacher, 61 (2), 82–86. doi:10.2307/4450624.
- Wehlin, J., et al., 2023. Hunter‑gatherer farming during the first millennium BCE in inland, boreal landscapes: new pollen analytical and archaeological evidence from Dalarna, central Sweden. Vegetation History and Archaeobotany, 1–19. 10.1007/s00334-023-00933-1.
- Weiser-Aall, L., 1953. Vassbæring i Norge. Oslo: Norsk Folkemuseum.
- Wernke, S.A., Kohut, L.E., and Traslaviña, A., 2017. A GIS of affordances: movement and visibility at a planned colonial town in highland Peru. Journal of Archaeological Science, 84, 22–39. doi:10.1016/j.jas.2017.06.004
- Wheatley, D., 1993. Going over old ground: gIS, archaeological theory and the Act of Perception. In: J. Andresen, T. Madsen, and I. Scollar, eds. Computing the past. Computer applications and quantitative methods in archaeology. Aarhus: Aarhus University Press, pp. 133–138.
- Wieckowska-Lüth, M., et al., 2018. Towards a refined understanding of the use of coastal zones in the mesolithic: new investigations on human–environment interactions in telemark, southeastern Norway. Journal of Archaeological Science: Reports, 17, 839–851. doi:10.1016/j.jasrep.2017.12.045.
- Wieckowska-Lüth, M., Kirleis, W., and Doerfler, W., 2017. Holocene history of landscape development in the catchment of Lake Skogstjern, southeastern Norway, based on a high-resolution multi-proxy record. The Holocene, 27 (12), 1928–1947. doi:10.1177/0959683617715691.