
 ?Mathematical formulae have been encoded as MathML and are displayed in this HTML version using MathJax in order to improve their display. Uncheck the box to turn MathJax off. This feature requires Javascript. Click on a formula to zoom.
Abstract
This paper presents the results of the Power To Melt and Maneuverability (P2M) Simulation Exercise on past fuel melting irradiation experiments, organized within the Organisation for Economic Co-operation and Development/Nuclear Energy Agency Framework for IrraDiation ExperimentS (FIDES) framework by the Core Group (CEA, EDF, and SCK‧CEN) and open to all FIDES members. The exercise consisted in simulating two past power ramps where fuel melting was detected: (1) the xM3 staircase power transient [ramp terminal level (RTL) 70 kW‧m−1, average burnup 27 GWd‧tU−1], carried out in 2005 in the R2 reactor at Studsvik (Sweden), where the rodlet maintained its integrity, and (2) the HBC4 fast power transient (RTL 66 kW‧m−1, average burnup 48 GWd‧tU−1), carried out in 1987 in the BR2 reactor at SCK‧CEN (Belgium), where the cladding failed during the experiment. The exercise was joined by 13 organizations from 9 countries using 11 different fuel performance codes. In this paper, the main results of the Simulation Exercise are presented and compared to available postirradiation examinations (PIE) or on-line measurements during the power ramps (fuel and clad diameters, rod elongation, pellet-clad gap, and fission gas release). Since the focus of the Simulation Exercise is on fuel melting assessment, determination of the boundary between melted/nonmelted fuel and the consequent definition of a melting radius from PIE are first discussed. During the HBC4 ramp, fuel melting was predicted by most of the codes despite differences in the melting models. Higher discrepancies were observed for the xM3 rod that can be attributed partly to power uncertainty and partly to the limited capability of the models to describe partial melting of the fuel during this ramp. Finally, possible code developments to improve simulation results are presented.
I. INTRODUCTION
The continuous need for safer, more efficient, and more reliable use of nuclear energy requires constant development and optimization of fuels and materials. This has to be based on solid and extended experimental evidence that can be obtained through laboratory-scale analyses and irradiation programs in dedicated research reactors called material testing reactors (MTRs) allowing integral tests under representative conditions (neutron flux, thermal-hydraulic conditions, etc.). These programs aim at improving the understanding of physical phenomena, at qualifying the behavior of innovative fuels and materials, and at validating the simulation tools that support their development. In the past years, the availability of MTRs has been strongly reduced by the shutting down of several reactors such as R2 in Sweden (2005), OSIRIS in France (in 2015), and HBWR in Norway (in 2017). The Organisation for Economic Co-operation and Development/Nuclear Energy Agency (OECD/NEA) initiative in 2021 to form the Framework for IrraDiation ExperimentS (FIDES) resulted from the need for an international framework triggering governmental investments as well as decisions and thus supporting researchers, industrial companies, and regulators to perform irradiation programs on fuels and materials. Today, FIDES has gathered 27 organizations from 12 countries around 3 Joint ExpErimental ProgramsCitation1 (JEEPs):
Power To Melt and Maneuverability (P2M), proposed by the Belgian Nuclear Research Centre (SCK‧CEN, Belgium), the Commissariat à l’Énergie Atomique et aux Énergies Alternatives (CEA, France), and Électricité de France (EdF, France), to study the behavior of light water reactor (LWR) high-burnup fuel during slow and high-power transients leading to fuel centerline melting without clad failure.
Inpile Creep Studies of ATF claddings (INCA), proposed by the Czech Republic nuclear organizations (CVŘ, UJV, ALVEL) and supported by the CEA (France) and the Technical Research Centre of Finland (VTT, Finland), where tests focused on irradiation-induced cladding creep are planned.
High burnup Experiments in Reactivity initiated Accident (HERA), proposed by Idaho National Laboratory (INL) and supported by the U.S. Department of Energy, the U.S. Nuclear Regulatory Commission (NRC), the Westinghouse Electric Company, the Japan Atomic Energy Agency (JAEA), and the Institut de Radioprotection et de Sûreté nucléaire (IRSN, France), to improve the understanding of LWR high-burnup fuel and accident tolerant fuel behavior during reactivity initiated accidents (RIA).
This paper presents the simulation results and the fuel melting assessment obtained during the international Simulation Exercise on Past Fuel Melting Experiments that took place in 2021 within the P2M program. Since the design of the P2M transient tests, leading to partial fuel melting, is expected to be challenging for existing fuel performance codes, the Simulation Exercise was launched purposely to calibrate the codes on fuel melting under slow transient power ramp conditions. In this paper, the P2M Joint Experimental Program and the objectives of the Simulation Exercise are detailed in Sec. II. The studied past power ramps leading to fuel melting are then presented in Sec. III. The determination of the fuel melting radius from ceramographies is discussed in Sec. IV. The fuel codes that joined the Simulation Exercise are briefly described in Sec. V with a focus on the implemented fuel melting models. Simulation results are presented in Sec. VI and discussed in Sec. VII. The conclusions of the Simulation Exercise together with future improvement steps identified from this work are drawn in Sec. VIII.
II. THE P2M INITIATIVE
II.A. The P2M Joint Experimental Program
The P2M program arose from the lack of up-to-date data on the consequences of incipient centerline fuel melting on the integrity of fuel rods during slow power transients. The current understanding of fuel rod behavior at high temperatures, of the phenomenology occurring during fuel melting, and of its impact on cladding is based on old tests performed on former fuel rod designs with limited instrumentation.Citation2–5 P2M aims at providing new data on modern fuel rods thanks to advanced on-line measurements. This will help in improving the knowledge, models, and simulation codes in support of fuel performance optimization and related safety margins.
In the P2M program, two slow staircase power ramps on high-burnup fuel rods are planned. The high linear heat generation rate (LHGR) will be reached by successive LHGR steps separated by long holding times to allow clad relaxation and thus minimize the risk of clad failure. The irradiation protocol aims at reaching a fraction of melted fuel of up to 15% at the pellet center. The main objectives are characterization of the local irradiation conditions leading to activation of fuel centerline melting, study of the impact of fuel partial melting on fuel rod behavior and on clad deformation, and quantification of fission gas release (FGR) at high LHGR from high-burnup fuel.
Two fuel rods will be refabricated at the CEA LECA-STAR hot cell facility according to the FABRICE refabrication process widely used in the past.Citation6 The rodlets will be instrumented with an in-fuel centerline thermocouple at the bottom of the fuel stack and with a pressure sensor based on linear variable differential transformer (LVDT) technology in the upper plenum.Citation7 The power ramps will be performed in the BR2 reactor (SCK‧CEN, Belgium) in the pressurized water capsule (PWC) device.Citation8 Postirradiation examinations (PIE) are planned at the CEA LECA-STAR hot cell facility in Cadarache, France.
II.B. The Simulation Exercise on Past Fuel Melting Irradiation Experiments
To design the P2M power ramps, precalculations are performed with the codes of the core group members: ALCYONE by CEA (CitationRefs. 9, Citation10, and Citation11), TRANSURANUS by SCK‧CEN (CitationRef. 12), and CYRANO3 by EdF (CitationRefs. 13 and Citation14). In order to calibrate the codes in these high LHGR conditions leading to fuel melting, a Simulation Exercise was organized by the core group and opened to the FIDES members. A preliminary literature review led to the selection of two power ramps of interest:
The xM3 staircase power ramp, very close to the power ramp protocol planned for P2M, involving a Mitsubishi Heavy Industries (MHI) large grain
fuel with stress relieved (SR) Zirlo cladding preirradiated up to an average burnup of 27
The HBC4 fast power ramp (72
The xM3 power ramp was considered of great interest as it showed evidence of fuel centerline melting with no clad failure. Also, extensive and detailed PIE were available. The P2M power transients are designed based on this experiment. Interest in the HBC4 power ramp stems from the fact that it was performed in the BR2 reactor and in the same irradiation device that will be used for the P2M experiments. However, it led to clad failure, which is not the objective in P2M. The Simulation Exercise was joined by 13 organizations (from industry, research institutes, and regulatory bodies) from 9 countries using 11 different fuel performance codes. More information on the fuel performance codes involved is given in Sec. V.
III. THE xM3 AND HBC4 TEST CASES
III.A. The xM3 Test Case
The xM3 test case was previously simulated by several organizations during the third modeling workshop that took place within OECD/NEA Studsvik Cladding International Program (SCIP) II (CitationRef. 16). The workshop aimed at studying and explaining the beneficial impact of slow power ramp on fuel performance under pellet-cladding interaction (PCI) conditions. It was therefore not focused on fuel pellet melting but rather on thermomechanical analysis of clad behavior during slow and fast power transients. The xM3 rodlet was part of a segmented rod manufactured by ENUSA in Spain. The father rod consisted of seven segments screwed and welded together. The xM3 segment contained large grain fuel pellets manufactured by MHI in Japan within SR Zirlo cladding. The main characteristics of the fuel rods are reported in .
TABLE I Main Characteristics of the As-Manufactured Fuel Rods
The father rod was irradiated during two cycles in the Vandellos II pressurized water reactor (PWR) in Spain, up to an average burnup of 27 . During the first cycle, the average LHGR on the xM3 segment reached 26
. During the second cycle, it decreased to 18
. The power evolution during base irradiation and the axial power profiles are plotted in and , respectively. The axial power profile was nearly flat leading to small axial variation of the burnup.
Fig. 1. Power histories and axial power profiles during the xM3 base irradiation and power ramp.
After refabrication, the xM3 rodlet was power ramped in 2005 in the Studsvik R2 reactor (Sweden). Pressurized water loop N°1 was used for the irradiation test, simulating PWR conditions at the clad outer wall (147 bars, 315°C). In the loop, the rod surface temperature was limited by subcooled surface boiling, initiated at a local LHGR of 40 . The rod was preconditioned at a LHGR of 20
during 18 h before the first power step. Then, the power was progressively increased up to 70
by steps of
5
. Each 5
step was maintained during 1 h as well as the RTL of 70
. The main characteristics of the xM3 power ramp are presented in . The power history and the axial power profiles are represented in and . The axial profiles are normalized with respect to the average power along the rod.
TABLE II Main Characteristics of the Simulated Power Ramps
shows the power ramp irradiation protocol. The control rod position changed during the ramp, leading to modification of the axial power profile. shows the average axial power profile during the power ramp. The rodlet did not fail during the test.
After the base irradiation, PIE were performed. They include the following data of interest for the simulation exercise: clad diameter axial profile, fuel stack length, average burnup of the rodlet, and final average fast fluence of the fuel rod (E 1 MeV). PIE were also performed after the power ramp and provide the following data of great interest for the simulation exerciseCitation19,Citation20: rodlet elongation during the power ramp (pressurized water loop 1 was equipped with a LVDT), residual and relocated pellet-clad gap at several axial locations (see Appendix A for more details), FGR (volume of released gas, rodlet pressure, and rodlet free volume), and clad diameter axial profile. Local measurements of the clad diameter, pellet diameter, central hole diameter, and external zirconia thickness near the peak power node (PPN) were also extracted from a transverse cross section of the rodlet observed by light optical microscopy (LOM), as detailed in Sec. IV.A.
III.B. The HBC4 Test Case
The HBC4 rod was manufactured by BELGONUCLEAIRE and base irradiated in the BR3 experimental reactor.Citation17,Citation18 It was made of standard dished UO2 pellets and CWSR Zircaloy-4 cladding. The main characteristics of the rod are summarized in . The rod was irradiated during three cycles in the BR3 reactor between 1976 and 1983. The assembly, representative of a 17×17 lattice, experienced standard PWR thermal-hydraulic conditions. The LHGR history during base irradiation and the axial power profile (normalized with respect to the average power in the rod) are shown in and , respectively. At the end of the base irradiation, the fuel reached an average burnup of 48 . Because of the marked axial power profile, the maximum burnup in the rod reached 61
.
Fig. 2. Power histories and axial power profiles during the HBC4 base irradiation and power ramp.
The power ramp was performed in 1987 in the PWC of the BR2 reactor on the same rod in order to characterize the power-to-melt of high-burnup fuel.Citation17,Citation18 The irradiation consisted first in a gradual and slow power increase by steps of 5 up to the preconditioning level of 40
. The conditioning period lasted 20 h. A fast transient at 72
was then applied up to the maximum RTL, maintained during 40s. shows the power ramp irradiation protocol. gives the average axial power profile. During the test, the radiation detector located along the sampling line gave no sign of fuel rod damage and fission product (FP) release in the loop. During depressurization of the rig, a considerable rise in activity was measured, indicating that the cladding had failed. The failure time was determined by PIE and located at the end of the RTL. The delayed measurement of FP release was attributed to the reopening of the pellet-clad gap following the decrease of the external pressure in the test rig. The RTL estimated from on-line measurements of thermal fluxes during the test was 70.5
. From
Zr gamma spectrometry after testing, the shape factor resulted in an estimated RTL of 66
. For this Simulation Exercise, it was decided to use the lowest RTL as reference and to perform calculations with an estimated
7% power uncertainty that covers the highest RTL of 70.5
.
After the base irradiation, PIE were performed.Citation17,Citation18 The main data of interest for the simulation exercise are clad diameter axial profile, rod length, fuel stack length (measured by neutron radiography), rod average and peak burnup, and FGR from a sibling rod irradiated in close conditions. The PIE performed after the power ramp include the following data of interest: clad diameter axial profile (measured by spiral profilometry) and measures of the fuel and central hole diameters, of the external zirconia thickness from three transverse cross sections of the rod studied by LOM. The axial extension of the central hole was estimated from neutron radiography.
IV. FUEL MELTING ASSESSMENT FROM PIE
IV.A. xM3
shows the ceramography of a transverse cross section close to the PPN of the xM3 rod after the power ramp.Citation19 The section was positioned at about 170 to 190 mm from the bottom of the fissile column (BFC) and studied by LOM. It is the only ceramography available after the power ramp.
Fig. 3. Transverse cross section of the unfailed xM3 rod after the power ramp.
The following microstructures have been identified from the ceramography:
A central hole at the pellet center.
A recrystallized zone with dense fuel (blue and green boxes), containing spherical pores close to the central hole. No grain boundaries were observed in this region after etching.
A net boundary at a radius of 1.2 mm (yellow box) is observed between the recrystallized zone and a region where elongated grains in the radial direction (columnar structure) and intergranular bubbles appear.
The columnar structure with intergranular bubbles extends radially until the red box where an equiaxed grain structure with numerous intragranular bubbles is found.
The boundary of the intragranular bubble precipitation zone is easily identified after etching and observed in the purple box.
The net boundary between the dense region with no apparent grains and the surrounding material, at 1.2 mm from the pellet center, has been considered as an indication that fuel had melted during the ramp test.Citation19 This is further discussed in Sec. IV.C.
IV.B. HBC4
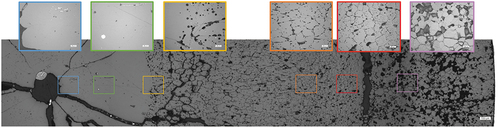
After the HBC4 power ramp, the rodlet was first examined by neutron radiography.Citation17 Three zones where voids had formed in the centerline of the fuel column were found. They were located near the PPN and at an axial level of 300 to 385 mm/BFC. The voids were not continuous in the axial direction but sometimes filled with fuel. Three transverse cross sections (named CT1 and CT2 in the failed region, CT3 out of the failed region) and one longitudinal cross section (named CL1) were cut from the rodlet. shows the axial diameter profile of the HBC4 rod after the power ramp, where the clad cracks are characterized by local peaks. The location of the three transverse cross sections (CT1, CT2, and CT3) and of the longitudinal cross section (CL1) are reported in as well as the central holes obtained from neutron radiography. A fourth ceramography was obtained, CT1’, by grinding and polishing downward the CT1 cross section. The CT1, CT1’, CT2, and CL1 ceramographies are shown in , and , respectively.
Fig. 4. Rod diameter profile after the HBC4 power ramp with the location of the transverse (CT) and longitudinal (CL) cross sections and of the central holes.
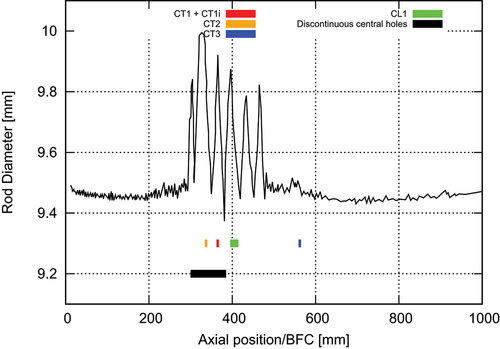
Fig. 5. HBC4 rodlet. Transverse cross section CT1. Clad failure is visible on the right side.
Fig. 6. HBC4 rodlet. Transverse cross section CT1’, obtained by grinding and polishing downward CT1.
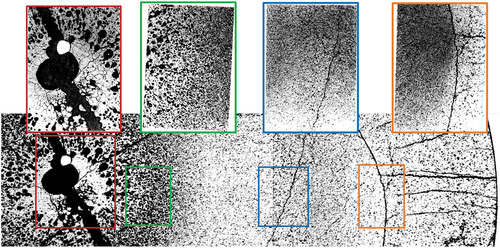
Fig. 7. HBC4 rodlet. Transverse cross section CT2.
Fig. 8. HBC4 rodlet. Longitudinal cross section CL1.
The following microstructures have been identified from the ceramographies:
Elliptic central holes are found in CT1 and CT2.
The central holes in CT1 and CT2 are surrounded by a region of dense fuel containing large pores. The microstructure is better seen in the magnified picture of the CT1’ center; see the red box in . It presents large spherical and pear-shaped bubbles, radially oriented. The size of the bubbles reduces in the radial direction.
The central hole in CT1’ is partly filled with dense material. In consequence, the diameter of the central hole is reduced when compared to CT1. The outer radius of the dense fuel region with large pores is however unchanged when compared to CT1.
Regions with elongated columnar grains and intergranular bubbles and then equiaxed grains with numerous intragranular bubbles are observed when proceeding toward the pellet periphery; see the green and blue boxes in .
The boundary of the intragranular bubble precipitation zone is close to the circumferential crack that can be seen in the orange box of .
Evidence of melting during this power ramp was associated with two distinctive featuresCitation17: The discontinuous cavities observed along the central axis of longitudinal ceramography CL1 indicated that molten fuel relocation had plugged the central hole at some axial locationsCitation21; the central void radii were larger than expected from the columnar grain formation process known to take place when ramping at high power,Citation22 considering the short holding period at RTL (40 s). The structural boundary between the high dense fuel containing large spherical or pear-shaped pores and the surrounding material was considered as the melt radius. This is further discussed in Sec. IV.C.
IV.C. The Fuel Melting Radius
Identification of the microstructural changes that are associated with fuel melting is an old topic of debate that started with the first power-to-melt experiments in the 1960s (Refs. 2, 3, and 4). The distinctive features in ceramographies of once molten fuel samples depend on several factors: pre-ramp and post-ramp irradiation conditions (power and duration); unloading rate; axial position of the fuel sample in the rod, of importance in the case of fuel relocationCitation21; presence of impurities in the fuel. When fuel relocation is not seen and unloading occurs rapidly after short periods at RTL, the following microstructures have been reported from PIE of power-to-melt experimentsCitation2–5,Citation21,Citation23,Citation24: A central hole can be observed, generally surrounded by a ring of dense fuel with large grains and numerous pores radially orientated, sometimes followed by a high-density fuel layer composed of large columnar grains with little or no porosity.
There is general consensus on the fact that the central hole and the columnar grains are not clear signs of fuel melting since they can form below the melting point by uranium dioxide vaporization/condensation within the pores.Citation22 In 1962, Robertson et al.Citation3 defined the molten fuel radius at the interface of the two dense fuel rings and not at the outer radius of the high-density fuel layer. The same definition of the molten fuel radius was proposed by De Halas and HornCitation4 based on different power-to-melt experiments. In later experiments, Freshley,Citation5 Freund et al.,Citation24 and Inoue et al.Citation21 included the dense fuel layer with no pores in the molten fuel region. Fresley distinguished the “molten boundary at time of shutdown” (outer radius of the inner dense ring) from the “maximum melt radius” (outer radius of the outer dense ring).
In their analysis of the xM3 ceramography, Arimescu et al.Citation16 identify two rings in the recrystallized region of : an inner ring with spherical pores and a pore-free outer ring. The fuel melting radius was thus located at the interface of the two rings, i.e., with a radial extent of 0.4 mm instead of 1.2 mm if the outer radius of the recrystallized region is considered. Another argument for this low-melt radius is given by Arimescu et al.Citation16 based on the size of the central hole. Assuming it is formed by shrinkage of the once molten fuel core upon cooling down, and considering a 10% volume expansion when fuel melts, no axial deformation, and no axial movement of molten material, the central hole radius is related as follows to the melted fuel radius
:
For a measured hole radius of 0.15 mm, the melt radius is 0.48 mm, consistent with the interface between the porous and nonporous dense rings.
In the postirradiation report of the HBC4 ramp,Citation17 the melt radius is defined at the boundary between the high-density fuel region with large spherical and pear-shaped pores and the surrounding material. This corresponds to a melt radius of 0.8 mm in CT1 and CT1’ and a melt radius of 1.1 mm in CT2. While the central holes are obviously elliptic, the melt regions in HBC4 ceramographies were found to be relatively circular. The only asymmetry was related to the clad cracks that led to an offset with respect to the center of the holes. By comparison to xM3, there is no pore-free ring in HBC4; furthermore, the pore size and form in the dense ring are very different. This may be related to the different loading sequences and durations of the holding period at RTL in the two ramps: in HBC4, straight ramp, 40s at RTL, and in xM3, several intermediate steps of 1 h before RTL. Some equilibrium might have been reached in xM3 (spherical pores) and not in HBC4 (radially inward moving pear-shaped pores).Citation25 De Halas and HornCitation4 show that a long holding period at RTL can drastically change the observed microstructure at the once molten pellet center.Citation4 Freund et al.Citation24 indicate that a long preirradiation phase with fuel restructuring increases the power-to-melt of a given fuel rod.
For the Simulation Exercise, a fuel melting radius range has been defined for xM3 since the literature review indicated that some authors include the pore-free ring in the molten fuel region.Citation5,Citation24 There is therefore no consensus in the definition of the melt radius in case a pore-free ring is observed. For HBC4, there is a variation in the melt radius from one ceramography to another, in spite of similar local burnups and RTL. The central hole and melt radii considered in the Simulation Exercise are reported in .
TABLE III Melting Fuel Radii Based on the Available xM3 and HBC4 Cross Sections
V. MAIN CHARACTERISTICS OF THE FUEL CODES
Brief descriptions of the codes that joined the Simulation Exercise are reported below. Most of the codes are based on a similar description of the fuel rod geometry [1.5-dimensional (1.5D)] and include modeling of heat conduction in the fuel and the cladding, heat exchanges at the pellet-clad and clad-coolant interfaces, fuel densification and swelling, fuel and clad thermal expansion, fuel-clad mechanical interaction, clad creep and/or plasticity, and FGR, which are not detailed here. The readers can refer to the reference papers where the codes are described for more details on these aspects. Only specifications of each code that can explain some of the results presented in Sec. VI are mentioned. Details and references when available on the models relative to fuel melting are given in Appendix B. It is important to stress that no code is validated beyond the melting temperature.
TRANSURANUS (CitationRef. 12) is a 1.5D code that can deal with both steady-state and transient analyses. Among the important features included in the code, fuel and clad creep are described, as well as pellet cracking and relocation. The correlation of the MAPLIB handbookCitation26 is used to evaluate the fuel melting temperature, which depends on Pu content and fuel burnup. The dependency of
FRAPCON-4.0 (CitationRef. 30) is a 1.5D code that calculates the steady-state response of LWR fuel rods during long-term irradiation and generates initial conditions for a transient fuel rod analysis with the FRAPTRAN code.Citation31 Under the hypothesis of small fuel and clad deformations, the fuel pellets are modeled as rigid, and they deform due to thermal expansion, swelling, and densification only. The displacement of the fuel is calculated independently of the cladding deformation. When the gap is closed, the cladding is assumed to follow the fuel dimensional changes related to thermal expansion only. The code uses the MATPRO database for material properties.Citation32 The FRAPCON/FRAPTRAN code accounts for the fuel thermal expansion associated with melting and for the latent heat of melting. In the FRAPCON/FRAPTRAN version used by ALVEL, the melting temperature is based on the correlation given in CitationRef. 33. The solidus and the liquidus temperatures are assumed equal when there is no Pu in the fuel. The melting temperature decreases with the fuel burnup. A stress/strain criterion is used to evaluate clad failure during power ramps. Central Research Institute of Electric Power Industry (CRIEPI) used FRAPCON-4.0 and FRAPTRAN-2.0 with the melting temperature equal to that of fresh stoichiometric
FAST-1.0 (CitationRef. 34) is a 1.5D code that merges the FRAPCON-4.0 and FRAPTRAN-2.0 codes. FAST calculates the steady-state and transient behavior of LWR fuel rods during normal operations, anticipated operational occurrences, and design-basis accidents. The code uses an updated version of the MATPRO material properties database. In the FAST-1.0 version used by the NRC, the melting temperature depends on the burnup and on the Pu and Gd contents. No distinction is considered between the solidus and the liquidus temperatures.Citation35
FINIX (CitationRef. 36) is a 1.5D code developed by VTT since 2012 and designed to be encapsulated in multiphysics applications (coupled with thermohydraulics, neutronics codes, etc.). It is used for steady-state and transient analyses. As in FRAPCON/FRAPTRAN, FINIX models the fuel pellets as mechanically rigid while the clad behavior is assumed to be elastoplastic. Once strong pellet-clad contact is established, a no-slip condition at the pellet-clad interface is assumed. Slip is possible only in the case of weak contact (if the contact pressure is lower than the rod pressure). FINIX-1.19.1 has been validated against centerline temperature data from HBWR steady-state irradiation experiments (IFA-429, IFA-432, IFA-515, IFA-677, and IFA-681) and benchmarked to FRAPTRAN simulations of selected RIA tests and a limited number of loss-of-coolant–accident (LOCA) tests.Citation36 No melting model is at present available in FINIX. The melting temperatureCitation37 considered is the solidus temperature, evaluated as a function of burnup and of Pu content.
ALCYONE (CitationRefs. 9, Citation10, and Citation11) is a finite element (FE)–based, multidimensional code for PWR fuel performance co-developed by CEA, EdF, and Framatome within the PLEIADES simulation environment. It includes a 1.5D scheme for the calculation of the entire fuel rod behavior and a two-dimensional (2D) scheme (r,
CYRANO3 is the 1.5D thermal-mechanical industrial code developed and used by EdF to simulate in-pile nuclear fuel rod performance under normal and transient conditions (power ramp tests) within PWRs, as well as during transport and storage periods. CYRANO3 was recently extended from normal and incidental operating sequences to accidental scenarios (RIA and LOCA) (CitationRef. 41). The code validation database includes several types of fuel (
TEmperature and Strain Probabilistic Analysis of a Fuel ROD (TESPA-ROD) (CitationRef. 42) is the code used by GRS to investigate the thermomechanical behavior of fuel rods during design-basis accidents (LOCA and RIA), transients, and long-term storage, mainly to determine radiological consequences. The code has been validated on irradiations performed at Argonne National Laboratory and at the HBWR. As the TESPA-ROD code was not developed for nominal irradiation conditions, burnup and specific boundary conditions are prescribed to initialize power ramp simulations. No melting model is currently implemented in Tespa-Rod.
FEMAXI-8 (Version 8.1) (CitationRef. 43) is the latest version of the 1.5D fuel performance code FEMAXI, developed by the JAEA to analyze the thermomechanical behavior of a single fuel rod under primarily normal operating conditions and anticipated transient conditions. In addition to thorough validation work against irradiation data of 168 rods with various designs, burnups, and power histories, significant improvement in the numerical stability and structure of the code has been achieved in the present version. A specific model has been implemented to account for the thermal barrier and additional deformation associated with pellet circumferential cracks, whose treatment is self-consistent between thermal and mechanical calculations. Recently, a mechanistic FGR model has also been implemented to describe the dynamic behavior of intragranular bubbles and the porosity evolution in the high-burnup structure region. The melting temperature is the one provided by Christensen,Citation44 as reported in CitationRef. 45. It evolves with the fuel burnup, but no distinction is made between the solidus and the liquidus temperatures.
BISON (CitationRef. 46) is a FE nuclear fuel performance code developed by INL, based on the Multiphysics Object-Oriented Simulation Environment (MOOSE) Framework and used in a wide range of applications, e.g., LWR, TRISO fuel, and metallic fuel. The fully coupled equations of thermomechanics and species diffusion can be solved in one dimension, 2D axisymmetric, 2D plane-strain, and three dimensions. The code can be used for steady-state and transient thermal analyses. A pellet relocation model that accounts for the formation of radial cracks is included in the one-dimensional scheme used for the Simulation Exercise. Currently, a fuel melting model is not available in the code, but a reference value is used. The fuel melting temperature used in the simulations is that of stoichiometric, nonirradiated
Fuel Analysis and Licensing COde–NewCitation47 (FALCON) has been developed and extensively employed at the Paul Scherrer Institute (PSI) for the analysis of LWR fuel. The code has been validated up to high burnup and is based on a robust FE thermal/mechanical 2D numerical solver. It can be used to solve both steady-state and transient thermal analyses. Material properties from the MATPRO and the NFIR (CitationRef. 48) databases are used. The fission gas swelling and release model used is GRSW-A (CitationRef. 49). The central hole diameter is not calculated by FALCON. Only the melting temperature is calculated by the code; the correlation is from MATPRO (CitationRef. 32). This temperature is evaluated as a function of the Pu content and of the fuel burnup. The codes bound the temperature to the melting one. The thermal conductivity of molten fuel is taken into account when melting is reached. Fuel melting does not impact the other thermal-mechanical properties.
As can be inferred, most of the codes used by the participants are already validated for the fuel and clad materials of the xM3 and HBC4 rods. All the codes except TESPA-ROD can perform steady-state and transient thermal analyses to evaluate the pre-ramp conditions of the fuel rods. Nevertheless, the participants pointed out that the two test cases considered here are far more extreme than those available in the code validation databases.
and in Appendix B detail the main models included in the codes related to fuel melting, e.g., thermal conductivity with or without phase change, heat capacity including or not the latent heat of melting, melting criteria, consideration of thermal expansion upon melting, and clad failure criteria. As reported in , melting is predicted in the codes according to a thermal criterion. The melting temperature model is code dependent and varies with several parameters, the main ones being the Pu content and the burnup of the fuel. Most of the codes consider a unique melting temperature when the Pu content is negligible (as in the xM3 and HBC4 rods), and the melting temperature decreases when the burnup of the fuel increases.Citation50–52 This results in a binary evaluation of melting. The fuel is considered fully molten once the local temperature exceeds the melting temperature. A melting initiation criterion is implemented in ALCYONE based on the phase diagram of the irradiated fuel considered, calculated with the thermochemical solver OpenCalphadCitation38,Citation53 and the thermodynamic database TAF-ID (CitationRef. 40). The methodology is based on the work of Guéneau et al.Citation54 The evolution of the liquid fuel fraction when the local temperature is between the solidus temperature (melting initiation) and the liquidus temperature
is derived from the thermodynamic calculations.
VI. SIMULATION RESULTS
For each experiment, the base irradiation was first calculated and then used as input for the power ramp (except for TESPA-ROD). The power ramp was then calculated at nominal LHGR. A sensitivity analysis on the LHGR was also performed with the following uncertainties: 5% for xM3 and
7% for HBC4. In the following sections, the main simulation results are presented, first at the end of the base irradiations and then during and at the end of the power ramps. The results are then discussed in Sec. VII.
VI.A. Base Irradiation Results
Base irradiation results obtained by the codes are presented in through and compared to available measurements.
Fig. 9. Calculated clad diameters and pellet-clad gaps at the end of xM3 and HBC4 base irradiations compared to available measurements.
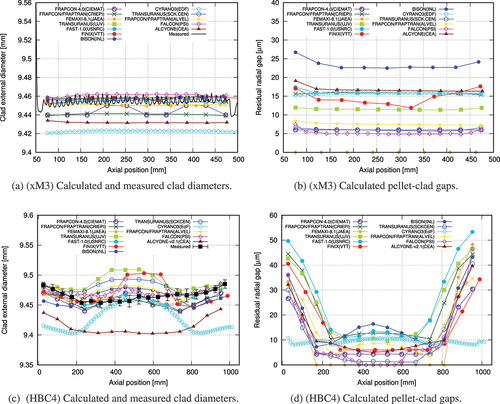
The xM3 simulation results at the end of the base irradiation were in reasonable agreement with available PIE. As shown in a limited deviation (of maximum 30 μm) from the measured external clad diameter profile (black line with no symbol) was observed. The thin external zirconia thickness (5 to11 μm) was also correctly estimated by most of the codes. The deviation between codes on the calculated fuel stack diameter profile was similar to that obtained on the clad diameter (around 30 μm). shows the calculated axial profiles of the residual gap at the end of the base irradiation, for which no measurement is available. A convergence on the gap between codes is important for the power ramp that follows the base irradiation since pellet-clad contact can be delayed in case the predicted gap is still widely open. In relation to the moderate average burnup of the xM3 fuel (27 ), the calculated residual pellet-clad gaps vary between 5 and 25 μm with most predictions between 5 and 17 μm. The measured fuel stack length was correctly estimated by the codes, within
1 mm.
The HBC4 simulation results at the end of the base irradiation were on average satisfactory despite the general struggle to correctly evaluate clad and fuel pellet deformation, as shown in for the cladding. This discrepancy is due to the higher LHGR than usual in a standard PWR during the first cycle of irradiation (30 ). Most of the codes overpredict the contribution of gaseous swelling of the fuel to the clad loading (mechanical pressure applied when the gap is closed), leading to bell-shaped profilometries, even though this differs from the measurements. Consequently, the maximum deviation from the measured clad diameter is higher for HBC4 (
50 μm) than for xM3 (
30 μm). For the same reason, higher deviation between codes is obtained also on the calculated rod and fuel stack length at the end of the base irradiation (around
3 to 4 mm for a length approximately twice that of xM3). The calculated axial profiles of the residual gap are plotted in . They reflect the strong axial power profile during base irradiation in the case of HBC4. At PPN where the burnup is maximum (61
), some codes predict gap closure. The null pellet-clad gaps estimated by FEMAXI-8 for both rods may be due to the fuel relocation model introduced into the current version 8.1. Most of the other codes led to a 5- to 12-μm residual gap. At rod ends where the burnup does not exceed 30
, the residual gap can reach up to 50 μm. This is the major difference with xM3 that presents nearly flat clad diameter and residual gap profiles.
VI.B. Power Ramp Results
VI.B.1. Thermal Behavior
shows the calculated evolution of the fuel centerline temperature at PPN during the staircase xM3 power ramp.
Fig. 10. Calculated fuel centerline temperature evolution at PPN during the xM3 power ramp.
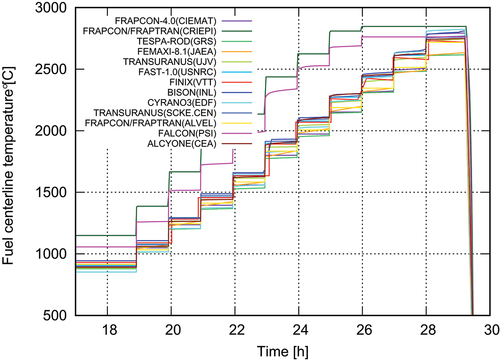
At the end of the conditionning plateau, most of the codes (except FRAPCON/FRAPTRAN by CRIEPI and FALCON) led to temperatures below 1000°C (the average temperature given by these codes is 924°C). Below about 2000°C, the dispersion of the calculated temperatures for all codes expect FRAPCON/FRAPTRAN by CRIEPI and FALCON is limited to about 50°C while above 2000°C, the dispersion increases to about
110°C. The two codes’ calculated temperatures at the end of the conditioning plateau are 135°C to 225°C larger than the average temperature calculated by the other codes. The overprediction increases with the LHGR. At LHGR greater than 60
, the melting threshold is reached by both FALCON and FRAPCON/FRAPTRAN by CRIEPI, and the centerline temperature is bounded. The threshold used by CRIEPI corresponds to the melting temperature of fresh UO2 (2847°C) (CitationRef. 55). Burnup-dependent thresholds are considered by all the other codes, leading to a maximum temperature at RTL lower than the melting temperature of stoichiometric fresh fuel.
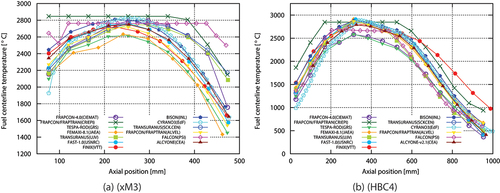
and show the axial profiles of the fuel centerline temperature, calculated at RTL (nominal LHGR), for the xM3 rod and the HBC4 rod, respectively. At the PPN of the two rods (200 mm/BFC for xM3 and
300 mm/BFC for HBC4), the average temperatures calculated by the codes are
2750°C for xM3 and
2810°C for HBC4. The scatter in the calculated temperatures at PPN is greater for xM3 (average deviation of 55°C) than for HBC4 (average deviation of 80°C). Surprisingly, the temperature dispersion increases sharply near the rod extremities and in particular at the upper end of the rods. The calculated maximum clad temperatures during the two ramps do not explain the dispersion on the fuel centerline temperatures. All the clad temperatures provided by the participants are within
5°C except for one of them in the HBC4 simulation. There is however no correlation between the fuel and the clad temperatures in this case. Potential differences in the heat exchanges at the fuel-clad interface were not investigated, assuming that the closed pellet-clad gap during the ramps would limit this effect.
Fig. 11. Calculated axial profiles of the fuel centerline temperature at RTL, calculations at nominal power.
VI.B.2. Thermomechanical Behavior
The PIE after the xM3 power ramp provide a complete set of data for assessing the thermal-mechanical behavior of the rod during pellet-cladding interaction. presents the calculated and the measured clad hoop strain axial profiles at the end of the power ramp. About half of the codes overpredict clad strains while the other half underpredict them. Since the dispersion on the calculated clad diameters at the end of the base irradiation was small (less than 30 μm), these results are mostly due to differences in the calculated clad diameter increase during the power ramp. At PPN, the calculated maximum residual strain is 1.7% to be compared with the measured strain of 1.1%. One trend that is caught by only a few codes is the relatively flat residual strain axial profile in the PPN region (200 to 300 mm/BFC) in spite of the pronounced LHGR axial profile; see .
Fig. 12. Calculated and measured residual strain, pellet diameter, and gap axial profiles at the end of the xM3 power ramp.
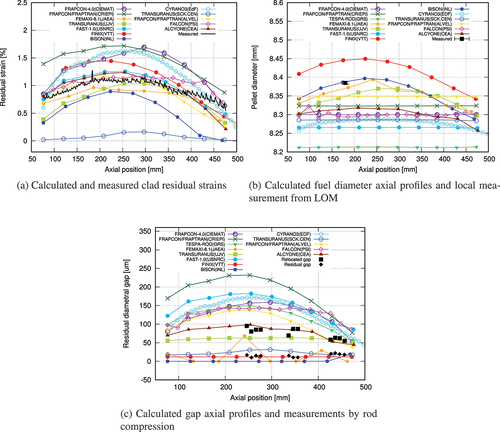
gives the axial profile of the fuel diameter at the end of the xM3 power ramp. The black filled squares indicate the local measurements obtained from the ceramography presented in Sec. IV.A. The prediction provided by FINIX overestimates the residual pellet deformation. TESPA-ROD does not include a fission gas swelling model. FRAPCON/FRAPTRAN and FAST-1.0 model pellets as rigid, and neither include fission gas swelling in the calculations when the fuel burnup is below 40 . These modeling hypotheses explain the flat fuel stack profiles calculated. BISON and FEMAXI-8 calculation results are the closest to the measured pellet diameter.
reports the calculated gap axial profiles and some measurements from rod compression at different axial positions. As explained in Appendix A, the relocated gap is always larger than the residual gap since it is measured after fuel fragment relocation by rod compression. The measured relocated gaps (black filled squares) follow the LHGR profile showing that fuel pellet expansion (the solid fuel pellet expansion) is mostly driven by temperature. The residual gaps (black filled circles), measured when fuel fragments are not relocated, have no observable axial evolution. The codes that predict well the measured residual gaps are the ones giving a correct estimation of the measured fuel pellet diameter. They usually consider that fuel strains are irreversible leading to close to zero residual gaps and high fuel residual diameters.
The observed dispersion in , and is related to the differences among codes in the thermal-mechanical modeling of the fuel and the cladding. This may be attributed to the differences in the calculated temperatures as discussed before, to differences in the thermal expansion models including or not melting, to the consideration or not of fission gas swelling, to differences in the clad mechanical models (plastic, viscoplastic) or in the pellet mechanical models (elastic, rigid, viscoplastic). During the simulation exercise, it was mentioned that a proper clad mechanical model for Zirlo is not available in all codes. In consequence, several codes used Zircaloy-4 models or tuned the Zircaloy-4 behavior to better represent the measured clad residual strains. Results were also user/version dependent: TRANSURANUS results provided by UJV using the modified in-house Rogozyanov model for Zirlo are consistent with the measurements while the results provided by SCK‧CEN tend to underestimate the residual strains. Differences in the discretization of the pellet and cladding in the simulations may also contribute to the dispersion of calculated results.
During the xM3 power ramp, the rod elongation was measured on-line. shows the recorded and calculated rod elongations. All the results are normalized with respect to the rod length at the end of the conditioning plateau.
Fig. 13. Calculated and measured rod elongations during the xM3 ramp (the results are normalized with respect to the clad length at the end of the conditioning plateau).
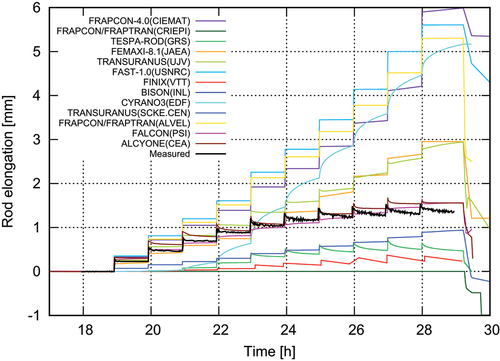
As can be seen, there is a huge variation in the calculated results, ranging from 0 to 5.5 mm at RTL for a 1.5-mm recorded maximum elongation. A majority of codes overpredict rod elongation. It is in particular the case of those considering the pellet as rigid and assuming a no-slip condition at the pellet-clad interface once strong contact is established. Conversely, the codes considering friction sliding at the pellet-clad interface or independent pellet and clad axial deformation lead to underestimated clad elongations. The measurements show that stress relaxation occurred during the holding period at each step, due to pellet and clad creep. This mechanism is predicted to some extent by TESPA-ROD, ALCYONE, and FALCON, where fuel creep is implemented. This topic was already addressed in detail during the Third Modeling Workshop of SCIP II (CitationRef. 16). At the end of the power ramp, the calculated residual elongations range between −1 and 5.2 mm, showing that the differences between codes are related to the way they model fuel swelling during the power ramp and not to the clad mechanical models. As discussed by Arimescu et al.,Citation16 the calculated cladding stress evolution is monotonically increasing after gap closure as the pellet is the main driver of clad deformation. Also, the modeled gaseous swelling dampens the stress relaxation occurring during the holding time.
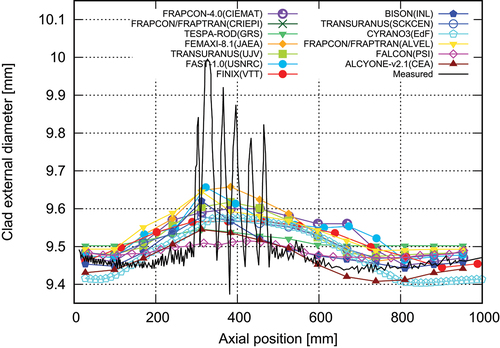
shows the calculated and measured clad diameter axial profiles after the HBC4 power ramp. Out of the failed region that can be clearly identified by the several peaks related to clad cracks, most of the codes tend to overpredict the residual clad diameter. ALCYONE and CYRANO3 rather show a tendency to underpredict by 50 μm the clad diameter. This is due to the cumulated error from the base irradiation calculation, where an underprediction of the same range was observed.
Fig. 14. Calculated and measured clad axial profiles after the HBC4 power ramp.
During the Simulation Exercise, it was proposed to assess the clad failure during the two ramps. Since only a limited number of codes provided some damage indexes, the results are not presented here. The timing of rod failure during the HBC4 power ramp is also still a matter of debate,Citation18 which makes conclusions speculative at this point.
VI.B.3. Fission Gas Release
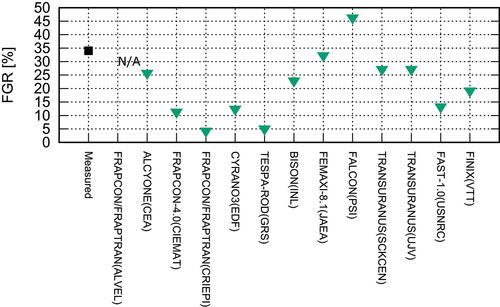
The calculated FGRs are compared in to the measurement available after the xM3 power ramp. As can be seen, the dispersion of calculated FGR is very high, and there is a general tendency to underpredict the released gas fraction. This trend was already observed during the Third Modeling Workshop of SCIP II (CitationRef. 16). No obvious correlation with the calculated fuel temperatures is observed. It must be stressed that the xM3 power ramp leads to very high calculated temperatures in all the codes and that there is no other experiment of this kind available to benchmark the calculated FGR. The large grain size of the fuel limits also the number of experiments available even at lower temperatures. It is thus not that surprising that the code results are generally far from the measured FGR. It may however be inferred that the codes including a mechanistic model for FGR give closer estimations of the FGR: FEMAXI-8, TRANSURANUS (SCK‧CEN), ALCYONE, FALCON, BISON, and FINIX. The codes that underestimate the FGR the most are those using empirical correlations and neglecting gaseous swelling in fuels irradiated below 40 (FRAPCON/FRAPTRAN and TESPA-ROD).
Fig. 15. Calculated and measured FGR after the xM3 power ramp.
VI.C. Fuel Melting Assessment
Fuel melting assessment was performed by comparing the measured fuel melting radii (see Sec. IV) with simulation results obtained at the end of the RTL of each power ramp (i.e., at hot state). Since melting is temperature dependent and modeled as reversible in the codes, no melting is predicted at the end of the power ramps after shutdown. The measurements can thus be compared only to the calculated results at maximum RTL. Three simulations of each power ramp were performed to study the impact of power uncertainty on melting (nominal power, for xM3, +5% and −5%, and for HBC4, +7% and −7%). Out of the 13 participating organizations, nine codes provided an evaluation of the melting radii.
The calculated axial profiles of the melting fuel radius from the HBC4 and xM3 simulations are reported in . The calculated melting radii at PPN accounting for the power uncertainty are given in , together with the corresponding fuel centerline temperatures. The estimates of the melting radii in both ramps, detailed in Sec. IV, are indicated by the black squares.
Fig. 16. Axial profiles of calculated melting radii at RTL compared to measurements.
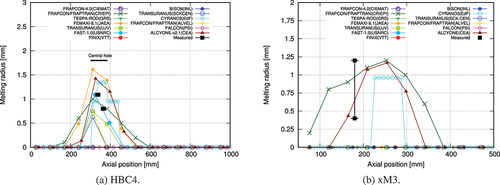
Fig. 17. Calculated melting fuel melting radii and centerline temperatures at PPN and RTL in the simulations of xM3 (power uncertainty 5%) and HBC4 (power uncertainty
7%).
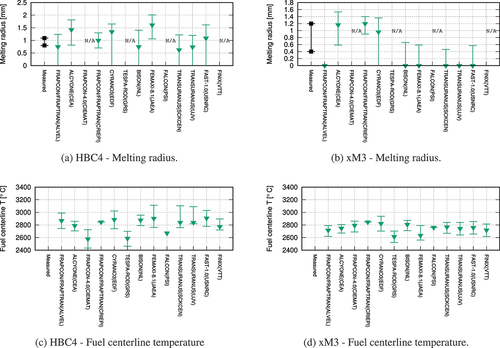
As can be seen in , all the codes that could provide an evaluation of the melt radius predict fuel melting during the HBC4 power ramp. The axial extension of melting varies from code to code, beginning at 180 mm/BFC and ending at 550 mm/BFC. The largest fuel melting radii are calculated in the region where the central hole was observed (300 to 400 mm/BFC). At nominal LHGR, the calculated fuel melting radius range is 0.5 to 1.4 mm while the measured fuel melting radius at 337 mm/BFC (CT2) is 1.1 mm. The calculated fuel melting radius range is 0.2 to 1.6 mm at 365 mm/BFC (CT1) while the measured fuel melting radius is 0.8 mm. The impact of power uncertainty on the calculated fuel melting radii is shown in for HBC4. An increase by 7% of the LHGR can lead to a factor up to 2 on the calculated fuel melting radius. When the power is decreased by 7%, melting is still predicted by three codes: ALCYONE, FRAPCON/FRAPTRAN (CRIEPI), and FEMAXI-8.
gives the calculated fuel centerline temperatures at RTL and at PPN during HBC4, with error bars indicating the sensitivity to power uncertainty. At nominal power, most of the codes evaluate a fuel centerline temperature around 2810°C, with a maximum at 2914°C and a minimum at 2578°C. The 7% uncertainty on the maximum LHGR leads for most of the codes to a temperature variation of
100°C. The FRAPCON/FRAPTRAN results by CRIEPI do not show any difference in the fuel centerline temperature due to the prescribed temperature threshold (2847°C).
presents the calculated axial profiles of the fuel melting radius during the simulation of the xM3 power ramp at nominal LHGR. The estimated radii from the experimental cross section are also reported. At nominal LHGR, most of the codes predict no melting. Three codes evaluate a fuel melting radius larger than zero: FRAPCON/FRAPTRAN (CRIEPI), ALCYONE, and CYRANO3. It should be recalled that the FRAPCON/FRAPTRAN results were tuned to fit well the experimental results. The axial extension of melting calculated by ALCYONE is 120 to 340 mm/BFC while CYRANO3 predicts melting between 210 and 300 mm/BFC. According to these codes, the axial extension of fuel melting is much larger than in HBC4, due to the flatter axial power profile.
is focused on the PPN location and accounts for the power uncertainty of 5%. With +5% on the nominal power, four more codes predict melting: BISON, FEMAXI-8, TRANSURANUS (SCK‧CEN), and FAST-1.0. Considering the calculations performed at +5%, the calculated fuel melting radius varies between 0.6 and 1.6 mm, in reasonable agreement with the experimental molten range of 0.4 to 1.2 mm. shows the predicted fuel centerline temperatures at PPN and at RTL, accounting for the power uncertainty. In the nominal LHGR calculations, the average calculated temperature is close to 2775°C, slightly lower than in the HBC4 ramp (2810°C), with a maximum at 2939°C and a minimum of 2616°C. Power uncertainty leads in most of the codes to a temperature variation of about
90°C. From the cross comparison of the calculated melting fuel radii and fuel centerline temperatures, no correlation can be identified between the two quantities. A higher calculated fuel temperature does not lead to a larger fuel melting radius because of the differences in the melting criteria implemented in the codes.
The only code providing an evaluation of the central hole radius is TRANSURANUS by SCK‧CEN. The model was developed for Sodium-Cooled Fast Reactors (SFRs). The mechanism driving its formation is the migration of pores induced by the high temperatures and thermal gradient. The model is applied here to PWR conditions. With the known uncertainty on the LHGR during the HBC4 power ramp, the calculated central hole radius at PPN and RTL varies between 0 and 0.33 mm. This calculation underestimates the central hole radius according to the measurements: 0.61 to 0.77 mm at 337 mm/BFC (CT2) and 0.31 to 0.38 mm at 365 mm/BFC (CT1). The underestimation may be related to the fact that the shrinkage of molten fuel upon cooling, detailed in Sec. IV, is not considered in this calculation. During the xM3 simulation, the calculated central hole radius is zero, compared with the measured value of 0.15 mm.
VII. DISCUSSION
Fuel melting has been mostly studied in the case of severe accidents driven by LOCA and RIA events.Citation56–58 These scenarios led to very different conditions compared to what is expected during the P2M experiments where the temperature rise and the evolution of the melting front in the fuel are much slower; the cooling capability is guaranteed during the entire irradiation, which ensures the extraction of the generated power; the staircase protocol limits the risk of clad failure due to stress relaxation. The localization and magnitude of melting are also significantly different: Melting is expected at the pellet periphery during a RIA (CitationRef. 57); molten fuel extrusion from the pellet center into pellet-pellet interfaces and into radial cracks down the temperature gradient can be expected in LOCA conditions when departure from nucleate boiling is reachedCitation58 (leading to very high clad temperatures). During a staircase power ramp without clad failure, melting fuel should remain confined at the pellet center due to the strong radial temperature gradient.
The P2M Simulation Exercise was organized to support the calibration of fuel performance codes up to fuel melting temperatures and consequently better pre-design the transient tests that are planned in the P2M program, as presented in Sec. II. One of the first questions that had to be addressed was the definition of the fuel melting radius from ceramographies. Both xM3 and HBC4 ceramographies presented central holes surrounded by a region of recrystallized dense fuel, having a characteristic grain size much larger than that of the as-fabricated fuel and containing some pores. Differences between xM3 and HBC4 microstructures were however observed. In xM3, few spherical pores were located in a ring of dense fuel surrounding the central hole, and this ring was itself surrounded by a pore-free band of highly dense fuel. In HBC4, the dense fuel ring contained larger spherical and pear-shaped pores, radially oriented. No pore-free band was observed. The origin of these marked differences is probably related to the different loading sequences and holding times at RTL used in the two power ramps.
In power-to-melt experiments of the 1960s, debate took place on whether the pore-free band should be included in the molten fuel region. Arguments against were given by Robertson et al.Citation3 based on numerous experiments at AECL. This definition was considered by Arimescu et al.Citation16 in their analysis of melting during xM3. The central hole was attributed to the sole shrinkage of the once molten fuel region upon cooling down. Later, several authors did however include this pore-free band in the definition of the fuel melting radius.Citation5,Citation21 One of the main conclusions of the Simulation Exercise is therefore that further work is required to better define what microstructure is really representative of fuel melting and how the power history impacts this microstructure. Consensus was reached among the participants on the occurrence of melting during both the xM3 and the HBC4 power ramps.
From the analysis of the fuel melting models implemented in the the participating codes (see Sec. V), it appears that fuel melting is related in most of the codes to the liquidus temperature. Also, the solidus and liquidus temperatures are often assumed equal when the Pu content is negligible, as in PWR fuel. Once this temperature is locally exceeded, the fuel material is considered as fully molten. In ALCYONE, thermodynamic calculations are used to precisely define the evolution of the liquid fuel fraction between the solidus and the liquidus temperatures, which may differ by a few tens of degrees Celsius depending on the fuel burnup. Melting initiation is thus related to the lower solidus temperature rather than to the liquidus temperature. Despite the differences observed among the calculated maximum fuel temperatures at RTL, all the codes capable of evaluating fuel melting agreed in predicting melting in the case of the HBC4 power ramp. Melting radii relatively consistent with the measurements range were also obtained by all the codes, even without accounting for the power uncertainty of 7%. The axial cross section of the HBC4 rod cut near the PPN (see ) showed a marked axial relocation of molten fuel, therefore indicating that the liquidus temperature was reached during the ramp. In this case, considering the sole liquidus temperature to assess melting appears sufficient to properly estimate the melting radius.
The simulations of the xM3 power ramp showed that only a few codes predicted melting at nominal power. This is consistent with the calculated temperatures that are lower by 40°C compared to HBC4. It must be recalled that the melting temperature as modeled in the involved codes decreases with burnup. Hence, a higher melting temperature is expected for xM3 compared to HBC4. Consequently, a correct estimation of the fuel melting radius in xM3 was provided by the codes only if the power uncertainty of
5% was taken into account, which leads to an increase of the maximum temperature by approximately 100°C. PIE did not include a neutronography of the xM3 rod or an axial cross section to look for irregularities in the central hole that would indicate molten fuel relocation. The microstructure presented in shows a well-defined and symmetric central hole that suggests that molten fuel relocation did not occur.
One possible explanation for the simulation results is that xM3 experienced partial fuel melting: The solidus temperature was reached but not the liquidus one. The thermodynamic-based approach proposed in ALCYONE behaved well for both ramps. The burnup dependency of melting is taken into account since FPs lower the solidus and the liquidus temperatures with respect to nonirradiated stoichiometric UO2. The good estimations of the melting fuel radii depend however on the liquid fuel fraction threshold considered for melting (10% in the simulations presented in this paper). Note that the liquidus temperature is not reached in the calculation of xM3 at nominal power with ALCYONE, which is consistent with the other code results.
A second possible explanation for the simulation results is that xM3 did not melt at all. The dense fuel layer may indeed have been the consequence of the sole pore migration mechanism at high temperature: The pores concentrate at the centerline leaving behind a region of highly dense fuel. Pore migration is a thermoactivated mechanismCitation22,Citation29 that can occur in PWR fuels at lower than melting powers.Citation59,Citation60 Recently, Novascone et al.Citation61 performed 2D simulations of central hole formation coupled to thermal analysis in irradiated UO2 fuel power ramped at 0.3, 3, and 30 , up to a peak LHGR of 50
. They showed that development of the central hole, favored during slow transients, significantly reduces the maximum fuel pellet temperature reached at the central hole boundary because of the increase in thermal conductivity in consequence of the fuel densification. In the same idea, De Halas and HornCitation4 have suggested that molten fuel solidification might take place at hot state in consequence of the fuel densification of the adjacent restructuring region. These results illustrate the importance of central hole formation kinetics and of the associated fuel densification with respect to fuel melting assessment in the planned P2M tests.
The proposed analysis so far assumes that the current code models are sufficient to correctly describe the evolution of the fuel during power transients up to high power levels. At the high temperatures reached during these loading sequences, another source of uncertainty concerns the material properties and especially the thermal conductivity, which is of course a first-order parameter with respect to the temperature in the fuel. This may also partially explain the difficulty in predicting fuel melting in the case of xM3. However, uncertainty on the material properties is expected to increase with the fuel burnup and should therefore have had more impact on HBC4. The uncertainty on the LHGR being higher for HBC4 (7%) than for xM3 (
5%), a similar conclusion holds on the impact of the LHGR on the fuel melting prediction.
Another aspect of interest for P2M is fuel melting detection and characterization by means of on-line instrumentation and advanced PIE. The simulations did not show any marked impact of fuel melting on the fuel rod performance: No temperature plateau induced by the latent heat of melting was observed in the HBC4 fast transient: no clear increase or decrease of the fuel or clad diameter upon melting in spite of the swelling associated to phase change, no fission gas burst release upon melting. As concluded during the Simulation Exercise workshop, the codes that have melting models implemented are not validated or are validated at lower powers than those of the cases studied here. It is therefore difficult to conclude in the absence of visible or measurable effects of fuel melting on the fuel rod thermal-mechanical behavior. This should be one of the outcomes of the P2M project where on-line instrumentation is planned.
VIII. CONCLUSIONS AND FUTURE WORK
The P2M Simulation Exercise on past fuel melting irradiation experiments was organized within the OECD/NEA FIDES framework by the Core Group (CEA, EDF, and SCK‧CEN) and opened to all FIDES members. Thirteen organizations from 9 countries using 11 different fuel performance codes joined the exercise. The objective was to help calibrating codes against high-temperature fuel behavior and improve fuel melting modeling in preparation of the power ramps planned in the P2M project. The exercise showed the importance of relying on accurate models for fuel melting thermal-mechanical modeling and fuel restructuring with central hole formation. Two past power transients were simulated by the participants:
xM3 staircase power ramp, very close to the irradiation protocol of the planned P2M ramps, where the rodlet showed signs of centerline fuel melting without cladding failure.
HBC4 fast power ramp, held in the BR2 reactor at SCK‧CEN, where future P2M ramps will take place, which led to fuel centerline melting with fuel axial relocation in the central hole and to clad failure.
From the simulation results and their comparison to numerous PIE, the following main conclusions can be drawn from the Simulation Exercise:
Determination of fuel melting occurrence from the microstructure of the fuel after power ramp tests is complex. The fuel melting radius is related to a sharp variation in microporosity in a region where dense fuel is formed, surrounding a central hole. The size and shape of the residual porosity depend on the loading history of the rodlet during the ramp. The inclusion or not in the molten fuel zone of a pore-free band that sometimes appears in ceramographies of power-to-melt fuel samples is debatable.
Modeling of fuel melting and of its consequences on the thermomechanical behavior of the rod and on fission gas transport mechanisms during power ramps in fuel performance codes presents strong simplifications with respect to the complex microstructure observed in fuel pellets where melting took place.
Codes using a single temperature criterion based on the liquidus temperature provide consistent evaluations of the fuel melting radii when the liquidus temperature is clearly exceeded (as deduced from the simulations of the HBC4 case, where clear signs of molten fuel axial relocation were reported).
Partial fuel melting appears more difficult to reproduce as shown by the simulations of the xM3 power ramp. The liquidus temperature is in this case not sufficient to model the phenomenon. A thermodynamic-based approach used to evaluate the solidus temperature and the evolution of the liquid fuel fraction up to the liquidus temperature showed to be a promising way to improve the modeling of melting in this case.
Future studies are required for the following:
To better assess experimentally what are the consequences of melting on the fuel microstructure and how the loading sequence and the holding time have an impact on its evolution.
To improve the understanding of the link between the formation of the central hole, the consequent fuel densification, and fuel melting initiation.
To couple fuel melting with the thermomechanical properties of the material and with fission gas transport mechanisms in order to evaluate the impact of melting on the fuel rod on-line measurable data (e.g., fuel and cladding strains, elongation, internal pressure).
To determine the impact of uncertainties on the relevant material properties (e.g., thermal conductivity, melting temperature, etc.) with respect to melting assessment.
To reduce the dispersion of calculated melt radii between the codes. On this aspect, one solution could be to use the power ramp simulations to recommend a melting temperature/criterion that would then be implemented in all the codes.
Acknowledgments
The authors would like to acknowledge MNF, Studsvik, the SCIP II community, and SCK‧CEN for the extensive data used during this Simulation Exercise on the xM3 and HBC4 power ramps in the frame of the FIDES/P2M JEEP. The reviewers are also greatfully acknowledged for their numerous comments and corrections that have significantly improved the content of this paper.
Disclosure Statement
No potential conflict of interest was reported by the author(s).
References
- OECD/NEA FIDES website, Organisation for Economic Co-operation and Development, Nuclear Energy Agency; https://oecd-nea.org/jcms/pl_15313/framework-for-irradiation-experiments-fides.
- A. BAIN, “The Heat Rating Required to Produce Central Melting in Various UO2 Fuels,” Proc. Symp. Radiation Effects in Refractory Fuel Compounds, ASTM International (1962).
- J. ROBERTSON et al., “Temperature Distribution in UO2 Fuel Elements,” J. Nucl. Mater., 7, 3, 225 (1962); https://doi.org/10.1016/0022-3115(62)90243-X.
- D. DE HALAS and G. HORN, “Evolution of Uranium Dioxide Structure During Irradiation of Fuel Rods,” J. Nucl. Mater., 8, 2, 207 (1963); https://doi.org/10.1016/0022-3115(63)90036-9.
- M. FRESHLEY, “Operation with Fuel Melting,” Nucl. Eng. Des., 21, 2, 254 (1972); https://doi.org/10.1016/0029-5493(72)90076-3.
- J. JOSEPH, J. ROYER, and M. GROSGEORGE, “Transient Behaviour of Fragema Fuel Rods Previously Irradiaited Under Commerical Reactor Operating Conditions,” Proc. Topl. Mtg. LWR Fuel Performance, Williamsburg, Virginia, 1988, p. 17, American Nuclear Society (1988).
- R. VAN NIEUWENHOVE and S. SOLSTAD, “In-Core Fuel Performance and Material Characterization in the Halden Reactor,” IEEE Trans. Nucl. Sci., 57, 2683 (2010); https://doi.org/10.1109/TNS.2010.2050701.
- B. BOER and M. VERWERFT, “Qualification of the New Pressurized Water Capsule (PWC) for Fuel Testing at BR2,” Proc. European Research Reactor Conf. (RRFM 2021), Helsinki, Finland, September 26–30, 2021, European Nuclear Society (2021).
- B. MICHEL et al., “Simulation of Pellet-Cladding Interaction with the PLEIADES Fuel Performance Software Environment,” Nucl. Technol., 182, 2, 124 (2013); https://doi.org/10.13182/NT13-A16424.
- J. SERCOMBE et al., “Modelling of Pellet Cladding Interaction,” Comprehensive Nuclear Materials, R. KONINGS and R. STOLLER, Eds., Elsevier, Oxford (2020).
- B. MICHEL et al., “Two Fuel Performance Codes of the PLEIADES Platform: ALCYONE and GERMINAL,” Nuclear Power Plant Design and Analysis Codes, p. 207, Elsevier (2021).
- A. MAGNI et al., “The TRANSURANUS Fuel Performance Code,” Nuclear Power Plant Design and Analysis Codes, p. 161, Elsevier (2021).
- D. BARON et al., “CYRANO3: The EDF Fuel Performance Code Especially Designed for Engineering Applications,” Proc. Water Reactor Fuel Performance Meeting (WRFPM 2008), Seoul, Korea, 2008, Paper No. 8032.
- R. LARGENTON and G. THOUVENIN, “CYRANO3: The EDF Fuel Performance Code—Global Overview and Recent Developments on Fission Gas Modelling,” Proc. Water Reactor Fuel Performance Meeting (WRFPM 2014), Sendai, Japan, September 14–17 2014, Paper No. 100032.
- U. ENGMAN, “Step Ramp Test of the PWR Test Rod xM3 with ZIRLO Radial Texture,” Technical Report 146, STUDSVIK-SCIP-II (2012).
- V. ARIMESCU et al., “Third SCIP Modeling Workshop: Beneficial Impact of Slow Power Ramp on PCI Performance,” Proc. Water Reactor Fuel Performance Meeting (WRFPM 2014), Sendai, Japan, September 14–17 2014, Paper No. 100045.
- P. BLANPAIN, “HBC Task 3 Power-to-Melt Experiment,” HBC 89/10 (1989).
- G. BONNY et al., “Re-Evaluation of a Power-to-Melt Experiment Performed in the High Burnup Chemistry International Program,” Nucl. Technol. (October 2022) ( submitted for publication).
- H.-U. ZWICKY, “Post-Irradiation Examinations of Ramped Rodlets xM1,xM2 and xM3,” Technical Report 140, STUDSVIK-SCIP-II (2012).
- V. D’AMBROSI et al., “Presentation of the xM3 Test Case of the P2M Simulation Exercise and Modeling with the Fuel Performance Code ALCYONE” (Dec. 2022) (in preparation).
- M. INOUE et al., “Power-to-Melts of Uranium–Plutonium Oxide Fuel Pins at a Beginning-of-Life Condition in the Experimental Fast Reactor JOYO,” J. Nucl. Mater., 323, 1, 108 (2003); https://doi.org/10.1016/j.jnucmat.2003.08.030.
- P. SENS, “The Kinetics of Pore Movement in UO2 Fuel Rods,” J. Nucl. Mater., 43, 3, 293 (1972); https://doi.org/10.1016/0022-3115(72)90061-X.
- R. BAKER and R. LEGGETT, “Early-in-Life Thermal Performance of UO2–PuO2 Fast Reactor Fuel,” Hanford Engineering Development Laboratory (1979).
- D. FREUND, D. GEITHOFF, and H. STEINER, “Evaluation of the Power-to-Melt Experiments POTOM,” J. Nucl. Mater., 204, 228 (1993); https://doi.org/10.1016/0022-3115(93)90221-J.
- I. VANCE and P. MILLETT, “Phase-Field Simulations of Pore Migration and Morphology Change in Thermal Gradients,” J. Nucl. Mater., 490, 299 (2017); https://doi.org/10.1016/j.jnucmat.2017.04.027.
- R. SCHUSTER and W. ZIMMERER, “Darstellung der stoffdaten des systems MAPLIB in tabellarischer und graphischer form,” KFK 1792, Gesellschaft für Kernforschung mbH (1973).
- A. MAGNI et al., “Modelling and Assessment of Thermal Conductivity and Melting Behaviour of MOX Fuel for Fast Reactor Applications,” J. Nucl. Mater., 541, 152410 (2020); https://doi.org/10.1016/j.jnucmat.2020.152410.
- A. MAGNI et al., “Modelling of Thermal Conductivity and Melting Behaviour of Minor Actinide-MOX Fuels and Assessment Against Experimental and Molecular Dynamics Data,” J. Nucl. Mater., 557, 153312 (2021); https://doi.org/10.1016/j.jnucmat.2021.153312.
- V. DI MARCELLO et al., “Modelling Actinide Redistribution in Mixed Oxide Fuel for Sodium Fast Reactors,” Prog. Nucl. Energy, 72, 83 (2014); https://doi.org/10.1016/j.pnucene.2013.10.008.
- K. GEELHOOD et al., “FRAPCON-4.0: A Computer Code for the Calculation of Steady-State, Thermal-Mechanical Behavior of Oxide Fuel Rods for High Burnup,” PNNL-19418, Pacific Northwest National Laboratory (2015).
- K. GEELHOOD et al., “FRAPTRAN-2.0: A Computer Code for the Transient Analysis of Oxide Fuel Rods,” PNNL-19400, Rev.2, Pacific Northwest National Laboratory (2016).
- D. HAGRMAN, G. REYMANN, and G. MASON, “MATPRO-Version11, A Handbook of Materials Properties for Use in the Analysis of Light Water Reactor Fuel Rod Behavior,” NUREG/CR-0497, TREE-1280, Rev.3, Idaho National Engineering Laboratory (1979).
- W. LUSCHER and K. GEELHOOD, “Material Property Correlations: Comparisons Between FRAPCON-3.4, FRAPTRAN 1.4, and MATPRO,” PNNL-19417, Pacific Northwest National Laboratory (2010).
- “FAST Fuel Performance Code”; https://fast.labworks.org/.
- K. GEELHOOD et al., “MatLib-1.0: Nuclear Material Properties Library,” PNNL 29728, Pacific Northwest National Laboratory (2020).
- H. LOUKUSA, J. PELTONEN, and V. VALTAVIRTA, “FINIX—Fuel Behavior Model and Interface for Multi-Physics Applications—Code Documentation for Version 1.19.1,” VTT-R-00052-19, VTT Technical Research Centre of Finland (2019).
- L. JERNKVIST and A. MASSIH, “Assessment of Core Failure Limits for Light Water Reactor Under Reactivity Initiated Accidents,” Technical Report 2005:16, Swedish Nuclear Power Inspectorate (2004).
- OpenCalphad Software website; http://www.opencalphad.com/.
- C. INTRONI, J. SERCOMBE, and B. SUNDMAN, “Development of a Robust, Accurate and Efficient Coupling Between PLEIADES/ALCYONE 2.1 Fuel Performance Code and the OpenCalphad Thermo-Chemical Solver,” Nucl. Eng. Des., 369, 110818 (2020); https://doi.org/10.1016/j.nucengdes.2020.110818.
- “Thermodynamics Advanced Fuels—International Database,” Organisation for Economic Co-operation and Development, Nuclear Energy Agency (2013); https://www.oecd-nea.org/science/taf-id/.
- A. CHAIEB et al., “Computational Assessment of LOCA Simulation Tests on High Burnup Fuel Rods in Halden and Studsvik Using CYRANO3 Code,” Proc. TopFuel, Santander, Spain, 2021.
- “TESPA-ROD Code”; https://www.grs.de/en/research-and-assessment/reactor-safety/tespa-rod-temperature-strain-and-pressure-analysis-fuel-rod.
- Y. UDAGAWA and M. AMAYA, “Model Updates and Performance Evaluations on Fuel Performance Code FEMAXI-8 for Light Water Reactor Fuel Analysis,” J. Nucl. Sci. Technol., 56, 6, 461 (2019); https://doi.org/10.1080/00223131.2019.1595766.
- J. CHRISTENSEN, “Stoichiometry Effects in Oxide Nuclear Fuels. I. Power Rating Required for Melting and Oxygen Redistribution in Molten Center of UO2±x Fuels,” Battelle-Northwest, Pacific Northwest Laboratory (1967).
- S. YAMANOUCHI et al., “Melting Temperature of Irradiated UO2 and UO2-2wt%Gd2O3 Fuel Pellets up to Burnup of About 30 GWd/tU,” J. Nucl. Sci. Technol., 25, 6, 528 (1988); https://doi.org/10.1080/18811248.1988.9733625.
- R. WILLIAMSON et al., “Multidimensional Multiphysics Simulation of Nuclear Fuel Behavior,” J. Nucl. Mater., 423, 1–3, 149 (2012); https://doi.org/10.1016/j.jnucmat.2012.01.012.
- S. YAGNIK et al., “Fuel Analysis and Licensing Code: FALCON MOD01, Volume 1: Theoretical and Numerical Base,” Technical Report 1011307, Electric Power Research Institute (2004).
- Nuclear Fuel Industry Research Program; https://www.epri.com/portfolio/programs/108031.
- G. KHVOSTOV, “Modeling of Central Void Formation in LWR Fuel Pellets Due to High-Temperature Restructuring,” Nucl. Eng. Technol., 50, 7, 1190 (2018); https://doi.org/10.1016/j.net.2018.07.003.
- J. CHRISTENSEN, “Irradiation Effects on Uranium Dioxide Melting,” General Electric Company Hanford Atomic Products Operation (1962).
- M. ADAMSON, E. AITKEN, and R. CAPUTI, “Experimental and Thermodynamic Evaluation of the Melting Behavior of Irradiated Oxide Fuels,” J. Nucl. Mater., 130, 349 (1985); https://doi.org/10.1016/0022-3115(85)90323-X.
- J. J. CARBAJO et al., “A Review of the Thermophysical Properties of MOX and UO2 Fuels,” J. Nucl. Mater., 299, 3, 181 (2001); https://doi.org/10.1016/S0022-3115(01)00692-4.
- A. GERMAIN et al., “Modeling High Burnup Fuel Thermochemistry, Fission Product Release and Fuel Melting During the VERDON 1 and RT6 Tests,” J. Nucl. Mater., 561, 153527 (2022).
- C. GUÉNEAU et al., “TAF-ID: An International Thermodynamic Database for Nuclear Fuels Applications,” Calphad, 72, 102212 (2021); https://doi.org/10.1016/j.calphad.2020.102212.
- J. FINK, “Thermophysical Properties of Uranium Dioxide,” J. Nucl. Mater., 279, 1, 1 (2000); https://doi.org/10.1016/S0022-3115(99)00273-1.
- B. LEWIS et al., “Overview of Experimental Programs on Core Melt Progression and Fission Product Release Behaviour,” J. Nucl. Mater., 380, 1, 126 (2008); https://doi.org/10.1016/j.jnucmat.2008.07.005.
- L. JERNKVIST, “Computational Assessment of Burnup-Dependent Fuel Failure Thresholds for Reactivity Initiated Accidents,” J. Nucl. Sci. Technol., 43, 5, 546 (2006); https://doi.org/10.1080/18811248.2006.9711133.
- P. MACDONALD et al. “Response of Unirradiated and Irradiated PWR Fuel Rods Tested Under Power-Cooling-Mismatch Conditions,” Nucl. Saf., 19, 4.
- J. ARBORELIUS et al., “Advanced Doped UO2 Pellets in LWR Applications,” J. Nucl. Sci. Technol., 43, 9, 967 (2006); https://doi.org/10.1080/18811248.2006.9711184.
- C. NONON et al., “PCI Behaviour of Chromium Oxide-Doped Fuel,” Proc. Pellet-Clad Interaction in Water Reactor Fuels, Aix-en-Provence, France, 2004, p. 305 (2004).
- S. NOVASCONE et al., “Modeling Porosity Migration in LWR and Fast Reactor MOX Fuel Using the Finite Element Method,” J. Nucl. Mater., 508, 226 (2018); https://doi.org/10.1016/j.jnucmat.2018.05.041.
- A. MARION, Nuclear Energy Institute, Letter to to H. N. BERKOW, U.S. Nuclear Regulatory Commission/Office of Nuclear Reactor Regulation, Safety Evaluation by the Office of Nuclear Reactor Regulation of Electric Power Research Institute (EPRI) Topical Report TR-1002865, “Topical Report on Reactivity Initiated Accidents: Bases for RIA Fuel Rod Failures and Core Coolability Criteria” (June 13, 2006); https://www.nrc.gov/docs/ML0616/ML061650107.pdf.
- J. TURNBULL, “An Empirical Model of UO2 Thermal Conductivity Based on Laser Flash Measurements of Thermal Diffusivity,” TR-111347, Electric Power Research Institute (1998).
- K. OHIRA and N. ITAGAKI, “Thermal Conductivity Measurements of High Burnup UO2 Pellet and a Benchmark Calculation of Fuel Center Temperature,” Proc. Int. Topl. Mtg. Light Water Reactor Fuel Performance, Portland, Oregon, 1997, p. 541, American Nuclear Society (1997).
- J. KAMIMURA et al., “Thermal and Mechanical Behavior Modeling for High Burnup Fuel,” Proc. Water Reactor Fuel Performance Mtg., Seoul, Korea, 2008.
APPENDIX A
COLD GAP MEASUREMENT
To estimate the pellet-clad residual gap, the rod is compressed between two parallel plates. The experimental setup at the beginning of the compression test is represented schematically in . The load and plate displacement are recorded during the test. The measurements are corrected for the compliance of the setup and for the cladding elasticity. The residual gap is arbitrarily defined as the displacement when the load reaches a specific value . The load is then further increased until the pellet fragments are pressed together, thus minimizing the contribution from pellet cracks to the gap. The displacement measured at the same specific value
during the unloading phase defines the relocated gap.
Fig. A.1 Setup for the gap measurements.
APPENDIX B
PARTICIPATING CODES AND MODELING SPECIFICATIONS
Details and references when available on the models relative to fuel melting are given in and . It is important to stress that no code is validated beyond the melting temperature.
TABLE B.I Main Models and Criteria in the Codes
TABLE B.II Main Models for Fuel Melting in the Codes*