
 ?Mathematical formulae have been encoded as MathML and are displayed in this HTML version using MathJax in order to improve their display. Uncheck the box to turn MathJax off. This feature requires Javascript. Click on a formula to zoom.
Abstract
Previous research has shown that multi-principal element alloys (MPEAs) using chromium, molybdenum, niobium, tantalum, titanium, vanadium, and zirconium can form stable body-centered-cubic (BCC) structures across a large temperature region (25°C to 1000°C). This is the same crystal structure as γ-uranium (U), which has shown desirable thermal and irradiation behavior in previous alloy fuel research. It is hypothesized then that the MPEA alloying approach can be used to produce a stable BCC uranium-bearing alloy and to retain its stability throughout anticipated operating regimes of power-producing reactors. Candidate elements were assessed using Monte Carlo N-Particle (MCNP) analysis to determine uranium densities necessary to make the alloy an economically viable fuel compared to conventional fuel forms. Following neutronic considerations, materials property databases and empirical predictors were used to determine the compositions with a high potential to form a BCC solid solution alloy. The final four alloys were MoNbTaU2, MoNbTiU2, NbTaTiU2, and NbTaVU2, which were cast using arc melting of raw elemental foils and chunks. Characterization of the fabricated alloys included scanning electron microscopy, X-ray diffraction, energy dispersive X-ray spectroscopy, and transmission electron microscopy. The results showed a two-phase system with a U-rich matrix phase surrounding the refractory precipitates. The U phase was found to contain varying concentrations of the alloying elements and was a BCC γ-U phase. These results warrant further research to identify ideal compositions for use as an advanced alloy fuel.
I. INTRODUCTION
Alloy fuels are of significant interest for many advanced reactors because of their high heavy metal density, good thermal conductivity, and generally good compatibility with coolants. Historically, alloy fuel is made as a dilute alloy by mixing small quantities of either Zr or Mo with U and sometimes Pu (e.g., U-10Zr or U-10Mo, weight percent).[Citation1–3] One drawback with these alloy fuels is the relatively high swelling rates and inability to retain fission gas and products within the fuel matrix. This has been shown to cause excess stresses upon the cladding and eventual cladding failure.[Citation4]
However, alloy fuel swelling is not as prevalent for many research reactors using U-Mo fuel. This is due to the combined effects of the relatively low temperature of the reactor core and irradiation causing the body-centered-cubic (BCC) structure of the U-Mo (γ phase) to remain stable.[Citation5] The BCC stable fuel then produces a superlattice of fission gas bubbles that inhibit swelling and provide excellent shape retention (an important behavior for plate form fuels).[Citation6] This metastable phase is lost when irradiated at higher temperatures (>400°C),[Citation7] such as those of a sodium fast reactor (SFR), as the material eventually transforms into a mix of orthorhombic and tetragonal structures and becomes subject to rampant swelling, thus rendering U-Mo fuels less desirable for higher-temperature applications.
It is postulated that if an alloy fuel can be kept in the γ phase from room temperature all the way through the elevated operating temperatures of an SFR, then the fuel may also exhibit the same fission gas retention behavior and low swelling behavior that U-Mo exhibits at lower operating temperatures. This reduction in swelling is highly desirable since it would alleviate many of the mechanical interactions and much of the strain on the cladding allowing the fuel to be used to very high burnup levels that exceed those of existing SFR fuels (i.e., U-10Zr).
Previous research by Zhou et al.[Citation8] has suggested that ternary alloys of U-Nb-Zr have the potential to remain in a stable γ phase at temperatures below 400°C. This is a very promising result because it suggests that the U-Nb-Zr alloys can retain a stable γ phase for extended temperature ranges beyond that of U-Mo alloys. Some experimental work has been completed on this alloy system and U0.22Zr0.2Nb0.58 alloys as a burnable matrix, and the alloy was shown to make a homogenized BCC solid solution at room temperature.[Citation9] However, the window of stability is compositionally restrained at desired temperatures, and if used as a fuel, the eventual burnup of the U and introduction of solid fission products could force the fuel into a multi-phase intermetallic system that would likely compromise any fission gas benefits. Additionally, the low uranium fraction makes this material unfeasible as a primary fuel system, and so, a higher uranium fraction is necessary to be used as a potential driver fuel.
This has prompted investigations into less conventional metallurgical approaches such as embracing the multi-principal element alloy (MPEA) motif for producing advanced alloy fuels. As previously mentioned, alloying elements for U alloy fuels have emphasized Zr and Mo with some additional work including Ti.[Citation10] These have all been popular elements in the refractory MPEA research community, and many works have presented successful alloying of these into a BCC system of three-, four-, and five-component alloys.[Citation11–16] The benefit of increasing the complexity of the alloy system using a mixture of Mo, Nb, Ta, Ti, V, or Zr with U is that the probability of producing a stable high-temperature γ-phase system increases due to the entropy term in the free energy dominating the formation enthalpy of intermetallic formation. This system could then provide both the advantages of the low-temperature U-Mo fuels and that of many presumed behaviors of MPEAs, such as sluggish diffusion and irradiation tolerance, which would improve fission product retention within the fuel.
It was also postulated that by taking advantage of the MPEA/high entropy alloy motifs, like sluggish diffusion, these fuel alloys would lend themselves to even better fission gas retention and may inhibit the movement of solid fission products (e.g., lanthanides) that are known to induce cladding wastage through fuel-cladding chemical interactions.[Citation17] By reducing the wastage and stresses imposed upon the cladding, these fuels would be hugely beneficial for extending the burnup limits for alloy fuels in SFRs or enabling alloy fuels for use in other high-temperature reactors (e.g., gas-cooled reactors). Additionally, improved high-temperature mechanical properties could improve overall fuel behavior by further resisting creep and swelling and allowing an increase in the outlet temperatures, thus improving the efficiency.
The concept of a uranium-bearing MPEA is not entirely novel and has recently been investigated with limited success by several groups. Shi et al. investigated arc melting of UMoNbTaHf and UMoNbTaTi and showed that it formed a solid solution alloy with single and dual BCC phase systems, respectively, at room temperature.[Citation18] However, whether the BCC phase is stable or metastable is unknown, and no post-casting heat treatments were performed. In addition, the use of Hf is undesirable for a fuel due to the neutronic penalty it would incur (Hf has a very high absorption cross section). Thus, further work on this should also consider more nuclear-related criteria such as neutronic economy.
Additional work was done by Huang et al. on determining potential uranium-bearing alloys using a series of empirical relations and predictors.[Citation19] In this work, the authors attempted to identify potential solid solution alloys formed as four- and five-component systems with a broad range of compositions. Both of these works have referenced the utility of such an alloy as a fuel but failed to consider any basic neutronic evaluations during the alloy determination process. This has resulted in the consideration of equiatomic alloys where heavy metal density is comparatively low compared to conventional fuels. This is problematic as it would require these alloys to be highly enriched, which poses proliferation risks. Additionally, the alloys have included elements not desirable within the fuel such as hafnium.
II. METHODS
Given the wide breadth of alloying element options, alloy determination was done through a series of calculated property assessments and neutronic analyses. Property calculations were performed using databases from the Materials Project and featurizing through the WenAlloy featurizer.[Citation20,Citation21] Features focused upon in this determination include the Yang omega and delta values,[Citation22] atomic radii mismatch, configurational entropy, and electronegativity. Potential elements used in this analysis include Cr, Mo, Nb, Ta, Ti, V, and Zr based upon the history of these elements being used in BCC MPEA development.
II.A. Alloy Design
A neutronic analysis was also performed using the Monte Carlo N-Particle (MCNP) transport code (version 6.2),[Citation23] where simplified models were utilized to simulate the burnup of different uranium alloys in an EBR-II irradiation environment over the span of 300 days.[Citation24] The models utilized a novel low-order methodology that emulates any irradiation environment with a volumetric neutron source superimposed on the entire fuel sample/rod geometry.[Citation25] The source distributes neutrons homogenously throughout the fuel with energies per a normalized neutron flux spectrum in an EBR-II driver fuel element.[Citation24] The normalization of the spectrum is done to extract neutron energy probabilities as explained in literature.[Citation25]
In total, 147 different uranium alloys were simulated with seven distinct 235U enrichments ranging from 0.72% to 20%, where each of the elements (Cr, Mo, Nb, Ta, Ti, V, and Zr) was simulated at 22, 50, and 80 at. % in the alloy. Each simulation assumed a fixed sample size consistent with the geometry of driver fuel in EBR-II,[Citation26] and each simulation was performed with 25 million histories for improved statistical convergence in the Monte Carlo results (relative error 5%).
The neutronic analyses investigated the relative impact of potential alloying elements on fuel power density and on the changes to fuel power as a function of alloying concentrations. The power of each sample is computed using flux mesh tallies with flux multipliers that enable the derivation of power per the MCNP 6.2 manual.[Citation23] The usage of mesh tallies allows for more detailed tracking of the power throughout each sample and enables the derivation of radial and axial power peaking factors. Note that theoretical density and a fundamental flux shape are assumed for each of the cylindrical samples simulated in this work.
II.B. Fabrication
After alloy composition was determined, the alloys were fabricated using arc-melting methods. This was consistent with the methods of many MPEAs within literature as arc melting is anticipated to provide the most chemically homogenous alloy due to rapid liquid metal mixing but with the highest potential of yielding a metastable alloy due to the rapid quenching. In some cases, powder metallurgy [e.g., spark plasma sintering (SPS)] has been used to fabricate MPEAs.[Citation27,Citation28] However, SPS is expected to provide a highly consolidated alloy but with reduced chemical homogenization due to the slower diffusion processes in the powders and with a lower potential for forming metastable phases due to the more moderate cooling times.[Citation29]
Thus, the alloys were fabricated using arc-melting methods in order to best ensure the best mixing and opportunity for a γ-U alloy. The alloying elements were obtained commercially as high-purity foils and were melted with depleted uranium in a Material Research Furnaces ABJ-900-3-VM-02 Tri-Arc Melt Furnace. Each sample was melted in a copper hearth and held in a melt for ~10 to 20s to homogenize when in the liquid phase. When cooling, the water-cooled hearth instituted rapid cooling on the bottom of the buttons, but slower cooling occurred at the top of the button, which was observable in scanning electron microscopy (SEM) micrographs shown below. Cooling water is kept at room temperature, and buttons solidify within a second. Buttons are left to ambiently cool for 20 min before being flipped for remelting and cooling. Each button is flipped and melted four times to ensure homogeneity.
II.C. Characterization
Samples were characterized using SEM and X-ray diffraction (XRD). The scanning electron microscope used was a JEOL JSM-IT500HR scanning electron microscope equipped with an Oxford Instruments ULTIM MAX 65-mm2 energy dispersive X-ray spectroscopy (EDS) detector. The X-ray diffractometer used was from Panalytical Empyrean using a copper K-α source (wavelength 1.5406 Å) in Bragg-Brentano geometry. Scans were taken from 20 to 120 deg 2θ at a counting time of 200 s/step. Reitveld analysis of the XRD patterns was performed using GSAS-II[Citation30] with a NIST 1976a (Standard Reference Material 1976a: Instrument Response Standard for X-Ray Powder Diffraction) corundum standard for establishing instrument parameters.
All four alloys had lamellae lifted out for transmission electron microscopy (TEM)/scanning transmission electron microscopy (STEM) analysis using an FEI Quanta three-dimensional scanning electron microscope/focused ion beam. The MoNbTiU2 lamella was then examined using a Thermo Scientific Talos F200X scanning electron microscope while the MoNbTaU2, NbTaTiU2, and NbTaVU2 lamellae were examined using a Thermo Scientific Titan Themis G2 200 scanning transmission electron microscope equipped with a Super-X EDS system (STEM-EDS). Both transmission electron microscopes operate at 200-keV accelerating voltages. Elemental quantification of all samples was performed using the EDS results and the Thermo Scientific VeloxTM software.
III. RESULTS
III.A. Material Design
There were some basic premises that needed to be maintained to justify the exploration of an MPEA fuel. The first was that alloying elements needed to minimize any negative impact on the neutron economy of the core. The second premise was that it needed to be prone to stabilizing BCC structures or have a documented history of being in BCC solutions (e.g., Ti, while not a BCC stabilizing element, is commonly featured in BCC MPEAs). Potential alloying element determination focused on which elements have a reasonably low total cross section () and whether the element is prone to stabilizing BCC structures. These elements and their cross sections are shown in along with zirconium, which, while it is not a BCC stabilizing element, is included for neutronic comparison based upon its prevalence in conventional alloy fuels and is commonly found in BCC MPEA systems.
TABLE I Cross-Section Data Used for Comparing Elements*
The drawback for any potential uranium-bearing MPEA would be the heavy metal dilution compared to conventional alloy fuels like U-10Zr (10 wt%, ~22 at. % Zr). The uranium density for U-10Zr is approximately 14 g/cm3. However, a five-component equimolar alloy has an estimated uranium density of 0.018 mol/cm3, or about one-third that of the conventional alloy. Using MCNP, alloying concentrations were compared with varying enrichments in order to determine the relative power factors between low-enriched uranium (LEU) (~5% 235U) and high-assay low-enriched uranium (HALEU) (<20% 235U).
The peak power factor (PPF) was first evaluated at 5% 235U for average power, radial power at the axial centerline, and axial power at the radial centerline in accordance with EquationEqs. (1)(1)
(1) , (Equation2
(2)
(2) ), and (Equation3
(3)
(3) ):
The results of these are shown in for each element at three different alloying percentages (20, 50, and 80 at. %). What is shown is that in spite of the variations in cross sections for each element chosen, the total impact on the rodlet power factors was relatively small. This is useful given that there are well over a thousand alloying combinations that could be evaluated, but the use of a single element can be representative enough to determine comparative power. Thus, neutronic comparison for various enrichment and complex alloys can be reasonably estimated using only a single element, such as zirconium.
TABLE II Tabulation of PPFs for Each Element at Varying Concentrations Using EquationEqs. (1)(1)
(1) , (Equation2
(2)
(2) ), and (Equation3
(3)
(3) )*
Following this result, a comparison of enrichments and alloying concentrations was made using 1%, 5%, 10%, 15%, and 19.75% 235U in a U-Zr alloy. The resulting radial power profiles are summarized in and plots included in the supplemental material. These results provide a perspective of potential enrichment needs for increased alloy concentrations. The results demonstrate that an increase in the alloying element’s concentration reduces the power of the alloy due to the relative reduction of fissile content in the alloy. This can however be counteracted with an increase in enrichment, where an alloy with 50% Zr can yield similar power behavior to one with 22% Zr content if the 235U enrichment is increased by a factor of 3. For an originally LEU fuel, this is feasible as an increase from 5% to 15% enrichment still maintains an LEU standing, but for HALEU (19.75% enrichment as an example), this sort of increase in Zr content will require a conversion from LEU to HEU to maintain the same power density. As a rule of thumb, it is found that the peak power of any of the alloys increases exponentially with increasing enrichment at a factor of 0.098 ± 0.002. Similarly, the peak power of any of the alloys decreases exponentially with increasing alloy concentration (in atomic percent) at a factor of 0.044 ± 0.003. It then becomes convenient to estimate that for every ~2.5 at. % increase in an alloy constituent, the 235U enrichment must increase by ~1% to maintain the same power density.
TABLE III Comparison of the Peak Power Within a Test Rodlet Between Enrichment and Alloying Element Content*
To determine alloy limitations, the power factors are balanced with an assessment of heavy metal density in current fuel forms and a 25% U complex alloy and 40% U complex alloy (denoted as M3U and M3U2, where M is a combination of three equimolar elements). The resulting U density comparison is shown in . Comparisons among conventional fuels, UO2, UC, and TRISO-UCO kernels, and the M3U and M3U2 alloys are shown in . The uranium density of the TRISO kernel is evaluated as a complete TRISO kernel with the pyrolytic carbon, SiC, and buffer material factored into the density.
Fig. 1. Radar map of (a) uranium density in various fuel types by comparing the moles of U per cubic centimeter, (b) burnup limit in terms of percent fissions per initial heavy metal atom, and (c) burnup limit in terms of fissions per cubic centimeter. A MoNbVU or MoNbVU2 alloy is used as a representative alloy or for the U-MPEA consideration of M3U2 and M3U.
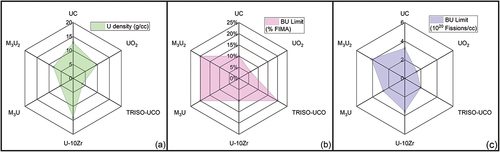
also compares potential burnup limits of the fuels. The burnup limit for UC is estimated at approximately 10 percent fissions per initial heavy metal atom (%FIMA). The burnup limit for U-10Zr utilizes the Mark-III driver fuel limit for EBR-II of 10 %FIMA,[Citation32] and the limit for UO2 is based on a 60 MWd/kg U limit used by commercial fuel within the United States The limit used for TRISO-UCO is estimated at a full burnup of the 19.75% 235U enrichment. It is postulated that if the fission gas swelling behavior of an M3U or M3U2 alloy were to be like that of low-temperature U-Mo, then a burnup limit near 6 × 10²⁰ fissions/cm3 could be achieved; however, that would exceed the enrichment level for a HALEU fuel, and so, the burnup limit is estimated at 19.75 %FIMA. What is significant in this is that the M3U2 alloys have the potential of being a high-density fuel with high-burnup limits, making it a competitive fuel concept for long-lived compact core designs.
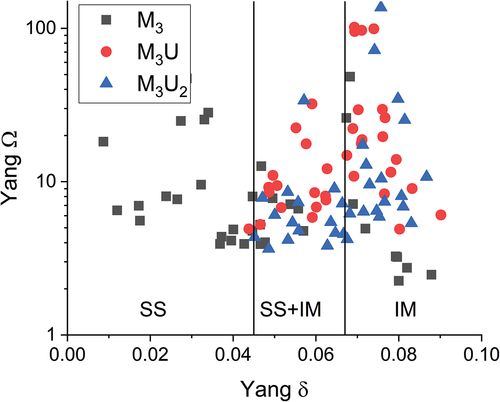
The power factor and U density comparison shows that there is potential for an MPEA fuel utilizing high-assay enrichment and an M3U2 composition. This result was fed into the next stage of alloy determination where empirical alloying rules for multi-component alloys and thermodynamic principles were used to downselect the three alloy elements to be investigated. Alloying elements considered the valence electron count rule[Citation33] and a comparison between the Yang omega factor and radial mismatch delta[Citation22]; see . The values for the Ω factor were all consistently above 1, suggesting that the configurational entropy should be suffcient to overcome intermetallic enthalpies in all alloys. However, the atomic mismatch (δ) in the alloys became progressively higher with the addition of uranium. Minimizing the δ value became a primary driver in alloy downselection, and the final selection of alloys was MoNbTaU2, MoNbTiU2, NbTaTiU2, and NbTaVU2.
Fig. 2. Plot of the Omega versus delta parameters for predicting a solid solution (SS) or intermetallic (IM).
III.B. Fabrication and Characterization
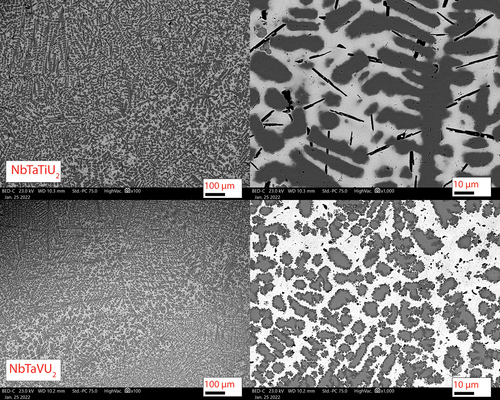
The initial characterization following fabrication was via SEM. and show the SEM micrographs of the four arc-cast alloys. Mixing between the refractory alloying elements occurred but was not homogenous. Two phases emerged in all four alloys with the first being a U-rich phase (light gray matrix in the SEM micrographs) and a refractory-rich precipitate phase (dark gray regions). The refractory phases all show similar morphology in layered dendrites. One feature common in the two alloys with Ti is the formation of small Ti precipitates within the U matrix. The Ti precipitates in the MoNbTiU2 alloy are small florets dispersed within the U phase but not within the refractory phase. The Ti precipitates in the NbVTiU2 phase were longer needles but were also dispersed throughout the U matrix and did not appear to exist within the refractory phases. These observations of segregation between the refractory elements and uranium as well as the Ti precipitates are attributed to the difference in solidus temperatures of the elements.
Fig. 3. Backscatter SEM micrographs of the MoNbTaU2 and MoNbTiU2 alloys. Annotated scale bars are in units of micrometers. Both alloys have dendritic-type precipitates (dark gray) made up of the refractory elements with a U-rich matrix (light gray). The MoNbTaU2 alloy was a two-phase system of the matrix and the dendrites whereas the MoNbTiU2 alloy had both of those phases along with Ti precipitates.
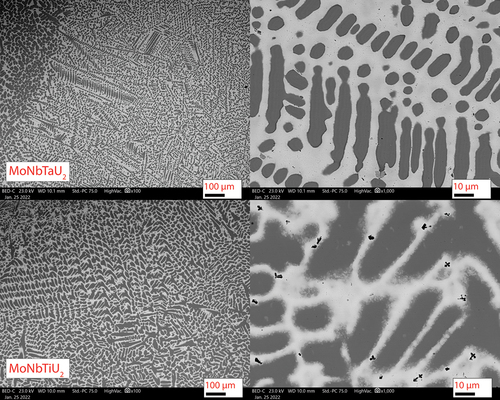
Fig. 4. Backscatter SEM micrographs of the NbTaTiU2 and NbTaVU2 alloys. Annotated scale bars are in units of micrometers. These also had phases similar to the two Mo-Nb alloys with a light gray U-rich phase and the dark gray refractory precipitates. Additionally, the NbVTiU2 alloy also had Ti precipitates like the MoNbTiU2 alloy, but rather than floret precipitates, they were needles.
Following the SEM analysis, XRD patterns were taken and are shown in . All four alloys appeared to primarily be a mixture of two BCC phases: the uranium matrix phase and the refractory dendrites. lists the refined lattice parameters for each phase as well as the estimated lattice parameter for the refractory BCC phase. Occupancy was not included during the refinement process due to the presumed randomness of the MPEAs, so equivalent molar fractions were used for the refractory phases with minor alloying fractions for the U matrix. Since the occupancy could not be reasonably determined during refinement, the phase fractions of each phase could not be accurately estimated due to the reliance upon molar mass fractions for each phase within GSAS. The estimated lattice constants in are based upon a rule of mixtures of the ideal lattice constants obtained from the Materials Project database[Citation20] for each element (assuming a 100% pure refractory phase with equimolar ratios of each element). The refined lattice parameters generally have good agreement with the estimated parameters but are slightly larger. This could be a consequence of minor inclusions of uranium that are resulting in slightly increased size of the unit cells.
TABLE IV Lattice Constants Derived in XRD Refinement and Estimates from Idealized Crystal Structures
Fig. 5. XRD patterns of the as-cast alloys. All four alloys were observed to have a primary BCC phase (BCC1) for the refractory dendrites and γ-U (BCC-U). MoNbTaU2 has two BCC phases from the alloying elements with BCC1 being Mo rich and BCC2 being the Nb/Ta–rich phase. NbTaVU2 has a very small presence of UO2.
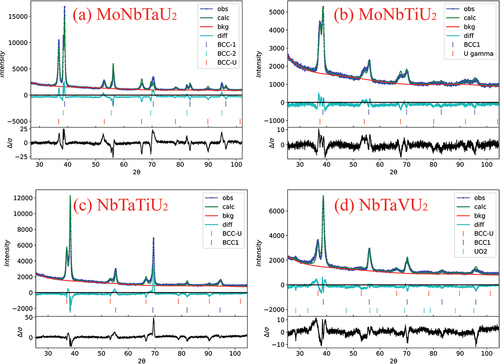
The XRD pattern for the MoNbTaU2 alloy showed two refractory phases that were not directly relatable to anything observed in the SEM/EDS results. The refinement suggested that these would be a Nb/Ta–rich phase and a Mo-rich phase based upon the atomic radii and peak positions of the different elements. The MoNbTiU2 alloy had significant peak broadening, which is attributed to very small crystallites and appreciable microstrain, especially within the U matrix. No peaks appeared that would be linked to the Ti florets seen in the SEM results. The NbTaTiU2 alloy had well-defined peaks for the refractory phase and a smaller relative peak intensity for the U matrix, suggesting a higher phase fraction from the refractory phases. Surprisingly, no peak appeared that would be indicative of the Ti needles. The peaks for the NbTaVU2 alloy showed a dual BCC phase system with some small, very broad peaks indicating some formation of UO2.
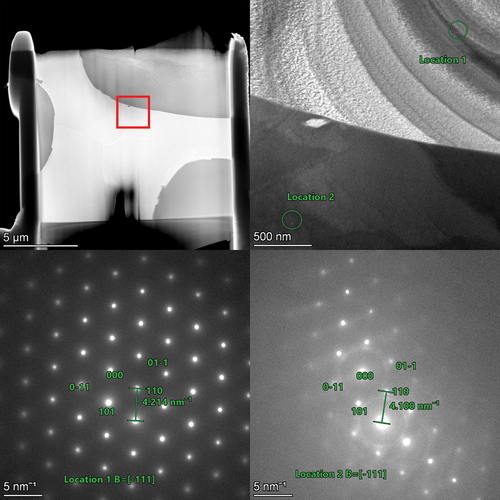
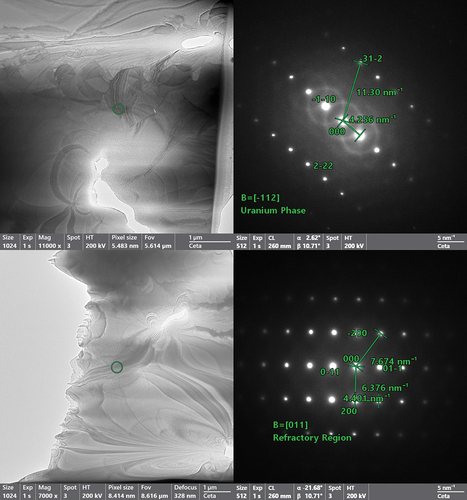
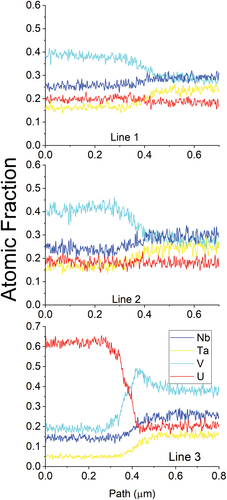
To get a better picture of the differences between the two phases observed in SEM and XRD, lamellae were lifted out from across the interfaces for TEM analysis. Higher-magnification images were taken along with diffraction patterns to confirm the phase identification observed in XRD analysis and to perform EDS analysis of the individual phases at a higher resolution than available at the SEM scale. The MoNbTaU2 alloy micrograph and EDS map are shown in , and the results of the line scans are shown in . The two-phase nature from SEM is confirmed in the TEM micrographs, but the dual peaks for the refractory phase are not seen in the TEM lamella. It is possible that a secondary refractory phase that is Ta rich could exist elsewhere and simply was not captured in this lamella. The EDS line scan results show the composition of the U-rich matrix and confirms that the refractory phase does in fact have small quantities of U, which would explain the lattice parameter question in XRD. The diffraction patterns shown in also show that both the refractory-rich and U matrix phases are BCC.
Fig. 6. TEM lamella and EDS overlay map of the MoNbTaU2 alloy. The line scan results are shown in .
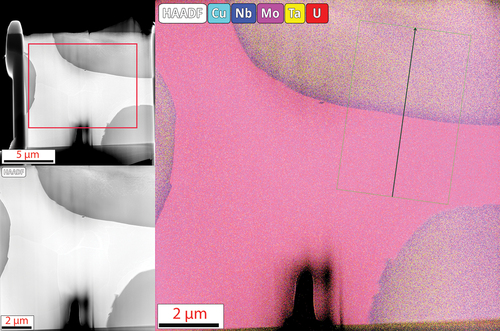
Fig. 7. Line scan results show the distinct transition between the U and refractory phases where the U has very low concentrations within the refractory phase and the refractories themselves have minor contributions to the U matrix. The line scan corroborates the results from the area scans.
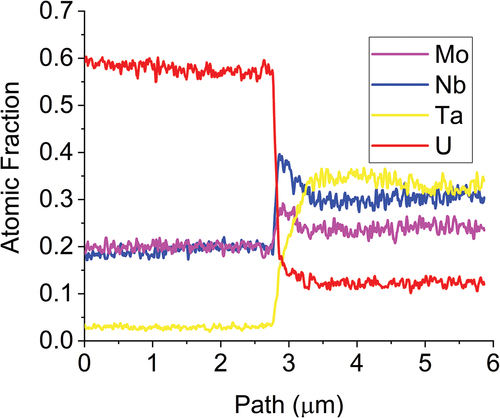
Fig. 8. Diffraction patterns of both the refractory and the U phases. Both are shown to be BCC phases and confirm the findings from XRD analysis. The lattice parameters found in this are similar to those of the XRD results and help confirm the BCC phase and not a face-centered-cubic phase.
The MoNbTiU2 micrograph and EDS maps are shown in with line scan results shown in . The switch from Ta to Ti induced a much more gradual transition between the two phases and increased mixing of the refractories into the U matrix and a higher fraction of U within the refractory phase. This is attributed to the improved mixing of Ti and U in the binary phase diagram as opposed to the immiscibility of Ta and U in its respective binary phase diagram. This also helps explain the high peak broadening and near overlap between the two phases seen in the XRD pattern. Both phases also were confirmed to be BCC via the diffraction patterns shown in . The lamella for the MoNbTiU2 alloy did not capture any fraction of the Ti precipitates, and so, no analysis of these was able to be performed.
Fig. 9. TEM image and EDS map of the lamella from the MoNbTiU2 alloy. Similar to the MoNbTaU2 alloy, this confirms the general SEM observation of the two-phase system. This lamella was unable to capture the Ti florets observed in SEM. In this, the U transition is less pronounced than in the MoNbTaU2 alloy and has a more gradual transition. The line scan result is shown in . The dark regions are holes in the sample and are not an additional phase.
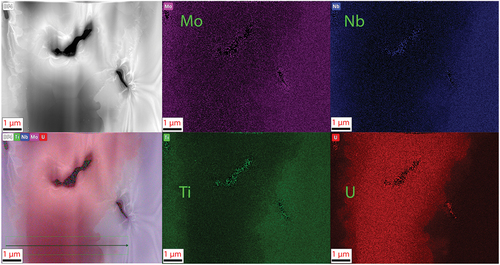
Fig. 10. EDS line scan results of across the U matrix and the two neighboring refractory-rich phases in the MoNbTiU2 alloy. The transition is shown to be much more gradual than in the abrupt transition in the MoNbTaU2 alloy.
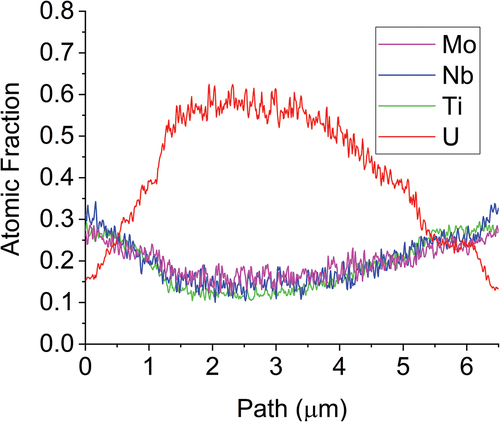
Fig. 11. Diffraction patterns of both the refractory and U phases of the MoNbTiU2 alloy. The two phases are shown to be distinct BCC phases.
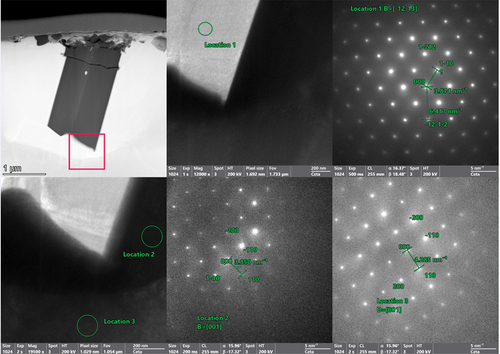
The NbTaTiU2 alloy is shown in with line scan results in . The micrograph shows the two primary phases along with the end of a Ti needle. This also confirms the observation from SEM that the Ti needle phase is encased within the U matrix and does not interact with the refractory phase. Much like the MoNbTiU2, the NbTaTiU2 also displays a high degree of blending between the two primary phases as shown in the line scan results in . This suggests that the thermodynamic drive for the Ti to induce mixing between the alloys is higher than that of the repulsion from Ta. To confirm the phases identified in XRD, diffraction patterns were taken of the two primary phases and the Ti needle (). The refractory and U matrix phases were both shown to be BCC structures, and the Ti needle was shown to be α-phase Ti [hexagonal close packed (HCP)].
Fig. 12. EDS maps of the NbTaTiU2 alloy near the Ti needle and the U matrix surrounding the needles. The line scan measures across the transition from the refractory phase to the uranium matrix and into the Ti needle. The line scan plot is shown in . Selected area electron diffraction patterns from this region are shown in .
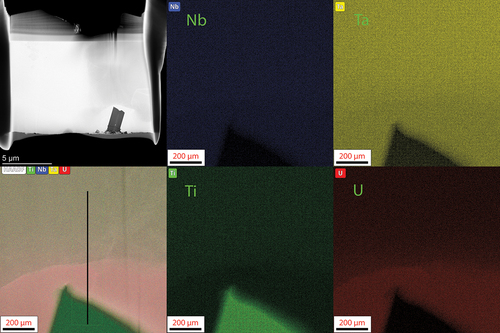
Fig. 13. Line scan results across the refractory-rich phase, across the U-rich phase, and into the Ti needle.
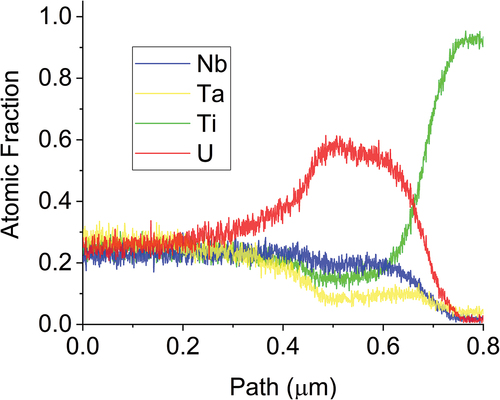
Fig. 14. Selected area electron diffraction patterns of the Ti needle (location 1), U matrix phase near the Ti needle (location 2), and the refractory phase (location 3). The indexed patterns confirm the XRD results of the two BCC phases with the U matrix being BCC γ-U. The Ti needles are shown to be standard HCP Ti.
Last, the NbTaVU2 alloy TEM micrographs and EDS maps are shown in where the two phases seen in SEM and XRD are clearly shown. A higher-magnification image and EDS overlay map are shown in . The refractory phase appears to segregate into V-rich regions along the interface with the U matrix and Ta-rich regions further into the interior of the phase. This is similar to the observations in the previous MoNbTaU2 alloy where the Ta induced a more abrupt transition between the two phases.
Fig. 15. EDS maps of the lamella for the NbTaVU2 alloy. The two distinct regions observed in the SEM-EDS results are observed in finer detail here. The refractory elements form a distinct refractory phase that is absent of U while the U forms a U-rich matrix around it with some mixing of refractory elements.
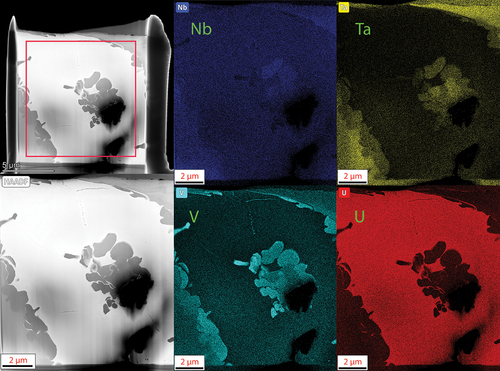
Fig. 16. Selected area electron diffraction patterns from five different locations within the NbTaVU2 alloy. Locations 2, 3, and 5 are shown within the EDS map overlay from . Locations 1 and 4 are within the U matrix surrounding it but are out of frame from the EDS map. All five diffraction patterns are shown to be BCC, and all are near the same zone axis as each other. It would be expected that the d-spacing for similar regions in the same zone axis would be the same (e.g., locations 2 and 3). To investigate this, line scans were taken and are shown in . These small differences are attributed to the small compositional differences shown in the line scans.
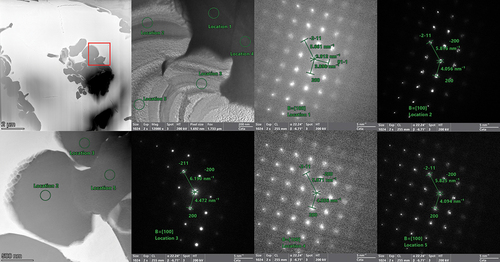
The replacement of the Ti with V did not improve any mixing, which is in line with the immiscibility of U and V in the binary phase diagram. Diffraction patterns, shown in , were taken from two different grains in the U matrix and across multiple locations within the refractory phase. These patterns confirm that the U matrix is a BCC system but also shows that there is variation within the refractory matrix. The differences in the refractory phase cannot be directly attributed to the compositional heterogeneity within the refractory phase as both locations 2 and 3 (V rich) have similar composition but the spacing in location 2 is more in line with the spacing in the Ta-rich region of location 5.
The compositional heterogeneity was further interrogated through line scan EDS as shown in and . The line scans show the Ta concentration increase at the expense of the V concentration as the location moves further from the U matrix interface. This is interesting as it suggests that the interaction between V and U and Nb is more favorable than Ta with U and Nb. Another interesting note is that the Nb content remains relatively flat across all of the interfaces (there is some change, but it is minor compared to the changes in other elements).
Fig. 17. EDS quantification areas and line scan path within the refractory phase of the NbTaVU2 alloy. The line scan result is shown in .
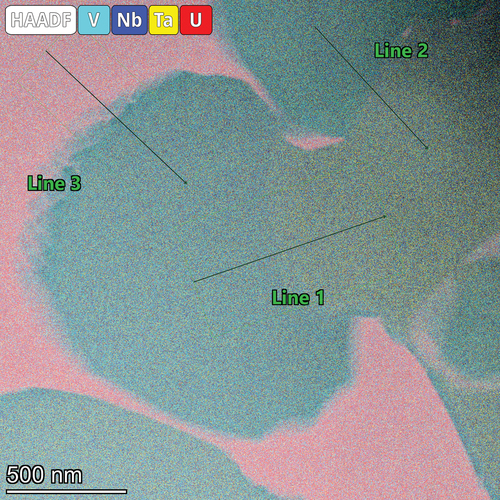
Fig. 18. Line scan results from . These line scans show small differences in the V and Ta concentrations in the beginning of the scans on lines 1 and 2, . Line 3 shows a higher fraction of V and Nb with very low fraction of Ta.
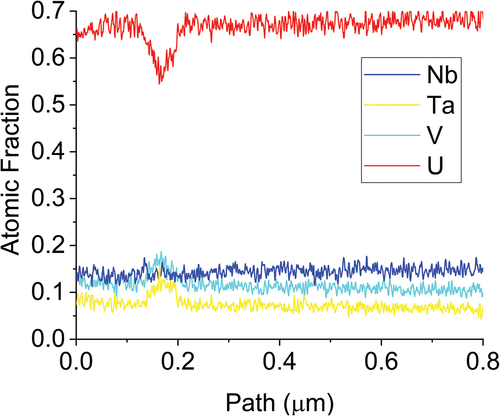
Additional analysis was done within the bulk of the U matrix where a triple grain boundary with small precipitates was observed. This is shown in where the EDS maps and image are overlayed along with a line scan across the boundary. The line scan results, shown in , show the highest fraction of U in the matrix compared to the other three alloys The precipitates appear to be composed of Ta and V, and the U and Nb signal picked up at the location is attributed to an interaction volume from the beam that is larger than the precipitate.
Fig. 19. NbTaVU2 alloy with a triple grain boundary. There were V-Ta–rich precipitates along the grain boundary, and an EDS line scan was taken from across it. The line scan results are shown in .
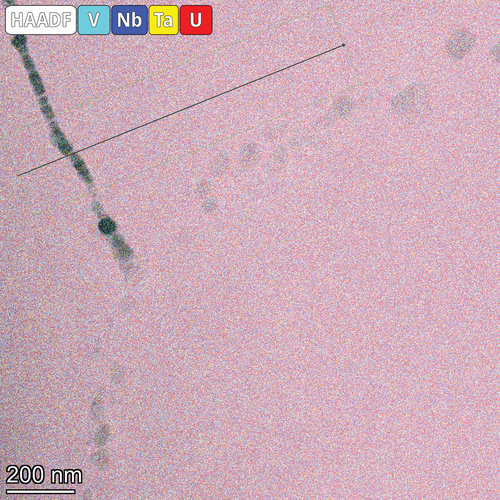
Fig. 20. Line scan from across the V-Ta–rich precipitates in . The precipitates are still high in U and do not include any increase in the Nb content.
IV. DISCUSSION
The initial design of the U-MPEA alloys was based upon the desire to produce a single-phase BCC alloy. While the initial fabricated specimens were not successful in this regard, γ-phase U alloys were produced as evident by the U-rich matrix phases. These γ-phase U alloys potentially have more merit as fuel materials than the nominal compositions chosen due to the much higher U fraction. The four U matrix phases are U0.6(MoNb)0.4, U0.6(MoNbTi)0.4, U0.55–0.6(NbTi)0.4Ta0-0.05, and U0.7Nb0.15V0.1Ta<0.05. The Yang thermodynamic predictors for determination of a solid solution, intermetallic, or mix in an MPEA are thus reconsidered for the observed phases.
shows a comparison of the Yang predictors for the observed phases (the refractory phase and U matrix), the nominal M3U2 compositions, and the ternary refractories (M3). As mentioned before, the Ω value is generated by comparing the magnitude of the TΔS value with the total sum of Hmix, where T is the melting temperature of the mixed liquid phase (Tmelt from a rule of mixtures) and Hmix is the Mediema enthalpy values of the liquid binaries within the system.[Citation22] The Ω value is thus significantly affected by melting temperatures of the elements under consideration and will be proportional to the alloying fraction of high-melting-point and low-melting-point elements. Meanwhile, the Hmix value can be easily misrepresented by the incompatibility of elements (more positive value and thus immiscibility) and the compatibility of elements (more negative and thus prone to forming intermetallics). It is quite possible that the systems have both negative and positive Hmix contributions that effectively cancel each other out in the summation of the system and thus suggest a low net Hmix. This is likely a part of the story in this work where intermetallics such as U2Ti or U2Mo might produce larger absolute Hmix values and immiscible binaries like U-Ta or U-V have the same result. A comparison of the Ω values versus the Miedema Hmix is shown in where it becomes evident that the lower the sum of the Miedema enthalpy is, the higher the Ω value is. This is somewhat self-evident as it follows a 1/x relationship, but as mentioned, the values cannot be taken at face value as this can mislead to suggesting a single-phase system.
Fig. 21. With the same approach as originally used in the design (), the thermodynamic predictors for the observed phases are shown and are compared to the corresponding M3 and the nominal M3U2 alloys.
Fig. 22. Examining the Yang Ω value with the Miedema enthalpy shows that there is a general trend of a lower Ω with nonzero Miedema enthalpy due to the 1/x relationship. This shows that careful consideration must be taken into how the Miedema enthalpy is calculated as the sum of positive and negative values can result in a magnitude of less than one, which may artificially suggest a stable single-phase system.
For the MoNbTaU2 and MoNbTiU2 alloys, the observed refractory phases had a much higher Ω value than the other three phases in the comparisons and are obviously phases that were most stable. This is driven by the low Hmix values of the refractory binary relationships and a slight increase in configurational entropy from the small fraction of U (although not a large enough fraction to cause a significant change in Tmelt). Meanwhile, the U matrix phases retain a relatively high alloying fraction (~40 at. %), which results in a moderately high configurational entropy to overcome the higher magnitude in Hmix. Thus, both of these phases were formed preferentially over the the nominal M3U2 even though the M3U2 exhibited the right predictors.
The NbTaTi-based and NbTaV-based alloys were a little different from the Mo-bearing alloys. For both of these, the M3 ternary alloys appear to be the most likely phases to form in both systems as they both have very high Ω values as well as lower δ values. However, the high Ω values are also driven by the high compatibility of the refractories and thus a somewhat artificially low Hmix that does not consider more complex mixing beyond the binaries. The combined mixing of the elements likely changes the full miscibility of the elements, and the entropy term from inclusion of uranium may be enough to induce formation of more complex phases. For the NbTaTiU2 system, the refractory phases and U matrix appear to be the least likely phases to occur, but this ignores the role that Ti plays in that the Hmix values between Ti and each binary are roughly the same magnitude, and thus, it is likely that the formation of any alloy with Ti would encourage the inclusion of U within it. This increase in mixing opportunity may also be related to the melting temperature of Ti as it would increase the solidus of any lower-temperature metal (e.g., U) while depressing the melting temperature of any higher-temperature metal (e.g., Mo, Nb, or Ta). This bridging effect of solidus temperatures and parity in Hmix suggests Ti should be included in any attempt at homogenizing these systems. It remains to be seen if the mixing is indicative of a potential single-phase system or if the equilibrium alloy is a more discrete two-phase system.
When looking at the NbTaVU2 system, little could be learned from the δ values as all compared phases had roughly the same lattice mismatch. This makes the Ω value much more indicative of phase formation where the M3 ternary alloy appeared to be the most likely phase. However, this was due to an Hmix value that was less than one with Nb-Ta being nearly zero and both V binaries being very low. This low Hmix results in a high Ω and ignores any incorporation of U, which drives the entropy up (as mentioned before). While the entropic effect explains both the inclusion of U in the refractory phase and the low alloying of the U matrix, it also is unlikely enough to overcome the Hmix component, and so, homogenization of this alloy is highly unlikely. It seems reasonable to estimate that the NbTaV-U system will have narrow ranges of stability as a solid solution and will otherwise remain as a two-phase system.
Considering the above results, alloys of highest interest for a fuel would emphasize a higher U fraction, and thus, the alloys would require additions of Mo or Nb with additions of Ti and smaller fractions of V or Ta. If a broader alloying range and lower U fraction are needed, then more Ti should be included as it is the most likely to help in bridging the otherwise immiscible elements. The NbTaV-U alloy was observed to be the best candidate from the results given the initial stability of the γ-U phase and the highest uranium fraction (~70 at. %) but may suffer from being more sensitive to compositional variations.
For all alloys observed, the U concentration within the U matrix is much higher than originally designed, and thus, the ranges of enrichments necessary to make a viable fuel are much broader. Given the anticipated fission gas performance, it would also be reasonable to state that the alloys could have higher smear densities than the U-Zr fuel and thus higher volumetric loading with lower enrichments. This would be beneficial for compact reactor designs and reduced proliferation risks. Last, having a high heavy metal fraction could also lend itself to investigation with U-Pu designs to support Pu stockpile reduction in burner reactors.
As inferred above, the predictors used to design these alloys are of limited value as most of the data sets available are based on binary phase diagrams with limited ternary datasets available. This is a useful first approximation for complex alloys but obviously lacks the data needed to make accurate projections into a quaternary space. Unknown miscibility gaps that may exist in complex systems are not accounted for, or in the reverse, increased phase stability between elements is unknown. This uncertainty makes the Yang predictors for complex alloys somewhat suspect as they simply do not have the data to draw from within the databases, but they are the best approximation currently available. For systems with more complete thermodynamic data available, this could be useful, but with more complete data available, better estimations could be performed through a CALPHAD prediction instead.
For further complex uranium alloying work, whether for the alloys in this paper or in others, thorough investigations into refractory-actinide thermodynamics would be valuable. The most complete datasets for ternary uranium alloys are for U-Pu-Zr and U-Pu-Mo. For the MoNbTi-U system, there is a single-phase diagram for a limited compositional range of Mo-Ti-U[Citation34] and a handful of limited compositions for Mo-Nb-U.[Citation35,Citation36] The Mo-Nb-Ta-U is limited to the same data for Mo-Nb-U with nothing including Ta. The Nb-Ta-Ti-U system is entirely limited to binary phase diagrams with no ternary systems found during the literature search.
Last, the Nb-Ta-V-U is limited to one liquidus projection and two limited composition binary plots.[Citation37] Even with these phase diagrams, much of the source data are of limited value and pedigree and do not provide any insight into the development of thermodynamic relationships, and alloy design will have to rely on testing sets and natural alloying strategies like those used in this work. As thermodynamic data become more available, further alloy discovery efforts can be attempted with better predictions and accuracy. This work shows that there is opportunity for further research in exploring complex alloying with uranium, or other actinides, and that this exploration has high potential value for the nuclear materials community.
V. CONCLUSIONS
The results of the design process and characterization of four uranium-bearing MPEAs are presented. The design process included the use of simple neutronic considerations for comparing potential U-MPEA alloys to more conventional nuclear fuel materials to determine adequate heavy metal densities. Following this, empirical relationships and thermodynamic relations were used to downselect alloying elements with the highest probability of forming a single-phase, BCC crystal structure system. While the objective to produce a stable MPEA fuel material was unsuccessful for the original compositions, it did produce a series of potential fuel alloys that could be very beneficial to the nuclear fuels community.
Comparisons among existing fuel forms and potential MPEA fuels were made to show that competitive uranium densities could be achieved through an M3U2 or M3U stoichiometry with M being three distinct refractory alloying elements.
MCNP was also used to compare power densities at varying enrichments and alloying fractions to that of conventional U-10Zr fuel alloys. This showed that a HALEU type of fuel with an M3U2 stoichiometry could have comparable power density to a low-enriched U-10Zr fuel.
Material databases were used to assess a range of alloys with refractory elements known to produce BCC MPEAs within literature. This resulted in a downselection to four alloys with compositions of MaNbTaU2, MoNbTiU2, NbTaTiU2, and NbTaVU2. These alloys were fabricated via arc melting and were shown through SEM, XRD, and TEM analyses that the alloys were mostly two-phase BCC systems. The first phase was a refractory-rich dendrite phase with small amounts of U incorporated into it. The second phase was a U-rich matrix with each alloy having a varying cocktail of the refractory elements within it. For all four U matrix phases, it was shown that the alloying cocktail was able to produce a BCC γ-U phase, which is considered a desirable phase for fuel applications.
The U matrix phases provided good insight into future alloy fuel development. The use of Ti caused a higher alloying fraction of refractory elements within the U for both the MoNbTi and NbTaTi alloys (i.e., a lower U density). Because of the mixing of U and Ti at high temperatures and the relatively low solidus temperature of the Ti compared to other refractory alloys, there was a high degree of mixing between the refractory-rich and U matrix phases. This could suggest that high-temperature annealing may enable homogenization of the Ti-bearing alloys.
The Ta-bearing alloys had the reverse trend from the Ti where the Ta failed to incorporate in the U matrix, showing that fuels should limit the inclusion of Ta to low quantities. This does show that potential cladding materials could benefit through the use of Ta. The Ta also was shown to be more resistant to mixing than the V, but the V did incorporate into the U matrix despite the binary immiscibility between U and V.
Further investigation is recommended for these systems to identify ideal compositions and fabrication methods that can reliably produce a stable γ phase with flexibility in the composition. This will likely also require annealing studies for homogenization. Utilization of high-throughput fabrication, such as additive manufacturing processes, could be utilized to interrogate different compositions. Additional thermomechanical property assessments would also be necessary in order to understand the potential behavior of the fuels under irradiation conditions prior to pursuing irradiation testing. Last, high-temperature claddings will likely utilize the same refractory elements within the fuel alloy, and so, further work on cladding and interactions will be required.
U.S. Department of Energy Disclaimer
The U.S. Government retains a nonexclusive, royalty-free license to publish or reproduce the published form of this contribution or allow others to do so, for U.S. Government purposes. This information was prepared as an account of work sponsored by an agency of the U.S. Government. Neither the U.S. Government nor any agency thereof, nor any of their employees, makes any warranty, express or implied, or assumes any legal liability or responsibility for the accuracy, completeness, or usefulness of any information, apparatus, product, or process disclosed, or represents that its use would not infringe privately owned rights. References herein to any specific commercial product, process, or service by trade name, trademark, manufacturer, or otherwise, does not necessarily constitute or imply its endorsement, recommendation, or favoring by the U.S. Government or any agency thereof. The views and opinions of authors expressed herein do not necessarily state or reflect those of the U.S. Government or any agency thereof.
Supplemental Material
Download PDF (2.8 MB)Acknowledgments
This work was supported through the Laboratory Directed Research & Development (LDRD) Program at Idaho National Laboratory under the U.S. Department of Energy (DOE) Idaho Operations Office (an agency of the U.S. Government) contract DE-AC07-05ID145142. After the completion of the LDRD program, this work was further supported through programmatic efforts at Idaho National Laboratory under the DOE Idaho Operations Office (an agency of the U.S. Government) contract DE-AC07-05ID145142. Additional support for contributions by North Carolina State University was funded by National Science Foundation award number 2005006.
The authors are grateful for the technical editing support provided by Kelsey Gaston and internal peer reviews by Kevin Tolman and Seongtae Kwon. Fuel performance insight by Dennis Kaiser and Kevan Weaver was greatly appreciated. Youssef Ballout helped provide guidance for neutronic assessment approaches.
Supplemental data
Supplemental data for this article can be accessed on the publisher’s website.
Disclosure Statement
No potential conflict of interest was reported by the author(s).
References
- R. BOUCHER and P. BARTHELEMY, “Comparison of U-Pu-Mo, U-Pu-Nb, U-Pu-Ti, and U-Pu-Zr Alloys (Comparaison Des Alliages U-Pu-Mo, U-Pu-Nb, U-Pu-Ti, U-Pu-Zr),” Commissariat a l’Energie Atomique, Fontenay-aux-Roses, Centre d’Etudes Nucleaires (1964).
- D. E. JANNEY, Metallic Fuels Handbook, Part 1 and Part 2, Idaho National Laboratory (2018).
- D. E. JANNEY, S. L. HAYES, and C. A. ADKINS, “A Critical Review of the Experimentally Known Properties of U-Pu-Zr Alloys. Part 1: Phases and Phase Diagrams,” pp. 1–29, Idaho National Laboratory (2019).
- L. L. BRIGGS and Y. I. CHANG, “Safety Analysis and Technical Basis for Establing an Interim Burnup Limit for Mark-V and Mark-VA Fuel Subassemblies in EBR-II,” Argonne National Laboratory (2018).
- J. REST et al., U-Mo Fuels Handbook. Version 1.0, Argonne National Laboratory (2006).
- B. D. MILLER et al., “Transmission Electron Microscopy Characterization of the Fission Gas Bubble Superlattice in Irradiated U–7wt%Mo Dispersion Fuels,” J. Nucl. Mater., 458, 115 (2015); http://dx.doi.org/10.1016/j.jnucmat.2014.12.012.
- J. M. HARP, L. CAPRIOTTI, and F. CAPPIA, “Baseline Postirradiation Examination of the AFC-3C, AFC-3D, and AFC-4A Experiments,” Idaho National Laboratory (2018).
- P. ZHOU et al., “Thermodynamic Modeling of the U-Nb-Zr Ternary System,” J. Nucl. Mater., 523, 157 (2019); http://dx.doi.org/10.1016/j.jnucmat.2019.05.045.
- L. K. SUDDERTH et al., “Fabrication and Characterization of Candidate Alloys for Advanced LEU Fuel Concepts,” Idaho National Laboratory (2022).
- R. D. MARIANI et al., “Metallic Fuels: The EBR-II Legacy and Recent Advances,” Procedia Chem., 7, 513 (2012).
- J. P. COUZINIÉ et al., “Comprehensive Data Compilation on the Mechanical Properties of Refractory High-Entropy Alloys,” Data Brief, 21, 1622 (2018); http://dx.doi.org/10.1016/j.dib.2018.10.071.
- S. GORSSE et al., “Database on the Mechanical Properties of High Entropy Alloys and Complex Concentrated Alloys,” Data Brief, 21, 2664 (2018); http://dx.doi.org/10.1016/j.dib.2018.11.111.
- D. B. MIRACLE and O. N. SENKOV, “A Critical Review of High Entropy Alloys and Related Concepts,” Acta Mater., 122, 448 (2017).
- O. N. SENKOV et al., “Mechanical Properties of Low-Density, Refractory Multi-Principal Element Alloys of the Cr–Nb–Ti–V–Zr System,” Mater. Sci. Eng., 565, 51 (2013); http://dx.doi.org/10.1016/j.msea.2012.12.018.
- O. N. SENKOV, S. V. SENKOVA, and C. WOODWARD, “Effect of Aluminum on the Microstructure and Properties of Two Refractory High-Entropy Alloys,” Acta Mater., 68, 214 (2014); http://dx.doi.org/10.1016/j.actamat.2014.01.029.
- O. N. SENKOV et al., “Low-Density, Refractory Multi-Principal Element Alloys of the Cr–Nb–Ti–V–Zr System: Microstructure and Phase Analysis,” Acta Mater., 61, 5, 1545 (2013); http://dx.doi.org/10.1016/j.actamat.2012.11.032.
- R. D. MARIANI et al., “Lanthanides in Metallic Nuclear Fuels: Their Behavior and Methods for Their Control,” J. Nucl. Mater., 419, 1–3, 263 (2011); http://dx.doi.org/10.1016/j.jnucmat.2011.08.036.
- J. SHI et al., “Microstructure and Mechanical Properties of Two Uranium-Containing High-Entropy Alloys,” J. Alloys Compd., 860, 158295 (2021); http://dx.doi.org/10.1016/j.jallcom.2020.158295.
- H. HUANG et al., “Material Informatics for Uranium-Bearing Equiatomic Disordered Solid Solution Alloys,” Mater. Today Commun., 29, 102960 (2021); http://dx.doi.org/10.1016/j.mtcomm.2021.102960.
- A. JAIN et al., “Commentary: The Materials Project: A Materials Genome Approach to Accelerating Materials Innovation,” APL Mater., 1, 011002 (2013); http://dx.doi.org/10.1063/1.4812323.
- C. WEN et al., “Machine Learning Assisted Design of High Entropy Alloys with Desired Property,” Acta Mater., 170, 109 (2019); http://dx.doi.org/10.1016/j.actamat.2019.03.010.
- X. YANG and Y. ZHANG, “Prediction of High-Entropy Stabilized Solid-Solution in Multi-Component Alloys,” Mater. Chem. Phys., 132, 2, 233 (2012); http://dx.doi.org/10.1016/j.matchemphys.2011.11.021.
- C. J. WERNER, “MCNP Users Manual – Code Version 6.2,” Los Alamos National Laboratory (2017).
- F. A. GARNER, “Radiation Damage in Austenitic Steels,” Comprehensive Nuclear Materials, pp. 33–95, R. J. M. KONINGS, Ed., Elsevier (2012).
- A. G. WEISS et al., “A Sensitivity Analysis to Predict the Neutronics Behavior of Samples Irradiated in the VTR Rabbit System,” Ann. Nucl. Energy, 185, 109708 (2023); http://dx.doi.org/10.1016/j.anucene.2023.109708.
- K. GEELHOOD and I. PORTER, “Modeling and Assessment of EBR-II Fuel with the US NRC’s Fast Fuel Performance Code,” Proc. TopFuel 2018, Prague, Czech Republic, September 2018.
- Q. LIU et al., “Microstructure and Mechanical Properties of Ultra-Fine Grained MoNbTaTiV Refractory High-Entropy Alloy Fabricated by Spark Plasma Sintering,” J. Mater. Sci. Technol., 35, 11, 2600 (2019); http://dx.doi.org/10.1016/j.jmst.2019.07.013.
- S. A. KUBE and J. SCHROERS, “Metastability in High Entropy Alloys,” Scr. Mater., 186, 392 (2020); http://dx.doi.org/10.1016/j.scriptamat.2020.05.049.
- G. L. BEAUSOLEIL et al., “Spark Plasma Sintered, MoNbTi-Based Multi-Principal Element Alloys with Cr, V, and Zr,” J. Alloys Compd., 927, 167083 (2022); http://dx.doi.org/10.1016/j.jallcom.2022.167083.
- B. H. TOBY and R. B. VON DREELE, “GSAS-II: The Genesis of a Modern Open-Source All Purpose Crystallography Software Package,” J. Appl. Crystallogr., 46, 2, 544 (2013); http://dx.doi.org/10.1107/S0021889813003531.
- V. F. SEARS, “Neutron Scattering Lengths and Cross Sections,” Neutron News, 3, 3, 26 (1992); http://dx.doi.org/10.1080/10448639208218770.
- D. C. CRAWFORD, D. L. PORTER, and S. L. HAYES, “Fuels for Sodium-Cooled Fast Reactors: US Perspective,” J. Nucl. Mater., 371, 1, 202 (2007); http://dx.doi.org/10.1016/j.jnucmat.2007.05.010.
- S. YANG et al., “Revisit the VEC Rule in High Entropy Alloys (HEAs) with High-Throughput CALPHAD Approach and Its Applications for Material Design—A Case Study with Al–Co–Cr–Fe–Ni System,” Acta Mater., 192, 11 (2020); http://dx.doi.org/10.1016/j.actamat.2020.03.039.
- A. A. BAUER, F. A. ROUGH, and J. DOIG, “Constitution of Delta-Phase Alloys of the System Uranium-Molybdenum-Titanium,” Trans. Met. Soc., 212, 862 (1958).
- G. H. BANNISTER and D. J. R. MURRAY, “Some Observations on Uranium-Molybdenum-Niobium Alloys,” J. Less-Common Metals, 2, 372 (1960); http://dx.doi.org/10.1016/0022-5088(60)90046-1.
- O. S. IVANOV, “Isothermal Cross Sections for 560 °C, 500 °C and the Phase Diagram of the Triple System Uranium-Niobium-Molybdenum,” Structure of Alloys of Certain Systems Containing Uranium and Thorium, p. 200 (1963).
- G. I. TEREKHOV, “The Phase Diagram and Structure of U-Nb-V Alloys,” Russ. Metall., 206 (1989).