
ABSTRACT
Observations seem particularly susceptible to rater error due to the level of subjectivity involved in assessment. Thus, the present paper aims to investigate: (1) inter-rater agreement (IRA) using the Classroom Assessment Scoring System – Secondary version (CLASS-S) and (2) the CLASS-S factor structure in a Norwegian context. Inter-rater agreement analysis comprise percent within one (PWO). Confirmatory factor analysis are performed to analyze the factor structure. Certified trainers scored videotaped observations. The study indicates that an acceptable IRA can be achieved in a Norwegian setting, and it reports promising results regarding the structural validity of the CLASS-S.
Schools are pushed to implement various types of feedback and evaluation systems that aim to enhance the capacity of schools in general and classroom teachers in particular to promote student success (Hattie & Timperley, Citation2007; Wiliam, Citation2011). Systematic classroom observation instruments have been widely used to describe instructional purposes, to investigate instructional inequities, and to improve teachers’ classroom instruction based on feedback from individual, classroom or school profiles (Hamre & Pianta, Citation2007; Malmberg, Hagger, & Burn, Citation2010; Praetorius, Pauli, Reusser, Rakoczy, & Klieme, Citation2014). However, according to Pianta, Hamre, and Allen (Citation2012), too many observational measurements in the past had little or no empirical evidence of their reliability or they measured components of teaching associated with student learning.
Recently, studies of the interaction between teachers and students in the classroom as a context for providing students with the opportunity to engage in insightful learning processes has gained currency in educational research. In particular, large-scale observational studies, for example, the work of Klieme and colleagues (e.g., Klieme, Pauli, & Reusser, Citation2009), drawing on data from the TIMMS Video, have provided insight into interactions in the classroom and their impact on students’ learning. Similarly, the Measures of Effective Teaching project in the USA, which addresses four different observational protocols including CLASS, has provided important knowledge and addressed a wide range of methodological questions related to observational data (e.g., Kane & Staiger, Citation2012; Kane, Kerr, & Pianta, Citation2014). Additionally, prominent theoretical models that describe the most important aspects of instructional quality have been developed (e.g., Kunter & Baumert, Citation2006; Pianta, Hamre, & Allen, Citation2012; Wubbels et al., Citation2015). Pianta and colleagues (Citation2012) describe three subdomains of instructional quality: emotional support, classroom organization, and instructional support. This perspective is similar to others applied in previous studies (e.g., Kane & Staiger, Citation2012; Klieme et al., Citation2009; Lipowsky et al., Citation2009). Despite some differences, there are clear similarities between the different perspectives such that based on these domains, a hierarchical structure with underlying specific teaching dimensions and specific behavioural indicators organized within domains can be identified (Klieme et al., Citation2009; Pianta, Hamre, & Allen, Citation2012; Pianta, Hamre, & Mintz, Citation2012). The three key dimensions of classroom interactions have been consistently found to be associated with students’ academic and social outcomes (e.g., Allen et al., Citation2013; Evertson & Weinstein, Citation2006; Fauth, Decristan, Rieser, Klieme, & Buttner, Citation2014; Pianta, Hamre, & Allen, Citation2012).
Through the Teaching Through Interactions (TTI) framework, Hamre and Pianta (Citation2007) developed a standardized observational measurement tool – the Classroom Assessment Scoring System (CLASS) – for observing and evaluating teacher-student interactions. There are six age-dependent versions of this instrument, ranging from the early childhood (Infant CLASS) to secondary (CLASS-S) levels. Research on CLASS has been conducted in various contexts within the USA, but few European studies and no Norwegian studies have utilized CLASS-S to assess classroom quality (Pianta, Hamre, & Mintz, Citation2012)
Observations seem particularly susceptible to rater error due to the level of subjectivity involved in assessment (Sandilos & DiPerna, Citation2011). The viability of an observational protocol and the quality of the observational data are dependent on satisfactory inter-rater-agreement (IRA) and a recognizable factor structure. Therefore, this paper has two aims. The first is to investigate whether it is possible to train observers in Norway to reliably code the interactions between teachers and students using an English protocol. The second is to investigate whether the factor structure of the CLASS-S fits a Norwegian context.
Although based on a strong international theoretical perspective, the CLASS-S was originally developed and tested in the cultural and educational context of the USA (e.g., Allen et al., Citation2013; Hafen et al., Citation2015; McCaffrey, Yuan, Savitsky, Lockwood, & Edelen, Citation2015). The dimensions and domains of the CLASS reflect the conceptualizations of the constructs in this educational context. Recently, the instrument has been increasingly used in other countries (e.g., Gamlem & Munthe, Citation2014; Malmberg et al., Citation2010; Virtanen et al., Citation2017). Its increased popularity outside the USA necessitates an investigation of the CLASS in cultural contexts or educational systems that differ from those typically found in the USA. Virtanen et al. (Citation2017) and Malmberg et al. (Citation2010) investigated the CLASS-S in Finish schools and among teacher students in the UK, respectively. However, no investigation of the CLASS-S has been conducted in Norway. As Pakarinen et al. (Citation2010) discussed, there are several reasons why an investigation of the CLASS in another cultural context might add to our understanding of classroom interactions and this framework. The CLASS is expected to identify some universal characteristics of classroom interactions (Pianta, Hamre, & Mintz, Citation2012). Therefore, investigating the CLASS measurement in other countries and educational systems is important. Examining the dimensional structure of the CLASS in a Norwegian setting will directly test this hypothesis. Moreover, reporting validity data on the measurement in Norway will provide information on whether classroom interactions are embedded in the same correlational pattern and whether the dimensions and domains reflect the same three latent constructs as in the original context.
The Elements of the CLASS-S
Based on the TTI framework, the CLASS-S protocol classifies the quality of classroom interactions according to three overarching domains: Emotional Support, Classroom Organization, and Instructional Support. Each domain is operationalized into several age-specific dimensions of teacher-student interactions. These dimensions are grounded in previous research and theory about what promotes student learning (Allen et al., Citation2013; Hafen et al., Citation2015; Pianta, Hamre, & Allen, Citation2012). Each dimension is described through a set of indicators, and each indicator is connected to a list of behavioural markers (Pianta, Hamre, & Mintz, Citation2012). Spanning from broad, theoretically based domains to detailed behavioural markers, CLASS-S creates a multilevel theoretical framework for assessing classroom interactions that has great potential for providing nuanced data on classroom interactions. However, the measure’s complexity places great demand on rater training and IRA.
The Emotional Support domain contains dimensions that address the teacher’s ability to create and maintain a supportive social environment that fosters engagement in academic pursuits. The theoretical basis for the domain is in attachment theory and self-determination theory (Allen et al., Citation2013; Hafen et al., Citation2015; Pianta, Hamre, & Allen, Citation2012). The assumption is that emotionally supportive environments will make students more likely to participate in learning activities and that these activities can be enhanced by interactions that foster student autonomy, positive relations with others, and feelings of competence. In the CLASS-S protocol (Pianta, Hamre, & Mintz, Citation2012), Emotional Support comprises the dimensions Positive Climate, Teacher Sensitivity, and Regard for Adolescent Perspectives.
The Organization domain comprises the teacher’s skills in classroom organization. This includes the management of problem behaviour, the degree of acceptance and compliance with rules of behaviour in the classroom, and the effective use of instruction time. The theoretical foundation for this domain is in self-regulation research and studies on how teachers can help students develop skills necessary to regulate their own behaviour (Allen et al., Citation2013; Pianta, Hamre, & Allen, Citation2012). In the secondary version, the domain comprises the dimensions Behaviour Management, Productivity, and Negative Climate.
Instructional Support rates the teacher’s ability to facilitate student learning processes. Whereas Emotional Support rates the social climate in the classroom and Organization rates the teacher’s effectiveness in classroom management, Instructional Support captures the quality of the activity for student learning. This domain is based on research on children’s cognitive and language development (Hafen et al., Citation2015; Pianta, Hamre, & Allen, Citation2012). At the secondary level, Instructional Support comprises the dimensions Instructional Learning Formats, Content Understanding, Analysis and Inquiry, Quality of Feedback, and Instructional Dialogue.
In the three domains, the focus is on the classroom and teacher-level support available to students. The CLASS-S also addresses overall student functioning. Student Engagement focuses on the overall engagement level of students in the classroom (Pianta, Hamre, & Allen, Citation2012; Pianta, Hamre, & Mintz, Citation2012). Student Engagement is viewed by the CLASS developers as an outcome of the three domains (Bell et al., Citation2012) and is not involved in the testing of the factorial structure of the three aforementioned domains (e.g., Hafen et al., Citation2015).
Systematic classroom observation has the potential to generate knowledge about the quality of instruction and simultaneously provide guidance about how a given lesson can be improved (Hafen et al., Citation2015; Pianta, Hamre, & Allen, Citation2012).
Previous Research on the Reliability and Validity of the CLASS-S
One of the challenges of developing and utilizing classroom observation instruments is establishing score IRA, between raters (Olswang, Svensson, Coggins, Beilinson, & Donaldson, Citation2006). Given the level of subjectivity involved in assessment, observation systems are particularly susceptible to error (Sandilos & DiPerna, Citation2011). To assess the IRA of the scores of an observation system, two or more raters must observe the same event. If these raters produce similar results (i.e., consistent scores across raters), IRA is evident.
A few previous studies have reported IRA for the CLASS-S (e.g., Gregory, Allen, Mikami, Hafen, & Pianta, Citation2014; Hafen et al., Citation2015). Moreover, there is evidence that this instrument represents a robust understanding of classroom interactions consistent across settings (Hafen et al., Citation2015; Pianta, Hamre, & Allen, Citation2012; Sandilos & DiPerna, Citation2011), culture (Malmberg & Hagger, Citation2009), and grade level (Allen et al., Citation2013; Downer, Stuhlman, Schweig, Martínez, & Ruzek, Citation2015), although the current version of the CLASS-S (Pianta, Hamre, & Mintz, Citation2012) has not been investigated for consistency across cultures. However, none of the six CLASS versions have previously been tested for reliability and validity in a Scandinavian setting.
All observers undergo training. At the end of the two-day training, a reliability test is conducted. The IRA of scores is computed between the ratings of training or “master” coder and the newly trained user (Pianta, Hamre, & Mintz, Citation2012). The trained user has three opportunities to achieve the CLASS “certification” standards for IRA (≥ 80% agreement). Although this technique has yield high IRA estimates, the data are collected via videotaped observations in a controlled environment (Hamre, Pianta, Mashburn, & Downer, Citation2008; Pianta, Hamre, & Allen, Citation2012). The IRA reported in previous studies ranges from good to excellent (e.g., Hafen et al., Citation2015; McCaffrey et al., Citation2015; Sandilos & DiPerna, Citation2011) for individual dimensions and domains, indicating the complexity of IRA for complex protocols with several scoring alternatives.
Factor analyses have been performed to support both the interpretation of CLASS-S scores (e.g., Allen et al., Citation2013; Bell et al., Citation2012; Hafen et al., Citation2015; Sandilos & DiPerna, Citation2011) and the teaching theories that underlie them (Hafen et al., Citation2015). A common practice for generating measures of teaching is to average the scores on each dimension assigned by one or more rater across raters, segments, and lessons to obtain dimension scores, which are then aggregated to obtain a set of domain scores (e.g., Allen et al., Citation2013; Allen, Pianta, Mikami, & Lun, Citation2011; Sandilos & DiPerna, Citation2011). This aggregated observation score serves as a measure of the average teaching quality of each teacher across the year, and it forms the starting point for factor analysis. These procedures for interpreting scores are not specific for the different versions of the CLASS, but rather are widely used for several observation protocols (Danielson, Citation2013; McCaffrey et al., Citation2015). Recent studies have elaborated on the common practice of averaging scores and have questioned the practice of not considering the hierarchical nature of the data (Malmberg et al., Citation2010; McCaffrey et al., Citation2015). Given that the data are nested within segments nested within lessons and teachers/classrooms, it has been argued that averaging the scores across lessons and classrooms ignores variability in scores (e.g., McCaffrey et al., Citation2015). Ignoring this nested structure of the data can lead to mistaken conclusions about the phenomenon under study (Snijders & Bosker, Citation2012). Marsh et al. (Citation2012) argued that the classroom climate (e.g., classroom interaction) is inherently a classroom-level construct and should be represented as such in statistical analyses. There are statistical reasons why it is important to use multilevel modelling when the data have a multilevel structure, for example the non-independence of responses from students within the same classroom or, as in the current study, of scores for segments within the same lesson within the same classroom. This may result in inflated Type 1 error rates (Marsh et al., Citation2012). Moreover, Marsh and colleagues argued that classroom climate effects should be based on group-level measures. Given that the CLASS measures classroom interactions at the classroom (group) level, it is particularly suited for multilevel analyses. The appropriate level of analysis and interpretation has been widely debated in educational research, and depends, at least in part, on the research question. However, one may argue that studies addressing classroom interaction typically evaluate whether teaching characteristics (group level) predict students’ (individual level) outcomes beyond the variance that can be explained by other individual student characteristics (Ertesvåg & Havik, Citation2017). In light of the recent discussion on the factor structure, it is reasonable to elaborate on it beyond the traditional approach of investigating average scores.
Applying the CLASS in the CIESL-Project
The present study, Classroom interaction for enhanced student learning (CIESL), has a longitudinal mixed-methods design (Tashakkori & Teddlie, Citation2010) that combines qualitative and quantitative approaches to answer the research questions. The participating lower-secondary schools and their teachers are part of a five-year programme, “Ungdomstrinn i utvikling” (UIU), initiated by the Norwegian Directorate for Education. The main aim of this programme is to make the school more practical and varied (Ministry of Education, Citation2011). A majority of the schools have chosen school-based professional training in classroom management. The teachers participating in UIU are provided with research-based knowledge on classroom interactions, including emotional support, instructional support, and organizational management, through seminars and workshops in school. The Norwegian Centre for Learning Environment and Behavioural Research in Education at the University of Stavanger provides support to teacher training institutions that are involved in the implementation of UIU at schools throughout the country. The main aim of the research project is to investigate how teachers implement research-based knowledge regarding classroom interaction in their teaching practices and how student outcomes are linked to teachers’ knowledge regarding classroom interaction.
In this article we focus on standardized systematic video observations to demonstrate how trained observers can reliably code the interactions between teachers and students using the CLASS-S. Moreover, we investigate the factor structure of the CLASS-S in a Norwegian context.
Thus, the questions this article aims to address are:
To what extent can trained observers reliably code the interactions between teachers and students?
How does the factor structure of the CLASS-S fit in a Norwegian context?
Methods
Sample and Procedure
Participants
The sample initially consisted of 54 teachers (aged 24–61 years, mean age = 41.89, standard deviation (SD) = 9.43) from two counties in the southern part of Norway. The teachers volunteered to be videotaped during their classroom instruction as part of a national initiative to strengthen secondary school teachers’ role in classroom processes related to student learning and development. Two teachers withdrew from the video observations; thus, the final sample included 52 teachers. Data were collected in eight schools with secondary-level students during autumn 2014 and spring 2015.
Most of the teachers were female (70%). The schools were encouraged to include teachers who varied with respect to experience, age, subject taught, and gender, if possible. Most of the teachers (60%) had been teaching for 1–7 years, 30% had been teaching for 8–17 years, and 10% had been teaching for 22–30 years. The majority of the lessons were theoretical (87%), and the remaining lessons (13%) were practical and/or elective subjects.
Students were eligible to be videotaped if they provided their parents’ and their own consent to participate in the study.
Procedure
A letter of invitation was sent to the schools describing the aim of the research and stating that participation would include video observations of the teachers who volunteered to participate.
Teachers were asked to prepare a typical class session to be facilitated in front of a camera positioned to capture the interactions between the teacher and individual students and with groups of students.
Each teacher was observed teaching the same subject in the same class in four cycles during one school year.
Each rater observed one teacher for four 45- to 60-minute cycles. For scoring purposes, each cycle was divided into two 15-minute segments (for a total of eight segments per teacher), as there is evidence that the first 30 minutes of a lesson are representative of the quality of the lesson (Joe, McClellan, & Holtzman, Citation2014). In total, raters observed 416 segments from 208 lessons. The CLASS-S manual (Pianta, Hamre, & Mintz, Citation2012) suggests scoring segments 15–20 minutes long. Accordingly, two 15-minute segments and two subsequent segments were scored, that is, 0–15 minutes and 15–30 minutes into the lesson. Procedures for scoring were developed, and instructions were distributed among raters to reduce scoring bias due to differences in the procedures. At the end of a segment, the observers assigned scores for each dimension based on the behavioural anchors provided in the CLASS-S manual before viewing a new segment. The raters did not score segments from the same lesson in series, and they did not score two segments with the same teacher consecutively. All 52 teachers were scored once by one of eight raters, and 20% of the teachers (10 teachers, 80 video clips) were scored twice by two raters to calculate the IRA. For some instances, the raters were also the data collectors (video filming), but to reduce subjectivity and rater errors, no collectors rated their own video clips.
The quality of the segments was assessed by identifying the behavioural markers for each indicator. The number, frequency, and prevalence of the behavioural markers were used to rate indicators as low, medium, or high. The indicators under each dimension were then combined in a standardized way to form a score from 1 to 7, where 1–2 indicated low quality, 3–5 medium quality, and 6–7 high quality.
To promote IRA, raters were certified according to the CLASS-S manual. The certification process consisted of a two-day training course and a test on which the raters had to score a minimum of 80% within one (PWO) over five sequences. In addition to the formalized CLASS-S certification, we used the scores of the most experienced raters as a reference to calibrate the rater corps. This was performed with four sequences before the gathered data were scored. We discovered that the complexity of the measure rendered further calibration necessary. The instructional support domain proved to be particularly challenging when seeking rater consensus.
Measures
As mentioned, the CLASS-S protocol organizes student-teacher interactions into three overarching domains – Emotional Support, Classroom Organization, and Instructional Support – and 12 dimensions. Each domain comprises three to four dimensions that observers score on a 7-point scale, with 1–2 indicating low quality, 3–5 medium quality, and 6–7 high quality. Each dimension also consists of three to four indicators (behavioural markers). The Student Engagement dimension is not incorporated into any of the domains but reflects the overall engagement level of students in the classroom (Pianta, Hamre, & Allen, Citation2012). Following previous CLASS-S validation studies (Allen et al., Citation2013; Hafen et al., Citation2015; Virtanen et al., Citation2017), the Student Engagement dimension was not included in the present study.
Rater Training
The CLASS-S was administered by eight trained and certified raters who used videos of teachers’ classroom practices. In accordance with the aforementioned CLASS procedures, the raters received a two-day training on the CLASS-S rubric and were required to score in agreement with master coders (at least 80% of the ratings were within one scale point) before starting observations. The raters also performed calibration exercises on a sample of videos of Norwegian classrooms until pairs of raters scored at least 80% of their ratings within one scale point. Project staff members who were experienced in CLASS-S scoring then reviewed the scores with the raters and discussed the disagreements between their scores.
Data Analysis
Inter-rater agreement was calculated by having two raters randomly rate 20% of the teacher’s segments (80 video clips). The primary IRA index reported in both the CLASS-S manual and in previous CLASS studies is PWO analysis (Allen et al., Citation2013; McCaffrey et al., Citation2015; Pianta, Hamre, & Allen, Citation2012). As PWO is the primary indicator of IRA in the CLASS-S manual, this procedure was also considered the reliability indice in the current study. As mentioned, PWO is calculated by scores that are considered to be in agreement if they fall within +/-1 point of one another. The authors of the CLASS used 0.80 as an acceptable IRA based on a PWO analysis. For two raters to achieve 80% reliability on a segment, 80% of the scores must fall within one point of one another.
Structural validity
We investigated the structural validity based on two different approaches. First, we averaged the scores as CLASS traditionally has done (e.g., Bell et al., Citation2012; Sandilos & DiPerna, Citation2011) – that is, we averaged all observers’ dimension scores for each segment and then averaged those dimension scores across the segments. Based on these data, we performed a series of alternative confirmatory factor analyses (CFAs) (Muthén & Muthén, Citation1998-2015). Over the past few years, this approach to the structural validation of the CLASS-S has been questioned (e.g., Hafen et al., Citation2015; Malmberg et al., Citation2010; McCaffrey et al., Citation2015). The traditional approach is criticized for not considering the nested structure of data with segments nested within lesson and teachers/classrooms. Therefore, we also conducted a series of two-level CFAs, correcting the standard errors for the highest level of clustering using the two-level complex commands in Mplus (Muthén & Muthén, Citation1998-2015). The two-level model is specified so that the items load on their substantive constructs at the within level (observation segments). At the between level (lessons/time points), the indicators of the latent constructs are the latent average of the within-level indicators based on the between-level covariance matrix (Muthén, Citation1991; Reise, Ventura, Nuechterlein, & Kim, Citation2005). To identify the model measurement, intercepts were fixed to zero at the within level and estimated at the between level (Muthén & Muthén, Citation1998-2015).
Similar to previous analyses of the CLASS-S factor structure (e.g., Hafen et al., Citation2015), our evaluation criteria included a comparative fit index (CFI) above 0.90 and close to 0.95, a root mean square error of approximation (RMSEA) under 0.10 and close to 0.060, and a standardized root mean square residual (SRMR) under 0.120 and close to 0.80. In addition, we included the Tucker Lewis Index (TLI) above 0.90 and close to 0.95 and the chi-square test (Χ2) (Hu & Bentler, Citation1999; Schermelleh-Engel, Moosbrugger, & Müller, Citation2003). Goodness of fit indices have been developed for single-level models. Therefore, we also used the guidelines described by Ryu (Ryu, Citation2015; Ryu & West, Citation2009) to test the goodness of fit (for CFI and RMSEA) of the within- and between-level models separately (see also Hox, Moerbeek, & van de Schoot, Citation2010). Given that data were missing for some dimensions for a few teachers, we used full information maximum likelihood to estimate our structural parameter. Maximum likelihood estimation with robust standard errors (MLR) was applied. Given that the amount of missing data was small (< 1%), it is unlikely that missing data affected the results.
Results
The first aim of the study was to measure the IRA for the CLASS-S domains and dimensions. The IRA was calculated across a sample of segments in the video observations. Agreement calculations were computed by segment, and all eight segments were calculated separately. The reliability indices for the domain and dimension scores from the PWO analysis are reported in . The mean domain scores for the eight segments within the four domains ranged from 67 to 85 PWO, with Classroom Organization and Student Engagement being highest (85 and 81 PWO, respectively). Dimension scores ranged from 30 to 100 PWO, with Instructional Learning Formats and Instructional Dialog obtaining the lowest scores (30) and Teacher Sensitivity, Behavioural Management, Negative Climate, and Quality of Feedback obtaining the highest scores (100).
Table 1. Classroom Assessment Scoring System – Secondary Domains and Dimensions.
Table 2. Inter-rater agreement for Percent Within One for all eight segments.
The descriptive statistics are presented in and are based on the eight videotaped segments. The mean scores ranged from 2.38 (Analysis and Inquiry) to 6.65 (Negative Climate). All variables are considered normal with a kurtosis or skewness value +/−1.96 (Field, Citation2009).
Table 3. Item/scale means (M), standard deviation (SD), Skewness (Skew), Standard Error for Skewness (SE skew), Kurtosis (Kurt), Standard Error Kurtosis (SE kurt) Minimum (Min) and Maximum score (Max) for Emotional support, Classroom Organisation Instructional support, and Student Engagement.
presents a matrix of the bivariate correlations between the domains of Emotional Support, Classroom Organization, and Instructional Support, along with the specific dimensional scales to measure teacher-student interaction quality.
Table 4. Correlations among domains and dimension scales.
One aim of this study was to examine whether a three-factor structure similar to that described for the original CLASS-S was supported by data from a Norwegian sample. First, we tested the original factor structure based on the traditional approach, which is based on measures across all segments. Confirmatory factor analyses (CFA) were conducted in which all observers’ dimension scores for each segment were averaged, and then those dimension scores were averaged across the segments. Fit indices for the original three-factor structure were provided, and a model with all dimensions loading on the same factor was tested. The CFA supported the loading of scales onto the domains, as presented earlier, with all factors loading 0.68 or higher on the relevant factor. The original three-factor model provided a relatively poor fit for all fit indices (Χ2[41] = 132.09, p < 0.001; CFI = 0.82, TLI = 076; RMSEA = 0.207, SRMR = 0.109). An inspection of the modification indices indicated that the fit was improved by allowing the error term for the dimensions Analysis and Inquiry (AI) and Instructional Dialog (ID) in the Instructional Support domain and the error terms for the dimensions Negative Climate (NC) and Behavioural Management (BM) to correlate. There is theoretical support for the assumption that AI and ID may belong to a common unobserved factor. This also applies to the dimensions NC and BM. As observed in and , this improved the three-factor model (Χ2[41] = 84.03, p = 0.001; CFI = 0.92, TLI = 0.88; RMSEA = 0.145, SRMR = 0.101). Moreover, high modification indices indicated a cross loading of the dimension Instructional Learning Formats (ILF) on the Emotional Support domain. Exploring a model in which ILF loaded on the Emotional Support domain, and not the Instructional Support domain, improved the fit (Χ2[40] = 72.75, p = 0.001; CFI = 0.94, TLI = 0.91; RMSEA = 0.125, SRMR = 0.095). However, as shown in , in the alternative three-factor model, freeing the aforementioned error terms improved the fit for some indices (Χ2[40] = 84.03, p < 0.001; CFI = 0.91, TLI = 0.88; RMSEA = 0.145, SRMR = 0.101), as did excluding the ILF dimension from the analysis, allowing the error terms of AI and ID and of NC and BM to correlate (Χ2[31] = 59.48, p = 0.002; CFI = 0.94, TLI = 0.91; RMSEA = 0.133, SRMR = 0.101). For all models applying the traditional approach, Productivity (P) exhibited a nonsignificant, negative, residual variance that needed to be fixed to zero in order for the models to converge.
Figure 1. Classroom Assessment Scoring System- Secondary (CLASS-S). Single level three-factor model.
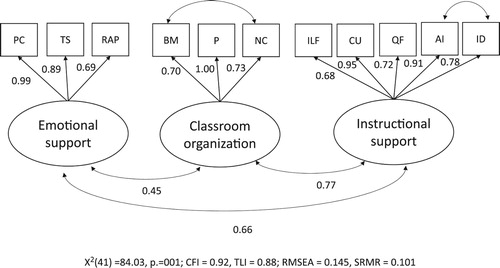
Table 5. Summary of model fit indices for alternative confirmatory factor models.
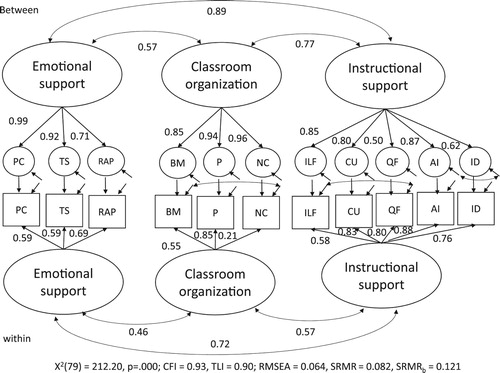
An alternative approach that considered the nesting of segments within lessons and teachers provided a better fit to the data. Increasingly, multilevel approaches to the factor structure have been applied to evaluate of the factor structure of both the secondary version (e.g., Malmberg et al., Citation2010; McCaffrey et al., Citation2015) and other versions of the CLASS (e.g., Sandilos, Shervey, DiPerna, Lei, & Cheng, Citation2016). As reported in and , the multilevel model testing the original factor structure provided acceptable fit indices on all but one of the indices (Χ2[79] = 212.20, p < 0.001; CFI = 0.93, TLI = 0.90; RMSEA = 0.064, SRMR = 0.082, SRMRb = 0.121). This result was found given that the error terms for NC and BM and for Quality of Feedback (QF) and ILF were freed at within level and the error terms ID and AI at between level were allowed to correlate. Allowing the error terms for NC and BM to correlate resulted in a low insignificant factor loading (0.21) for NC. Although the chi-square test was significant and the SRMR value at the between level was slightly above the threshold for an acceptable fit, this model fit the data best. The alternative multilevel models with ILF loading on the Emotional Support domain and the model excluding ILF from the analysis did not provide a better fit.
Figure 2. Classroom Assessment Scoring System- Secondary (CLASS-S). Multilevel three-factor model.
Discussion
As mentioned, one of the most challenging aspects of applying classroom observational protocols such as the CLASS-S is the process of training observers in order to establish high IRA (Park, Chen, & Holtzman, Citation2014). Thus, the first research question to be answered in the present study was to what extent trained observers can reliably code the interactions between teachers and students using the CLASS-S in a Norwegian context.
As expected, PWO, being a broad indicator of interrater agreement, provided high and acceptable IRA. We found that the results were in accordance with those of previous studies (Bell et al., Citation2012; Gitomer et al., Citation2014; Sandilos & DiPerna, Citation2011; Virtanen et al., Citation2017).
Some of the threats to a high standard of IRA are rater experience, training processes, calibration, and the procedures used during video ratings (Bell et al., Citation2012; Casabianca, Lockwood, & McCaffrey, Citation2015; Cash, Hamre, Pianta, & Myers, Citation2012). The current study followed the same procedures as the CLASS-S regarding training and calibration, and the raters scored the videos according to the CLASS-S specifications. The eight raters were all employed at the university and trained and certified in the CLASS-S observational instrument, and some (6 out of 8) of the raters were experienced teachers. Calibration exercises were conducted until pairs of raters scored at least 80% of the ratings within one scale point (PWO). This is in line with previous research revealing that calibration exercises are important to identify and follow up with raters who struggle with the protocols (Casabianca et al., Citation2015; Cash et al., Citation2012). However, despite good training and calibration exercises, a previous study found that rater drift occurred over time (Casabianca et al., Citation2015). Casabianca and colleagues found that raters were more lenient at the beginning than at the end of observations and that the gap between the raters increased towards the end. We found no evidence of this phenomenon in our study. On the contrary, the mean domain IRA was relatively stable across the eight segments, suggesting low rater drift. A possible reason for this finding may be that the use of video observations allowed raters to score all segments and lessons from one classroom within a shorter period of time, compared with scoring live observations carried out over a whole academic year.
Some components of an observation instrument can be more difficult to rate than others. The present research revealed that the Instructional Support domain, particularly Instructional Dialogue, had the lowest IRA. This finding might imply that the Instructional Support domain is difficult to teach, learn and rate at the secondary level. It is possible that the dimensions under Instructional Support are unclear for raters. Furthermore, ratings may be affected by whether the raters have previous rating or teaching experience and what their beliefs are (Bell et al., Citation2012). The CLASS dimensions might reflect a way of thinking about teaching that contrasts with their prior experience as a teacher. Finally, the dimensions’ complexity could possibly result in a cognitive overload during the rating process (Joe et al., Citation2014). Consequently, the raters might have difficulty reaching a shared understanding of what constitutes Instructional Support in the CLASS-S protocol (Bell et al., Citation2012; Cash et al., Citation2012; Hafen et al., Citation2015).
The fact that some dimensions are more difficult to rate than others may have implications for how raters are selected and trained to perform observational assessments. Calibration exercises in this study involved a process of increasing awareness when discussing the discrepancy between the raters and the more experienced project observers. The IRA coefficients for the PWO were generally acceptable; they were low for all dimensions except dimensions ILF and ID.
However, the level of IRA is not determined exclusively by the process of training and calibration. Mashburn, Meyer, Allen, and Pianta (Citation2014) found that operational procedures related to length of observation and order of presentation can impact the reliability and validity of scores. This was considered in the present study, as observation procedures were carried out according to the standard CLASS-S protocol; two 15-minute segments (15 minutes per lesson per teacher) were observed and rated non-sequentially in order to avoid carryover effects and thus reduce rater bias (Mashburn et al., Citation2014).
The findings from the current study indicate that the IRA is satisfactory and in line with the IRA of previous studies using the CLASS protocol. Moreover, the results support the notion that it is possible to train raters to reliably code the interactions between teachers and students in the classroom using standardized observational protocols. However, the study also illustrates, as do previous studies, the challenges of obtaining high IRA for complex protocols, such as the CLASS, comprising several dimensions that are scored from one to seven.
One may argue that in larger studies using multiple raters, the use of video observation enables the calculation of IRA across all raters, not only pairs. Of course, increasing the number of raters will most likely reduce the IRA as complexity increases (Fleiss & Cohen, Citation1973; Fleiss & Deese, Citation1971). Because CLASS-S is a relatively new, complex system with multiple levels and dimensions, it may be vulnerable to error across raters. In the current study, for calibration, all raters scored the same video segments. None of the observers were allowed to score unless they scored within 80% of the scores of the two most experienced observers using the PWO approach. This procedure was repeated for three different segments across observers until all eight observers scored within 80%. Although IRA was not tested across all raters, there is reason to believe that this calibration procedure increased the IRA tested within pairs.
The results from this study reveal that it is possible to train raters to reliably code the interactions between teachers and students using standardized observational protocols. However, some of the low IRA suggests that there remains work to be done in training raters.
Factor Structure
To answer the second research question, we investigated whether the factor structure of the CLASS-S was supported in a sample of teachers at secondary schools in Norway. First, we investigated the factor structure applying a traditional approach, averaging the dimension scores across segments and lessons and analysing them. Generally, given that some error terms were allowed to correlate, the results provided support for the current dimensions and domains described in the CLASS-S manual (Pianta, Hamre, & Mintz, Citation2012) and supported by research (Hafen et al., Citation2015). It should be noted that the Instructional Learning Formats dimension loaded higher on the Emotional Support domain than on the Instructional Support domain. Despite this, the CFA did not indicate a substantially better fit when ILF was included in the Emotional Support domain instead of the Instructional Support domain. Allowing ILF to load on both the Emotional Support domain and the Instructional Support domain improved the fit slightly. We cannot rule out the possibility that there are differences between Norwegian and US classrooms that affect the factor structure with respect to the ILF dimension. Some of the instructional behaviours typically reflected within the ILF dimensions (e.g., promoting involvement, teachers’ active display of interest and engagement in students’ work and participation, and effective engagement) may load stronger on the Emotional Support domain due to the particularly strong emphasis on positive teacher-student relationships in Norwegian schools. Given this emphasis, in comparison to US teachers, Norwegian teachers may adopt a more relational approach to instruction. Malmberg et al. (Citation2010) omitted the ILF dimension from their factor structure to obtain good fit to the data, as did Virtanen et al. (Citation2017). It should be noted that the sample in Malmberg and colleagues included beginning teachers. We cannot rule out the possibility that their level of experience may have affected the factor structure, as this group of teachers may have been homogenous compared to a sample of teachers with varying levels of experience. Alternatively, the findings may have been attributed to the small sample of classrooms.
Similar to Hafen et al. (Citation2015), we found that a three-factor solution fit the data better than the alternative one-factor solution. The results for the different factor models tested were similar to or better than the corresponding fit indices Hafen et al. (Citation2015) reported for different samples included in their study. It should be noted that Hafen and colleagues reported results only for the CFI and the RMSEA. In the current sample, the RMSEA value exceeds the cut-offs considered acceptable (Hu & Bentler, Citation1999). This also applied for some of the samples included by Hafen et al. (Citation2015). Chen, Curran, Bollen, Kirby, and Paxton (Citation2008) argued, based on a simulation study, that a cut-off of 0.05 for RMSEA is too conservative for small samples. In summary, it can be argued that the factor structure found in the current study was lower than what is commonly considered a good fit (Hu & Bentler, Citation1999). However, except for the RMSEA value, the values were within what is considered acceptable. Moreover, they were similar to what is found in previous studies of the CLASS-S applying the same analytical approach (Malmberg et al., Citation2010; McCaffrey et al., Citation2015).
A possible reason for the somewhat low fit in the current study, as in most previous studies, may be the underlying assumption of the traditional approach to assessing IRA and factorial structure – that is, that the independent video carries equal weight in affecting the final score (Gregory & Mikami, Citation2015). This assumption has been questioned (e.g., Cash & Pianta, Citation2014; Gregory & Mikami, Citation2015; Malmberg et al., Citation2010). An alternative assumption is that any variability displayed by a participant across time points represents measurement error (Gregory & Mikami, Citation2015). Another possible explanation may be rater error, that is, variability due to differences in how multiple raters score the same lesson or segment of a lesson (McCaffrey et al., Citation2015). In the current study, eight raters scored the 416 segments. The score of an individual rater depended, in addition to the classroom interaction he or she observed, on the general level of leniency in scoring compared with other raters. In addition, it depended on his or her specific leniencies for the observed segment, lesson, classroom, and teacher. Previous research on observation protocols indicates that this rater error is a major source of variability in scores (see, e.g., Casabianca et al., Citation2015; McCaffrey et al., Citation2015; Muthén & Muthén, Citation1998-2015). Accordingly, it is reasonable to assume that rater error may influence the testing of the factor structure.
However, there may also be theoretical and conceptual reasons for the somewhat low fit in the current study, as well as in previous studies. Given that teaching quality is a multidimensional concept (Pianta, Hamre, & Allen, Citation2012), it is unclear whether the three domains represent strictly distinct constructs. This is not only a question concerning the construct but also a question of how classroom interaction is assessed, for example, as illustrated by the cross loading of Instructional Learning Formats in the current study. From a measurement perspective, this overlap should not only manifest in high correlations between the two factors/domains of classroom interaction but also in an improvement in goodness of fit when models are used to account for items could belong to more than one factor (Scherer, Nilsen, & Jansen, Citation2017). An investigation of a bifactor model, which assumes a general factor and uncorrelated specific factors (Reise, Citation2012; Scherer et al., Citation2017), may shed additional light on the factor structure of the CLASS-S. Previous studies of other versions of the CLASS have indicated that a bifactor model provides a better fit than a three factor model (Hamre, Hatfield, Pianta, & Jamil, Citation2014). Due to the relatively small sample size of this study, testing a bifactor model was not possible. Future studies testing a bifactor model are highly welcomed.
The tested multilevel models of the proposed factor structure, taking the variability between segments and lessons into account, fit the data slightly better than the factor structure found with the traditional approach and were within what is considered acceptable. Nonetheless, some fit indices did not meet the cut-off criteria. Previous studies have reported a similar or worse fit (e.g., Malmberg et al., Citation2010). The low factor loading for the NC dimension at the within level when allowing the error terms of the NC and BC to correlate indicates the need for caution in the interpretation of the results. A larger sample of teachers, and thus of lessons and segments, will allow for further investigation of the factor loading of the NC. If the low factor loading is consistent, omitting the NC from the model should be considered.
Applying procedures to test model fit at each level (Hox et al., Citation2010; Ryu, Citation2015; Ryu & West, Citation2009) indicated that the model provided a good fit at the within level, but marginally failed to provide an acceptable fit at the between level. The discussion of factorial validity of the CLASS-S would benefit from including this procedure in future studies. One cannot assume that the factor structure relating multiple indicators to latent structure is necessarily the same at all levels (Marsh et al., Citation2012).
In summary, the results of the current study indicate acceptable IRA scores and an acceptable fit of the factor structure when applying both a traditional approach and a multilevel approach and considering the variability between segments and lessons. The three-factor models tested in the current study consisted of the original model (Pianta, Hamre, & Mintz, Citation2012) and alternative models, indicated by the modification indices. Both a traditional approach (averaging scores across segments and lessons) and a multilevel approach were tested. More studies using larger samples must be conducted before a final conclusion is drawn regarding the validity of the CLASS-S in Norway. However, the finding of the current study largely support the application of the three-factor structure suggested by Pianta, Hamre, and Mintz (Citation2012) in Norway.
Methodological Considerations
A strength of the study is that it addresses the use of observations to investigate classroom interaction. Compared to the number of studies drawing on student and teacher reports, studies applying systematic observations are scarce, particularly in Scandinavia. Valid measurements for systematic observations of classroom interaction and the operationalization of a theoretical framework into domains and dimensions that have specific behavioural indicators have potential for providing teachers with knowledge on how to specifically translate knowledge on effective classroom interaction into practice. Moreover, teachers can receive feedback that is valuable for the further development of their teaching skills. Another strength is the testing of reliability and the original factor structure in a new cultural setting. Moreover, in addition to the traditional approach to analysing the factor structure, it included multi-level analysis that considered the hierarchical nature of the data; in contrast, most studies applying the CLASS protocol have traditionally not considered the nature of the data. In the past few years, a few studies have addressed the nested nature of the data (e.g., Malmberg et al., Citation2010; McCaffrey et al., Citation2015). Furthermore, the number lessons (208) and segments (416) was substantial, and data were collected over one academic year. However, there are some obvious limitations to the study. First, although our video-recorded observations included four lessons and eight segments for each teacher, the sample of teachers was relatively small. Multilevel models allowed for the appropriate use of the hierarchically nested data and hence prevented ecological fallacies (i.e., interpreting findings at the wrong level of the hierarchical structure [Hox et al., Citation2010; Snijders & Bosker, Citation2012]). Nevertheless, observations represent snapshots of classroom interaction and will never provide a full picture of the interaction (Muijs, Citation2006). Second, the sample of teachers was not drawn from a nationally representative population. It was difficult to estimate the selection bias of the teachers recruited for the study and their classrooms and to select the lessons to be included; therefore, we caution against broader generalizations of the findings before further replications of the present study are available. However, it should be noted that in a previous study using the same sample, there was no indication that the classrooms included in the observation sample contained students who were more motivated than those in the larger study not included in the observation study (Bjerga, Citationin press).
Third, we positioned one camera with a microphone at the back of each classroom, and the teacher had a lapel microphone. Because there was no second synchronized camera positioned at the front of the classroom pointed toward the students, some of the students’ facial expressions were unavailable for coding. Fourth, our CFA did not fully confirm the a priori factor structure of the CLASS-S (Pianta, Hamre, & Allen, Citation2012). Our analysis provided an acceptable fit for most indices depending that some error terms were correlated. A possible reason for this may be cultural differences. Previous research on the CLASS-S in the UK (Malmberg et al., Citation2010) did not find support for the suggested secondary structure at the time (Pianta, La Paro, & Hamre, Citation2006). However, a revised version omitting some of the dimensions provided a good fit.
Final Thoughts
Observational assessment is increasingly being used to evaluate the quality of interaction between teachers and students in classroom environments. The development of standardized classroom observation systems enables the observation of large samples of teachers and classrooms. The study at hand indicates that an acceptable IRA can be achieved in a Norwegian setting, and it reports promising results regarding the structural validity of the CLASS-S. The findings provide support for the CLASS-S as a universal assessment tool across cultural contexts. The tool provides an opportunity to investigate classroom interaction across diverse contexts to inform educational theory and practise (Gregory & Mikami, Citation2015). Inter-rater agreement and structural validity evidence is essential but not sufficient to determine the validity of assessment scores used for a specific purpose (Sandilos et al., Citation2016). Future studies should continue to examine the relationship between the CLASS domain and dimensions and students’ academic and social outcomes.
In addition to investigating how the CLASS-S domains and dimensions relate to student outcomes, CLASS-S is used as a professional development tool for teachers. The current study, which supports the validity of the CLASS-S protocol, also supports the applicability of the protocol for professional development. A way to further explore the validity of the CLASS-S is to continue to examine the utility of this measure as a formative assessment that may advance or accelerate teachers’ professional development (e.g., Hamre et al., Citation2008).
The TTI framework offers one view into the quality of teacher-student interactions in classrooms, which are a key aspect of teachers’ jobs. The results of the current study support the validity of the CLASS-S to assess these interactions in a Norwegian context. The current study adds to the initial evidence that this is a robust model for understanding classroom interactions across cultures (Malmberg & Hagger, Citation2009). Moreover, the study adds to the evidence that teacher-student interactions, as observed by the CLASS-S, can reasonably be organized into domains of Emotional Support, Classroom Organization and Instructional Support across samples. This framework provides a vehicle that may help link research-based knowledge on classroom interactions to teacher evaluation and professional development.
Disclosure Statement
No potential conflict of interest was reported by the authors.
Additional information
Funding
References
- Allen, J. P., Gregory, A., Mikami, A., Lun, J., Hamre, B., & Pianta, R. (2013). Observations of effective teacher-student interactions in secondary school classrooms: Predicting student achievement with the classroom assessment scoring system-secondary. School Psychology Review, 42(1), 76–98.
- Allen, J. P., Pianta, R. C., Mikami, A. Y., & Lun, J. (2011). An interaction-based approach to enhancing secondary school instruction and student achievement. Science, 333(6045), 1034–1037.
- Bell, C. A., Gitomer, D. H., McCaffrey, D. F., Hamre, B. K., Pianta, R. C., & Qi, Y. (2012). An argument approach to observation protocol validity. Educational Assessment, 17(2-3), 62–87.
- Bjerga, E. (in press). Relasjonen mellom læreratferd og elevers engasjement [Associations between teacher behavior and student engagement]. Accepted for publication in FoU i praksis.
- Casabianca, J. M., Lockwood, J. R., & McCaffrey, D. F. (2015). Trends in classroom observation scores. Educational and Psychological Measurement, 75(2), 311–337.
- Cash, A. H., Hamre, B. K., Pianta, R. C., & Myers, S. S. (2012). Rater calibration when observational assessment occurs at large scale: Degree of calibration and characteristics of raters associated with calibration. Early Childhood Research Quarterly, 27(3), 529–542.
- Cash, A. H., & Pianta, R. C. (2014). The role of scheduling in observing teacher-child interactions. School Psychology Review, 43(4), 428–449.
- Chen, F., Curran, P. J., Bollen, K. A., Kirby, J., & Paxton, P. (2008). An empirical evaluation of the Use of fixed cutoff points in RMSEA test statistic in structural equation models. Sociological Methods and Research, 36(4), 462–494.
- Danielson, C. (2013). The framework for teaching evaluation instrument. Princeton, NJ: The Danielson Group.
- Downer, J. T., Stuhlman, M., Schweig, J., Martínez, J. F., & Ruzek, E. (2015). Measuring effective teacher-student interactions from a student perspective: A multi-level analysis. Journal of Early Adolescence, 35(5–6), 722–758.
- Ertesvåg, S. K., & Havik, T. (2017). Student ratings of classroom interaction. Under review.
- Evertson, C. M., & Weinstein, C. S. (2006). Classroom management as a field of inquiry. In Handbook of classroom management: Research, practice, and contemporary issues (pp. 3–15). Mahwah, NJ: Lawrence Erlbaum Associates Publishers.
- Fauth, B., Decristan, J., Rieser, S., Klieme, E., & Buttner, G. (2014). Student ratings of teaching quality in primary school: Dimensions and prediction of student outcomes. Learning and Instruction, 29, 1–9.
- Field, A. P. (2009). Discovering statistics using SPSS. London, England: SAGE.
- Fleiss, J. L., & Cohen, J. (1973). The equivalence of weighted kappa and the intraclass correlation coefficient as measures of reliability. Educational and Psychological Measurement, 33(3), 613–619.
- Fleiss, J. L., & Deese, J. (1971). Measuring nominal scale agreement among many raters. Psychological Bulletin, 76(5), 378–382. doi:10.1037/h0031619
- Gamlem, S. M., & Munthe, E. (2014). Mapping the quality of feedback to support students’ learning in lower secondary classrooms. Cambridge Journal of Education, 44(1), 75–92.
- Gitomer, D. H., Bell, C. A., Qi, Y., McCaffrey, D. F., Hamre, B. K., & Pianta, R. C. (2014). The instructional challenge in improving teaching quality: Lessons from a classroom observation protocol. Teachers College Record, 116(6), 1–32.
- Gregory, A., Allen, J. P., Mikami, A. Y., Hafen, C. A., & Pianta, R. C. (2014). Effects of a professional development program on behavioral engagement of students in middle and high school. Psychology in the Schools, 51(2), 143–163.
- Gregory, A., & Mikami, A. Y. (2015). Systematic observation of early adolescents in educational settings: The good, the Bad, and the ugly. Journal of Early Adolescence, 35(5-6), 714–721.
- Hafen, C. A., Hamre, B. K., Allen, J. P., Bell, C. A., Gitomer, D. H., & Pianta, R. C. (2015). Teaching through interactions in secondary school classrooms: Revisiting the factor structure and practical application of the classroom assessment scoring system-secondary. Journal of Early Adolescence, 35(5-6), 651–680.
- Hamre, B. K., Hatfield, B., Pianta, R., & Jamil, F. (2014). Evidence for general and domain-specific elements of teacher-child interactions: Associations with preschool children’s development. Child Development., 85(3), 1257–1274.
- Hamre, B. K., & Pianta, R. C. (2007). Learning opportunities in preschool and early elementary classrooms. In R. C. Pianta, M. J. Cox, & K. L. Snow (Eds.), School readiness and the transition to school (pp. 49–84). Baltimore, MD: Brookes.
- Hamre, B. K., Pianta, R. C., Mashburn, A. J., & Downer, J. T. (2008). Building a science of classrooms: Application of the CLASS framework in over 4,000 US early childhood and elementary classrooms. Retrieved from https://www.researchgate.net/profile/Jason_Downer/publication/237728991_Building_a_Science_of_Classrooms_Application_of_the_CLASS_Framework_in_over_4000_US_Early_Childhood_and_Elementary_Classrooms/links/0046352cc1bf3e4168000000.pdf
- Hattie, J., & Timperley, H. (2007). The power of feedback. Review of Educational Research, 77(1), 81–112.
- Hox, J. J., Moerbeek, M., & van de Schoot, R. (2010). Multilevel analysis: Techniques and applications. New York: Routledge.
- Hu, L. T., & Bentler, P. (1999). Cutoff criteria for fit indexes in covariance structure analysis: Conventional criteria versus new alternatives. Structural Equation Modeling: A Multidisciplinary Journal, 6(1), 1–55.
- Joe, J. N., McClellan, C. A., & Holtzman, S. L. (2014). Scoring design decisions: Reliability and the length and focus of classroom observations. In T. J. Kane, K. A. Kerr, & R. C. Pianta (Eds.), Designing teacher evaluation systems: New guidance from the measures of effective teaching project (pp. 415–442). San Francisco, CA: Jossey-Bass A Wiley Brand.
- Kane, T. J., Kerr, K. A., & Pianta, R. C. (2014). Designing teaching evaluation studies. San Francisco, CA: Bill & Melinda Gates Foundation.
- Kane, T. J., & Staiger, D. O. (2012). Gathering feedback for teaching: Combining high-quality observations with student surveys and achievement gains. Seattle, WA: Bill & Melinda Gates Foundation.
- Klieme, E., Pauli, C., & Reusser, K. (2009). The Pythagoras study: Investigating effects of teaching and learning in Swiss and German mathematics classrooms. In T. Janik & T. Seidel (Eds.), The power of video studies in investigating teaching and learning in the classroom (pp. 137–160). Münster, Germany: Waxmann.
- Kunter, M., & Baumert, J. (2006). Who is the expert? Construct and criteria validity of student and teacher ratings of instruction. Learning Environments Research, 9, 231–251.
- Lipowsky, F., Rakoczy, K., Pauli, C., Drollinger-Vetter, B., Klieme, E., & Reusser, K. (2009). Quality of geometry instruction and its short-term impact on students’ understanding of the pythagorean theorem. Learning and Instruction, 19, 527–537.
- Malmberg, L.-E., & Hagger, H. (2009). Changes in student teacher’s agency beliefs during a teacher education year, and relationships with observed classroom quality, and day-to-day experiences. British Journal of Educational Psychology, 79, 677–694.
- Malmberg, L.-E., Hagger, H., & Burn, K. (2010). Observed classroom quality during teacher education and Two years of professional practice. Journal of Educational Psychology, 102(4), 916–932.
- Marsh, H. W., Lüdtke, O., Nagengast, B., Trautwein, U., Morin, A. J. S., Abduljabbar, A. S., & Köller, O. (2012). Classroom climate and contextual effects: Conceptual and methodological issues in the evaluation of group-level effects. Educational Psychologist, 47, 106–124.
- Mashburn, A. J., Meyer, J. P., Allen, J. P., & Pianta, R. C. (2014). The effect of observation length and presentation order on reliability and validity of an observational measure of teaching quality. Educational and Psychological Measurement, 74(3), 400–422.
- McCaffrey, D. F., Yuan, K., Savitsky, T. D., Lockwood, J. R., & Edelen, M. O. (2015). Uncovering multivariate structure in classroom observations in the presence of rater errors. Educational Measurement: Issues and Practice, 34(2), 34–46.
- Ministry of Education. (2011). Meld. St. 22 (2010-2011) Motivasjon - Mestring - Muligheter: Ungdomstrinnet.
- Muijs, D. (2006). Measuring teacher effectiveness: Some methodological reflections. Educational Research and Evaluation, 12(1), 53–74.
- Muthén, B. O. (1991). Multilevel factor analysis of class and student achievement components. Journal of Educational Measurement, 28, 338–354.
- Muthén, L. K., & Muthén, B. O. (1998-2015). Mplus Useŕs Guide Statistical Analysis With Latent Variables.
- Olswang, L. B., Svensson, L., Coggins, T. E., Beilinson, J. S., & Donaldson, A. L. (2006). Reliability issues and solutions for coding social communication performance in classroom settings. Journal of Speech, Language, and Hearing Research, 49(5), 1058–1071.
- Pakarinen, E., Lerkkanen, M.-K., Poikkeus, A.-M., Kiuru, N., Siekkinen, M., Rasku-Puttonen, H., & Nurmi, J.-E. (2010). A validation of the classroom assessment scoring system in Finnish kindergartens. Early Education and Development, 21(1), 95–124.
- Park, Y. S., Chen, J., & Holtzman, S. L. (2014). Evaluating efforts to minimize rater bias in scoring classroom observations. In T. J. Kane, K. A. Kerr, & R. C. Pianta (Eds.), Designing teacher evaluation system: New guidance from the measures of effective teaching project (pp. 383–414). San Francisco, CA: Jossey-Bass A Wiley Brand.
- Pianta, R. C., Hamre, B. K., & Allen, J. P. (2012). Teacher-Student relationships and engagement: Conceptualizing, measuring, and improving the capacity of classroom interactions. In Handbook of research on student engagement (pp. 365–386). New York, NY: Springer Science.
- Pianta, R. C., Hamre, B. K., & Mintz, S. (2012). Secondary CLASS: Classroom assessment scoring system. Charlottesville, Virginia: University of Virginia.
- Pianta, R. C., La Paro, K. M., & Hamre, B. K. (2006). CLASS: Classroom Assessment Scoring System (Manual for Middle/Secondary School, Version June 2006). University of Virginia: Unpublished manuscript.
- Praetorius, A.-K., Pauli, C., Reusser, K., Rakoczy, K., & Klieme, E. (2014). One lesson is all you need? Stability of instructional quality across lessons. Learning and Instruction, 31, 2–12.
- Reise, S. P. (2012). The rediscovery of bifactor measurement models. Multivariate Behavioral Research, 47, 667–696.
- Reise, S. P., Ventura, J., Nuechterlein, K. H., & Kim, K. H. (2005). An illustration of multilevel factor analysis. Journal of Personality Assessment, 84(2), 126–136. doi:10.1207/s15327752jpa8402_02
- Ryu, E. (2015). Model fit evaluation in multilevel structural equation model. Frontiers in Psychology. 5 Article, 81, 1–9.
- Ryu, E., & West, S. G. (2009). Level-specific evaluation of model fit in multilevel structural equation modeling. Structural Equation Modeling: A Multidisciplinary Journal, 16(4), 583–601.
- Sandilos, L. E., & DiPerna, J. C. (2011). Interrater reliability of the classroom assessment scoring system-Pre-K (CLASS Pre-K). Journal of Early Childhood & Infant Psychology, 7, 65–85.
- Sandilos, L. E., Shervey, S. W., DiPerna, J. C., Lei, P., & Cheng, W. (2016). Structural validity of CLASS K–3 in primary grades: Testing alternative models. School Psychology Quarterly, 32(2), 226–239.
- Scherer, R., Nilsen, T., & Jansen, M. (2017). Evaluating Individual Students’ Perceptions of Instructional Quality: An Investigation of their Factor Structure, Measurement Invariance, and Relations to Educational Outcomes. Frontiers in Psychology. 7, Februar, Artikkel 110, 1-16.
- Schermelleh-Engel, K., Moosbrugger, H., & Müller, H. (2003). Evaluating the fit of structural equation models: Tests of significance and descriptive goodness-of-fit measures. Methods of Psychological Research Online, 8(2), 23–74.
- Snijders, T. A. B., & Bosker, R. J. (2012). Multilevel analysis: An introduction to basic and advanced multilevel modeling. London: Sage.
- Tashakkori, A., & Teddlie, C. (2010). Overview over contemporary issues in mixed methods design. In A. Tashakkori, & C. Teddlie (Eds.), Sage handbook of mixed methods in social & behavioral research (pp. 1–41). Los Angeles, CA: Sage Publisher.
- Virtanen, T., Pakarinen, E., Lerkkanen, M.-K., Poikkous, A.M., Siekkienen, M., & Nurmi, J.E. (2017). A validation study of classroom assessment scoring system-secondary in the Finnish school context. Journal of Early Adolescence. doi: 10.1177/0272431617699944
- Wiliam, D. (2011). What is assessment for learning? Studies in Educational Evaluation, 37(1), 3–14.
- Wubbels, T., Brekelmans, M., den Brok, P., Wijsman, L., Mainhart, T., & van artwijk, J. (2015). Teacher-student relationships and classroom management. In E. T. Emmer & E. J. Sabornie (Eds.), Handbook of classroom management (2nd ed., pp. 363–386). New York, NY: Routledge.