
ABSTRACT
School closures due to the COVID-19 pandemic raised concerns about increases in educational inequality. We examined the magnitude of the impact of the first school closure for vulnerable student groups in particular. This study was conducted among 886 Grade 3 - 5 students in the Netherlands in schools serving a high percentage of students from disadvantaged backgrounds. Piecewise growth analyses indicated that the school closures caused discontinuity in students’ achievement growth on national standardized tests and led to an average learning loss of 2.47 months in mathematics and 2.35 in reading comprehension, exceeding the duration of the school closure. Findings suggest that school closures contribute to educational inequality and indicate which students may particularly need additional support to overcome the adverse consequences of the lockdowns.
The outbreak of COVID-19 hit almost every aspect of daily live, including education. In many countries, schools were closed for substantial amounts of time and students were offered remote forms of learning. Teachers, parents, educators, and policy makers have been very concerned about potential delays in student learning, especially among students from disadvantaged families (UNESCO, Citation2020). There were immediate concerns that the school closures would contribute to educational inequalities as the school closures were expected to have the strongest impact on these students from disadvantaged families and thereby exacerbate existing differences in student achievement (Bol, Citation2020). In the Netherlands, schools were completely locked down for a total of eight weeks during the spring of 2020, and only partially re-opened in the weeks thereafter. The duration of this first school closure is similar to many other countries in the western and northern parts of Europe, such as Denmark (Jæger & Blaabæk, Citation2020) or Finland (Mankki, Citation2021). A first, large-scale study on the effects of the first lockdown in the Netherlands (Engzell et al., Citation2020) confirmed that many students suffered substantial learning losses, with an average learning loss equivalent to the amount of time students did not physically attend school. Moreover, their findings provided first indications that learning losses were more substantial among students from less-educated homes. It is suggested that this difference is accounted for by less favorable circumstances of the families, in which less resources or support was available to them when studying at home compared to students from more advantaged backgrounds (Biesta, Citation2020; Bol, Citation2020). Hence, the school closures appear to have exacerbated existing achievement gaps and contributed to educational inequalities. The present study aims to deepen our understanding of the effects of COVID-19 school closures on educational inequalities, by focusing on academic achievement growth in a sample of primary schools with a high share of students of disadvantaged backgrounds to investigate the magnitude of the impact of the first school closure for this particular group of students and to identify factors that may have contributed to the impact of the school closure.
National School Lockdown in the Netherlands
On March 16, 2020, all Dutch schools and child care centers were closed and only students who have parents with so-called “vital professions” (e.g., health, public transport) or students who were identified as the most vulnerable could attend child care or primary education. For eight weeks, almost all students were fully home-schooled and participated in remote education. From May 11, 2020 onwards, students could attend school in smaller groups for 50% of the time. The rest of the time, students were still expected to continue their learning at home. On June 8, 2020, all students were allowed back at school under somewhat normal circumstances. However, not all students returned to their classrooms immediately and some were absent or difficult to reach for a long time (Dutch Inspectorate of Education, Citation2020a). Schools provided remote education in the form of online meetings and provided students with learning materials to work independently. Nevertheless, teaching time was substantially reduced, in many cases to less than 50% (Dutch Inspectorate of Education, Citation2020a). There were large differences in the way schools delivered remote teaching. For example, the number of times teachers contacted their students varied widely: 52% of the schools contacted their students every day or multiple times a day, 37% a few times a week, 10% once a week, and 1% just once in the two weeks (Dutch Inspectorate of Education, Citation2020a).
Inequality in Education
Even though schools alone cannot compensate for impacting factors such as poverty and inequality, they are pivotal in creating equitable learning opportunities for all students as they serve, irrespective of their backgrounds. However, it is a well-known fact that there is a strong relation between social origin and educational attainment. That is, parental education, income, and wealth are related to students’ educational opportunities and achievements (Chudgar & Luschei, Citation2009; Schmidt et al., Citation2015; Stopforth et al., Citation2020). Even after accounting for the transmission of intellectual ability from parents to children, either due to genetics or upbringing, children from less educated homes tend to be less successful in school (Pfeffer, Citation2008). Similar to the US and European countries, also in the Netherlands, inequalities concerning the educational outcomes of students from higher and lower socio-economic backgrounds have been reported well before the outbreak of COVID-19 (cf. Darmody et al., Citation2021; Engzell et al., Citation2020). In the Netherlands, educational inequality has even been reported to be increasing in recent years (e.g., Dutch Inspectorate of Education, Citation2018). Two important reasons for this worrisome pattern were put forward. First, children of less educated parents are increasingly attending schools that struggle with teacher shortages even more than other Dutch schools. As a result of their struggle to find and hold on to teachers these schools also struggle with maintaining educational quality because of increased class size, and challenging teaching circumstances (c.f., Boterman, Citation2019). Second, higher educated parents create better educational opportunities for their children, for example by selecting specific schools for their children, or arranging homework classes or exam training (Jansen et al., Citation2021). Furthermore, higher educated parents are more likely to notice if there is a delay in the development of their children and look for and finance any additional support to overcome such delays (Dutch Inspectorate of Education, Citation2018; Jansen et al., Citation2021).
Expected Increase of Educational Inequalities due to School Closures
While the learning interruptions due to COVID-19 are unprecedented, previous studies found that other learning interruptions such as summer breaks or student absenteeism have a stronger impact on students from more disadvantages homes (Alexander et al., Citation2001; Borman et al., Citation2005). These studies imply that learning opportunities in school have compensatory effects for differences in the degree to which families are able to support their children’s learning at home (Alexander et al., Citation2007; Gershenson et al., Citation2017). These findings led scholars to expect that the COVID-19 school closures would have the strongest impact on the most vulnerable students (Kuhfeld et al., Citation2020), as during this period students were educated at home, relying more strongly on the material, cognitive, and psychological resources available in the home context than ever before. Indeed, various studies investigating students’ home learning environments, conducted soon after the first school closures, suggested a difference in learning opportunities between students from different socio-economic status during the COVID-19 school closures (Blundell et al., Citation2020; Darmody et al., Citation2021; Engzell et al., Citation2020; Jæger & Blaabæk, Citation2020; Pensiero et al., Citation2021). While all parents had to cope with huge additional demands on their time to care for their children at home (Andrew et al., Citation2020) and struggled with other commitments, their own skills or confidence, or the support provided by the school (Bol, Citation2020), parents in higher-income families and with higher levels of education were better able to cope with this situation (Blundell et al., Citation2020). Oftentimes, they were more able to carry out their work activities from home, had more space at home to educate their children, possessed more cognitive resources needed to help, and had savings to cover unforeseen expenditures. These circumstances were typically not present for less educated parents.
Given the differences in circumstances and resources between families with different educational backgrounds, it seems plausible that COVID-19 increased existing educational inequalities in terms of students’ school achievement. Extant research on teachers’ worry for their students indicates that teachers worried most about students in vulnerable home environments, for example living in poverty, having to deal with family stress, or having parents who are unable to adequately support their children’s learning (Kim & Asbury, Citation2020; Primdahl et al., Citation2021).
The aforementioned research by Engzell et al. (Citation2020), using the national achievement data of approximately 350.000 Dutch primary school students gave some first indications that the educational level of parents indeed affected the degree of learning loss due to COVID-19. In this study, they used a rather robust measure of parental education, which distinguished the lowest 8% from the rest of the population. Their findings indicated that learning losses were most substantial for students in these lowest categories of parental education compared to the other 92% (Engzell et al., Citation2020). Looking more deeply at this particular group of students can provide more insights into the effects of this first lockdown for vulnerable student groups. In addition, by examining this target group more in-depth, we aim to gain more insight into school and student characteristics which may explain or further increase the risk of adverse effects of the school closure.
Age and Sex
Although a lot of attention has been paid to the role of students’ socio-economic background concerning the effects of the school closures, the effects of the school closures may also depend on other student characteristics, such as age and sex. Engzell et al. (Citation2020) did not find such effects in the large sample they studied. But they did not study a possible effect of such factors within particular sub groups. We hypothesize that, as students were not in the vicinity of their teachers and expected to work more independently during the lockdown, particularly for students who lack support from home during remote teaching, self-regulatory skills are even more important than before (e.g., Dent & Koenka, Citation2016). Studies investigating students self-regulation skills have shown that in general older students are better able to seek assistance, set goals, plan, monitor, and organize their learning. Also, girls tend to make greater use of monitoring, organizing, goal setting, and planning (Schunk & Zimmerman, Citation2012). Hence, it may be that younger students and boys may be more strongly impacted by the school closures compared to older students and girls.
Present Study
To conclude, there seem to be clear indications that the first school closure due to COVID-19 has resulted in substantial learning losses, especially for students from more disadvantaged homes, thereby further exacerbating existing achievement gaps and thus increasing educational inequality. In this study, we extend extant research by focusing specifically on schools with a disadvantaged student population that mostly serve students that are likely most vulnerable to the educational impacts of COVID-19. We examine to what extent the school closures led to discontinuity in these students’ achievement growth in two subject domains: mathematics and reading comprehension, and which school and student factors contributed to a possible effect. In line with the study by Engzell et al. (Citation2020), we expected the school closure to reduce students’ progress in math and reading achievement. Given the specific characteristics of our sample, we expected to find stronger delays than those reported by Engzell et al. (Citation2020) who estimated that the learning delays were about equal to the duration of the school closure (8 weeks). We furthermore expected that the effects of the school closures on students’ achievement growth would depend on their SES and on the share of disadvantaged students within the population of their school, due to differences in resources and circumstances (Andrew et al., Citation2020; Bayrakdar & Guveli, Citation2020; Bol, Citation2020). In addition, based on literature showing age and sex related differences in students’ self-regulatory skills, (Schunk & Zimmerman, Citation2012), we expected that the school closures would have a stronger impact on younger students and boys compared to older students and girls.
We aim for the insights that follow from the study to contribute to making well-informed decisions about targeted interventions to overcome the delays, thereby helping to combat educational inequalities due to other types of learning interruptions.
Method
Participants and Procedure
Participants were 886 primary school students (47.63% male; Mage = 9.55 years, SD = 1.04 years) from 13 schools (42 classrooms) from a large city in the middle of the Netherlands (approximately 350.000 inhabitants). The participating schools are part of a school-University research partnership focusing on educational equality. These schools all have a high percentage of students from disadvantaged home environments (for details on school demographics, see “school weight” under instruments). In the school year 2019-2020, the participating students were in the third (n = 318), fourth (n = 275), or fifth grade (n = 293) (cf., Group 5–7 in the Netherlands).
Anonymized achievement data, demographic information, and school information was obtained from the school boards. With permission of the local institutional ethical review board, passive parental consent was obtained. Initial requests for active consent led to a very low response rate as a result of which selection bias was feared for. As the data was fully anonymous and the schools in this study already inform parents in the school guide that they share anonymized data for scientific research, the ethical review board agreed that passive consent would suffice. Before data collection commenced, parents received an additional information letter via e-mail stating the aim of the study and reminding them of the data sharing paragraph in the school guide. Parents could object to the sharing of their child’s anonymous achievement scores for 14 days by sending a reply email to the school. No parents made use of this option.
Instruments
School Weight
To estimate the educational disadvantage of schools, we used so-called school weights: a weighted score that the Statistics Netherlands (CBS) computes yearly for each Dutch school. School weights are used to chart the student population of a school and can be regarded as a proxy of the expected educational performance of a school (Dutch Inspectorate of Education, Citation2020b). A higher school weight indicates a higher share of students at risk of low performance because of adverse circumstances. The weighted score is based upon five environmental characteristics of a school’s individual students, considered most predictive of educational disadvantage, namely: (a) the educational level of both the mother and the father, (b) the country of origin of the parents, (c) whether parents are in financial debt restructuring, (d) mothers’ length of stay in the Netherlands, (e) and the average educational level of the mothers of all students at school (Dutch Inspectorate of Education, Citation2020b). The weighted scores range from 20 to 40 and are normally distributed. The participating schools had an average school weight of 37.45 (SD = 2.90), which is significantly above the national average in 2019 (M = 30.10, SD = 3.96), t(6714) = 5.87, p < .001.
Socio-economic Status (SES)
To estimate students’ SES, we used their six-digit postal codes (cf., Van Leest et al., Citation2021). These are, on average, shared by only 15–20 Dutch households. Statistics Netherlands (CBS) provided three indicators of SES to recode postal codes: (a) the mean real estate value, (b) the most recent mean household income after tax, and (c) the number of people with unemployment or social welfare benefits, all measured in 2016. Using principal component analysis (PCA), these three indicators were recoded into one factor score. Higher scores indicated a higher SES. The average SES of the sample was -.66 (SD = .64), while the national average is 0.00 (SD = 1.00), suggesting that the sample had, on average, a relatively low SES.
Achievement Scores
The schools boards provided students’ scores on nationally standardized tests in the domains of mathematics and reading comprehension. The tests are part of the national monitoring and evaluation system developed by CITO, the Dutch National Institute for Educational Measurement (Hollenberg et al., Citation2017). About 85% of Dutch schools use these tests to monitor student progress over the course of their primary school years. These tests are method-independent and are administered at fixed moments during the year: in the middle and at the end of the schoolyear. The CITO tests have been shown to have high validity and reliability with reliability coefficients ranging between .88 and .93 for reading comprehension (Hiddink et al., Citation2017; Tomesen et al., Citation2016, Citation2018) and between .92 and .96 for mathematics (Engelen & Hop, Citation2017; Engelen et al., Citation2017; Hop et al., Citation2016). Students’ scores on the tests are expressed on a continuous scale that ranges from third to sixth grade. The mathematics test measures students mathematics problem solving abilities, both with and without narrative context. The reading comprehension tests measures students skill level in reading informative and narrative texts. Children answer questions about the texts. Higher skill scores indicate higher achievement levels.
For the present study, we obtained students’ six most recent math scores (i.e., Jan/Feb 2018 until May/June 2020) and five most recent reading comprehension scores (i.e., May/June 2018 until May/June 2020). For both domains, the second-last measurement took place shortly before the school closure and the final measurement after all students returned to school. Some schools decided to postpone the administration of the last measurement until after the summer break because of the school lockdown and one school decided not to administer the test.
Analyses
We first conducted preliminary descriptive analyses to describe the overall patterns of students’ achievement growth before and after the lockdown. Thereafter, we estimated latent piecewise growth models using Mplus version 8.4 (Muthén & Muthén, Citation1998-Citation2010) to examine whether there was a significant discontinuity in students’ learning growth. A piecewise growth model can be used to compare growth rates during two different periods (Heck et al., Citation2013). In our case, we compared two average growth rates: students’ average growth before the outbreak of the Covid-19 virus and their average growth rate in the period during and after the school lockdown. For each student, we estimated the intercept and the slope for the first part of the trajectory based on students’ achievement scores from the first measurement until the last measurement before the lockdown. For the second part of the slope, we only had two measurements available (one before and one after the lockdown). Therefore, for this second part we could not estimate a latent slope for each student, but only an average slope across students. We specified our growth model in such a way that the second slope coefficient reflected the difference between the average predicted value of the last measurement based on the first student-specific slopes (i.e., the score that students were expected to have if the schools would not have been closed) and the actual observed value at the last measurement (see Appendix A for the Mplus code). Wald-tests indicated whether this difference was significant, and hence, whether there was a significant discontinuity in students average learning growth. In addition, in a second model, we examined whether the extent of discontinuity in learning due to the lockdown was associated with students’ sex, grade, and SES, as well as the school’s weight, by including these factors in the model as predictors of the intercept, first, and second slope.
We corrected for the nesting of students in different classes by estimating cluster-robust standard errors (i.e., the “sandwich estimator”, McNeish et al., Citation2017). Several students were tested with an adapted version of the CITO tests originally designed for special education. These adapted tests are also developed by CITO, similar in nature, and the scores are expressed on the same scale as the scores on the regular test. Nevertheless, to account for potential differences between the special education and regular tests, we created a dummy variable that reflects this difference, which was added as a predictor. Furthermore, to account for the moment at which schools administered the last test (i.e., before or after the summer break), another dummy variable was created and entered as a predictor.
The percentages of missing data for the mathematics tests ranged from 1.47% to 8.80% on the first five measurements and 11.06% of on the last measurement due to the fact that one school did not administer any tests after the school closure.Footnote1 The percentage of missing data for the reading comprehension test was 19.53% on the first test moment, mostly due to many schools not administering the reading comprehension test at the end of first grade. The missing data ranged from 1.35% to 3.84% on the other measurements, and 10.38% at the last measurement due to not administering tests after the school closure. Missing data was accounted for by the Full Information Maximum Likelihood method (Schafer & Graham, Citation2002). The robust maximum likelihood estimator (MLR) was used to account for non-normality in the data (Lei & Shiverdecker, Citation2020).
Results
Descriptive Statistics and Preliminary Analyses
shows the sample means and standard deviations of students’ achievement scores in mathematics and reading comprehension. On average, students grew 15.44 points (SD = 6.78) before the lockdown between each subsequent measurement (i.e., 22.46 points between M1 and M2, 16.03 points between M2 and M3, etc.). However, between M5 and M6, during which the lockdown took place, students only gained an average of 8.05 points (SD = 15.09), which is significantly less than before, t(768) = 14.021, p < .001. This means that their progress in mathematics was only 52.13% of what is was expected to be based on this sample’s previous achievement growth. In other words, the students in our sample grew 7.39 points less than expected, which corresponds to an average learning loss of 2.35 months in mathematics.
Table 1. Means and Standard Deviations of Students’ Achievement Scores in Mathematics and Reading Comprehension.
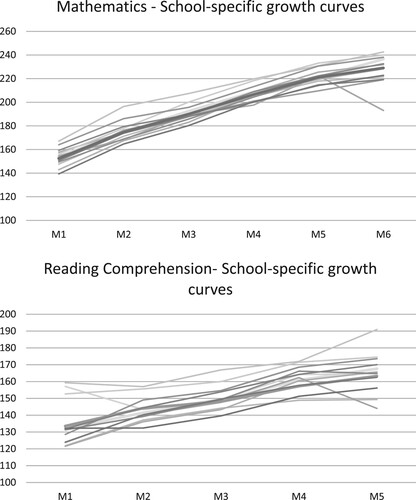
Before the lockdown, the average growth in reading comprehension between each subsequent measurement was 9.35 points (SD = 6.48). Between M5 and M6, the growth rate was significantly lower (M = 4.65, SD = 16.62), t(771) = 8.61, (p < .001). The findings indicate that achievement growth in reading comprehension between M5 and M6 was 46.82% of what it was expected to be. Reading comprehension scores grew 4.70 points less than expected, which corresponds to an average learning loss of 2.47 months. shows growth curves per school and indicates that there are substantial differences between schools in the effects of the school closures. Especially one school stands out which shows a strong decline in their students’ math and reading comprehension scores between the last to time points. To make sure that this school did not impact the overall findings, we replicated our main analyses while excluding this school (see Robustness Checks).
Figure 1. Development of Mean Scores on Mathematics and Reading Comprehension Achievement Before and After the Lockdown for Each School Separately.
shows the findings per cohort (school year) and shows these findings graphically. From this Table and graph it can be derived that the learning losses are most substantial among the Grade 3 cohort. More specifically, from , it can be derived that math achievement of students in the third grade cohort grew an average of 23.85 points between each set of two subsequent measurements (i.e., 27.64 points between M1 and M2; 21.94 points between M2 and M3, etc.). However, between Measurements 5 and 6, their average achievement growth was only 6.85 points. Hence, mathematics achievement growth of third grade students in this period was only 28.7% of their average achievement growth prior to the lockdown. A similar calculation for the other two cohorts indicates that the impact of the lockdown on the higher grades was much less severe, with the achievement growth of the fourth and fifth grade cohort being 70.73% and 99.98% of the average achievement growth in previous years. For reading comprehension, the achievement growth of the third grade cohort, was 0.25% of the average achievement growth prior to the lockdown (i.e., the students had not progressed). For the fourth grade cohort, the average achievement growth was similar and even slightly higher (6.42% higher) compared to their achievement growth rate prior to the lockdown, and for the fifth grade cohort the achievement growth was 54.02% of their average achievement growth before the lockdown.
Figure 2. Development of Mean Scores on Mathematics and Reading Comprehension Achievement Before and After the Lockdown for Each Cohort Separately.
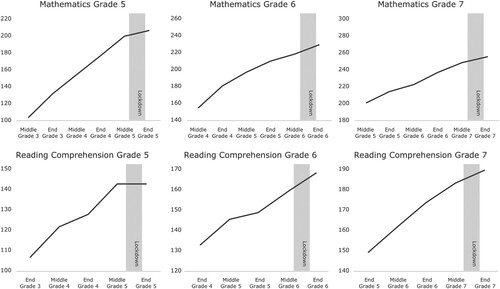
Table 2. Means and Standard Deviations of Students’ Achievement Scores in Mathematics and Reading Comprehension (RC) per Cohort.
Piecewise Growth Model
Math Achievement
To examine discontinuity in students’ math development, a piecewise growth model was specified consisting of one intercept and two slopes. The second slope was not allowed to vary between individuals as it was based on two time points only. As such, we fixed the residual variance of the test results after the school lockdown to zero. We specified the piecewise growth model such that the slope variable of Piece 1 loaded on measurement occasions two to six with loadings of 1–5 respectively, and the slope variable of Piece 2 loaded only on measurement occasion 6 (fixed to 1). As a result, the mean of the second slope variable reflects the difference between the mean predicted value at the measurement after the school lockdown based on the first slope, and the average observed value at the measurement after the school lockdown.
The findings for mathematics are reported in . The first model did not include any predictors. The findings of this model show an average achievement growth between measurements of 16.81 points before the lockdown (Slope 1), and shows that the score at the last measurement is 10.30 points lower than expected. A Wald-test showed a significant difference between the observed and expected achievement at M6, W = 136.65, p < .001, confirming the descriptive results suggesting discontinuity in students’ math achievement due to the lockdown. The findings of Model 1 also suggest a negative relation between the intercept and first slope, which indicates that students with higher math scores at M1 show less growth from M1 to M5 in comparison to students with lower math scores at M1. On the contrary, there is a significant positive relation between the intercept and second slope, which suggests that students with higher math achievement at M1, show more growth during the lockdown.
Table 3. Piecewise Growth Model of Children’s Test Scores on Mathematics.
In a second model, we added age, sex, SES, and school weight as predictors of intercept and slopes and controlled for administering a special educational needs version of the standardized test, and the moment of administrating the test after the school lockdown. The results in show that age was a significant predictor of the intercept, indicating that older students had higher math achievement scores, as can be expected. Age was a negative predictor of Slope 1, indicating that older students had a lower growth rate, and age was a positive predictor of Slope 2, indicating that the observed delay in achievement was smaller for older students. Sex was a negative predictor of the intercept, suggesting that boys outperformed girls on mathematics, and sex was positively associated with Slope 2, suggesting that the delay in math achievement due to the school closures was more severe for boys. Furthermore, SES was a positive predictor of the math intercept, indicating higher achievement among students with higher SES. SES was not significantly related with either Slope 1 or 2, suggesting that neither the growth rate before the lockdown or the size of the math delay due to the lockdown was associated with SES. Finally, the results for school weight indicated that overall math achievement was lower among schools with a larger share of students from disadvantaged backgrounds and that the school closures had a larger negative impact on math achievement at these schools.
Reading Comprehension
Similar analyses were performed for reading comprehension. The findings are reported in . The first model shows an average achievement growth between measurements of 10.20 points before the lockdown (Slope 1), and shows that the score at the last measurement is 5.32 points lower than expected. A Wald-test showed a significant difference between the observed and expected achievement at M6, W = 83.31, p < .001, corroborating the descriptive results suggesting that the lockdown led to discontinuity in students’ reading comprehension achievement. The findings of Model 1 also indicate that the associations between the intercept and both slopes are not statistically significant, which suggests that both growth curves are not associated with the students’ reading comprehension at M1.
Table 4. Piecewise Growth Model of Children’s Test Scores on Reading Comprehension.
In the second model, age, sex, SES, and school weight were included as predictors of intercept and slopes, again controlling for the use of a special educational needs version of the test, and the moment of administrating the test after the school lockdown. The results in show that age was a significant predictor of the intercept, indicating that older students had higher reading comprehension achievement, as can be expected. Age not associated with either Slope 1 or 2. Sex was not associated with the intercept or either slope, suggesting similar reading comprehension achievement and similar growth rates, before and after the lockdown. SES was a positive predictor of the intercept, indicating higher achievement among students with higher SES. SES was not significantly related with Slope 1 or 2, suggesting that neither the growth rate before the lockdown or the size of the achievement delay due to the lockdown was associated with SES. Finally, the results for school weight indicate that overall reading comprehension was lower among schools with a higher share of students from disadvantaged backgrounds and that the school closures had a larger negative impact on reading comprehension at these schools.
Robustness Checks
As can be seen in , one of the schools shows a deviant pattern with regards to the growth rate between the last two time points. From this school, 60 students were included in the analyses (6.8% of the total sample). To check the robustness of our findings, we examined to what extent the findings of this particular school affected the overall findings. As such, we repeated the analyses while excluding this particular school from the analyses. The findings replicated the findings from the previous analyses. That is, for both domains, excluding this school only lead to minor differences in the parameter coefficients, but no differences in the statistical significance of the findings. There was one exception, for mathematics, sex was no longer a statistical significant predictor of the second slope (b = 2.68, p = .058).
Discussion
The COVID-19 closures of schools have caused grave concerns about potential delays in student learning, especially among students from disadvantaged families. The present study aimed to extend first findings of recent research that confirmed that the school closures led to learning delays, especially for students from less educated homes (e.g., Engzell et al., Citation2020). By focusing on schools that serve a relatively high percentage of students that were expected to be the most vulnerable to the educational impacts of COVID-19 we aimed to deepen our understanding of the effects for this particular group. Thereby this study contributes to more insight on the potential impact of the school closures worldwide on educational inequality. The findings of the present study confirm that the school closures during the COVID-19 crisis led to substantial learning losses among students at schools who serve a population already at risk of educational disadvantage because of unfavorable home conditions and indicate that the school closures exacerbated educational inequalities. Moreover, even within a sample of schools serving many of these vulnerable students, the discontinuity in learning was strongest at schools with more disadvantaged student populations and among students from lower grades. On average, the students in this sample showed a two and a half month delay in their reading comprehension and math achievement, which is even longer than the closing of the schools (8 weeks). The findings are discussed in more detail below.
Discontinuity in Learning among the Most Vulnerable
In line with previous findings (Bol, Citation2020; Kuhfeld et al., Citation2020), the current study confirmed that students from disadvantaged homes (e.g., low-income households, low levels of parental education) suffer strongly from delays in their learning, thereby further increasing existing inequalities in education. Based on a data of a large nationally representative sample of students from the Netherlands, Engzell et al. (Citation2020) concluded that students’ average learning loss caused by the first school closure almost equaled the duration of the school closures (8 weeks). Although we cannot directly compare our findings to their study due to a difference in methodology, our findings suggest that the average learning loss is somewhat stronger (about 2.5 months; i.e., 10–11 weeks) among students from schools serving an at-risk population. And even within this restricted sample of schools, the discontinuity in learning was found to be the strongest at schools with the most disadvantaged student populations. It is very well possible that these findings can be explained by the unfavorable home schooling circumstances that these students likely faced: limited opportunities parental support, limited space, a lack of access to hardware or stable internet connection, and potentially also other disadvantageous factors causing unstable home situations (Bayrakdar & Guveli, Citation2020; Bol, Citation2020). A recent study in which Finnish primary school teachers shared how they supported students who struggled during remote teaching, confirms how adequate support from parents was oftentimes lacking (Mankki, Citation2021), an adverse circumstance that teachers could only compensate for to a limited extent. Similar worries were expressed by Dutch teachers in qualitative studies (Authors, in preparation; Dutch Inspectorate of Education, Citation2020a).
Surprisingly, we only found an effect of school weight, but not an additional effect of students’ individual SES. This could be due to several reasons. It may be that the effects of the school closures do not significantly vary among this restricted sample, as most students of the participating schools have a relatively low SES. It could also be due to the fact that we used a measure of SES that is based mostly on economic factors, but not parental education. Lastly, many schools and the city council succeeded rather quickly in providing students in need with adequate hardware (e.g., laptops) and the most vulnerable students were allowed to go school. This may have lessened the impact of the school closures on the students who were most at risk.
Grade and Sex
The effects of the school closures were not the same for all students. While educators and policy makers have been most concerned with students’ socio-economic background e.g., Bol, Citation2020; (Kuhfeld et al., Citation2020), our results indicate that the effects of the school closures also vary based on other student characteristics. Being taught online and mostly working from home requires a lot of self-regulatory skills from students, especially when families are unable to offer the resources and support needed for optimal learning (Primdahl et al., Citation2021). Moreover, unfavorable home conditions of students in disadvantaged families that have been put forward as impacting home schooling (Bayrakdar & Guveli, Citation2020; Bol, Citation2020) might also hamper students’ ability to self-regulate their learning: for example, a lack of a quiet space where one can concentrate. As prior research suggests that younger children and boys tend to have weaker self-regulatory skills compared to older children and girls (Schunk & Zimmerman, Citation2012), we hypothesized that the school closures would have a stronger impact on younger children and boys. As expected, we found that the school closures had the strongest effects for the youngest students in our sample (Grade 5), and had a stronger effect for boys than girls with regards to math achievement. Hence, it seems that self-regulation skills might serve as an explanatory factor to this finding. This is a cautious conclusion, as we could not directly measure self-regulation skills within the scope of this study.
Within the very large sample of Engzell et al. (Citation2020) no effect of school grade or sex was find. The present study therefore contributes to prior research by highlighting that particularly in schools that serve high rates of students already at risk of educational delays due to less favorable socio-economic conditions, an effect of age and sex can occur. It may be that these factors only play a role when there is a cumulation of risk factors. Prior research (Evans et al., Citation2013) suggests that children who experience a single risk factor typically do not suffer much harm. However, a cumulation of risk cumulation can have severe adverse outcomes for children’s development. Hence, the risk of having significant learning delays (or other adverse consequences) may be the largest when it concerns students who are already at risk due to adverse home conditions such as poverty or a lack of parental support, and who are also otherwise at risk, for example because of insufficient self-regulatory skills. More research on larger samples is needed to examine which particular combinations of risk factors may lead to the most severe learning losses.
Limitations and Strengths
Some limitations of the study need to be addressed. First, our study focused on a specific sample, namely students between the ages of 7 and 10, in schools that have relatively high school weights. As a result, we cannot generalize our findings to students of different age groups, or students in schools that serve a different population. Second, the findings of the current paper are based on quantitative data, which leaves us with several questions with regard to the mechanisms that underlie the findings of the present study. Research designs in which quantitative and qualitative data are combined might provide more insight in this matter (Authors, in preparation). Furthermore, due to privacy protection regulations, we did not have access to information about students’ migration background. Students with a migration background are overrepresented at the participating schools, and these students might also be more adversely affected by the lockdown due to factors such as a difference in home and language or a low SES . Because we did not have this information, we could not disentangle the possibly confounding effects of SES and migration background.
In addition to the above mentioned weaknesses, strengths of the study can also be identified. First, although we focused on a specific group of schools serving at-risk students, we were able to obtain a fair sample size, allowing us to draw conclusions that can be regarded as robust. By focusing on a group that was a priori identified as “vulnerable” and at risk of learning loss, we were able to explore how even within this group, school weight remains a predictive factor of learning loss. But also, the finding that variance between schools was found suggests that the ways in which schools shaped their remote teaching practices matters for the outcomes on student-level. This is important information, that opens up avenues for further research.
Future Research
For the scope of the present paper, we did not include qualitative data about the ways in which schools delivered the remote teaching or the supportive measures they undertook when their students were in unfavorable conditions. Future studies need to address how differential outcomes with regard to learning delays might be related to the educational practices of teacher and other supporting parties. These insights will not only be of great importance with regard to the COVID-19 related school lockdowns, but may also add to our knowledge about fostering equitable educational opportunities in a broader sense.
Investing in partnerships with parents has been put forward as pivotal in fostering equitable learning opportunities (Denessen, Citation2019). The rapid and innovative changes that were necessary in terms of remote teaching, might prove useful in connecting more closely the two often separate “worlds” of home and school. This might be particularly important for the children who came forward from this study as being at risk of performing below their actual potential, as was shown in the present study.
After this paper was written, a second national lockdown commenced and schools once again closed their doors. The cumulative effects of multiple lockdowns are likely to have severe and long-lasting consequences for students, especially for students from disadvantaged backgrounds. On the other hand, it is also possible that a catch-up effect might take place now that students are back in their classrooms. Future research needs to establish this.
Closing the Gap
Our findings are reason for concern. The school closures in the spring of 2020 have impacted many students, but especially the ones from disadvantaged backgrounds, thereby exacerbating existing inequalities. Although the present study focused specifically on discontinuity in learning, it is important to note that the school closures also had a substantial impact on students’ well-being and other aspects of their mental health (Thorell et al., Citation2020). These effects are also characterized by inequality, as the psychosocial impact of the pandemic was also stronger for those students in vulnerable home conditions (e.g., Li et al., Citation2021).
Schools and policy makers are now faced with the incredibly difficult task of helping students to overcome the adverse psychosocial and cognitive effects of the school closures and to mitigate the increased educational inequalities. Many countries are now working on implementing recovery programs (UNESCO, Citation2021). It is imperative, that as educational scholars, we disclose findings from educational research to make sure practitioners are able to make well informed decisions on adequate and evidence-informed interventions. Universities, schools, local councils, and administrators must work together to control the damage that has been done as a result of this world wide crisis. Interventions such as summer programs, extended school days, or additional out-of-school support need to be facilitated – independent of parent income (Alexander et al., Citation2007; Jansen et al., Citation2021). Such interventions need to target those students who have been hit the hardest by the current crisis -students in unfavorable home environments and at schools with disadvantaged populations- in order “to close the gap”.
Declarations
The procedures that were followed in this study were approved by the Ethics Review Board of the Faculty of Social & Behavioral Sciences of Utrecht University.
Disclosure Statement
No potential conflict of interest was reported by the author(s).
Additional information
Funding
Notes
1 Analyses were performed with and without data from this school included, and findings were similar. Therefore, only the results with all schools included are therefore reported.
References
- Alexander, K. L., Entwisle, D. R., & Olson, L. S. (2001). Schools, achievement, and inequality: A seasonal perspective. Educational Evaluation and Policy Analysis, 23(2), 171–191. https://doi.org/10.3102/01623737023002171
- Alexander, K. L., Entwisle, D. R., & Olson, L. S. (2007). Lasting consequences of the summer learning gap. American Sociological Review, 72(2), 167–180. https://doi.org/10.1177/000312240707200202
- Andrew, A., Cattan, S., Costa Dias, M., Farquharson, C., Kraftman, L., Krutikova, S., Phimister, A., & Sevilla, A. (2020). Learning during the lockdown: Real-time data on children's experiences during home learning. The Fiscal Institute. https://ifs.org.uk/publications/14848
- Bayrakdar, S., & Guveli, A. (2020). Inequalities in home learning and schools’ provision of distance teaching during school closure of COVID-19 lockdown in the UK. https://www.iser.essex.ac.uk/research/publications/working-papers/iser/2020-09
- Biesta, G. (2020). Have we been paying attention? Educational anaesthetics in a time of crises. Educational Philosophy and Theory. https://doi.org/10.1080/00131857.2020.1792612
- Blundell, R., Costa Dias, M., Joyce, R., & Xu, X. (2020). COVID-19 and inequalities. Fiscal Studies, 41(2), 291–319. https://doi.org/10.1111/1475-5890.12232
- Bol, T. (2020). Inequality in homeschooling during the Corona crisis in the Netherlands. First results from the LISS Panel. https://doi.org/10.31235/osf.io/hf32q
- Borman, G. D., Benson, J., & Overman, L. T. (2005). Families, schools, and summer learning. The Elementary School Journal, 106(2), 131–150. https://doi.org/10.1086/499195
- Boterman, W. R. (2019). The role of geography in school segregation in the free parental choice context of Dutch cities. Urban Studies, 56(15), 3074–3094. https://doi.org/10.1177/0042098019832201
- Chudgar, A., & Luschei, T. F. (2009). National income, income inequality, and the importance of schools: A hierarchical cross-national comparison. American Educational Research Journal, 46(3), 626–658. https://doi.org/10.3102/0002831209340043
- Darmody, M., Smyth, E., & Russell, H. (2021). Impacts of the COVID-19 control measures on widening educational inequalities. YOUNG, 29(4), 366–380. https://doi.org/10.1177/11033088211027412
- Denessen, E. (2019). Parental involvement in the Netherlands. In A. Paseka & D. Byrne (Eds.), Parental involvement acrosss European education systems. Critical reviews (pp. 64–76). Routledge. https://doi.org/10.4324/978135106634
- Dent, A. L., & Koenka, A. C. (2016). The relation between self-regulated learning and academic achievement across childhood and adolescence: A meta-analysis. Educational Psychology Review, 28(3), 425–474. https://doi.org/10.1007/s10648-015-9320-8
- Dutch Inspectorate of Education. (2018). The state of Education 2016/2017. Utrecht: Inspectie van het Onderwijs. https://www.onderwijsinspectie.nl/documenten/rapporten/2018/11/14/the-state-of-education-in-the-netherlands-2016-2017
- Dutch Inspectorate of Education. (2020a, May 13). COVID-19-monitor Inspectie van het Onderwijs [COVID-19 monitor Inspectorate of Education]. https://www.onderwijsinspectie.nl/onderwerpen/corona-onderzoeken/covid-19-monitor/eerste-meting
- Dutch Inspectorate of Education. (2020b, December 14). De schoolweging: een nieuwe maat voor de leerlingenpopulatie [School weight. A new measure for student population]. https://www.onderwijsinspectie.nl/onderwerpen/onderwijsresultaten-primair-onderwijs/naar-een-nieuw-onderwijsresultatenmodel/de-schoolweging-een-nieuwe-maat-voor-de-leerlingenpopulatie
- Engelen, R., & Hop, M. (2017). Wetenschappelijke verantwoording LVS-toetsen Rekenen-Wiskunde 3.0 voor groep 6 [Scientific Justification for Monitoring Tests Mathematics Grade 4]. CITO. https://www.cito.nl/-/media/files/kennisbank/cito-bv/15-cito-lvs-rekwisk-3-0-gr6-wet-verantwoording.pdf?la=nl-nl
- Engelen, R., Hop, M., & Janssen, J. (2017). Wetenschappelijke verantwoording LVS-toetsen Rekenen-Wiskunde 3.0 voor groep 7 [Scientific Justification for Monitoring Tests Mathematics Grade 5]. CITO. https://www.cito.nl/-/media/files/kennisbank/cito-bv/6-cito-lvs-rekwisk-3-0-gr7-wet-verantwoording.pdf?la=nl-nl
- Engzell, P., Frey, A., & Verhagen, M. (2020). Learning loss due to school closures during the COVID-19 pandemic. Proceedings of the National Academy of Sciences of the United States of America, 118(17) e2022376118. https://doi.org/10.1073/pnas.2022376118
- Evans, G. W., Li, D., & Whipple, S. S. (2013). Cumulative risk and child development. Psychological Bulletin, 139(6), 1342–1396. https://doi.org/10.1037/a0031808
- Gershenson, S., Jacknowitz, A., & Brannegan, A. (2017). Are student absences worth the worry in US primary schools? Education Finance and Policy, 12(2), 137–165. https://doi.org/10.1162/EDFP_a_00207
- Heck, R. H., Thomas, S. L., & Tabata, L. N. (2013). Multilevel and longitudinal modeling with IBM SPSS. Routledge.
- Hiddink, L., Jolink, A., Tomesen, M., & Weekers, A. (2017). Wetenschappelijke verantwoording LVS-toetsen Begrijpend Lezen 3.0 voor groep 6 [Scientific Justification for Monitoring Tests Reading Comprehension Grade 4]. CITO. https://www.cito.nl/-/media/files/kennisbank/cito-bv/18-cito-lvs-begrijpend-lezen-3-0-gr6-wet-verantwoording.pdf?la=nl-nl
- Hollenberg, J., Van der Lubbe, M., & Sanders, P. (2017). Toetsen op school: Primair onderwijs [Testing at school: Primary education]. CITO.
- Hop, M., Janssen, J., & Wouda, J. (2016). Wetenschappelijke verantwoording LVS-toetsen Rekenen-Wiskunde 3.0 voor groep 5 [Scientific Justification for Monitoring Tests Mathematics Grade 3]. CITO. https://www.cito.nl/-/media/files/kennisbank/cito-bv/24-cito-lvs-rekwisk-3-0-gr-5-wet-verantwoording.pdf?la=nl-nl
- Jæger, M. M., & Blaabæk, E. H. (2020). Inequality in learning opportunities during covid-19: Evidence from library takeout. Research in Social Stratification and Mobility, 68(June), 100524. https://doi.org/10.1016/j.rssm.2020.100524
- Jansen, D., Elffers, L., & Jak, S. (2021). A cross-national exploration of shadow education use by high and low SES families. International Studies in Sociology of Education. https://doi.org/10.1080/09620214.2021.1880332
- Kim, L. E., & Asbury, K. (2020). ‘Like a rug had been pulled from under you’: The impact of COVID-19 on teachers in england during the first six weeks of the UK lockdown. British Journal of Educational Psychology, 90(4), 1062–1083. https://doi.org/10.1111/bjep.12381
- Kuhfeld, M., Soland, J., Tarasawa, B., Johnson, A., Ruzek, E., & Liu, J. (2020). Projecting the potential impacts of COVID-19 school closures on academic achievement (EdWorkingPaper: 20-226). https://doi.org/10.26300/cdrv-yw05
- Lei, P. W., & Shiverdecker, L. K. (2020). Performance of estimators for confirmatory factor analysis of ordinal variables with missing data. Structural Equation Modelling: A Multidisciplinary Journal, 27(4), 584–601. https://doi.org/10.1080/10705511.2019.1680292
- Li, W., Wang, Z., Wang, G., Ip, P., Sun, X., Jiang, Y., & Jiang, F. (2021). Socioeconomic inequality in child mental health during the COVID-19 pandemic: First evidence from China. Journal of Affective Disorders, 287, 8–14. https://doi.org/10.1016/j.jad.2021.03.009
- Mankki, V. (2021). Primary teachers’ principles for high-quality distance teaching during COVID-19. Scandinavian Journal of Educational Research. https://doi.org/10.1080/00313831.2021.1939141
- McNeish, D., Stapleton, L. M., & Silverman, R. D. (2017). On the unnecessary ubiquity of hierarchical linear modeling. Psychological Methods, 22(1), 114–140. https://doi.org/10.1037/met0000078
- Muthén, L. K., & Muthén, B. O. (1998-2011). Mplus user's guide. Sixth edition. Muthén & Muthén.
- Pensiero, N., Kelly, A., & Bokhove, C. (2021). Learning inequalities during the covid-19 pandemic. A longitudinal analysis using the UK understanding society 2020 and 2021 data. 1-60. University of Southampton. https://doi.org/10.5258/SOTON/P0118
- Pfeffer, F. T. (2008). Persistent inequality in educational attainment and its institutional context. European Sociological Review, 24(5), 543–565. https://doi.org/10.1093/esr/jcn026
- Primdahl, N. L., Borsch, A. S., Verelst, A., Jervelund, S. S., Derluyn, I., & Skovdal, M. (2021). ‘It’s difficult to help when I am not sitting next to them’: How COVID-19 school closures interrupted teachers’ care for newly arrived migrant and refugee learners in Denmark. Vulnerable Children and Youth Studies, 16(1), 75–85. https://doi.org/10.1080/17450128.2020.1829228
- Schafer, J. L., & Graham, J. W. (2002). Missing data: Our view of the state of the art. Psychological Methods, 7(2), 147–177. https://doi.org/10.1037/1082-989X.7.2.147
- Schmidt, W. H., Burroughs, N. A., Zoido, P., & Houang, R. T. (2015). The role of schooling in perpetuating educational inequality: An international perspective. Educational Researcher, 44(7), 371–386. https://doi.org/10.3102/0013189X15603982
- Schunk, D. H., & Zimmerman, B. J. (2012). Self-regulation and learning. In W. M. Reynolds, G. E. Miller, & I. B. Weiner (Eds.), Handbook of psychology: Educational psychology (2nd ed., pp. 45–68). John Wiley & Sons, Inc. https://doi-org.proxy.library.uu.nl/10.1002/9781118133880.hop207003
- Stopforth, S., Gayle, V., & Boeren, E. (2020). Parental social class and school GCSE outcomes: Two decades of evidence from UK household panel surveys. Contemporary Social Science, 16(3), 1–16. https://doi.org/10.1080/21582041.2020.1792967
- Thorell, L., Skoglund, C. B., de la Peña, A. G., Baeyens, D., Fuermaier, A., Groom, M., Mammarella, I., Van der Oord, S., van den Hoofdakker, B., Luman, M., & de Miranda, D. M. (2020). Psychosocial effects of homeschooling during the COVID-19 pandemic: Differences between seven European countries and between children with and without mental health conditions. https://doi.org/10.31234/osf.io/68pfx
- Tomesen, M., Engelen, R., & Hiddink, L. (2018). Wetenschappelijke verantwoording LVS-toetsen Begrijpend Lezen 3.0 voor groep 7 [Scientific Justification for Monitoring Tests Reading Comprehension Grade 5]. CITO. https://www.cito.nl/-/media/files/kennisbank/cito-bv/3-cito-lvs-begrijpend-lezen-3-0-gr7-wet-verantwoording.pdf?la=nl-nl
- Tomesen, M., Weekers, A., Hilte, M., Jolink, A., & Engelen, R. (2016). Wetenschappelijke verantwoording LVS-toetsen Begrijpend Lezen 3.0 voor groep 5 [Scientific Justification for Monitoring Tests Reading Comprehension Grade 3]. CITO. https://www.cito.nl/-/media/files/kennisbank/cito-bv/30-cito-lvs-begrijpend-lezen-3-0-gr-5-wet-verantwoording.pdf?la=nl-nl
- UNESCO. (2020, November 20). COVID-19 Educational disruption and response. https://en.unesco.org/covid19/educationresponse
- UNESCO. (2021). What’s Next? Lessons on Education Recovery: Findings from a Survey of Ministries of Education amid the COVID-19 Pandemic. https://doi.org/10.1787/697bc36e-en
- Van Leest, A., Hornstra, L., Van Tartwijk, J., & Van de Pol, J. (2021). Test-or judgement-based school track recommendations: Equal opportunities for students with different socio-economic backgrounds? British Journal of Educational Psychology, 91(1), 193–216. https://doi.org/10.1111/bjep.12356
Appendix A
Model 1 Reading Comprehension
!Note:the syntax for math is similar with one additional measurement
TITLE: piecewise growth model
DATA: FILE IS WOU_GO_lezen.dat;
VARIABLE: NAMES ARE
school
weight
class
age
gender
SES
SE!test for special education
TE!timing of last test before or after the summer holiday
m1-m5;!reading measurement 1–5
USEVARIABLE = m1-m5;
CLUSTER = class;
MISSING = ALL (999);
DEFINE: STANDARDIZE weging age SES;
ANALYSIS: TYPE = COMPLEX;
MODEL:
i s1 | m1@0 m2@1 m@2 m4@3 m5@4;
i s2 | m1@0 m2@0 m3@0 m4@0 m5@1;
t1-t4;
t5@0;
[i];
[s1] (a);
[s2] (b);
Model test:
0 = a - b;
OUTPUT:
tech1 SAMPSTAT;
Model 2 Reading Comprehension
TITLE: piecewise growth model
DATA: FILE IS WOU_GO_lezen.dat;
VARIABLE: NAMES ARE
school
weight
class
age
gender
SES
SE!test for special education
TE!timing of last test before or after the summer holiday
m1-m5;
USEVARIABLE = m1-m5;
CLUSTER = class;
MISSING = ALL (999);
DEFINE: STANDARDIZE weging age SES;
ANALYSIS: TYPE = COMPLEX;
MODEL:
i s1 | m1@0 m2@1 m3@2 m4@3 m5@4;
i s2 | m1@0 m2@0 m3@0 m4@0 m5@1;
m1-m4;
m5@0;
[i];
[s1] (a);
[s2] (b);
i; s1; s2;
i with s1;
i with s2;
s1 with s2;
i s1 s2 ON age;
i s1 s2 ON gender;
i s1 s2 ON SES;
i s1 s2 ON SE;
i s1 s2 ON weight;
i s1 s2 ON TE;
Model test:
0 = a - b;
Model test:
0 = a - b;
OUTPUT:
tech1 SAMPSTAT;