
ABSTRACT
Low cost, non-invasive instruments for the identification of high academic potential in early childhood education and care are scarce, and the complexity of cognitive development indicates that combinations of screening instruments are needed. This study investigates the reliability and validity of three instruments (individually and in combination) in a longitudinal study of 136 Norwegian children in kindergarten through 8th grade with the research questions: (1) Do children's scores on screening instruments accurately identify high academic potential in kindergarten? (2) Are children's scores on kindergarten screening instruments consistent with high academic achievement in 8th grade? (3) Is early screening for high academic potential biased by the child's gender, family income, birth semester, or level of the mother's education? A mean score combination of the instruments provided the most reliable and valid screening, but as systematic error by gender and level of mother's education was identified, similar instruments should be used cautiously.
Mounting evidence indicates that high quality preschool education benefits all children (Camilli et al., Citation2010; Gorey, Citation2001). Identifying children's strengths and weaknesses in all domains is crucial for their future development and should be integrated into high quality preschool systems (Snow & van Hemel, Citation2008). However, young children with high academic potential, who often develop at a faster cognitive rate than their peers (Clark, Citation2007), frequently do not have their needs assessed in early childhood education and care (ECEC) (Reis & Renzulli, Citation2010) and may not, therefore, have the opportunity to fully develop their potential (Hertzog, Citation2014; Hodge & Kemp, Citation2006). Neglecting early identification and support for these children may lead to diminished cognitive growth in the critical preschool years (Robinson et al., Citation2002) and increased risk for later social, behavioural, emotional, and educational problems (Harrison, Citation2004; Hodge & Kemp, Citation2006).
Identification of high academic potential at an early age has been controversial in the scholarly field (Pfeiffer & Petscher, Citation2008; Walsh et al., Citation2010). There is a lack of consensus about what constitutes high potential and how to measure it (Borland, Citation2014), few technically sound screening instruments designed for early identification (Hertzog, Citation2014; Pfeiffer & Petscher, Citation2008), and evidence that early childhood IQ measures are unreliable (Hodge & Kemp, Citation2000) despite early identification often being based on those IQ measures (Pfeiffer Citation2012; Pfeiffer & Blei, Citation2008). Furthermore, longitudinal evidence is mixed. Some studies have found instability of early childhood test scores and low predictive strength for high achievement over time (Gottfried et al., Citation2009; Perleth et al., Citation2000), while others have found that measures of high academic potential were stable and predictive of achievement up to 4 years later (Colombo et al., Citation2009).
Several terms are used in the international literature for labelling children with high potential, including “gifted”, “bright”, “precocious”, or “talented”. These terms are similar but encompass different connotations and theoretical conceptions. In this study we use the term “high academic potential”, aligned with Gagné’s (Citation2005) theoretical model of high potential as a continuum that may evolve and develop over time.
There is, however, agreement in the literature that effective systems for identifying high academic potential should consider multiple criteria and include diverse measures (Lohman & Foley, Citation2012; Pfeiffer & Blei, Citation2008). For early identification, parent and teacher nominations are especially important and complimentary, as parents may observe patterns in speech development, literacy, and numeracy during the earliest years (Louis & Lewis, Citation1992), whereas teachers can identify potential that stands out as exceptional within groups of similar aged children as they approach school entry (Pfeiffer, Citation2015; Pfeiffer & Blei, Citation2008).
Several rating scales for identifying high academic potential in children have been developed. In their review on assessment in gifted education, Cao et al. (Citation2017) found that ability and achievement tests are most commonly used for screening, but that teacher and parent rating scales are also popular. For teacher ratings in preschool and school, they identified the scales with the strongest psychometric properties as the Gifted Rating Scales (Pfeiffer & Jarosewich, Citation2003), the Scales for Rating Behavioural Characteristics of Superior Students (Renzulli, Citation2002), the Gifted and Talented Evaluation Scales (Gilliam & Jerman, Citation2015), and the Gifted Evaluation Scale 3rd edition (McCarney & Arthaud, Citation2009). For parent ratings of school children, Cao and colleagues (Citation2017) reported that the only psychometrically rigorous scales available (to date) were the Korean and Chinese language versions of the Gifted Rating Scales-School form (GRS-S, Lee & Pfeiffer, Citation2006; Li et al., Citation2008). They found no valid parent nomination scales for preschool children in the above-mentioned review. The Gifted Rating Scales for preschool and kindergarten (GRS-P, Pfeiffer et al., Citation2007) have been evaluated for diagnostic accuracy for predicting giftedness as measured on the Weschler Preschool and Primary Scale of Intelligence. Depending on the cut-off thresholds used to classify giftedness, this scale was found to correctly classify (overall correct classification, OCC, described later in this article) between 52% and 85% of children (Pfeiffer & Petscher, Citation2008).
Development in the early years is complex and dynamic and, as a result, accurate identification of high academic potential requires comprehensive evaluations. These can be time consuming, intrusive, and costly. Therefore, screening procedures that simply and correctly identify groups of students for further testing are important (McBee et al., Citation2016). Opinions differ over whether teachers, parents, IQ tests, or some combination of these, is the most reliable and valid approach (Gear, Citation1976; Gottfried et al., Citation2009; Hodge & Kemp, Citation2006), and combinations of such instruments have rarely been evaluated with preschool children. This is the focus of this study.
Evidence also indicates possible demographic bias in the early identification of academic potential. Literature on gender bias in the screening of high academic potential is mixed, with some studies suggesting that boys are more likely to be identified as having high potential than girls (Lubinski et al., Citation2006; Preckel et al., Citation2008), while others suggest the opposite (del Siegle & Reis, Citation1998; Read, Citation1991). Petersen (Citation2013) found little evidence of gender bias in the identification of high academic potential but recommended the use of multiple assessment criteria to reduce possible bias. Socio-economic status (SES) has been shown to impact teacher judgments of academic potential (Alvidrez & Weinstein, Citation1999; Baudson et al., Citation2016) with low-SES students less often nominated by teachers for gifted programmes than high-SES students (Elhoweris, Citation2008; Hamilton et al., Citation2018). Additional research is needed in this area and is the second focus of this study.
As early identification and educational support is important for the engagement and later educational success of students with high academic potential, there is an urgent need to evaluate the reliability and validity of different, cost effective, non-intrusive screening instruments. In this study we evaluate three instruments for early identification of high academic potential in Norway (a teacher questionnaire, a parent questionnaire, and one element from a full battery of IQ tests, independently and in combination) and we assess systematic error and bias in the use of these instruments.
The Nordic and Norwegian Context
Scandinavian countries have many similarities in education and legislation. In all Nordic countries, identifying and supporting the needs of children with high academic potential has been a neglected topic (Tourón & Freeman, Citation2018) and oftentimes puts elitist ambitions into conflict with egalitarian convictions (Dodillet, Citation2019). However, in both Sweden and Denmark, increased attention on talent development is now on the political agenda. Efforts have mainly supported children from middle-school and into the higher grades (Arnvig, Citation2019), but a recent press release from Danish Ministry of Education recommends that all children in first grade be systematically screened to identify and support the development of children with high academic potential (Danish Ministry of Children and Education, Citation2021).
A Norwegian White Paper on giftedness (Jøsendal, Citation2016), accompanied by a literature review of the field (Børte et al., Citation2016), are among the most important steps in Norwegian policy towards officially recognizing these children and their educational needs. A national project supporting gifted education from grade 7 upwards has also been piloted. The Norwegian Science Association and four regional Sciences Centres (in Oslo, Bergen, Trondheim and Tromsø), received government funding to pilot Centres for STEM Talents for 2016–2019 (Uniforum, Citation2016). After a positive evaluation of the pilot project (Lødding et al., Citation2020), the project became permanently funded and extended to the establishment of new centres in the regions of Jæren (in 2020) and Ås (in 2021). These initiatives show a breakthrough in the long-standing focus on egalitarianism within the Norwegian context. They have also resulted in increasing pressure being placed on the Norwegian education system for early identification of children with high academic potential so that their advanced developmental needs can be addressed from an early age in an inclusive environment (Idsøe, Citation2019; Jøsendal, Citation2016; Ministry of Education and Research, Citation2020). Sound identification strategies still need to be developed, but would align with the Norwegian framework plan for kindergarten, stating that kindergartens should “make allowances for the children's differing abilities, perspectives and experiences, and help to ensure that the children, together with others, develop a positive relationship with themselves and confidence in their own abilities” (Ministry of Education and Research, Citation2017, p. 8).
Assessing the Reliability and Validity of Screening Instruments
Assessing young children for academic potential and achievement has many practical and methodological challenges. Assessments should be cost-effective, non-intrusive and child friendly, as well as accurate, unbiased, and fit for purpose. These qualities can be assessed through evaluations of internal consistency (Cronbach's alpha), concurrent and predictive validity, interpretation/use arguments of validity, the sensitivity, specificity, and accuracy of the resulting identifications at different cut-off thresholds, and the appraisal of incorrect identifications for systematic error. Taken together, these methods provide a framework for evaluating and comparing different instruments, individually and in combination, in terms of reliability, validity, and bias, and therefore their appropriateness for use in screening and identification (McBee et al., Citation2014, Citation2016; Pfeiffer & Petscher, Citation2008; Raykov & Marcoulides, Citation2011).
Metrics of Reliability and Validity
Metrics of reliability and validity pertain to how well a method or test measures an outcome. Reliability refers to how consistent the measure is, and validity refers to how accurate the measure is. The degree to which a measure is reliable and valid is the degree to which the measurement is free from systematic and random measurement error (Raykov & Marcoulides, Citation2011). Systematic error consistently biases the measurement in a regular and repeatable manner due to some characteristic of an individual or group, and random error is the combined effect of non-systematic, transient, and specific factors that are unrelated to group characteristics or the construct of interest. Both types of error limit the utility of test scores, but due to the nature of measurement in social science, are often present in varying degrees across different instruments (Raykov & Marcoulides, Citation2011).
Reliability and validity can be assessed by different metrics and in different combinations. Cronbach's alpha indicates the internal consistency of several items designed to measure a construct, and a value of 0.7 or higher represents an adequately consistent scale. In linear analyses, the proportion of variance explained (R2) between a test and an outcome criterion is a metric of criterion validity (either concurrent, when both are measured simultaneously, or predictive, when the criterion is measured later). Finally, when binary groups are formed (for example “high achievers” and “not high achievers”), binary classification identifies the “true positive” and “true negative” rates (the proportion of cases accurately identified as belonging (or not) to the outcome group) and “false positive” and “false negative” rates (the proportion of cases that are incorrectly identified). In their evaluation of the GRS-P, Pfeiffer and Petscher (Citation2008) measured diagnostic accuracy with the metrics of “sensitivity” (the proportion of cases with the outcome attribute that are true positive), “specificity” (the proportion of cases without the outcome attribute that are true negative), and “overall correct classification” (OCC, true positives + true negatives divided by n).
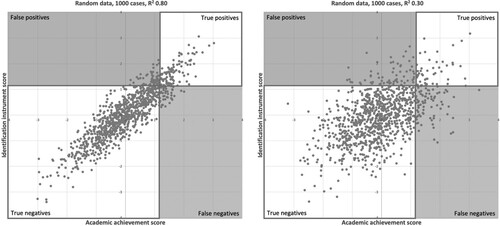
The effect of measurement error on the reliability of identification instruments is illustrated in . Both graphs show simulated standardized data for 1,000 cases with the cut-off for identification and achievement set at 1.28 SD (90th percentile). This simulates the assumption that being in the top 10% of scores on the identification instrument will correspond to being in the top 10% of scores on academic achievement. The first graph simulates an R2 of 0.80 (indicating 80% of explained variance, therefore low measurement error) and the second graph simulates an R2 of 0.30 (indicating only 30% of explained variance, therefore high measurement error). As can be observed, the number of false positives and false negatives in the second scenario is far larger than the first, and therefore, the hypothetical instrument with higher measurement error (lower R2) has lower criterion validity and is less fit for purpose.
Figure 1. Relationship between R2, true and false positives, and true and false negatives.
Scholars recommend using a combination of screening instruments to improve accuracy and reduce measurement error (McBee et al., Citation2014). However, despite discussion in the literature about different combination rules (mean scores, logical OR, or logical AND), real data has not been used to compare effectiveness. The method of combination impacts the number of children that are identified, with the mean rule identifying all children that, on average, score above the cut-off, the logical OR rule identifying all that score above the cut-off on any one of the instruments (therefore, more children), and the logical AND rule identifying all that score above the cut-off on all the instruments (therefore, less children). McBee and colleagues (Citation2014) used simulation data to compare these combination rules. They concluded that assessment systems perform worse, and are more susceptible to measurement error than is generally assumed, and that the mean combination rule best ameliorates the effects of measurement error. In addition, lowering the cut-off for identification, makes it more likely that a screening instrument will be more effective (more true positives will be identified), but at the cost of (often significantly) diminished overall accuracy (as many more false positives will also be nominated). This may result in a trivial screening mechanism, where most of the target group are correctly identified, but the number of false positives so far outweighs the true positives, that the screening becomes of no practical use (McBee et al., Citation2016).
Interpretation/Use Argument for Validity
Early assessment of validity focussed on the properties of the instrument itself, but more recently, validity is also assessed as a property of the proposed interpretation and use of scores. Kane has written extensively about the argument-based approach to validity and the development of interpretation/use arguments (Kane, Citation2013, Citation2016).
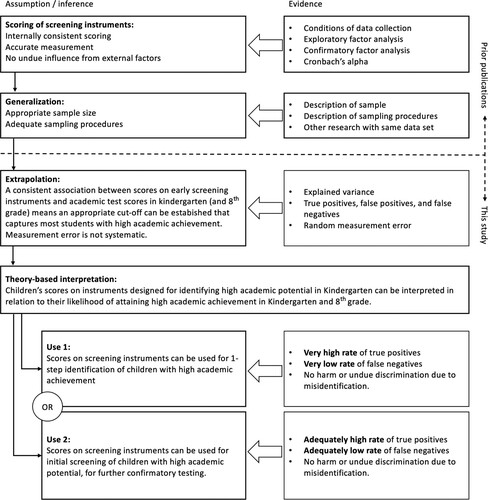
An interpretation/use argument (IUA) is an explicit, clear, and complete statement detailing the rationale for the inferences, assumptions, conclusions, and uses of test scores (Carney et al., Citation2019; Kane, Citation2013, Citation2016). If the argument is coherent and complete, and the inferences and assumptions are highly plausible, the interpretation and use can be considered valid. It is an approach that is aligned with the Standards for educational and psychological testing (AERA, APA & NCME, Citation2014; Carney et al., Citation2019) and is therefore appropriate for this study. As illustrated in , the IUA for this study is:
Children's scores on instruments designed for identifying academic potential in kindergarten can be interpreted in relation to their likelihood of attaining high academic achievement in kindergarten and 8th grade. If highly reliable and valid, the scores can be used for a 1-step identification of children with high academic potential (Use 1). If only adequately reliable and valid, the scores can be used for initial screening of children with high academic potential, who could later be accurately identified with further testing (Use 2). Both uses can only be valid if measurement error (misidentification) will not harm or unduly discriminate against a child or a particular group of children.
Figure 2. The interpretation/use argument for identifying children with high academic potential.
Research Questions
In this study, we evaluated three instruments (a short teacher questionnaire, a short parent questionnaire, and an age-appropriate element from a full battery of IQ tests) individually and in combination, in accordance with the IUA in . The research questions were:
Do children's scores on early screening instruments accurately identify high academic potential in kindergarten?
Are children's scores on kindergarten screening instruments for high academic potential consistent with academic achievement in 8th grade?
Is early screening for high academic potential biased by the child's gender, family income, birth semester, or level of the mother's education?
This study makes a unique contribution to the existing literature in four ways: it evaluates screening instruments with young children, it evaluates screening instruments free from the potential bias that is implicit in selection for gifted programmes (there was no high stakes outcome as a result of the screening), it longitudinally evaluates the effectiveness of the resulting identifications, and it does so within the Norwegian context, where the testing and screening of young children is unusual.
Materials and Methods
The data used in this study are from the SKOLEKLAR project conducted in southwest Norway, 2011–2020. Different sub-projects in SKOLEKLAR have analysed, among other things, child self-regulation (Fandrem & Vestad, Citation2015; Lenes, Gonzales, et al., Citation2020; Lenes, McClelland, et al., Citation2020; Størksen et al., Citation2015), executive function (ten Braak et al., Citation2019; ten Braak et al., Citation2022), and the psychometric characteristics of the early academic assessments developed for the project (Størksen et al., Citation2013; ten Braak & Størksen, Citation2021). One of the proposed sub-projects of SKOLEKLAR was the development of instruments to identify children with high academic potential at an early age. The psychometric properties of these teacher and parent scales have been published (Idsøe et al., Citation2021), however, the cumulative and longitudinal properties of these instruments have not yet been explored.
The complete SKOLEKLAR data set includes 243 children, born in 2006 and in kindergarten in 2011/2012. From that set, 219 children had complete data on the variables for the early identification of high academic potential included in this study, and 136 of these children have complete data for 8th grade achievement (in 2020). This attrition is administrative (families moving out of the region or choosing to drop out when new consent forms were required), as can be observed by the insignificant variation in the descriptive statistics in . The findings presented in this article are based on the sample of children with complete data in kindergarten and 8th grade (n = 136).
Table 1. Descriptive statistics, cases.
The sampling procedures, sample size, and conditions of data collection (described fully in the previously mentioned studies) were such that the results from this study are moderately generalizable to similar populations of children and similar screening instruments.
Analytic Strategy
Several quantitative methods were employed in this study. As a first step, we explored the factor structures for the parent and teacher questionnaires with principal component analysis (PCA) and confirmatory factor analysis (CFA), fully reported in Idsøe et al. (Citation2021) and summarized in the following section. This resulted in a single factor, and equivalent sum score, for each scale. To explore research questions 1 and 2 in this study, regression models (with controls for demographic variables) and descriptive analyses of the true positive, true negative, false positive, and false negative rate were conducted. The summary measures of sensitivity, specificity and overall correct classification (Pfeiffer & Petscher, Citation2008) were also calculated. Finally, the existence of bias through systematic error (RQ 3), was evaluated using Pearson's Chi-squared tests comparing the predicted frequency to the observed distribution across demographic groups.
All analyses were conducted in R version 4.0.3 (R Core Team, Citation2021) and RStudio version 1.1.463 (RStudio Team, Citation2021), alpha was set at 0.05, and p-values are represented with the standard notation of *** p < .001, ** p < .01, and * p < .05. For the regression analyses, all variables were standardized.
Variables
Kindergarten Academic Potential
Kindergarten academic potential was assessed with three instruments (a teacher questionnaire, a parent questionnaire, and an IQ test). Despite the psychometric validation of some preschool teacher nomination instruments in other contexts, these required modification for the Norwegian play-based pedagogical context. The three phases for creating rigorous scales (item development, scale development, and scale evaluation) were employed. The gifted rating scales GRS-P (Pfeiffer et al., Citation2007) and Scales for Identifying Gifted Students, SIGS-2 (Ryser & McConnell, Citation2004) were modified and shortened for the Norwegian context. Items were selected in consultation with child specialists, caregivers, parents and teachers, resulting in a 10-item questionnaire for teachers, and a 6-item questionnaire for parents, both with Likert scale responses. Evaluation of the development and psychometric properties of the teacher and parent scales (PCA, CFA, and concurrent validity with achievement scores in kindergarten) resulted in a 7-item teacher nomination scale (Cronbach's Alpha (α) = 0.852) and a 4-item parent nomination scale (α = 0.702) (Idsøe et al., Citation2021). The questionnaire items retained in the scales are displayed in .
Table 2. Questionnaire items retained in the teacher and parent scales.
The Digit Span Test, a sub-test from the Weschler's Intelligence Scale, was used as a proxy for directly assessed intelligence (referred to as IQ test in the tables and discussion that follow). This is a short, easy to administer test, that correlates significantly with the full Weschler's Intelligence Scale for children, and is therefore suitable for integration into an assessment battery for young children (Sattler, Citation1992; Wechsler, Citation1991).
The Cronbach's alpha for all 12 items used in this study (7 teacher items, 4 parent items, and the IQ test item) was 0.777.
Three different combinations of these instruments were constructed and evaluated, following the combination rules set out by McBee and colleagues (Citation2014). The combined scale (mean) was the average of each of the three scales, such that each scale was attributed one third of a possible score out of 100 and then standardized. The combined scale (logical OR), was constructed according to the rules of logical operations, and is the highest (standardized) score of the three scales, and the combined scale (logical AND), also constructed according to the rules of logical operations, is the lowest (standardized) score of the three scales. These logical combination rules are also consistent with set theory, and the set operations of union and intersection (Ragin, Citation1987; Schneider & Wagemann, Citation2012).
Kindergarten Academic Achievement
The kindergarten academic achievement variable was the average of three short child-friendly tests (math, vocabulary, and phonological awareness) administered on a computer tablet. The Ani Banani Math Test (ten Braak & Størksen, Citation2021) assessed mathematics skills through 18 items where children help a monkey with activities such as counting toys and identifying geometric objects (α = 0.740). The Norwegian Vocabulary Test (Størksen et al., Citation2013) assessed children's vocabulary through 45 visual objects presented on screen that the children were instructed to name (α = 0.842). A sub-test from the official battery of literacy screening tests from The Norwegian Directorate for Education and Training assessed phonological awareness through a 12-item blending task where children identified the image represented by individual phonemes presented by the research assistant (α = 0.750).
8th Grade Academic Achievement
The 8th grade academic achievement variable was the average of the Norwegian national screening tests in reading and mathematics (in Norwegian), and English as a second language.
Control Variables
Demographic variables for gender, birth month, mother's level of education, and family income were included in this study, and retained when statistically significant.
Results
Early Identification of High Academic Potential
Kindergarten academic achievement was regressed on each academic potential scale, and control variables were retained when significant. As displayed in , the parent only model (Model 1) had the lowest explained variance and therefore the lowest concurrent validity (R2 = 0.22), and the IQ test only (Model 3) had, among the individual scale models, the highest explained variance (R2 = 0.35). Overall, the combined (mean) model (Model 4) was the model with the best linear fit statistics (F = 53.78, RSE = 0.771, R2 = 0.45, p < 0.001) and therefore displayed the best concurrent validity among the linear models. It explained 45% of the variance and indicated that a 1 SD increase on the combined identification scale was associated with a 0.65 SD increase in academic achievement scores in kindergarten, when controlling for mother's level of education (the only control variable that was consistently significant across models).
Table 3. Models regressing kindergarten academic achievement on each academic potential scale.
The rates of true and false positives and negatives were explored through grouping and cross tabulation. As McBee and colleagues (Citation2014) indicated that lowering the cut-off rate for screening can increase the rate of true positives (at the cost of increased false positives), results were compared using cut-offs of 1.28 SD and 0.67 SD above the mean. The outcome group was children that scored 1.28 SD above the mean in kindergarten academic achievement tests (n = 25). As presented in and , the combined (logical OR) scale had the highest sensitivity (56% at the 1.28 SD cut-off, and 92% at the 0.67 SD cut-off) but OCC was lower than the other scales (more children were misidentified). Overall, the combined (mean) scale at the 0.67 SD cut-off offered the best combination of sensitivity and OCC, identifying 80% of the outcome group, with an overall correct classification rate of 82%. However, five students that scored 1.28 SD or more above the mean in the kindergarten achievement tests were missed by this scale (false negatives) and would therefore be excluded from additional testing or resources made available to children identified as having high academic potential.
Table 4. Kindergarten screening, 1.28 SD cut-off.
Table 5. Kindergarten screening, 0.67 SD cut-off.
Longitudinal Reliability of Early Academic Potential
Students’ 8th grade academic achievement was regressed on each of the kindergarten academic potential scales, and control variables were retained when significant. As presented in , the combined (mean) model (Model 4) was the model with the best linear fit statistics (F = 52.03, RSE = 0.755, R2 = 0.44, p < 0.001), indicating the best predictive validity.
Table 6. Models regressing 8th grade academic achievement on each academic potential scale.
The rates of true and false positives and negatives in 8th grade were also explored. The outcome group was the group of children that scored 1.28 SD above the mean in the 8th grade academic achievement tests (n = 19). The summary measures of sensitivity and OCC are presented in , where it can be observed that the combined (mean) scale at the 0.67 SD cut-off offered the best combination of sensitivity and OCC, identifying 68% of the outcome group, with an overall correct classification rate of 76%. The combined (logical OR) scale at the 1.28 SD cut-off and the teacher scale at the 0.67 SD cut-off resulted in similar levels of accuracy.
Table 7. 8th grade sensitivity and OCC of screening, 1.28 SD and 0.67 SD cut-offs.
Biased Identification Due to Systematic Error
Identification bias caused by systematic error due to gender, family income, birth semester (relative age), or level of mother's education, was explored using Pearson's Chi-squared tests comparing predicted frequency to observed distribution in each scenario. No evidence of systematic error by family income or birth semester was found, but systematic error by gender and mother's level of education was found in kindergarten and 8th grade.
In this sample, girls were more likely than boys to score 1.28 SD or more above the mean on academic achievement tests in both kindergarten and to a lesser extent in 8th grade (not measurement error, but the reality of this sample/assessment combination). Girls were also more likely than boys to be correctly identified as having academic potential (true positives), but this difference was not statistically significantly different from the distributions that were observed in the academic assessments. However, girls were significantly more likely than boys to have been incorrectly identified (false positives) in kindergarten by parents (χ2 = 5.528, p = 0.019) and the IQ test (χ2 = 5.293, p = 0.021), and in 8th grade, by parents (χ2 = 5.769, p = 0.016) and the IQ test (χ2 = 5.192, p = 0.023).
Systematic error by mother's level of education was also found. Children whose mothers had at least some college level education were somewhat more likely than their peers to score 1.28 SD or more above the mean on academic achievement tests in kindergarten, and to a greater extent in 8th grade. They were also somewhat more likely to be correctly identified as having academic potential (true positives). However, whereas some significant error was evidenced in kindergarten, the most consistent systematic error was in 8th grade, where children whose mothers had at least some college level education were significantly more likely than their peers to not have been identified (during kindergarten) as having academic potential (false negatives), by parents (χ2 = 4.905, p = 0.027), teachers (χ2 = 4.259, p = 0.039), and IQ tests (χ2 = 5.963, p = 0.015).
By going back to the cases in each scenario and exploring how the groups of children that were correctly and incorrectly identified changed over time, we were able to visualize the extent of the systematic error in these screening instruments. This is illustrated in , where the gender of the child is depicted by the shape (circles are girls and squares are boys) and the level of mother's education is depicted by the colour (a solid colour represents children whose mothers reported having at least some college level education), the cut-off for high potential screening is 0.67 SD above the mean, and the cut-off for high achievement is 1.28 SD above the mean. Capital letters identify the configurational spaces and numbers represent counts.
Figure 3. High academic potential and academic achievement, by gender and mother's education.
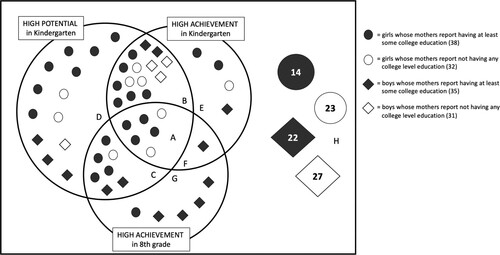
This figure shows that although the number of children with high academic achievement was similar in kindergarten (n = 25) and 8th grade (n = 19), only seven children scored in the high achievement group at both time points (sectors A and F). Sectors D, E, F, and G represent error, in the form of false positives (D) and false negatives (E, F, and G). Although girls made up 51% of the sample, they were overrepresented as false positives (sector D, 69%), and although children whose mothers reported having at least some college education made up 54% of the sample, they too were overrepresented as false positives (77%). In the case of false negatives (sectors E, F, and G), boys and children whose mothers reported having at least some college level education were overrepresented. The six children that were correctly identified as having high academic potential in kindergarten and scored in the high achievement group in both kindergarten and 8th grade (sector A) are all girls, and the largest group of children that were correctly identified as true negatives (sector H) were boys whose mothers did not have higher education (31% of group H, 23% of the sample). Although difficult to disentangle, there is evidence of systematic error in the early identification of children with high academic potential with these screening instruments, due to gender and level of mothers’ education.
Discussion
This study sheds light on several important aspects of the screening of young children for high academic potential. In our exploration of research questions 1 and 2, we found that a combination of screening instruments was most reliable and valid for identifying young children with high academic potential, and that academic potential and achievement in children evolves over time. Regarding research question 3, we found evidence of systematic error and identification bias.
Combining Measurement Instruments
As predicted through simulation studies by McBee and colleagues (Citation2014), this study has shown that screening that includes multiple sources and a mean combination rule provides the best result in terms of sensitivity and overall correct classification. However, even with information gathered from parents, teachers, and an IQ test, the scales used in this study were too imprecise for definitive identification of children with high academic potential (Use 1 of the IUA, ). At best, the scales were able to identify 80% of children that scored high on academic achievement tests, but at the same time, over half of those that were identified, scored within the normal range compared to their peers. This level of accuracy in identifying early academic potential may, however, make this scale adequate for use as an initial screening of a larger group of children, from which children with high academic potential could later be identified with further testing (Use 2 of the IUA).
These results indicate that a combination of nomination instruments for identifying early academic potential, including parents, teachers, and an IQ test, and combined with the mean combination rule, can be a tool for better understanding the diversity of abilities and needs of young children, and for informing pedagogical decisions that support the best possible academic outcomes for all students. The combination of scales designed in this study resulted in overall correct classification of between 55% and 85% of children (depending on the cut-off thresholds and combination rules applied), a very similar accuracy rate to that of the more extensive GRS-P scales used in other contexts (between 52% and 85%, reported in Pfeiffer & Petscher, Citation2008).
The Evolution of Potential and Achievement in Children
This study also illustrates how academic potential and achievement change over time. Many of the children that were identified as having high academic potential in kindergarten with the combined scale, tested in the high academic achievement group in kindergarten, 8th grade, or both. But the groups changed, and this change provides evidence of the evolution of academic potential and achievement in children, who move across cut-off thresholds and in and out of groups over time.
Therefore, using just one identification instrument, or even a combination of screening instruments at just one time point, will be inadequate for identifying children's academic potential for the duration of their schooling. As indicated by Pfeiffer (Citation2015) and supported by our findings, children should be continuously assessed throughout their educational years. A combination of screening instruments, and multiple screenings at different developmental time points, will best respond to the changing needs of children with high academic potential.
Systematic Error and Identification Bias
Finally, this study has shown that, despite strong and enduring linear relationships between early identification scales for academic potential, early academic achievement, and later academic achievement, there are high and significant rates of error and misidentification. There is also evidence that this error is systematic. Misidentification of early academic potential could have negative consequences for those children affected, depending on the interpretation and use of the screening instruments. A child that is missed by screening (false negative) may never have the opportunity to receive the additional testing and pedagogic support that correctly identified children receive. On the other hand, a child that is incorrectly identified as having high academic potential (false positive) may suffer unnecessary stress and disorientation through expectations of high academic potential when, in fact, their potential and achievement are in the normal range.
In this study we have found evidence that this type of screening is susceptible to systematic error and that some groups of children are more vulnerable to any negative effects of misidentification. For this reason, such screening should not be undertaken unless it can be shown that no harm or disadvantage will befall a child, or group of children, that is misidentified.
Implications for Norwegian ECEC
Conducting this study within Norwegian ECEC has resulted in some unique insights and challenges. As the children with high academic potential were not separated from their peers for any special support, we were able to observe their natural development without any risk from screening error or misidentification. However, any potential benefits from additional academic support were also forfeited. We do not know, from this study, what the trajectories of young children with high academic potential would have been, had they been provided with the special pedagogical attention that scholars in the field recommend.
Nonetheless, this study found that low cost and non-intrusive screening of academic potential in young children was possible within the Norwegian ECEC context. This is aligned with the aims and objectives of early childhood education and care in Norway, to identify children's different abilities and provide the opportunities for them to develop those abilities, as detailed in the framework plan for kindergartens (Ministry of Education and Research, Citation2017).
Limitations and Future Research
This study was conducted with a relatively small group of children, who, although coming from different early childhood centres and schools, and having different demographic characteristics, all came from the same geographical location in southwest Norway. The results from this study are therefore only moderately generalizable to similar populations. Future research could test the external validity of these findings through replications with larger samples and in diverse geographic contexts and could replicate the study design to evaluate the reliability and validity of other instruments. The effect of psychological factors, such as motivation, on the development of potential and achievement could also be explored, and professional work on the development of appropriate support and extension for children identified as having high academic potential within a common and holistic framework, should be undertaken.
Conclusion
Early identification and educational support are important for the engagement and later success of students with high academic potential, and there is an urgent need to evaluate different, cost effective, non-intrusive mechanisms of early identification of academic potential. This study found that a combination of screening instruments (combined with the mean rule) provided the most effective and efficient screening, but that there was systematic error in the screening by gender and level of mother's education. The findings from this study, therefore, do not support the use of these and similar instruments for the definitive identification of early academic potential, but do support the cautious use of such screening instruments as one tool for the continuous work of knowing the most we can possibly know about our diverse and talented students and their educational needs.
Disclosure Statement
No potential conflict of interest was reported by the author(s).
Additional information
Funding
References
- AERA, APA, & NCME. (2014). Standards for educational and psychological testing. American Educational Research Association.
- Alvidrez, J., & Weinstein, R. (1999). Early teacher perceptions and later student academic achievement. Journal of Educational Psychology, 91(4), 731–746. https://doi.org/10.1037/0022-0663.91.4.731
- Arnvig, B. (2019). Blik på talentudvikling og høytbegavede børn og unge i Danmark [A look at talent development and highly gifted children and young people in Denmark]. Dansk Psykologisk Forlag A/S.
- Baudson, T., Fischbach, A., & Preckel, F. (2016). Teacher judgments as measures of children’s cognitive ability: A multilevel analysis. Learning and Individual Differences, 52, 148–156. https://doi.org/10.1016/j.lindif.2014.06.001
- Borland, J. (2014). Identification of gifted students. In J. Plucker & C. Callahan (Eds.), Critical issues and practices in gifted education: What the research says (2nd ed., pp. 323–342). Prufrock Press.
- Børte, K., Lillejord, S., & Johansson, L. (2016). Evnerike elever og elever med stort læringspotensial: En forskningsoppsummering [Talented students and students with great learning potential: A research summary]. Kunnskapssenter for utdanning. https://www.forskningsradet.no/siteassets/publikasjoner/1254019980213.pdf
- Camilli, G., Vargas, S., Ryan, S., & Barnett, W. (2010). Meta-analysis of the effects of early education interventions on cognitive and social development. Teachers College Record: The Voice of Scholarship in Education, 112(3), 579–620. https://doi.org/10.1177/016146811011200303
- Cao, T., Jung, J., & Lee, J. (2017). Assessment in gifted education: A review of the literature from 2005 to 2016. Journal of Advanced Academics, 28(3), 163–203. https://doi.org/10.1177/1932202X17714572
- Carney, M., Crawford, A., Siebert, C., Osguthorpe, R., & Thiede, K. (2019). Comparison of two approaches to interpretive use arguments. Applied Measurement in Education, 32(1), 10–22. https://doi.org/10.1080/08957347.2018.1544138
- Clark, B. (2007). Growing up gifted (7th ed.). Pearson Education, Inc.
- Colombo, J., Shaddy, D., Blaga, O., Anderson, C., & Kannass, K. (2009). High cognitive ability in infancy and early childhood. In F. Horowitz, R. Subotnik, & D. Matthews (Eds.), The development of giftedness and talent across the lifespan (pp. 23–42). American Psychological Association.
- Danish Ministry of Children and Education. (2021, October 29). Fremtidigt evaluerings- og bedømmelsessystem [Future evaluation and assessment system]. https://www.uvm.dk/aktuelt/i-fokus/evaluerings-og-bedoemmelsessystem
- Dodillet, S. (2019). Inclusive elite education in Sweden: Insights from implementing excellence programs into an egalitarian school culture. Scandinavian Journal of Educational Research, 63(2), 258–271. https://doi.org/10.1080/00313831.2017.1336480
- Elhoweris, H. (2008). Teacher judgment in identifying gifted/talented students. Multicultural Education, 15(3), 35–38.
- Fandrem, H., & Vestad, L. (2015). Selvregulering, språk og relasjon til pedagogen hos minoritetsspråklige og majoritetsspråklige førskolebarn [Self-regulation, language and relationship to the educator in minority language and majority language preschool children], Spesialpedagogikk, 1. https://utdanningsforskning.no/artikler/2015/bedre-sprakutvikling-med-gode-relasjoner-i-barnehagen/
- Gagné, F. (2005). From gifts to talents – the DMGT as a developmental model. In R. Sternberg & J. Davidson (Eds.), Conceptions of giftedness (pp. 98–120). Cambridge University Press.
- Gear, G. (1976, Winter). Accuracy of teacher judgment in identifying intellectually gifted children: A review of the literature. Gifted Child Quarterly, 20(4), 478–490. https://doi.org/10.1177/001698627602000416
- Gilliam, J., & Jerman, O. (2015). Gifted and talented evaluation scales: A norm-referenced procedure for identifying gifted and talented students (2nd ed.). Pro-Ed.
- Gorey, K. (2001). Early childhood education: A meta-analytic affirmation of the short- and long-term benefits of educational opportunity. School Psychology Quarterly, 16(1), 9–30. https://doi.org/10.1521/scpq.16.1.9.19163
- Gottfried, A., Gottfried, A., & Guerin, D. (2009). Issues in early prediction and identification of intellectual giftedness. In F. Horowitz, R. Subotnik, & D. Matthews (Eds.), The development of giftedness and talent across the life span (pp. 43–56). American Psychological Association.
- Hamilton, R., McCoach, D., Tutwiler, M., Siegle, D., Gubbins, E., Callahan, C., Brodersen, A. V., & Mun, R. (2018). Disentangling the roles of institutional and individual poverty in the identification of gifted students. Gifted Child Quarterly, 62(1), 6–24. https://doi.org/10.1177/0016986217738053
- Harrison, C. (2004). Giftedness in early childhood: The search for complexity and connection. Roeper Review, 26(26), 78–84. https://doi.org/10.1080/02783190409554246
- Hertzog, N. (2014). Critical issues in early childhood education. In J. Plucker & C. Callahan (Eds.), Critical issues and practices in gifted education: What the research says (2nd ed., pp. 195–206). Prufrock Press.
- Hodge, K., & Kemp, C. (2000). Exploring the nature of giftedness in preschool children. Journal for the Education of the Gifted, 24(1), 46–73. https://doi.org/10.1177/016235320002400103
- Hodge, K., & Kemp, C. (2006). Recognition of giftedness in the early years of school: Perspectives of teachers, parents, and children. Journal for the Education of the Gifted, 30(2), 164–204. https://doi.org/10.4219/jeg-2006-259
- Idsøe, E. (2019). Barn med stort læringspotensial i barnehagen [Children with great learning potential in pre-school]. Cappelen Damm AS.
- Idsøe, E., Campbell, J., Idsøe, I., & Størksen, I. (2021). Development and psychometric properties of nomination scales for high academic potential in early childhood education and care. European Early Childhood Education Research Journal, 1–14. Advance online publication. https://doi.org/10.1080/1350293X.2021.2007969
- Jøsendal, J. (2016). More to gain: Better learning for students with higher learning potential. Official Norwegian Reports NOU 2016:14.
- Kane, M. (2013). Validation as a pragmatic, scientific activity. Journal of Educational Measurement, 50(1), 115–122. https://doi.org/10.1111/jedm.12007
- Kane, M. (2016). Validation strategies: Delineating and validating proposed interpretations and uses of test scores. In S. Lane, M. Raymond, & T. Haladyna (Eds.), Handbook of test development (Vol. 2, pp. 80–96). Routledge.
- Lee, D., & Pfeiffer, S. (2006). The reliability and validity of a Korean-translated version of the Gifted Rating Scales. Journal of Psychoeducational Assessment, 24(3), 210–224. https://doi.org/10.1177/0734282906287829
- Lenes, R., Gonzales, C., Størksen, I., & McClelland, M. (2020). Children’s self-regulation in Norway and the United States: The role of mother’s education and child gender across cultural contexts. Frontiers in Psychology, 11(566208), 1–17. https://doi.org/10.3389/fpsyg.2020.566208
- Lenes, R., McClelland, M., ten Braak, D., Idsøe, T., & Størksen, I. (2020). Direct and indirect pathways from children’s early self-regulation to academic achievement in fifth grade in Norway. Early Childhood Research Quarterly, 53, 612–624. https://doi.org/10.1016/j.ecresq.2020.07.005
- Li, H., Pfeiffer, S., Petscher, Y., Kumtepe, A., & Mo, G. (2008). Validation of the Gifted Rating Scales-School form in China. Gifted Child Quarterly, 52(2), 160–169. https://doi.org/10.1177/0016986208315802
- Lødding, B., Bergene, A., Bungum, B., Sølberg, J., Hammer, J., & Vennerød-Diesen, F. (2020). Evalueringen av tett på realfag: Implementeringen fortsetter, 2015–2019 [The evaluation of ‘Close to Science’ 2015–2019]. Norwegian Institute for Innovation, Research, and Education. https://www.udir.no/
- Lohman, D., & Foley, M. (2012). Ability testing and talent identification. In S. Hunsaker (Ed.), Identification: The theory and practice of identifying students for gifted and talented education services (pp. 283–335). Creative Learning Press.
- Louis, B., & Lewis, M. (1992). Parental beliefs about giftedness in young children and their relation to actual ability level. Gifted Child Quarterly, 36(1), 27–31. https://doi.org/10.1177/001698629203600107
- Lubinski, D., Benbow, C., Webb, R., & Bleske-Rechek, A. (2006). Tracking exceptional human capital over two decades. Psychological Science, 17(3), 194–199. https://doi.org/10.1111/j.1467-9280.2006.01685.x
- McBee, M., Peters, S., & Miller, E. (2016). The impact of the nomination stage on gifted program identification: A comprehensive psychometric analysis. Gifted Child Quarterly, 60(4), 258–278. https://doi.org/10.1177/0016986216656256
- McBee, M., Peters, S., & Waterman, C. (2014). Combining scores in multiple-criteria assessment systems: The impact of combination rule. Gifted Child Quarterly, 58(1), 69–89. https://doi.org/10.1177/0016986213513794
- McCarney, S., & Arthaud, T. (2009). Gifted evaluation scale third edition (GES-3). Hawthorne Educational Services.
- Ministry of Education and Research. (2017). Framework plan for the content and tasks of kindergartens. https://www.udir.no/globalassets/filer/barnehage/rammeplan/framework-plan-for-kindergartens2-2017.pdf
- Ministry of Education and Research. (2020). Tett på – tidlig innsats og innkluderende fellesskap i barnehage, skole og SFO, Meld. St. 6, 2019–2020 [Early intervention and inclusive education in kindergartens, schools and out-of-school-hours care]. https://www.regjeringen.no/no/dokumenter/meld.-st.−6-20192020/id2677025/
- Perleth, C., Schatz, T., & Mönks, F. (2000). Early identification of high ability. In K. Heller, F. Mönks, R. Sternberg, & R. Subotnik (Eds.), International handbook of giftedness and talent (2nd ed., pp. 283–316). Elsevier Science.
- Petersen, J. (2013). Gender differences in identification of gifted youth and in gifted program participation: A meta-analysis. Contemporary Educational Psychology, 38(4), 342–348. https://doi.org/10.1016/j.cedpsych.2013.07.002
- Pfeiffer, S. (2012). Current perspectives on the identification and assessment of gifted students. Journal of Psychoeducational Assessment, 30(1), 3–9. https://doi.org/10.1177/0734282911428192
- Pfeiffer, S. (2015). Essentials of gifted assessment. Wiley.
- Pfeiffer, S., & Blei, S. (2008). Gifted identification beyond the IQ test: Rating scales and other assessment procedures. In S. Pfeiffer (Ed.), Handbook of giftedness in children: Psychoeducational theory, research, and best practices (pp. 177–198). Springer.
- Pfeiffer, S., & Jarosewich, T. (2003). GRS: Gifted rating scales. Psychological Corporation.
- Pfeiffer, S., & Petscher, Y. (2008). Identifying young gifted children using the gifted rating scales—Preschool/ kindergarten form. Gifted Child Quarterly, 52(1), 19–29. https://doi.org/10.1177/0016986207311055
- Pfeiffer, S., Petscher, Y., & Jarosewich, T. (2007). The Gifted Rating Scales -Preschool/kindergarten form: An analysis of the standardization sample based on age, gender, and race. Roeper Review, 29(3), 206–211. https://doi.org/10.1080/02783190709554410
- Preckel, F., Goetz, T., Pekrun, R., & Kleine, M. (2008). Gender differences in gifted and average-ability students: Comparing girls’ and boys’ achievement, self-concept, interest, and motivation in mathematics. Gifted Child Quarterly, 52(2), 146–159. https://doi.org/10.1177/0016986208315834
- R Core Team. (2021). R: A language and environment for statistical computing. R Foundation for Statistical Computing. https://www.R-project.org
- Ragin, C. (1987). The comparative method: Moving beyond qualitative and quantitative strategies. University of California Press.
- Raykov, T., & Marcoulides, G. (2011). Introduction to psychometric theory. Sense Publishers.
- Read, C. (1991). Gender distribution in programs for the gifted. Roeper Review, 13(4), 188–193. https://doi.org/10.1080/02783199109553356
- Reis, S., & Renzulli, J. (2010). Is there still a need for gifted education? An examination of current research. Learning and Individual Differences, 20(4), 308–317. https://doi.org/10.1016/j.lindif.2009.10.012
- Renzulli, J. (Ed.). (2002). Gifted and talented behavior and education: A special issue of exceptionality. Routledge.
- Robinson, N., Lanzi, R., Weinberg, R., Ramey, S., & Ramey, C. (2002). Family factors associated with high academic competence in former head start children at third grade. Gifted Child Quarterly, 46(4), 278–290. https://doi.org/10.1177/001698620204600404
- RStudio Team. (2021). RStudio: Integrated development for R. RStudio. http://www.rstudio.com/
- Ryser, G., & McConnell, K. (2004). SIGS-complete kit: Scales for Identifying Gifted students. Prufrock Press.
- Sattler, J. (1992). Wechsler Intelligence Scale for children – revised (WISC-R). In J. Sattler (Ed.), Assessment of children, revised and updated third edition (pp. 119–145). Jerome M. Sattler.
- Schneider, C., & Wagemann, C. (2012). Set-theoretic methods for the social sciences: A guide to qualitative comparative analysis. Cambridge University Press.
- Siegle, D., & Reis, S. (1998). Gender differences in teacher and student perceptions of gifted students’ ability and effort. Gifted Child Quarterly, 42(1), 39–47. https://doi.org/10.1177/001698629804200105
- Snow, C., & van Hemel, S. (Eds.). (2008). Early childhood assessment: Why, what and how. National Academies.
- Størksen, I., Ellingsen, I., Tvedt, M., & Idsøe, E. (2013). Norsk vokabulartest (NVT) for barn i overgangen mellom barnehage og skole: Psykometrisk vurdering av en nettbrettbasert test [Norwegian vocabularly test NVT for children transitioning from kindergarten to school: Psychometric assessment of a web-based test]. Spesialpedagogikk forskningsdel, 04/13, 40–54.
- Størksen, I., Ellingsen, I., Wanless, S., & McClelland, M. (2015). The influence of parental socioeconomic background and gender on self-regulation among 5-year-old children in Norway. Early Education and Development, 26(5), 663–684. https://doi.org/10.1080/10409289.2014.932238
- ten Braak, D., Lenes, R., Purpura, D., Schmitt, S., & Størksen, I. (2022). Why do early mathematics skills predict later mathematics and reading achievement? The role of executive function. Journal of Experimental Child Psychology, 214(2022), 105306. https://doi.org/10.1016/j.jecp.2021.105306
- ten Braak, D., & Størksen, I. (2021). Psychometric properties of the Ani Banani Math test. European Journal of Developmental Psychology, 18(4), 610–628. https://doi.org/10.1080/17405629.2021.1879046
- ten Braak, D., Størksen, I., Idsoe, T., & McClelland, M. (2019). Bidirectionality in self-regulation and academic skills in play-based early childhood education. Journal of Applied Developmental Psychology, 65, 101064. https://doi.org/10.1016/j.appdev.2019.101064
- Tourón, J., & Freeman, J. (2018). Gifted education in Europe. In S. Pfeiffer, E. Shaunessy-Dedrick, & M. Foley-Nicpon (Eds.), APA handbook of giftedness and talent (pp. 55–70). American Psychological Association.
- Uniforum. (2016). Vil etablere talentsentre i realfag for de smarteste elevene [Establishment of talent centres in science for the smartest students]. https://www.uniforum.uio.no/nyheter/2016/02/vil-etablere-talentsenter-i-realfag-for-de-smartes.html
- Walsh, R., Hodge, K., Bowes, J., & Kemp, C. (2010). Same age, different page: Overcoming the barriers to catering for young gifted children in prior-to-school settings. International Journal of Early Childhood, 42(1), 43–58. https://doi.org/10.1007/s13158-010-0004-8
- Wechsler, D. (1991). WISC-III: Wechsler intelligence scale for children. Psychological Corporation.