
ABSTRACT
This paper pilots an approach for using trademark data to study regional diversification. Bridging the respective literatures, we develop a regional trademarking-intensity measure that can shed new light on how different regions diversify while also accounting for changing industrial structures and income levels (regional gross domestic product). The approach reveals that density has a moderate effect on trademarking intensity and confirms the strong relationship between new firm formation and regional diversification. These effects are found to vary by sector and to be sensitive to industry-level employment and turnover. Lastly, the analysis indicates that regional diversification differs sharply between urban and peripheral regions.
INTRODUCTION
An important question within the broader context of evolutionary economic geography (EEG) is how regions diversify over time. The regional diversification literature has so far depended on a limited number of data sources. These primarily include firm-level administrative data, which are not widely available, and, increasingly, patent data, which are known to be affected by patent propensity and other measurement issues. These empirical lenses have strengths as well as weaknesses that are shaping and, perhaps, limiting the development of this strand of work. In this light, we start from the question: Could ‘one of the great things you can do with trademark data’ (Castaldi, Citation2020) be to shed new light on how regions diversify over time? The answer we arrive at is ‘yes’. An important precondition is that certain challenges are acknowledged and met.
This paper thus joins the formative work, not least in relation to Drivas (Citation2020) as well as Sáiz and Zofío (Citation2021) in this special issue, to demonstrate how trademark data might be adapted and used at the regional level. Our first aim is to help strengthen the bridge between the innovation studies literature that studies trademark filing behaviour, on the one hand, and the economic geography literature that emphasizes regional diversification, on the other. We take stock of the lessons from the growing body of work that is coming to grips with how, when, where and to what extent trademarks may act as a ‘proxy for innovation and product differentiation’ (see the review in Schautschick & Greenhalgh, Citation2016, pp. 364ff.). This literature largely confirms the potential of trademark-based metrics to complement more widely used measures, particularly patenting, including where patent propensity is known to be weak such as among small firms and/or in the service sector (e.g., Flikkema et al., Citation2019; Mendonça et al., Citation2004).
This literature also points out important challenges associated with using trademark data to measure innovation and diversification processes, particularly those related to disentangling the close but ambiguous relationship between headline growth in trademarking and gross domestic product (GDP) (e.g., Degrazia et al., Citation2019; Webster & Jensen, Citation2004). The lessons from this step help us to adapt the lens of trademark data to better understand important dimensions of regional diversification processes. In relation to the regional diversification literature, our second main aim is to adapt an approach that closely follows the research agenda laid out by Boschma (Citation2017). The paper takes pains to distinguish the effects that productivity and industry structure play, as well as those that may be associated with firm formation and spatial scale.
On this basis, the paper pilots an approach for using trademark filings to study regional diversification. Empirically, we focus on different regional economies at different levels of centrality in a single country: Norway. The Norwegian case is analysed in three steps using a unique combination of datasets. First, we group the firm-level trademark filing behaviour in terms of the specific regional and sectoral context in which the trademark applicant – the enterprise – is situated. Second, a regionalized measure of industry-level GDP is used to distinguish trademarking that simply tracks the rise of demand due to greater spending power (‘demand effect’) from trademarking that can be said to reflect rising rates of innovation and diversification in the form of new firms, products and services (a ‘productivity effect’). Third, we model the effect of important factors on trademarking intensity at the level of observation (sector or industry) per unit of GDP for that level. Trademarking intensity is calculated on the number of trademarks per unit of GDP at the level of industry and region for a given year. This allows us to evaluate the different components of the ‘productivity effect’ that extends beyond the initially strong correlation between GDP and trademark activity.
Our approach confirms stark overall differences between regional economies at different levels of centrality. Moreover, we find that changes in the existing stock of firms, including new firm formation, affect the intensity of trademarking in given sectors, suggesting that this effect differs regionally. Our findings contribute to earlier work at the international level about the relationship between trademark growth and GDP, foreign and domestic trademarking, as well as to the EEG literature by demonstrating how region-specific levels of new firm formation and employment growth in different sectors are reflected in trademarking intensity relative to the baseline levels defined according to centrality. Based on this, we conclude that trademarking can help to advance the research agenda about regional diversification.
RESEARCH AGENDA
Boschma (Citation2017) calls for ‘insights from a whole range of strands in the scientific literature’ to be combined to study industrial dynamics and change in regions. In response, we bridge the EEG literature on regional diversification with the innovation studies literature related to trademarking. The two literatures address a similar phenomenon, namely diversification processes in economic activity, and they both adopt an evolutionary (‘Schumpeterian’) perspective. The two bridgeheads of our conceptual framework will be brought together to focus on four hypotheses or conjectures from the regional diversification literature.
This section combines a brief review of the two literatures that focus on four components. The following subsections introduce these in terms of the effects that each is posited in the literature to have on regional diversification. On this basis, the paper builds an approach for using trademark filings to study regional diversification and pilot to focus on these four dimensions. In doing so, we take special care to account for certain characteristics of the trademarking lens. The first component of our theoretical framework illustrates the importance of this aspect, and we derive lessons from each to design our empirical approach in the third section.
The effect of relative economic levels on regional diversification (‘productivity effect’)
First, we introduce a ‘productivity effect’, which is the conjecture that relative economic levels (higher versus lower income) shape the nature of regional diversification. Boschma (Citation2017, p. 356) points out that ‘the economic level of countries influences the nature of diversification’ and asks what implications this might have for research. A key assumption is that the productivity (higher versus lower income) of a geographical economy (region, country) will shape its efforts to innovate and diversify. The relationship between the ‘level’ of the economy and the ‘nature of diversification’ is important both to the trademarking and to the regional diversification literature. We use it as a first way to ‘combine insights’ between the two literatures, while also addressing a key challenge of using trademarking as a lens on regional diversification.
Petralia et al. (Citation2017) reveals important differences in how higher and lower income countries diversify. A key finding is that higher income countries tend to develop towards more complex and valuable technologies by building on technological capabilities and relatedness, while those of lower income countries tend to remain in the same technologies where they are constrained by pre-existing, indigenous capabilities at early stages of development. The study shows that countries that are further along in the development process can make bigger jumps that are less dependent on current industrial capabilities and knowledge bases.
The historical trend of trademarking suggests a similar pattern. The rate of trademarking activity has outpaced GDP in many, but not all, countries through much of the past four decades (World Intellectual Property Organization (WIPO), Citation2013, p. Citation139). This is remarkable. The elevated intensity of trademark filing behaviour is found in higher income countries but not in lower income countries where trademark intensity lags GDP. The growing empirical trademark literature points to a close yet ambiguous relationship between the rate of trademarking and GDP growth at the national level (Degrazia et al., Citation2019; Mangani, Citation2007a; Webster & Jensen, Citation2004). This introduces an important distinction: whether growth of trademarking primarily reflects the growing demand for high-quality products and services by consumers with greater spending power (‘demand effect’) or if it primarily reflects the growing variety of products and producers (‘growth effect’ or what we call the ‘productivity effect’).
This strand of the trademark research indicates that the ‘demand effect’ is the dominant force behind rising trademarking. Webster and Jensen (Citation2004), who introduced this crucial distinction, find evidence that per capita GDP drives trademarking through a ‘demand effect’ in Australia. A subsequent study (Mangàni, Citation2007b) shows that increasing industry-level GDP leads to rising horizontal product variation rather than to the creation of new products, indicating that the demand effect is stronger than the growth effect.Footnote1 More recently, however, Degrazia et al. (Citation2019) makes the convincing case in the United States that trademark filing does in fact act an apt indicator of innovation and business cycles at the national level.
Lesson for our approach
The close relationship between the level of the economy and the nature of diversification has important implications for how to adapt the trademarking lens to study regional innovation and industrial change. In response, we use trademark intensity (i.e., the rate of trademarks per GDP unit) as a baseline to help discriminate the ‘growth effect’ that reflects diversification and innovative activities in the economy from the more general ‘demand effect’ associated with economic levels. What is called for is a sort of productivity measure that counts, for a given year, the number of trademarks filed per 1 million of NOK GDP in a given region (e.g., Rogaland) for a given sector (e.g., services). We will therefore use regionalized industry-level GDP data (gross county product – GCP). Since GCP for a sector will vary from one year to the next, the response variable (trademark ‘intensity’) will be designed to capture the change in trademarking per unit GCP from one year to the next for the sector and for the region. This is important given the lesson from the literature that trademarking is sensitive to GDP. By doing so, we can zoom in on how trademarking reflects the growing innovation ‘intensity’ of the economy’s production system in the form of new firms, products and services.
The effect of existing regional structures on the process of regional diversification (‘industry structure effect’).
Second, we turn attention to the more traditional question of an ‘industry structure effect’ in the form of the hypothesis that existing regional structures affect the process of regional diversification. Following Boschma (Citation2017, p. 356), we investigate how trademarking can help study ‘the intensity and type of diversification in many regions simultaneously in a systematic way’ across time. A fundamental observation is that because regional diversification tends to develop in line with economic activities already in the region, the initial distribution of firms and industries is an important starting point for the subsequent development paths of a region. The product differentiation of firms in those regions are integral to regional differentiation. Our leading conjecture is that firm-level trademark filing behaviour reflects basic dimensions of regional diversification given caveats about the lens.
Boschma and Frenken (Citation2011) distinguish between two strands of the literature that have been integral to understanding how regions diversify and evolve: one that focuses on the path-dependent evolution of clusters through firm entry and exit, and the other that focuses on how agglomeration externalities affect firm performance and regional diversification. In line with the latter, Boschma (Citation2017) focuses attention on how relatedness – in different senses, using different data sources – drives regional diversification along different development paths. The diversification that trademarking represents will here be linked to this dimension. The related issue about spinoff firms and new firm formation introduced by the clustering literature (Boschma, Citation2015; Klepper, Citation2010) will be treated on its own below.
A general premise in this strand of research is that the distribution of economic activities in today’s regional economy has a strong tendency to ‘relate’ to the local capabilities and (industries) activities of yesterday. Because the ‘process of regional diversification is conditioned by existing regional structures’ (Neffke et al., Citation2011a, p. 4), the way and degree to which firms and industries evolve follow different paths at the regional level. A primary determinant of technological diversification is simply the number of firms in a region in an industry at a given time (Cohen & Malerba, Citation2001). Pre-existing firms (industries) in a region will tend to develop from initial distributions by renewing along paths of more activities in similar technologies (industries) or by creating new paths into new economic activities (industries).
Various approaches have been used to study relatedness and its effect on regional diversification at different levels. Approaches have used patents, products and, particularly in the Nordic countries, register data on education and industrial activity. Neffke and Henning (Citation2013) use firm-linked employment data to demonstrate that industry relatedness drives regions to diversify over time into new growth paths. Related industrial variety is a regional driver of firm-level productivity and innovation, not least in Norway (Aarstad et al., Citation2016). This leads to a gradual renewal of the paths of existing activities in a given regional economy. This may take place differently in urban regions (Frenken et al., Citation2007; Kogler et al., Citation2013) as opposed to peripheries (Grillitsch & Nilsson, Citation2017). This question of centrality will be returned to below.
Trademarking can be used as a lens through which to study how a region diversifies over time. The premise is that trademarks reflect product (service)-level diversification (Castaldi, Citation2020). Firm-level trademarking behaviour is linked (Greenhalgh & Rogers, Citation2012; Iversen, Citation2008) to the diversification processes that result, for instance, from ‘technological competition’ (Schumpeter, Citation1934). By shielding the product and the firm against direct competition, trademarking encourages investment in innovation. As a result, ‘Firm-level trademark filing behavior [serves] to capture innovative activity and future of demand expectations for a relatively large and diverse number of actors’ (Degrazia et al., Citation2019, p. 4). The literature indicates that firms are motivated to trademark for a number of reasons, including to incentivize investment related to the launch of products and to differentiate products (Castaldi et al., Citation2020). Seip et al. (Citation2018) confirm that major trademarking motives include securing market positions, appropriating rents and attracting investments.
In this way, firm-level trademarking behaviour appears closely associated with diversification at the regional level. It provides a comprehensive measure of the ‘competitive landscape’ (Zolas et al., Citation2017) across different sectors. Use of trademarks to trace product differentiation is in line with the product space approach (Hidalgo et al., Citation2007) that considers the relatedness of ‘products’ in the trade flows from countries (see also Capasso et al., Citation2019). Since trademarks and product-level trade flows are related, branching into new (or strengthening existing) trademarking activity provides a lens onto the regional comparative advantage (Drivas, Citation2020).
The trademarking lens has notable characteristics. A comprehensive study of trademarking firms (Flikkema et al., Citation2019) finds that firms’ motives vary in quite individual ways, not least in how patents are used. This observed heterogeneity in motivation aligns with the observation that firm-level trademarking responds to the firm’s perception of changing business cycles (Degrazia et al., Citation2019). Trademarking motives are also recognized to vary over different points in the product life cycle, different sectors and among different types of firms (Castaldi et al., Citation2020; Malmberg, Citation2005; Seip et al., Citation2018).
Lesson for our approach
This review suggests some lessons for how trademarking might best be used to analyse regional diversification across time. It shows the need to benchmark trademarking behaviour by studying the (demographic) effect on domestic trademark filing behaviour of an increase in the existing stock of firms in the region and the industry. Our empirical approach will differentiate service from manufacturing firms and small from large firms, while also taking into account other aspects of firm demography in the regions.
The effect of local opportunities on regional diversification (‘firm-formation effect’)
In addition to the agglomeration phenomena, the EEG literature also studies the path-dependent nature of clustering in regional economies (e.g., Neffke et al., Citation2011a). Our third step investigates a ‘firm-formation effect’ on which the adjacent work on clustering has particularly focused. An important aspect is the ability of regions to spawn new firms and, indeed, new industries (e.g., Boschma, Citation2015; Klepper, Citation2010). Clustering through regional entry and exit patterns depends on the number and activity of incumbent firms (Boschma & Frenken, Citation2011). Whether based on spin-offs of existing firms or the relocation of other firms, entries involve a reinforcing snowball process, ‘since spinoffs tend to locate in the same region as the parent firm, a cluster emerges once a single firm or a few successful firms start to create many successful spinoffs’ (Boschma & Frenken, Citation2011, p. 297). Thus, the ability of a region to foster new firms attests to fertile local conditions such as localized knowledge dynamics, access to productive labour, access to knowledge and institutional frameworks that are largely unobserved (Boschma, Citation2017; Rodriguez-Pose, Citation2013). An increase in the number of new firms in a sector of a region from one year to the next can therefore indicate that the unobserved conditions for diversification and innovation in that sector of the region are improving. We should expect the local diversification of products and services to reflect that fact.
Lesson for our approach
If the increasing prevalence of new firms in a region is an indicator of increasingly fertility of local conditions, we are interested in how this fertility is manifested in an observed form, namely in the form of heightened trademarking activity. Our analysis therefore includes the ‘new firm formation’ in a region (and industry) as an indicator of local conditions and, thus, as a predictor of the region’s output of differentiation and innovative activities. We expect trademarking to respond in a given region to the improving conditions for diversification and innovation that the increasing prevalence of new firms indicates in the corresponding sector of the region. We should make clear that we do not expect the new firms that might emerge in a given year to affect the region’s trademarking intensity themselves: any contribution above that captured by changes in the demographic data (number of firms) will be negligible. Instead, what we try to measure are the underlying local conditions that new firm formation is hypothesized to reflect.
The effect of centrality on regional diversification (‘centrality effect’)
Regional differentiation is recognized to play out differently in different types of regions because of different spatial conditions. The fourth step investigates the scope of using trademark data to study this important spatial scales effect (Boschma, Citation2017). A defining characteristic of large urban agglomerations is the diversity and density of economic activities. This creates unique opportunities for recombinant innovation in a context where additional support may be provided from large, demanding and potentially highly competitive markets with space for multiple niches to be created (Glaeser et al., Citation1992). Moreover, cities contain leading research institutions, governmental agencies and corporate headquarters, and tend to function as nodes in innovation networks that link different sectors and locations. This and vibrant labour markets is generally said to give enhanced access to knowledge spillovers (Fitjar & Rodríguez-Pose, Citation2020). Cities are also primary sites for knowledge-intensive services (Herstad et al., Citation2019). Market niches combined with variety of resources and connectivity through networks might give rise to firm-level heterogeneity (Eriksson & Lengyel, Citation2019). More specifically, it might stimulate new firm formation and growth, and diverse resources in cities might be particularly important for services firms and in the early life cycle stages of firms and industries more generally (Duranton & Puga, Citation2001; Neffke et al., Citation2011b). This is reflected in the notion of urban innovation by means of ‘fast decay information’ (Shearmur, Citation2015). Even so, the relationship between urbanization and innovation is disputed (Fitjar & Rodríguez-Pose, Citation2020; Herstad, Citation2018), with recent research using patent data questioning whether productivity is at all related to advantages in cities (Fritsch & Wyrwich, Citation2021).
Internationalization is one aspect of the competitive landscape that peripheral firms are expected to react differently to than their counterparts in more urban settings. Extra-regional actors may indeed be potential collaborators with which a firm in a more peripheral region may recruit missing capabilities (Grillitsch & Nilsson, Citation2015); but they are as likely to be potential competitors against which the local firm much differentiate itself against in the eyes of the consumer. Therefore, we expect that firms in more peripheral (versus urban) regions will react to potential competitors from abroad differently. Finally, while the process of urbanization itself increases the size of local markets and urban wealth concentration increases purchasing power, local entrepreneurship and imitation facilitated by spillovers combined with the tendency of such regions to attract inward foreign investments may increase competition on local markets. Together, these factors tend to suggest more intense trademarking activity by urban firms. Firms in peripheral regions, by contrast, might draw on non-local network linkages (Grillitsch & Nilsson, Citation2015) and build stronger internal capabilities to compensate for less external market and resources support (Eder, Citation2019; Herstad, Citation2018). More cumulative learning and a slower pace of innovation (Shearmur & Doloreux, Citation2016) are growth effects that might dampen innovation that, in turn, might add to demand effects stemming from smaller and more specialized regional markets with less purchasing power.
Lessons for our approach
The proposition that regional diversification plays out differently in diffferent types of regions is clear in the EEG literature. Trademarking data can help address a final question that is whether urban regions are more capable of diversifying as compared with peripheral regions. Compared with patent data, the trademarking lens is well equipped to capture how the evolutionary process of regional diversification unfolds along different types of paths in different types of places, as it shifts focus from technological inventions towards what firms market also in industries that rarely patent. Trademark data can illuminate the relative strengths of regions to diversify as other factors that we have already introduced are controlled for (demand, industry structure and new firm formation effects). By extension, trademarking can be used to measure firms’ reactions specifically to international competitive pressures (D’Agostino & Schiavo, Citation2019). An important characteristic of trademarking is that foreign registration of trademarks grew rapidly from the mid-1980s (Baroncelli et al., Citation2004). Trademarking (brands) of global origination has different dynamics than that of more local origin, as discussed in the qualitative literature (e.g., Pike, Citation2015), and can be expected to lead to an interaction between branding at the two levels. Increased foreign trademarking reflects changes in the international markets in given industries, not least the important service sector. Our approach will therefore measure the reaction at the local level to foreign trademarking in the same industries to capture this signal.
EMPIRICAL APPROACH
The Norwegian case is an apt one in which to analyse what explains firm-level trademark filing behaviour in different regional economies. There are strong regional differences in the country; these have also changed dramatically over the past 45 years. The early 1970s marks an important inflection point as it coincided with the establishment of the petroleum industry. This had extensive implications both for headline growth but also for regional and industrial balance in the economy. The growth of the technologically sophisticated offshore oil industry from the beginning of the 1970s in what was a more regional and rural area (Rogaland), fundamentally changed the industrial landscape in terms of GDP, industrial composition and employment (e.g., Narula, Citation2002; Sæther et al., Citation2011). Manufacturing industries have also declined in general but not across the board; tourism is another industry that has changed substantially during the past 45 years: the effects of these changes have had different effects in different contexts. The underlying demand effect appears to be stronger in certain (geographic and industrial) contexts than in others, meaning that growth effects also are likely to be highly differentiated. Three basic aspects about the Norwegian case are introduced before our formal analysis.
First, annual trademark registrations have grown strongly during the past 40–50 years, increasing from 1800 in 1979 to 13,000 in 2017. This growth outpaced GDP growth in the commercial sector (which averaged 2.01% per annum) at an unadjusted 1.9% per year for the entire economy. Second, more than twice the number of foreign entities relative to Norwegian entities applied for more than three times as many trademarks as their Norwegian counterparts did during the 45-year ending in 2017. Yet, the share of domestic applications expanded more quickly, from 10% to nearly 26% in the 1979–2017 period, and we see that the Norwegian share edged above foreign trademarks for a sustainable period after the financial crisis in 2008–09. Finally, there is a clear regional profile. The capital region (Metropolitan Oslo) accounts for an average of 47% of domestic registrations for 1998–2017. Registrations from outside the capital has grown as a share of total domestic registrations, not least among more peripheral areas. Roughly a quarter are registered by entities in Norway’s ‘second cities’ (Trondheim, Bergen, Stavanger, etc.), while the remaining share (28%) accrues to less central towns and peripheral regions. Of course, this might simply reflect differences in the sizes and income levels of regional economies (demand effect), as trademarking is strongly correlated with (regionalized) GDP. Accordingly, we need to disentangle regional growth effects from underlying demand effects.
Data
Our analysis builds on three main datasets from the following sources:
Trademark data: the Norwegian Industrial Property Office (NIPO) publishes comprehensive data of the trademark filed with and/or registered by it. Information was compiled primarily about who the applicant was, where the applicant was domiciled, when the application was filed (abandoned, registered, etc.) and what the trademark covered (Nice class information). These time-series data (from 1906) were supplied directly by the NIPO.
Enterprise and employment data: official firm-level micro-data for enterprises in Norway are curated by Statistics Norway (Virksomhets- og foretaksregisteret). These canonical datasets, which include employment, industrial classification, firm addresses and more, were accessed from 2000 to 2016 based on the NIFU – Nordic Institute for Studies in Innovation, Research and Education use agreement (18/0136).Footnote2 Complementary data on newly established and newly registered firms were downloaded directly from the underlying Enterprise Register (Foretaksregisteret) at the Brønnøysund Register Centre (BRC).
GDP data: Statistics Norway’s official National Accounts data include data covering the gross value of goods and services produced (from 1970) at the level of industry and (from 2008) at the level of the county as well as industry. It is measured in millions of NOK in current prices for the 2008–18 period. These time-series data were downloaded from Statistics Norway.
The trademark data are fractionally counted when allocated according to region (county and centrality) and to industry. The population of domestic trademark filings for the period 1970–78 consists of more than 100,000 individual applications involving at least one Norwegian applicant (fractional count 90.644). In our analysis, we focus particularly on the most recent decade of filings. Our focal data (2008–18) consists of 38,500 ‘Norwegian’ trademark filings. The number of filings/registrations from abroad was much (three times) larger. Excluding those that were withdrawn, foreigners filed (registered) 115,000 trademarks in Norway during the period.
METHODOLOGY
These datasets are combined and organized into a time-series cross-sectional data set (TSCS). In terms of the time-series component, we observe trademark filings from 1970 to 2018, but focus on the most recent 10-year period (2008–17). To describe different regional economies, we grouped (‘clustered’) the firm-level trademark filing behaviour in terms of the regional and the industrial setting in which the trademark applicant – the enterprise – is situated. The region, accordingly, has a geographical and an industrial dimension. In order to cluster the data at the regional level, three important steps are taken.
The enterprise is first situated geographically. The applicant address (postal code) is used to locate the enterprise’s business activity in one of the country’s 426 municipalities (at the time of the study).Footnote3 Next, we used the ‘new centrality index for municipalities’ that Statistics Norway recently introduced (2017)Footnote4 to distinguish regions of the Norwegian economy that are more or less ‘central’. This index is more differentiated than previous versions and is based on a number of new criteria, including the commute times (zones), the density of service functions, as well as population density. Using it, Norwegian municipalities are categorized into one of four ‘centrality regions’: (1) the metropolitan Oslo area, (2) regions surrounding the second cities, (3) the areas around rural towns and (4) the more peripheral areas. These regionalized municipalities are then nested in the 20 regional (NUTS-3) counties. This allows us to capture the ‘centrality effect’ in a meaningful way.
Second, the enterprise is localized within the industrial landscape. We use information about what market the trademark targets rather than the applicant’s existing industrial classification. An acknowledged challenge is that while trademarks are classified into 45 Nice classes that are broadly divisible into ‘service marks’ and ‘product marks’, these classifications are not directly useful for allotting marks to individual markets or industries. In order to link trademark data to the industrial classification we follow earlier research and employ the Zolas et al. (Citation2017). Concordance between trademark classes (Nice) and industrial sector (NACE rev2). The correspondence is used to allocate trademarks into eight main industries that in turn are collapsed into three aggregations: (1) manufacturing and production (primary industries and manufacture), (2) private sector services and (3) other economic activities (including construction, utilities and public sector services). Trademark filing behaviour is thus measured at the same level of industry as the enterprise and employment, and the GDP datasets. This provides an apt lens on the industry structure effect.
A last crucial challenge is how to isolate the growth effect from the underlying demand effect. GDP is a national measure of the gross value of the output of products and services that correlates strongly with trademarking. It is necessary to adjust for this at the regional and industrial level if we are to isolate the effects of the factors more closely linked to diversification and innovation in the economy. For this purpose, we use Statistics Norway’s regionalized industry-level data (GCP) as introduced above.
The combined dataset is then arranged hierarchically in a Russian doll fashion: data are organized at the level of industry, which is nested in centrality regions, which in turn is nested in counties. This is done while adjusting for GCP at the level of counties and industries. This gives our TSCS dataset a multilevel or hierarchical structure that affects the appropriate mode of analysis. By organizing data in this form, we are assuming that the entities within the cluster (the regional economy) are more similar than they are with entities outside in terms of the variables of interest. We will see that this is confirmed. We will also note other advantages when we present the model.
Arranging the data at the level of regions allows us to analyse the effect on regional rates of trademark filings of our variables of interest in light of the four effects of interest. It links like with like: firm-level trademark filing behaviour in the manufacturing industry, say, in rural areas of given county in a given year is linked in the same region, with variables expected to affect it, namely: (1) the number of newly established firms, (2) the total number of existing firms and total employment, and other features, such as (3) turnover. The calculations of these effects are adjusted for gross product (GDP) in that county, that industry, and that year.
Variables
The dependent variable is the number of trademarks per unit of GDP at the level of industry and region (also known as GCP) for a given year. This measure of trademark ‘intensity’ (or productivity) captures the change in trademarking per million kroner of production (i.e., gross product) from one year to the next for the sector and for the region. This allows us to account for the potentially misleading (confounding) ‘demand effect’ and to better focus on the ‘productivity effect’, whereby trademarking can be said to reflect growing variety of products and producers.
The industry structure effect is operationalized as (1) the number of firms by sector, (2) employment by sector and (3) turnover by sector. Measuring these by region and across time, we estimate how changing firm demographics affect the intensity of trademarking behaviour in each region. For information on the aggregation of industries and sectors, see Appendix A in the supplemental data online.
New firm formation was hypothesized to constitute a ‘prime vehicle’ for regional development. The variable ‘New firms’ tallies the number (ln) of new registered enterprises by sector and region.
The centrality effect: municipalities are categorized into four levels based on the centrality measure described above: the metropolitan Oslo region, which is the core commercial and financial region; the substantially smaller second tier city-regions which are Stavanger, Bergen and Trondheim; rural towns such as Mandal, and, finally, more peripheral areas, including remote Spitzbergen.
International competitive pressure: we include the count of foreign trademark filings (by year and by industry) to capture the response of regional firms to foreign trademarking. As discussed, firms in the periphery are expected to respond differently to this proxy of the internationalization of markets than more urban regions. defines the variables and indicates the level of measurement.
Table 1. Variable definitions.
Estimation strategy
The data are arranged as cross-sections at the level of regional economies as defined above. The geographical level consists of two levels: the NUTS-3 level of the county and, nested within these, the four centrality regions introduced above. Eight industrial categories are in turn nested in this regional grouping. This yields 400 different locations. An example is private sector services in mid-sized towns in Rogaland. The focal data span the period 2008–17.
How many trademarks are filed in a given region, industry and year in terms of the total ‘gross-value of the production of goods and services’ (or GDP) there? We model how much the variables introduced above explain the observed intensity of trademark filings at the regional level in these terms. In doing so, we want to test whether/how these effects differ in different regions. We assume a clustering effect, that is, that firms localized within a region or ‘group’ will be more similar to each other than between them. A test confirms this hypothesis. The geographical pattern of trademarking observed in the NUTS-3 regions is not adequately reflected if we assume that all regional economies have the same dynamics (i.e., the same intercepts and slopes characterize the different regional and industrial groups as expected by a fixed-effects model).
We fit a multilevel mixed-effects negative binomial model (using menbreg in Stata 16) which is appropriate to our TSCS data. The negative binomial model is used due to the count nature of our response variable that is over-dispersed relative to the Poisson distribution. The multilevel dimension of our modelling accounts for nesting in a hierarchical set-up: industry inside centrality inside counties. The model’s structural form is log-linear where we model the rate of trademark filings per unit (mNOK) of regionalized GCP. This means that the rate of trademark filings is effectively adjusted for the gross value of products and services produced in the various regional (industrial) contexts. Appendix B in the supplemental data online provides further detail about the model.
The model includes population-level fixed effects for sector, year, county, the number enterprises, employment and turnover and, importantly for our hierarchical TSCS data, random effects for our subgroups, that is, intercepts that can vary across regional ecosystems. This allows for different rates of trademarking in different parts of the country. This helps account for heterogeneity in the data at the level of regions not explained by the model’s fixed effects. This mixture of fixed and random effects also reduces the problem of spatially and temporally correlated errors (Hamilton, Citation2008).
We fit three versions of the model. The first model adjusts for regional GDP at the county and industry level. We then model the rate of domestic trademarks (per regional GDP) per year for the ith industry in the kth centrality in the cth county as a function of: (1) growth effect: newly established firms (at the level of i, k and c) and (2) demand effect: foreign trademarks (industry i). The second builds on the first. We aggregate industries into three sectors and then calculate the effect of two predictors at the level of sector. We model the rate of trademark filing per unit of GCP as a function of the main predictor variables, namely the new firm formation and the extent of enterprises in the sectorized regional ecosystems. The final model adds sectorized effects of employment and average turnover to the second equation.
RESULTS
provides an overview of the year-on-year growth in domestic trademark filings, the number of firms, the number of new establishments, the mean values of turnover, and the mean value of gross production of goods and services. We note that all variables increase accept median turnover.
Table 2. Overview of the variables.
So how do the different effects associated above with regional diversification play out in terms of how many trademarks are filed in a given region, industry and year in terms of the corresponding regional GDP? presents the results from three models. It reports regression coefficients, while full results are available from the author upon request. Model 1 demonstrates that new firm formation and foreign trademarking are strong predictors of the intensity of trademark filings in regions after adjusting for GDP and controlling for the main (fixed) effects of industry, county, year and region. Furthermore, model 1 also establishes that the intensity of trademarking differs by centrality. As expected, urban areas – and particularly the capital region (Oslo) which is the reference – have substantially higher trademarking intensities than more peripheral areas.
Table 3. Multilevel mixed-effects negative binomial regressions, models 1–3.
The first adaption in model 2 is to calculate the effect of changes in firm demographics for the three sectors (manufacturing and production, services, and other) on the intensity of trademarking. Model 2 also recalculates the strong new firm formation effect in model 1 at the level of these sectors to find out if the effect on trademark intensity differs if new firms emerge in one sector rather than another. Model 3 goes on to estimate two additional aspects of the industry-relatedness effect – employment and turnover – at the sectoral level. The model calculates the effect on the intensity of trademarking of increasing employment (turnover) in a given sector above the effects already introduced (firm stock, new firm formation).
The results show how regional trademarking intensity responds to new firm formation, industry and centrality effects once we account for the potentially confounding ‘productivity effect’ of GDP growth.
New firm formation effect: Model 1 establishes that domestic trademarking responds strongly to increasing rates of new firm formation. The entry of new firms in a given region by 1% in a given year corresponds to a 0.16% increase in domestic trademark filings per unit of GDP, while holding all else in the model constant. There is thus a sizeable ‘productivity effect’ after adjusting for regional GDP at this level. It is strong across sectors, but strongest in the services sector. The second and third models show that the effect of additional new firms on domestic trademark filings is positive and significant, yet different across the three sectors. The effect of firm entry seems strongest in the service sector, where a 1% increase in the number of new firms leads to a 0.32% increase in domestic trademark filings per unit of GDP, all else the same. The corresponding effect is considerably lower in the manufacturing sector (0.14%) and in the ‘other’ sector (0.12%).
Industry structure effects: As models 2 and 3 add more granularity about firm demographics at the level of the regional economy, a couple important results come into focus. Model 2 demonstrates that the number of enterprises is an important factor that takes over the explanatory power of foreign trademarking. Growth in the number of firms in a region corresponded with an increase in trademark filings. A 1% increase in the number of enterprises in the private service sector in a given region predicts a 0.1% increase in domestic trademark filings per unit of GDP. The effect is higher – about 0.16% – in the other sectors of the region. However, the number of firms in the sector alone appeared not to be most important dimension. Increased total employment and turnover in the given region strengthened the effect of all sector level factors in the manufacturing sector. Model 3 adds the effects of increased employment and increased turnover at the sectoral level in the region. The inclusion of additional measures at the level of the sector demonstrates that aspects of the firms in the regions explain different levels of trademarking at the different levels of centrality. The case is clearest in the broad manufacturing sector. Increases in employment has a negative effect on the rate of trademark filings (significant at the 5% level), while increases in mean turnover at the regional level is positive.
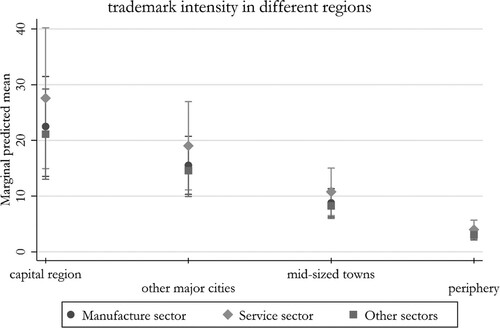
Centrality effects: Firms in more peripheral areas are significantly less involved in diversification efforts in the form of trademarking than those in more urban areas. The differences are stable as the models control for details of the existing regional structures in terms of the number of firms, the number of new firms, the number of employees and turnover. , which is based on the full model (3), provides a more intuitive representation based on the annual margin plots for the regional levels, comparing the more peripheral areas with the Oslo metropolitan area. It indicates that firms in other urban regions file an equivalent of around 70% (not significant), those in mid-sized towns 38%, and those in peripheral regions 13.4% of the rate of firms in the Oslo region. The annual rate (marginal predicted mean) of trademark filing is highest in the service sector (17.8), followed by the manufacturing sector (11.7), and the residual sector that includes public services (10.7).
Figure 1. Annual average predicted means by centrality and sector.
For the whole population, model 1 indicates that the overall rate of domestic trademark filing per unit of regional GDP would increase by 0.49% if foreign trademarking in Norway increased by 1%. This suggests that more local brands are reacting to trademarks of ‘global origination’. However, the effects are reduced and become insignificant as we account for more characteristics of regional economies that affect domestic trademarking. Foreign trademarking is apparently picking up a confounding but unobserved effect (e.g., global competitive landscape of international markets; see above). This effect disappears when we start to account for firm population that affects the behaviour of trademarking firms. Foreign trademarking acts furthermore to account for unobserved fluctuations in the competition landscape at large and helps to account for autocorrelation in trademarking through the period, thus focusing attention more on our variables of interest.
CONCLUSIONS
Starting from the premise that the intensity of trademarking activity has the potential to proxy innovation and product differentiation in an economy, this paper adapted the lens of trademark data to study how regions diversify across time. The first-order aim was to show that the potential of trademark data could be better utilized to study this important research area if inherent challenges were addressed. Our empirical approach brought together complementary databases with a strategy to address these fundamental concerns. We showed that the use of the trademark lens to study regional diversification presupposes, first, that we are able to link the trademarking activity to the corresponding economic activity; and second, that we are able to disentangle the ‘productivity effect’ from the more run-of-mill ‘demand’ effect that can confound how we interpret trademarking behaviour.
Taking pains to address these challenges, the second order aim was to apply the trademark-data lens on how different regions of a country diversify over time. To demonstrate, the programmatic article of Boschma (Citation2017) was used to identify four aspects of regional economies that are thought to affect the intensity and type of regional diversification. The four effects on regional diversification involved the effect of relative economic levels on regional diversification (‘productivity effect’), that of existing regional structures on the process of regional diversification (‘industry structure effect’), that of local opportunities on regional diversification (‘firm-formation effect’), as well as the conjecture that regional diversification differs substantially between urban and more peripheral areas (‘centrality effect’).
A mixed-effect, multilevel model was used to model how these factors play out in single country context, Norway. We calculated how many trademarks are filed in a given region, industry and year in relation to the corresponding ‘gross value of the production of goods and services’ there. We found that trademarking intensity in a given region and industry responds to changes in the rate of new firm formations as well as to changes in industrial structure in the form of the number of firms, their employment and turnover. The approach indicated that centrality effects are substantial even after accounting for these factors: a firm in the capital region of Oslo tends to file trademarks at more than twice the rate of the equivalent firm in more rural mid-sized towns and at almost seven times that of firms in peripheral regions even after accounting for these effects.
A general conclusion of this exploratory exercise is that trademarking intensity does indeed reflect the close relationship between regional characteristics and diversification processes that is of main concern in EEG. A general strength in this context is that trademarking reflects novelty on the market not least among small firms and in the service sector; we noted that the commonly used empirical lampposts of patenting has acknowledged problems illuminating these important parts of the modern economy. In general, there are several areas where future research on regional diversification could benefit by using trademark data to complement more traditional data sources. Our results on centrality suggest one important example. These findings contrast with recent work (see above) that has questioned the role of cities in fostering innovation based on the community innovation survey or on patent data.
A second example is suggested by our findings that show that trademarking intensity responds to the emergence of new firms in the corresponding (industry and regional) context. This analysis supports the conjecture in the EEG (clustering) literature that entrant firms indicate regional opportunities for new economic activity and the presence of resources required to pursue them. Using the lens of trademark data, the general scale of new firm formation was found to positively and significantly affect diversification across sectors in the region. Isolating this effect from the general industry structure effect discussed in EEG, we found that this effect is most pronounced in the service sector. This is notable, given the important role service firms play in industrial diversification at the regional level and overall structural change favouring these industries.
There is considerable scope for future work to improve on our approach. In general, future empirical work using regionalized trademark data could engage more actively with policy-related issues. More specifically, one empirical improvement would be to link trademarks to information about the applicant firm as well to the subject matter of the trademark, which we did here using a crosswalk between Nice classes and corresponding industrial categories. Such an approach would provide a more direct relationship between pre-existing activities at the level of firms with subsequent diversification in the region. A second improvement would be to combine firm-linked patent and trademark data. Together, these two steps would open new analytical possibilities. It would bring forward the potential complementarity between patent and trademark data while allowing for a range of improvements including the use of more targeted panel-data techniques.
An advantage for future work is that raw trademark data are becoming more widely available. There are also promising efforts to provide enriched and linked trademark data to the scientific community. The ISI-Trademark Data Collection (ISI-TM) dataset of international trademark data (European Union Intellectual Property Office – EUIPO; and United States Patent and Trademark Office – USPTO), being developed under the European Union Research Infrastructure for Research and Innovation Policy Studies (RISIS) project (see acknowledgements), is an example. To avoid duplication of effort and promote wider usage, it will enrich international trademark data (e.g., with geolocation) and link these with applicant firm information.
Such developments will hopefully help spur new applications of trademark data to study regional diversification. In moving ahead, applications that focus on international trademark data should consider the complementary advantages associated with domestic data. There can be a trade-off between the coverage and the comparability of these two types of trademark data that should be recognized. The approach presented here can be useful to study specific policy-relevant dimensions of regional diversification in a cross-country scenario. By recognizing the strengths and weaknesses of trademark data in general, and that of domestic and international data more specifically, future studies can be designed to improve our knowledge of how regions differentiate. There are, indeed, many great things one can do with trademark data.
Supplemental Material
Download PDF (134 KB)ACKNOWLEDGEMENTS
The authors thank the Norwegian Industrial Property Office for access to the micro-data upon which this paper is built.
DISCLOSURE STATEMENT
No potential conflict of interest was reported by the authors.
Additional information
Funding
Notes
1. Mangani (Citation2007a) refers to the effect at the ‘extensive margin’. The idea is that the rising rate of trademarking reflects a growth in the overall extent of the production system. This is in line with the ‘demand effect’. The creation of new products and firms contributes at the ‘intensive margin’ since it relates to how intensively the production system functions. This is close to the idea of the ‘growth effect’.
2. Complementary data on official employment data at the county-level were downloaded from the National Accounts data, introduced above.
3. As of 2018, there were 20 continental counties containing a total of 426 municipalities in a country of just over 5 million people. The administrative units are currently being reorganized but not in ways that affect our analysis.
REFERENCES
- Aarstad, J., Kvitastein, O. A., & Jakobsen, S.-E. (2016). Related and unrelated variety as regional drivers of enterprise productivity and innovation: A multilevel study. Research Policy, 45(4), 844–856. https://doi.org/https://doi.org/10.1016/j.respol.2016.01.013
- Baroncelli, E., Fink, C., & Javorcik, B. S. (2004). The global distribution of trademarks: Some stylized facts (Policy Research Working Papers). doi:https://doi.org/10.1111/j.1467-9701.2005.00706.x
- Boschma, R. (2015). Do spinoff dynamics or agglomeration externalities drive industry clustering? A reappraisal of Steven Klepper’s work. Industrial and Corporate Change, 24(4), 859–873. https://doi.org/https://doi.org/10.1093/icc/dtv024
- Boschma, R. (2017). Relatedness as driver of regional diversification: A research agenda. Regional Studies, 51(3), 351–364. https://doi.org/https://doi.org/10.1080/00343404.2016.1254767
- Boschma, R., & Frenken, K. (2011). The emerging empirics of evolutionary economic geography. Journal of Economic Geography, 11(2), 295–307. https://doi.org/https://doi.org/10.1093/jeg/lbq053
- Capasso, M., Iversen, E. J., Klitkou, A., & Sandven, T. (2019). Which region to choose for an industrial policy? A research path to highlight restructuring opportunities. European Planning Studies, 27(8), 1461–1482. https://doi.org/https://doi.org/10.1080/09654313.2019.1588855
- Castaldi, C. (2020). All the great things you can do with trademark data: Taking stock and looking ahead. Strategic Organization, 18(3), 472–484. https://doi.org/https://doi.org/10.1177/1476127019847835
- Castaldi, C., Block, J., & Flikkema, M. J. (2020). Editorial: Why and when do firms trademark? Bridging perspectives from industrial organisation, innovation and entrepreneurship. Industry and Innovation, 27(1–2), 1–10. https://doi.org/https://doi.org/10.1080/13662716.2019.1685376
- Cohen, W. M., & Malerba, F. (2001). Is the tendency to variation a chief cause of progress? Industrial and Corporate Change, 10(3), 587–608. https://doi.org/https://doi.org/10.1093/icc/10.3.587
- D’Agostino, L. M., & Schiavo, S. (2019). Trademarks and firm competitiveness: An empirical analysis of the world top R&D spending companies. Danish Research Unit for Industrial Dynamics (DRUID).
- Degrazia, C. A. W., Myers, A., & Toole, A. A. (2019). Innovation activities and business cycles: Are trademarks a leading indicator? Industry and Innovation, 27(1–2), 184–203. https://doi.org/https://doi.org/10.1080/13662716.2019.1650252
- Drivas, K. (2020). The role of technology and relatedness in regional trademark activity. Regional Studies. https://doi.org/https://doi.org/10.1080/00343404.2020.1808883
- Duranton, G., & Puga, D. (2001). Nursery cities: Urban diversity, process innovation, and the life cycle of products. American Economic Review, 91(5), 1454–1477. https://doi.org/https://doi.org/10.1257/aer.91.5.1454
- Eder, J. (2019). Innovation in the periphery: A critical survey and research agenda. International Regional Science Review, 42(2), 119–146. https://doi.org/https://doi.org/10.1177/0160017618764279
- Eriksson, R. H., & Lengyel, B. (2019). Co-worker networks and agglomeration externalities. Economic Geography, 95(1), 65–89. https://doi.org/https://doi.org/10.1080/00130095.2018.1498741
- Fitjar, R. D., & Rodríguez-Pose, A. (2020). Where cities fail to triumph: The impact of urban location and local collaboration on innovation in Norway. Journal of Regional Science, 60(1), 5–32. https://doi.org/https://doi.org/10.1111/jors.12461
- Flikkema, M., Castaldi, C., De Man, A.-P., & Seip, M. (2019). Trademarks’ relatedness to product and service innovation: A branding strategy approach. Research Policy, 48(6), 1340–1353. https://doi.org/https://doi.org/10.1016/j.respol.2019.01.018
- Frenken, K., Oort, F. V., & Verburg, T. (2007). Related variety, unrelated variety and regional economic growth. Regional Studies, 41(5), 685–697. https://doi.org/https://doi.org/10.1080/00343400601120296
- Fritsch, M., & Wyrwich, M. (2021). Is innovation (increasingly) concentrated in large cities? An international comparison. Research Policy, 50(6), article 104237. https://doi.org/https://doi.org/10.1016/j.respol.2021.104237
- Glaeser, E., Kallal, H., Scheinkman, J., & Shleifer, A. (1992). Growth in cities. Journal of Political Economy, 100(6), 1126–1152. https://doi.org/https://doi.org/10.1086/261856
- Greenhalgh, C., & Rogers, M. (2012). Trade marks and performance in services and manufacturing firms: Evidence of Schumpeterian competition through innovation. Australian Economic Review, 45(1), 50–76. https://doi.org/https://doi.org/10.1111/j.1467-8462.2011.00665.x
- Grillitsch, M., & Nilsson, M. (2015). Innovation in peripheral regions: Do collaborations compensate for a lack of local knowledge spillovers? The Annals of Regional Science, 54(1), 299–321. https://doi.org/https://doi.org/10.1007/s00168-014-0655-8
- Grillitsch, M., & Nilsson, M. (2017). Firm performance in the periphery: On the relation between firm-internal knowledge and local knowledge spillovers. Regional Studies, 51(8), 1219–1231. https://doi.org/https://doi.org/10.1080/00343404.2016.1175554
- Hamilton, L. C. (2008). Statistics with STATA. Cengage Learning.
- Herstad, S. J. (2018). Innovation strategy choices in the urban economy. Urban Studies, 55(6), 1185–1202. https://doi.org/https://doi.org/10.1177/0042098017692941
- Herstad, S. J., Solheim, M. C., & Engen, M. (2019). Learning through urban labour pools: Collected worker experiences and innovation in services. Environment and Planning A: Economy and Space, 51(8), 1720–1740. https://doi.org/https://doi.org/10.1177/0308518X19865550
- Hidalgo, C. A., Klinger, B., Barabasi, A. L., & Hausmann, R. (2007). The product space conditions the development of nations. Science, 317(5837), 482–487. https://doi.org/https://doi.org/10.1126/science.1144581
- Iversen, E. J. (2008). IPRs and Norwegian enterprises: Diversification of innovative efforts in Norwegian firms. In E. G. Carayannis, A. Kaloudis & Å. Mariussen (Eds.), Diversity in the knowledge economy and society: Heterogeneity, innovation and entrepreneurship (pp. 191–216). Edward Elgar.
- Klepper, S. (2010). The origin and growth of industry clusters: The making of Silicon Valley and Detroit. Journal of Urban Economics, 67(1), 15–32. https://doi.org/https://doi.org/10.1016/j.jue.2009.09.004
- Kogler, D. F., Rigby, D. L., & Tucker, I. (2013). Mapping knowledge space and technological relatedness in US cities. European Planning Studies, 21(9), 1374–1391. https://doi.org/https://doi.org/10.1080/09654313.2012.755832
- Malmberg, C. (2005). Trademarks statistics as innovation indicator? –A micro study (Working Paper No. 17). Centre for Innovation, Research and Competence in the Learning Economy (CIRCLE), Lund University. https://ideas.repec.org/p/hhs/lucirc/2005_017.html
- Mangani, A. (2007a). Measuring variety and quality of products with trademarks. International Economic Journal, 21(4), 613–631. https://doi.org/https://doi.org/10.1080/10168730701699109
- Mangàni, A. (2007b). Technological variety and the size of economies. Technovation, 27(11), 650–660. https://doi.org/https://doi.org/10.1016/j.technovation.2007.04.005
- Mendonça, S., Pereira, T. S., & Godinho, M. M. (2004). Trademarks as an indicator of innovation and industrial change. Research Policy, 33(9), 1385–1404. https://doi.org/https://doi.org/10.1016/j.respol.2004.09.005
- Narula, R. (2002). Innovation systems and ‘inertia’ in R&D location: Norwegian firms and the role of systemic lock-in. Research Policy, 31(5), 795–816. https://doi.org/https://doi.org/10.1016/S0048-7333(01)00148-2
- Neffke, F., & Henning, M. (2013). Skill relatedness and firm diversification. Strategic Management Journal, 34(3), 297–316. https://doi.org/https://doi.org/10.1002/smj.2014
- Neffke, F., Henning, M., & Boschma, R. (2011a). How do regions diversity over time? Industry relatedness and the development of new growth paths in regions. Economic Geography, 87(3), 237–265. https://doi.org/https://doi.org/10.1111/j.1944-8287.2011.01121.x
- Neffke, F., Henning, M., Boschma, R., Lundquist, K.-J., & Olander, L.-O. (2011b). The dynamics of agglomeration externalities along the life cycle of industries. Regional Studies, 45(1), 49–65. https://doi.org/https://doi.org/10.1080/00343401003596307
- Petralia, S., Balland, P.-A., & Morrison, A. (2017). Climbing the ladder of technological development. Research Policy, 46(5), 956–969. https://doi.org/https://doi.org/10.1016/j.respol.2017.03.012
- Pike, A. (2015). Origination: The geographies of brands and branding. Wiley-Blackwell.
- Rodriguez-Pose, A. (2013). Do institutions matter for regional development? Regional Studies, 47(7), 1034–1047. https://doi.org/https://doi.org/10.1080/00343404.2012.748978
- Sæther, B., Isaksen, A., & Karlsen, A. (2011). Innovation by co-evolution in natural resource industries: The Norwegian experience. Geoforum; Journal of Physical, Human, and Regional Geosciences, 42(3), 373–381. https://doi.org/https://doi.org/10.1016/j.geoforum.2011.01.008
- Sáiz, P., & Zofío, J. L. (2021). The making and consolidation of the first national trademark system: The diffusion of trademarks across Spanish regions, 1850–1920. Regional Studies. https://doi.org/https://doi.org/10.1080/00343404.2021.1887472
- Schautschick, P., & Greenhalgh, C. (2016). Empirical studies of trade marks – The existing economic literature. Economics of Innovation and New Technology, 25(4), 358–390. https://doi.org/https://doi.org/10.1080/10438599.2015.1064598
- Schumpeter, J. (1934). The theory of economic development: An inquiry into profits, capital, credit, interest, and the business cycle. Harvard University Press.
- Seip, M., Castaldi, C., Flikkema, M., & De Man, A. P. (2018). The timing of trademark application in innovation processes. Technovation, 72–73, 34–45. https://doi.org/https://doi.org/10.1016/j.technovation.2018.02.001
- Shearmur, R. (2015). Far from the madding crowd: Slow innovators, information value, and the geography of innovation. Growth and Change, 46(3), 424–442. https://doi.org/https://doi.org/10.1111/grow.12097
- Shearmur, R., & Doloreux, D. (2016). How open innovation processes vary between urban and remote environments: Slow innovators, market-sourced information and frequency of interaction. Entrepreneurship & Regional Development, 28(5–6), 337–357. https://doi.org/https://doi.org/10.1080/08985626.2016.1154984
- Webster, E., & Jensen, P. (2004). Patterns of trademarking activity in Australia (WP2004N02). Melbourne Institute of Applied Economic and Social Research, University of Melbourne.
- World Intellectual Property Organization (WIPO). (2013). World intellectual property report brands – Reputation and image in the global marketplace. WIPO.
- Zolas, N. J., Lybbert, T. J., & Bhattacharyya, P. (2017). An ‘algorithmic links with probabilities’ concordance for trademarks with an application towards bilateral IP flows. The World Economy, 40(6), 1184–1213.