
 ?Mathematical formulae have been encoded as MathML and are displayed in this HTML version using MathJax in order to improve their display. Uncheck the box to turn MathJax off. This feature requires Javascript. Click on a formula to zoom.
ABSTRACT
Smart Specialisation was conceived as a ‘bottom-up’ framework to identify new growth paths connected to knowledge cores within regions. Although operationalization of Smart Specialisation has proven difficult, recent mappings of technologies in terms of technological relatedness and complexity suggest a useful cost–benefit framework. We extend these ideas, locating European Union cities in a Smart Specialisation space and tracking their development of technology since 1980. Results indicate that European Union cities with the largest gains in complex and related technologies enjoy an economic performance premium over cities with smaller gains in the complexity and relatedness of their knowledge bases.
INTRODUCTION
With growth derailed by the 2008 crisis, a continuing productivity gap with the United States, and with uneven prospects for many in Southern and Eastern Europe, the European Union (EU) announced an ambitious development agenda in its Europe Horizon 2020 programme built around smart, sustainable and inclusive growth (Foray et al., Citation2011; McCann & Ortega-Argilés, Citation2015). At the core of this development project is Smart Specialisation (SS), a new vision of regional and national growth possibilities built around place-based capabilities. Envisaged as a ‘bottom-up’ initiative identifying local potentials for future development, SS seeks to renew and widen the knowledge and industrial foundations of regional economies, leveraging existing patterns of competitive advantage (Kroll, Citation2015).
While the European Commission has embraced the concept of SS, concerns have been raised about operationalization of SS policy (Hassink & Gong, Citation2019). Since its introduction, SS has been accused of being under-theorized (Boschma, Citation2014; Foray et al., Citation2011), lacking an empirical base (Iacobucci & Guzzini, Citation2016; Morgan, Citation2015; Santoalha, Citation2016; Unterlass et al., Citation2015), being poorly implemented (Pugh, Citation2018; Gianelle et al., Citation2020), and unlikely to be effective in peripheral regions (McCann & Ortega-Argilés, Citation2015). Crucial questions for SS are how to set priorities that can extend existing capabilities in regions, and how to identify the most promising activities from an economic development perspective. While SS aims to target related activities (Foray et al., Citation2012; McCann & Ortega-Argilés, Citation2015), few regions appear to have made a serious effort to apply relatedness measures when setting priorities (Capello & Kroll, Citation2016; D’Adda et al., Citation2019, Citation2020; Iacobucci, Citation2014; Iacobucci & Guzzini, Citation2016; Marrocu et al., Citation2020; Santoalha, Citation2019b). Further, there is little consensus on the breadth of activities SS policy should target. Some scholars call for SS to promote radical change in regions (Grillitsch et al., Citation2018). Others advocate related diversification into a more limited set of complex activities where growth trajectories can be identified (Balland et al., Citation2019).
Although these debates are crucial for the development of effective SS policy, the discussion so far has remained rather speculative, as systematic empirical evidence of the potential impacts of SS is lacking. SS policy was introduced in the EU in 2014 and implemented in the years after. At this time, it remains far too early to investigate the economic impact of this ambitious policy framework, especially because its main objective is to induce structural economic change in regions (McCann & Ortega-Argilés, Citation2016; Trippl et al., Citation2020). Instead of evaluating current SS policy, we take a look back in time. We follow the framework proposed by Balland et al. (Citation2019), arguing that SS policy should focus on developing new activities that increase the complexity of a region’s economy and that are closely related to existing capabilities in the region. This comes close to the spirit of SS policy which is about exploiting established capabilities in a region to diversify along new, potentially valuable, growth trajectories.
Thus, the objective of the paper is to investigate whether EU cities that followed a path of technological development consistent with the SS framework, as proposed by Balland et al. (Citation2019), outperformed cities that did not. In other words, we examine if diversifying into related and more complex technologies improved the economic performance of urban areas across the EU. Our analysis uses patent data for a set of 145 EU cities spanning the period 1981–2015. Results from analysis of panel models indicate that cities where technological development adhered more closely to the broad contours of the SS framework, that is, entering more complex and related technologies while jettisoning less related and less complex technologies, enjoyed faster gross domestic product (GDP) growth than cities that did not. The results for employment growth were not as clear.
The remainder of the paper is structured as follows. The next section briefly reviews the literature on SS and the core concepts of relatedness and complexity around which we operationalize SS policy. The third section outlines the data employed in this study of technological evolution and economic performance in European cities. The fourth section presents findings concerning the link between our model of SS and economic outcomes. The fifth section concludes, discussing the implications of our analysis for SS policy and its operationalization.
SMART SPECIALISATION IN A RELATEDNESS AND COMPLEXITY FRAMEWORK
The recommendations of the Knowledge for Growth Expert Group commissioned by the EU to explore the transatlantic productivity gap provided a technology-driven model of place-based policy (Foray et al., Citation2009). Their call for SS focused on building competitive advantage in research domains and sectors where regions possessed existing strengths and leveraging those capabilities through diversification into related technologies and industrial sectors. At the core of SS policy, then, is a focus on knowledge production. For individual locations, the policy prescription is to identify those technological assets that comprise the region’s knowledge core and then extend innovative capabilities along place-based trajectories that both reduce competitive overlap with competing regions while enhancing regional synergies. Selection of policy targets within the SS approach is viewed as a process of entrepreneurial discovery, of attempts to identify the key political-economic actors (inventors, firms, universities and other organizations), the networks that link these actors, and the governing institutions that comprise a viable innovation system, alongside the domains of activity, the trajectories along which dynamic forms of competitive advantage would be developed (Asheim, Citation2014). In this sense, the concept of SS extends the earlier focus on learning regions and regional innovation systems in a more targeted or directed evolutionary frame (Boschma, Citation2014; Morgan, Citation1997).
Effective development of the SS model will require significant shifts in regional growth and innovation policy. Though not a concern in this paper, precisely how SS should be designed, implemented and assessed within the policy environment has generated considerable discussion (Foray, Citation2016; McCann & Ortega-Argilés, Citation2016; Moodysson et al., Citation2015; Nauwelaers et al., Citation2014; Rodriguez-Pose et al., Citation2014). There remains the following crucial questions:
• How might the concept of SS be operationalized?
• How do we identify the knowledge capabilities of regional economies?
• How do we assess the trajectories of technological diversification that make the most sense for regions to follow?
The technological capabilities of regions change over time (Hall & Preston, Citation1988; Kogler et al., Citation2013; Kogler & Whittle, Citation2018). Capabilities expand when new technologies enter a region, and they contract as established technologies are abandoned. The process of invention, of developing new technologies, is a resource-using activity and, as such, constrained by resources available to actors. The pace and direction of technological entry and exit in a region are shaped by expectations regarding the costs and returns to the exploration and exploitation of different kinds of ideas. Following Breschi et al. (Citation2003), knowledge subsets that demand similar and complementary capabilities and skills for their use are referred to as being related. When knowledge components are dissimilar and tend not to be combined, they are considered unrelated. The cost of diversifying from one technology to another will be relatively low when the two technologies are related. As the relatedness between technologies declines, the costs of diversifying from one to the other increases, as there is less overlap between the required capabilities and more resources must be used to understand the growing share of that which is novel. Similar reasoning holds for abandoning a technology. The (opportunity) cost of exiting a technology is relatively low if capabilities are maintained in related areas. However, that cost will rise steeply when there are few alternatives and if the technology to be abandoned is widely used in the development of other ideas, especially those that are valuable.
The importance of relatedness for innovation and economic development in regions has been highlighted by Boschma (Citation2005), Frenken et al. (Citation2007) and Hidalgo et al. (Citation2018). In early work, studies adopted a static view on relatedness, concentrating on the relationship between related variety and economic growth in a region. Later papers took a more dynamic approach to relatedness, shifting attention to the processes through which the industrial or technological structures of regions evolve (Kogler et al., Citation2017; Neffke, Citation2009; Neffke et al., Citation2011; Whittle & Kogler, Citation2020). This work confirmed that the entry of new activities is enhanced by the degree of relatedness with existing activities in a region, and the exit of current activities is promoted when they are less related to the technological base of the regional economy (Boschma, Citation2017). For knowledge dynamics in particular, regions are inclined to build new capabilities in technologies related to their existing strengths, and more likely to discard capabilities in technologies far from their knowledge core (Boschma et al., Citation2015; Rigby, Citation2015).
The knowledge cores of regions vary not only in terms of technological composition but also in terms of value. Currently, there exist few direct measures of the returns to technologies, such as forward citations or litigation (Ejermo, Citation2009; Harhoff et al., Citation2003; Trajtenberg, Citation1990). Following the concept of complexity introduced by Hidalgo and Hausmann (Citation2009), Balland and Rigby (Citation2017) define complex technologies as those which combine many knowledge components and that are produced in relatively few regions with broad sets of capabilities. These technologies are regarded as valuable because they generate relatively high rents and their tacit nature means that they are a persistent source of competitive advantage (Maskell & Malmberg, Citation1999). Less complex technologies, which can be produced by many regions, tend to have low value and only limited capacity to sustain regional competitiveness. Antonelli et al. (Citation2020), Mewes and Broekel (Citation2020) and Pintar and Scherngell (Citation2021) provide broad support for these claims.
Balland et al. (Citation2019) developed an SS framework around these core ideas of relatedness and complexity. This framework rests upon a methodology to systematically identify new technological opportunities that complement and leverage the existing knowledge stocks of regions. These technological opportunities can be identified as those knowledge fields in which a region does not yet possess critical development capacity, that have a high degree of relatedness with the region’s existing knowledge base, and that would raise the value, or upgrade, the region’s portfolio of knowledge assets. Their template for operationalizing SS policy is summarized in .
Figure 1. The Smart Specialisation framework.
Source: After Balland et al. (Citation2019).
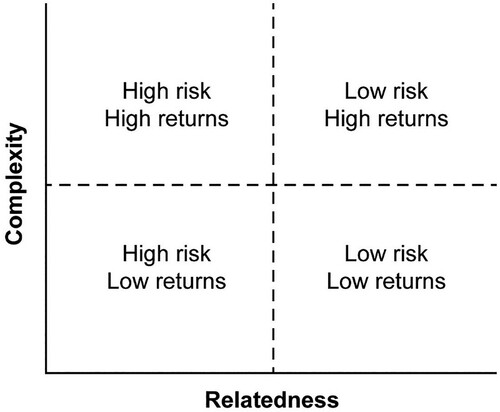
For any region, it is possible to map technological fields in which the region does not possess a relative technological advantage at time t. These potential new technologies are located in according to their relatedness and their complexity relative to the existing knowledge core of the region. The four quadrants highlight the cost–benefit trade-off that undergirds SS policy. The policymaker should consider developing those technologies that occupy the north-east quadrant because it is these technologies that promise above-average returns (higher complexity) at relatively low risk (higher relatedness). Technologies in the south-west quadrant are poor choices for SS because they are far removed from the existing knowledge core of the region and therefore risky, and they are characterized by relatively low (complexity) value. The north-west and south-east quadrants represent risk-return profiles that are less straightforward to appraise. The high risk-high returns quadrant might yield significant technological rents to a region, though the probability of sustained innovation in these unrelated technologies is low. Technologies that fall in the low risk-low returns quadrant have a strong likelihood of successful development, yet they present little value added to the regional economy.
While this SS framework highlights the role of relatedness in shaping regional development trajectories, several scholars have argued that SS policy should encourage regions to induce radical change (Wanzenböck & Frenken, Citation2018; Grillitsch et al., Citation2018). Their concern is that pushing a model of development around the concept of relatedness will narrow the base of regional economies making them less resilient over time. However, there is little systematic empirical evidence that supports such claims. Indeed, in recent work, Rocchetta et al. (Citation2022) showed that regions endowed with technologically coherent capabilities that develop new related growth paths were more resilient. It is important to note that the relatedness between different activities is not static but shifts over time as new activities are developed and new recombinations of existing activities appear. These dynamics may broaden the knowledge core of regions that develop new technologies related to their existing stocks and move their economies in completely new directions in the long run. Indeed, Boschma et al. (Citation2021) have demonstrated that technological breakthroughs often rely heavily on relatedness. The current paper contributes to these broader debates by analysing whether urban areas that follow the logic of the SS framework outlined by Balland et al. (Citation2019) enjoy higher economic performance over the long-run.
DATA AND OPERATIONALIZATION OF THE SMART SPECIALISATION FRAMEWORK
At its core, the SS initiative rests upon a framework to identify new technological opportunities that complement and extend the existing knowledge capabilities of economic agents located in different regions. These technological opportunities should satisfy three simple criteria. First, they should be technologies in which a region does not currently possess critical development capacity. Second, they should have a high degree of relatedness with the region’s existing knowledge base. Third, their development should raise the value, or upgrade, the region’s portfolio of knowledge assets. We combine patent data from the European Patent Office (EPO) and regional economic accounts from Cambridge Econometrics’ regional database to analyse the technological evolution and economic performance of 145 EU cities across five-year periods, spanning the years 1981–2015. The cities examined have generated at least 50 patents in each of the five-year time periods studied. These ‘cities’ are defined by combining data from NUTS-3 regions according to Eurostat (Citation2019). We choose to focus on cities because they are much closer to functional economic units than NUTS-2 regions. We examine regions with a reasonably large number of patents, not because we believe small cities are not innovative (Fritsch & Wyrwich, Citation2021), but rather because identification of the knowledge core of regions is easier with more patents, and because changes in revealed technological advantage (RTA) in larger regions index more stable trajectories of technological diversification. In the analysis below we discuss the construction of an SS index, before exploring the relationship between that index and city performance.
The cities examined are distributed over 15 EU countries, only one of which, Hungary, is in Eastern Europe. The cities and their immediate hinterlands vary greatly in size. The smallest city we include in our analysis is Basel in Switzerland with a population of around 222,000 in 2015. Ten other city-regions in our data frame have populations below 300,000. The median city population is 760,800; and the largest (London, UK) exceeds 13 million. Marrocu et al. (Citation2020) report the regions selected by EU countries to take part in the SS programme. These regions are a mix of NUTS-0 (countries), NUTS-1 and NUTS-2 regions which have an average population not dissimilar from the median in this study. provides descriptive statistics for key variables in the analysis.
Table 1. Descriptive statistics for sample cities, 2011–15.
Development of the SS framework demands identification of the knowledge core of regions and the value of different technology fields. Here we follow Kogler et al. (Citation2013), Boschma et al. (Citation2015) and Balland and Rigby (Citation2017) who extend the product space arguments of Hidalgo et al. (Citation2007) into the knowledge space. These efforts use patent data classified by technology field, by the timing and location of invention. The EPO places patents into at least one of 652 different technology classes in the Cooperative Patent Classification (CPC) system. By convention, inventions are dated using patent filing dates rather than grant dates to capture more precisely the time at which new knowledge is produced. The geography of inventions is given by the location of patent (co-)inventors. We focus on patents generated by inventors in EU cities. Individual patents are weighted from 0 to 1 according to the share of co-inventors located within the EU. Patents are fractionally allocated to different technology fields according to the frequency of knowledge claims that they make within each CPC class. We recognize that patents are an imperfect measure of knowledge production, in part because not all new knowledge is patented, yet there is no superior alternative (Griliches, Citation1990).
Measuring technological relatedness and relatedness density
To measure technological relatedness between CPC classes for a given time period, we count the weighted number of EU patents that contain a co-class pair, say i and j, and then standardize this count by the number of patents in total that record knowledge claims in CPC classes i and j. Relatedness in period t is, therefore, a standardized measure of the frequency with which two technology classes appear on the same patents. High values of relatedness indicate that two technology classes are more frequently combined on patents than the average of such pairings. This suggests that there are significant technological complementarities between these classes. Low values of relatedness indicate that technology classes are relatively independent of one another.
The relatedness between technologies is readily visualized as a network in the knowledge space. maps the relatedness between CPC technology classes for 1981–85 and 2011–15, times that bracket the study period. It shows the seven aggregate technology groupings recognized by Schmoch (Citation2008), plus the new ‘green technology’ category. Classes with high relatedness values are located close to one another. Hence, we see individual technologies of different aggregate types clustering together in the knowledge space, capturing the cognitive proximity between those classes. The size of the nodes illustrates the number of patents produced in each class. The nodes are scaled across the two time periods to illustrate the rapid growth in the pace of invention over time.
Figure 2. Technological relatedness in the European Union knowledge space: (a) 1981–85 and (b) 2011–15.
Note: The eight aggregate Cooperative Patent Classification (CPC) technology classes are: Electronics, Instruments, Chemicals, Biotech, Industrial process, Machinery and transport, Consumer goods and Climate change technologies.
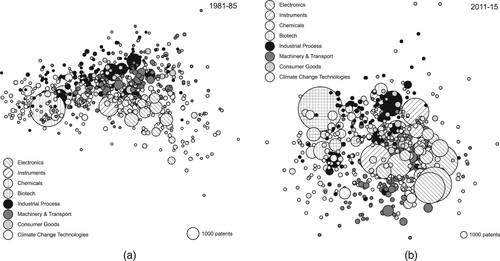
Between 1981 and 1985, 59,823 patents were generated across the EU cities examined. Between 2011 and 2015, 136,972 patents were developed over the same areas. These counts comprise approximately 66% and 40% of total EU patents for the two periods, respectively. During the first period mapped in , the three technology classes generating the most patents were C07D – Heterocyclic compounds, C07C – Acyclic or carbocyclic compounds and G01N – Investigating or analyzing materials. For the 2011–15 period, most CPC patents were located in the following three classes A61K – Preparations for medical, dental or toilet purposes, H04L – Transmission of digital information and G06F – Electrical digital data processing. The changes over time in the relative positions of the nodes in reflect processes of creative destruction that alter the frequencies of technological combinations on patents.
While illustrates the relatedness between technology classes in the EU, it is also possible to measure the degree to which patents cluster in knowledge space around a particular technology field. This measure of clustering is referred to as the relatedness density of a technology, following Hidalgo et al. (Citation2007). The relatedness density of technology class i in city r at time t is found as the technological relatedness of technology i to all other technologies j in which city r exhibits RTA, divided by the sum of the technological relatedness of technology i to all other technologies that are found in city r in period t:
and where RTA is a binary variable that assumes the value 1 (0) when a city possesses a larger (smaller) share of patents in a particular technology than the reference region (the sum of all metropolitan areas considered in the EU) for a given period. More formally, city r has an RTA in technology i at time t such that
when:
In the analysis that follows, RTA, the technological relatedness between patent classes and relatedness density of all technology fields are constructed for each of our 145 cities for seven consecutive five-year periods running from 1981–85 to 2011–15.
Measuring knowledge complexity
Hidalgo and Hausmann (Citation2009) outline a method for calculating the complexity of products and countries using trade data. Their complexity index reflects the difficulty of producing particular commodities as indicated by the spatial distribution of individual products and the combination of different product bundles in country export baskets. Balland and Rigby (Citation2017) develop a measure of knowledge complexity for US regions and technology classes using an eigenvector reformulation of the method of reflections outlined by Hidalgo and Hausmann (Citation2009). He et al. (Citation2016) prove that this measure is a bipartite page-rank algorithm.
Here we follow the approach of Balland and Rigby (Citation2017) and develop a bipartite network that connects cities to the technological fields in which they are most active. We focus on n = 366 cities and k = 652 CPC technology classes that demarcate the US city-system of technology production. Hence, we borrow complexity measures for the 652 CPC patent classes generated from US rather than EU data. We do this simply because the method of reflections does not work well for EU regions at the four-digit level of the CPC. We believe that this is primarily because EU regions are parts of different countries and so many of the more complex types of technologies that are found in relatively few US cities tend to be duplicated across cities and regions within the EU. This duplication lowers the values of technologies that we understand to be more complex. Employing US patent data to identify the complexity of technologies produced in the EU does not seem problematic to us as technologies that are complex in the United States are also likely to be complex in the EU. All that said, the correlation between the complexity values for CPC technology classes in the US and EU systems is about 0.6. Using EU complexity data in the following analysis produces results that are qualitatively similar to those shown below. reports the top 10 technology fields in terms of complexity for the period 2011–15. It shows complexity values indexed to the score of the most complex class.
Table 2. Top technology fields by complexity, 2011–15.
highlights EU cities with the highest and lowest values of aggregate complexity in the period 2011–15. The complexity score for each city is built as a weighted average of the CPC technology class scores and the share of each city’s patents in those classes. Complexity values for the initial period for each of the cities observed are also provided. Rennes (France) enjoys the highest complexity score for the period 2011–15 as a result of patent specialization in telecommunications sectors with high complexity. Reims (France), an older industrial city with little invention in new technology classes, has the lowest complexity score of the 145 EU cities in 2011–15. There is some stability in city complexity ranks over time: the correlation coefficient in city complexity scores between 1981–85 and 2011–15 is 0.44. Of the top 20 most complex cities in 2011–15, seven were in the top 20 already in 1981–85: Edinburgh (UK), Eindhoven (the Netherlands), Grenoble (France), London (UK), Nice, Rennes and Toulouse (all France). Of the 20 least complex cities in 2011–15, nine have remained at the bottom of the complexity table since 1981–85: Aberdeen (UK), Amiens (France), Bologna (Italy), Coventry (UK), Iserlohn (Germany), Odense (Denmark), Osnabruck (Germany), Reggio nell’Emelia (Italy) and Reims. The average change in city rank by complexity across the entire study period was 33. Over the 35 years examined, Malmo (Sweden) recorded faster growth in technological complexity than any other city, and Ipswich (UK) recorded the fastest decline in complexity.
Table 3. Complexity scores in European Union cities.
Smart Specialisation in EU cities, 1981–2015
From the methods just discussed, it is possible to identify all technology fields in which EU cities have RTA. To these measures we add the knowledge complexity of each technology and the relatedness density of those technologies within each city across the five-year time periods examined. Using these variables, individual cities are mapped in the SS space of to highlight the relatedness density and complexity of the technology fields in which they gain and lose RTA between time periods.
The coordinates of this mapping exercise are developed in the following way. In the case of technological entry, all technology classes in which the RTA of a city takes the value 0 in period t are identified. These classes are candidates for technological entry (gaining RTA) going forward. The relatedness density and complexity scores of these potential entry classes are recorded. Next, the actual technological fields in which a city gains RTA between periods t and t + 1 are identified along with the relatedness density and complexity values of these fields. The mean relatedness density and complexity scores of the potential entry classes are then subtracted from the relatedness and complexity scores of the technology classes in which a city actually develops new RTAs. The result indicates whether a city builds RTA in technology classes that have relatedness density and complexity scores above or below the average of those classes in which it has not yet developed a competitive advantage.
Summing these deviations across time periods generates an overall index of entry complexity and relatedness density values for each city. We develop the same index for technological exit. Exit occurs when a city has RTA in a technology class in time period t, but loses it by period t + 1. Again we identify the technology classes in which cities lose RTA and calculate the sum of the complexity and relatedness density measures for those cities across technology classes and time periods, relative to the set of all technology classes in which RTA may be lost. Calculating the difference between the potential and realized relatedness density and complexity values for entry and exit controls for differences in knowledge cores between EU cities and yields measures that report how well cities exploit the potential to upgrade to technologies characterized by high relatedness density and high complexity, while also abandoning those technologies with low relatedness density scores and low complexity.
maps the results of this exercise for the EU cities examined, with the data on entry shown in the top panel and that for exit in the bottom panel. The relatedness density and complexity deviations are normalized. Note that a few cities (in the core of the spaces) are dropped from the panels to improve readability. Thinking back to , it is advantageous to enter technology classes in the top-right quadrant, where relatedness density to the knowledge core of the city is high and where the average complexity value of the technology classes that are entered is also high. Entering technology classes in the bottom-left quadrant, where density and complexity values are low compared with those available, is not likely to improve city performance. In terms of technological exit (bottom panel of ), cities located in the lower-left quadrant, where complexity and relatedness density values are lower than the average of all technology classes in which RTA is established, should experience the largest gains in performance as they are shedding the least attractive technologies.
Figure 3. Smart Specialisation in European Union cities by entry and exit, 1981–2015.
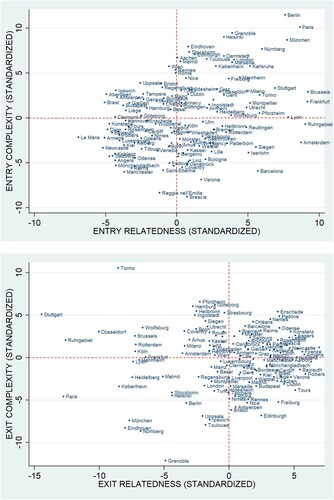
From , it is clear that cities occupy quite different parts of the SS space in terms of both technological entry and exit. It is interesting that the most inventive cities, those that are generally regarded as the most dynamic parts of the EU, tend to concentrate in the top-right quadrant of the SS space in the case of entry. These cities, including Paris (France), Munich, Berlin (both Germany), Grenoble, Helsinki (Finland) and Nuremberg (Germany), are building RTAs in the most complex technology fields available to them, and which are often closely related to their existing knowledge core. Other innovative cities such as Eindhoven, Stockholm (Sweden), Aachen (Germany), Malmo (Sweden), Vienna (Austria), Rennes, Rome (Italy) and Nice are developing highly complex technologies, though these are less closely connected to their existing knowledge bases. Older industrial centres such as Amsterdam (the Netherlands), Ruhrgebiet, Reutlingen, Siegen, Iserlohn (all Germany) and Barcelona (Spain) are generating RTAs in technologies that build upon their existing strengths, but these are often low complexity (low-value) fields. A relatively large number of smaller cities are entering technology classes that are less related to their existing strengths: these are the metro areas with negative relatedness density values in the entry panel of . These cities are split in terms of whether entry is in relatively high complexity classes – Uppsala (Sweden), Bristol (UK), Regensburg (Germany) and Tampere (Finland) – or in low complexity classes – Manchester (UK), Mönchengladbach (Germany), Reims, Angers (France), Koblenz (Germany), Salzburg (Austria) and Oldenburg (Germany).
Shifting to the bottom panel of and the results for technological exit, only a small number of EU cities are exiting low complexity classes unrelated to their knowledge cores as SS policy would advocate. Again the cities in this group, those in the bottom-left quadrant of the exit panel, are the EU’s most high-tech centres: Paris, Munich, Eindhoven, Nuremberg, Grenoble and Copenhagen (Denmark). A number of cities are abandoning technologies that generate above-average complexity values and which are close to their existing capabilities. These are the cities in the top-right quadrant of the exit panel, highlighted by Enschede (the Netherlands), Padua (Italy), Nantes (France), Odense and Konstanz (Germany). A few cities, notably Stuttgart (Germany) and Turin (Italy), are exiting technology fields that, while relatively unrelated to their knowledge cores, exhibit above-average complexity.
Note that while shows the results for the study period as a whole, Appendix A in the supplemental data online reports the relatedness density and complexity values for each city for the first and last time periods, for both technological entry and exit. As might be expected, there is considerable movement of cities in the SS space over time, though quite some consistency in relative positions is observed, especially for larger cities.
MIGHT SMART SPECIALISATION IMPROVE THE ECONOMIC PERFORMANCE OF EU CITIES?
Do EU cities enjoy improved economic performance if they develop technology stocks in a manner consistent with SS as we have defined it above? In other words, if cities enter and exit technological fields to maximize the gains in the relatedness density and complexity of their knowledge portfolios, will they outperform other cities where technology evolves in some other fashion? To help answer this question, an SS index is constructed. This index is found by summing the normalized values of relatedness density and complexity for entry (taken from ) and then subtracting from that sum the normalized values of relatedness density and complexity for exit. Cities that enter new technology fields with above average relatedness and complexity and which exit technological fields with lower-than-average relatedness and complexity will score highest on the SS index. These are the cities in the top-right quadrant of the entry (top) panel in and in the lower left quadrant of the exit (bottom) panel. Normalized values of both relatedness density and complexity are used so that these two variables have a reasonably similar weight in the resulting SS index.
In , EU cities are binned into five quintiles based on their SS index calculated across all five-year periods between 1981–85 and 2011–15. A total of 29 cities are located in each of the quintiles, which are reported in descending order of SS. Across cities in each quintile the average rate of employment growth and the average rate of GDP growth are reported. makes it clear that, at least in cross-section by quintile, cities scoring higher in terms of the SS index enjoy faster economic growth. There is a positive monotonic relationship between SS and employment growth across the quintiles and a near monotonic relationship for GDP growth. Of course, within each of the quintiles there is considerable variation in growth rates of employment and GDP across cities.
Table 4. Relationship between Smart Specialisation and economic growth.
We now explore the relationship between SS and economic growth in a series of fixed effects panel models. These models examine whether cities in which the evolution of technology over the last 30 years or so come closest to the SS framework, as we have defined it, enjoyed improved economic performance. Two different dependent variables are used for this task, the rate of growth of employment and the rate of growth of GDP. Growth rates are preferred over levels to remove some of the influence of scale. They also fit better with the independent variables that comprise the SS indicators, for they are change variables. Arguably, employment and GDP growth are the most general indicators of economic performance.
The primary independent variables in the analysis are the SS index and its main components. All variables in the regression model, illustrated below, are measured within EU cities for each five-year time slice. Using a fixed effect panel format in our regression model focuses attention on temporal shifts in technology development within cities and removes the influence of fixed city-specific influences on performance. The analysis incorporates a time lag in that we examine technological entry and exit in regions between time periods t and t + 1 and then link that to changes in the rate of growth of GDP and employment over the same periods. We add time fixed effects to the regression model to control for period-specific shocks that might impact urban growth. Employment or GDP in levels form, for the base year of the growth period of each city, is added to control for city size, consistent with standard growth models. Finally, we add a series of covariates to our models to remove the influence on our dependent variables of a series of different processes. A measures of population density serves as a crude proxy for agglomeration, the manufacturing share of employment reflects the age of a city’s economy, a technology Herfindahl captures the impact of specialization, and a measure of external linkages between cities extracted from patent collaboration data controls for the relative centrality of a city in terms of the EU urban system. We do not have R&D or education data for the cities we examine over the period since 1980. However, we do have proxies of these variables. R&D is an input to the knowledge production process and patents are perhaps the most widely used measure of knowledge output. We thus use lagged values of the sum of patents generated within each five-year period as a proxy for city-level R&D input. In similar fashion we use lagged values of scientific publications per capita, derived from the Web of Science, for each time period as a proxy for the higher education population share within each city. Theory would suggest that both of these variables should be positively related to GDP and employment growth rates.
Given the nature of our data, we are concerned with issues of spatial dependence and endogeneity, the latter driven by simultaneity bias. In a simple test, Moran’s I measures of spatial autocorrelation were constructed for employment growth and GDP growth across our units of observation for different periods. Two different measures were used to capture the relative locations of cities in the tests for spatial autocorrelation, first a set of distance measures between all pairs of cities and second a more restricted set of city neighbours. Using both geographies, for almost all periods the Moran’s I coefficient was insignificant for both dependent variables, though it did turn significant in the final period for the employment growth variable. A more comprehensive test of spatial dependence made use of spatial panel models. Tests of spatial lag and error effects in R using the package spml indicated no significant concerns with either form of spatial dependence.
Endogeneity is a more serious concern that demands an instrumental variables (IV) approach. Unfortunately, we do not have readily available instruments for our independent variables, in particular the SS index and its components. One possibility is to use temporal lags of the independent variables as instruments, though with only six to seven periods of analysis, this means discarding critical observations. Bellemare et al. (Citation2017) also raise questions regarding this approach. An alternative method is to take advantage of spatial dependence in the independent variables, if present, through the development of a series of synthetic instruments built using a spatial filter. Here we follow Le Gallo and Paez (Citation2013) who develop the eigenvector technique discussed by Griffith (Citation2003). For our system of 145 cities, this method is outlined in the following steps:
Build a spatial weights matrix to capture the distances between all pairs of cities under analysis.
Choose a distance value such that neighbours can be identified for each city. This value will be smaller than the distance between a city and its most distant potential neighbour. The result is a binary spatial contiguity matrix with row sums somewhere between 1 and 144. We chose a distance cut-off that ensured all 145 cities in our sample have at least one neighbour. There is no clear theoretical guidance on what value to choose in order to construct the binary contiguity matrix.
Find all eigenvectors associated with the contiguity matrix. There are 145 such eigenvectors, each orthogonal to one another, that represent a portion of the variance in the spatial contiguity matrix. The spatial filter is constructed as a linear combination of a subset of these eigenvectors.
The filter for each independent variable is typically found by regressing the independent variable on the subset of eigenvectors with p-values below a chosen threshold and using the predicted value of the independent variable as the synthetic instrument.
For each independent variable, we used all eigenvectors that exhibited a p-value < 0.1. For a few variables we ran into weak instruments problems as revealed through first-stage diagnostics and we then generated synthetic instruments for these variables using all eigenvectors with p < 0.2. The variables affected were the GDP level, population density, the manufacturing share of employment, and complexity. It is important not to let the p-value creep too high because then the researcher would simply be recreating the original variables. It is a matter of some debate what ‘too high’ might mean in this context.
The resulting synthetic variables replicated the original independent variables with correlations ranging from 0.35 to 0.60.
It is important to note that our synthetic instrumental variables are built using a spatial contiguity matrix only. Thus, by design, they are exogenous of the dependent variables. However, even though the synthetic instruments are created only from the spatial contiguity data, if the dependent variable also shows clear evidence of autocorrelation across the spatial units under study, the instruments might still be suspect. Fortunately, as noted above, the rate of growth of GDP and employment do not show evidence of spatial autocorrelation and thus we are safe to proceed. As the tables below reveal, our instruments are not weak and they pass standard diagnostic tests. Note that adding an extra instrument to models 5 and 6 in and provides an over-identification condition that allows us to run the Sargan test of the exogeneity of our instruments. In the GDP growth models of we added the lagged employment level, and in the employment growth model of we added the lagged GDP level as additional instruments. The Sargan tests in all cases did not reject the null hypothesis of the exogeneity of instruments.
Table 5. European Union city gross domestic product (GDP) growth and Smart Specialisation (dependent variable: GDP growth).
Table 6. European Union city employment growth and Smart Specialisation (dependent variable: employment growth).
The results of our analysis are displayed in (where GDP growth is the dependent variable) and in (where employment growth is the dependent variable). Overall, the results indicate a positive and significant link between the rate of growth of metropolitan GDP and the SS index. In the case of employment growth, there is mixed evidence of the positive and significant role of SS. Estimated in fixed effects panel form this link is established at the city level, rather than in cross-section and this is important from a policy viewpoint. In model 1, across and , the SS index is the key independent variable. The SS variable is positively and significantly related to GDP growth in cities, but while positive, it is not significantly related to the growth of employment. In model 2, the two primary components of the SS index are separated to examine the differential impacts of relatedness density and complexity on urban performance. In both and , model 2 reveals that increases in city complexity are a positive and significant predictor of GDP and employment growth, while the increases in relatedness density have no significant impact on urban growth.
Models 3 and 4 in both tables of results, add the city-level covariates to the analysis. Four of seven of the city-level covariates are significant in focusing on the variance in GDP growth. Lagged values of GDP are positive, suggesting there is little catch-up in terms of GDP from cities with lower levels to cities with higher levels of output. The lagged value of population density is negative in models 3 and 4 of which is a little surprising to us. If this variable is taken as a proxy for potential agglomeration economies, then we would have expected a positive sign. The positive and significant coefficient on the manufacturing share of employment is not unexpected, as advanced manufacturing remains a source of high valued output. However, if the manufacturing share is used as an index of the age of the economy of a city or region, then the sign of this variable suggests that older cities enjoy more robust growth. The Herfindahl index of technological specialization has no impact on the growth process. The more connected a city is, measured in this case through inventor collaborations that span EU cities, the more robust is a city’s GDP growth. While lagged values of the patent sum and Web of Science listings per capita both have positive coefficients, neither is statistically significant in model 2.
Most important for us are the signs on the SS index and its components, entry–exit relatedness and entry–exit complexity in models 3 and 4 of . The positive and significant coefficient for the SS index indicates that if cities adjust their technology stocks in the direction of more related technologies that are more complex, they will enjoy higher GDP growth. A one unit increase in the normalized value of the SS index on average will raise GDP growth by 4.1% over a five-year period. Model 4 indicates that the primary driver of the significance of the SS index is the change in the complexity of a city’s patent stocks. A one-unit change in the normalized value of knowledge complexity will raise GDP growth in a city on average by 5.3%.
In models 5 and 6 of , we employ our synthetic instrumental variables in generalized method of moments (GMM) models that explore the potential impacts of endogeneity on our results. All the independent variables in these models are considered endogenous and instruments built for each as described earlier. Model 5 reveals that in instrumented form, the overall SS index remains a positive and significant predictor of the growth of city GDP with a coefficient that is a little larger than that reported in model 3, something that we expect with IV estimation. Note that in model 6, both the relatedness component and the complexity component of the SS index have positive coefficients and both variables are significant. Diagnostic tests report that our instruments are not weak and the Sargan test (developed using an additional instrumental variable) reveals they are exogenous.
The results in , focusing on city employment growth tell a broadly similar story as those in , at least through models 1–4. Of the covariates in models 3 and 4, only the lagged employment level and population density are statistically significant. The former variable again suggests that there is no catch-up in terms of employment between smaller and larger cities overall. The population density variable is again negative, indicating slightly slower employment growth in cities with higher population density. Consistent with the results for GDP growth, the SS index is significant, though only at the 0.1 level, and positively related to employment growth. The coefficient suggests a one unit increase in the index would raise employment growth around 3.7%. From model 4, it is clear that increases in complexity have the most important impact on employment growth. A one unit gain in the complexity of a city’s knowledge stocks might be expected to increase employment growth on average by 5.1%. In terms of the IV estimates, the SS index is not significantly related to employment growth within the cities examined. And, in model 6, the relatedness component of the SS index is positive and significant, while the complexity variable is insignificant.
CONCLUSIONS
SS represents an important new policy platform for EU regions. The programme is ambitious, seeking to raise aggregate regional productivity across EU regions and to reduce interregional variations in economic performance. Whether the SS initiative can overcome well-known trade-offs between efficiency and equity remains to be seen. Furthermore, whether the policy framework will work for all regions is an open question. At this time, the SS programme is in early stages of operationalization and little is known about its likely impact. Yet, the importance and the size of the initiative call for attention. We argue that some sense of the possibilities of SS might be generated through exploration of historical data. We pursue this task by generating an index that maps how well EU cities have followed a technology development path that corresponds to the principles of SS outlined in Balland et al. (Citation2019). The relationship between this index of SS and regional economic performance forms the analytical core of this paper.
The SS framework rests upon identification of the knowledge core of regions and a mapping of new technological trajectories for each region that builds on existing capabilities. We demonstrate how to capture the knowledge profiles of EU regions and how to identify new knowledge possibilities that rest upon existing stocks of technology. Those possibilities can be ordered in terms of the costs and benefits of their development. The cost of knowledge development is linked to the relatedness of new technologies to the existing knowledge core of the region. When new technological alternatives are closely related to that core, the cost of their development is relatively low. Technology alternatives that are unrelated to a region’s existing set of capabilities are risky to develop and thus pose higher costs. The benefits of developing different technologies depend upon the rents they generate. Those rents will tend to be greater for forms of knowledge that are more complex, those that are difficult to produce and to imitate.
Analysis focused on whether European cities that followed a path of technological development consistent with SS outperformed cities that did not follow this path over the period 1981–2015. For each city across five-year time periods, patterns of technological entry and exit were used to measure how closely changes in knowledge stocks corresponded to the SS framework of Balland et al. (Citation2019). If cities developed (abandoned) new technologies more (less) complex and more (less) related to their current knowledge assets than the average of those technologies available to them (currently in use), they scored high on the SS index. The SS index, and its two core components of relatedness and complexity, were then used as the primary independent variables in a series of fixed effect panel regressions explaining variance in the economic performance of EU cities. Two separate dependent variables, employment growth and GDP growth, measured that performance. The panel regressions paid explicit attention to concerns with spatial dependence in the data, and they made use of a novel form of synthetic instrumental variables to examine the impact of endogeneity.
The results showed that EU cities following knowledge development trajectories that are closer to our proposed SS framework experienced higher GDP growth and somewhat higher employment growth than cities that scored lower on the SS index. Of the two components of the SS index, both exert a positive and significant influence on GDP growth, while only relatedness was significantly related to employment growth. We are excited by these results that imply SS policies that assist cities and regions to diversify their knowledge cores into related and more complex technological fields might well generate gains in economic performance.
Still, some words of caution are necessary. First, much more work is required to bolster these initial findings. While preliminary investigation suggests that our results are robust to analysis at the NUTS-2 regional level, across a broader set of 274 regions, whether they will hold in a much more carefully developed causal model of economic performance remains to be seen. Second, our study has focused on larger urban areas which is a clear limitation. Not all innovation activities are concentrated in large cities (e.g., Fritsch & Wyrwich, Citation2021). Subsetting regional accounts to explore how well SS might work across smaller regions, those that are more or less specialized, those that are less innovative, and those that are more generally rendered ‘peripheral’ in different ways, represent critical next steps. This would also respond to serious concerns that SS might not deliver in peripheral, lagging regions (Hassink & Gong, Citation2019; McCann & Ortega-Argilés, Citation2015). Third, and very much related to the previous point, our paper focuses on technological dynamics using patent data only. Future research should look at capabilities in regions that are not well represented by patents. It should cover a broader range of activities within the economy, including low and medium-tech industries, covering services such as tourism and health, and human capital, skills and occupations, as these will provide different types of opportunities for regions to develop new growth paths. These activities can be readily incorporated into the applied SS framework and studied accordingly (Balland & Boschma, Citation2019). Fourth, the relevance of having access to related capabilities outside the region should also be explored further as Balland and Boschma (Citation2021) and Whittle et al. (Citation2020) reveal. There is still little understanding of the role of interregional linkages for new path development, although this is considered a crucial component of SS policy (Iacobucci & Guzzini, Citation2016; Radosevic et al., Citation2018; Santoalha, Citation2019a; Uyarra et al., Citation2018). Fifth, the effectiveness of SS clearly depends on more than relatedness and complexity alone. Formal and informal institutions at both national and regional scales play a crucial role in shaping the environment within which SS policy is enacted (Cortinovis et al., Citation2017; Rodriguez-Pose et al., Citation2014; Rodríguez-Pose & Di Cataldo, Citation2015). And, finally, whether or not there is a most efficient spatial scale at which the SS programme might be implemented remains a critical question that we have not tackled in this paper.
Supplemental Material
Download PDF (324.5 KB)ACKNOWLEDGEMENTS
The authors thank Michael Storper for providing detailed comments on an earlier draft of this manuscript, which significantly improved the quality of the resulting product. We also thank the editor and two anonymous referees who provided helpful comments throughout the review process.
DISCLOSURE STATEMENT
No potential conflict of interest was reported by the authors.
Additional information
Funding
REFERENCES
- Antonelli, C., Crespi, F., & Quatraro, F. (2020). Knowledge complexity and the mechanisms of knowledge generation and exploitation: The European evidence. Research Policy. https://doi.org/10.1016/j.respol.2020.104081.
- Asheim, B. (2014). North Denmark Region RIS3. An expert assessment on behalf of DG Regional and Urban Policy.
- Balland, P. A., & Boschma, R. (2019). Smart specialization: Beyond patents. European Commission, DG Regional and Urban Policy.
- Balland, P. A., & Boschma, R. (2021). Complementary inter-regional linkages and Smart Specialisation. An empirical study on European regions. Regional Studies, 55(6), 1059–1070. https://doi.org/10.1080/00343404.2020.1861240
- Balland, P. A., Boschma, R., Crespo, J., & Rigby, D. (2019). Smart specialization policy in the European Union: Relatedness, knowledge complexity and regional diversification. Regional Studies, 53(9), 1252–1268. https://doi.org/10.1080/00343404.2018.1437900
- Balland, P. A., & Rigby, D. (2017). The geography of complex knowledge. Economic Geography, 93(1), 1–23. https://doi.org/10.1080/00130095.2016.1205947
- Bellemare, M., Masaki, T., & Pepinsky, T. (2017). Lagged explanatory variables and the estimation of causal effects. The Journal of Politics, 79(3), 949–963. https://doi.org/10.1086/690946
- Boschma, R. (2005). Proximity and innovation: A critical assessment. Regional Studies, 39(1), 61–74. https://doi.org/10.1080/0034340052000320887
- Boschma, R. (2014). Constructing regional advantage and smart specialization. Comparison of two European policy concepts. Italian Journal of Regional Science, 13(1), 51–68. https://doi.org/10.3280/SCRE2014-001004
- Boschma, R. (2017). Relatedness as a driver of regional diversification: A research agenda. Regional Studies, 51(3), 351–364. https://doi.org/10.1080/00343404.2016.1254767
- Boschma, R., Balland, P. A., & Kogler, D. (2015). Relatedness and technological change in cities: The rise and fall of technological knowledge in US metropolitan areas from 1981 to 2010. Industrial and Corporate Change, 24(1), 223–250. https://doi.org/10.1093/icc/dtu012
- Boschma, R., Miguélez, E., Moreno, R., & Ocampo-Corrales, T. (2021). Technological breakthroughs in European regions: The role of related and unrelated combinations. Papers in Evolutionary Economic Geography, 21.18, Utrecht University.
- Breschi, S., Lissoni, F., & Malerba, F. (2003). Knowledge-relatedness in firm technological diversification. Research Policy, 32(1), 69–87. https://doi.org/10.1016/S0048-7333(02)00004-5
- Capello, R., & Kroll, H. (2016). From theory to practice in smart specialization strategy: Emerging limits and possible future trajectories. European Planning Studies, 24(8), 1393–1406. https://doi.org/10.1080/09654313.2016.1156058
- Cortinovis, N., Xiao, J., Boschma, R., & van Oort, F. (2017). Quality of government and social capital as drivers of regional diversification in Europe. Journal of Economic Geography, 17(6), 1179–1208. https://doi.org/10.1093/jeg/lbx001
- D’Adda, D., Guzzini, E., Iacobucci, D., & Palloni, R. (2019). Is smart specialisation strategy coherent with regional innovative capabilities? Regional Studies, 53(7), 1004–1016. https://doi.org/10.1080/00343404.2018.1523542
- D’Adda, D., Iacobucci, D., & Palloni, R. (2020). Relatedness in the implementation of Smart Specialisation Strategy: A first empirical assessment. Papers in Regional Science, 99(3), 405–425. https://doi.org/10.1111/pirs.12492
- Ejermo, O. (2009). Regional innovation measured by patent data – Does quality matter? Industry and Innovation, 16(2), 141–165. https://doi.org/10.1080/13662710902764246
- Eurostat. (2019). Methodological manual on territorial typologies, 2018 edition. Publications Office of the European Union.
- Foray, D. (2016). On the policy space of smart specialization strategies. European Planning Studies, 24(8), 1428–1437. https://doi.org/10.1080/09654313.2016.1176126
- Foray, D., David, P., & Hall, B. (2009). Smart specialization – The concept. Knowledge Economists Brief No. 9, June. European Commission.
- Foray, D., David, P., & Hall, B. (2011). Smart specialization: From academic idea to political instrument, the surprising career of a concept and the difficulties involved in its implementation. MTEI Working Paper, Ecole Polytechnique Federale de Lausanne.
- Foray, D., Goddard, J., Beldarrain, X., Landabaso, M., McCann, P., Morgan, K., Nauwelaers, C., Ortega-Argilés, R., & Mulatero, F. (2012). Guide to Research and Innovation Strategies for Smart Specialisations (RIS 3).
- Frenken, K., Van Oort, F., & Verburg, T. (2007). Related variety, unrelated variety and regional economic growth. Regional Studies, 41(5), 685–697. https://doi.org/10.1080/00343400601120296
- Fritsch, M., & Wyrwich, M. (2021). Is innovation (increasingly) concentrated in large cities? An international comparison. Research Policy, 50(6), 104237. https://doi.org/10.1016/j.respol.2021.104237
- Gianelle, G., Guzzo, F., & Mieszkowski, K. (2020). Smart Specialisation: what gets lost in translation from concept to practice? Regional Studies, 54(1), 1377–1388. https://doi.org/10.1080/00343404.2019.1607970
- Griffith, D. (2003). Spatial autocorrelation and spatial filtering: Gaining Understanding through theory and scientific visualization. Springer.
- Griliches, Z. (1990). Patent statistics as economic indicators: A survey. Journal of Economic Literature, 28(4), 1661–1697.
- Grillitsch, M., Asheim, B., & Trippl, M. (2018). Unrelated knowledge combinations: The unexplored potential for regional industrial path development. Cambridge Journal of Regions, Economy and Society, 11(2), 257–274. https://doi.org/10.1093/cjres/rsy012
- Hall, P., & Preston, P. (1988). The carrier wave: New information technology and the geography of innovation 1846–2003. Unwin Hyman.
- Harhoff, D., Scherer, F., & Vopel, K. (2003). Citations, family size, opposition and the value of patent rights. Research Policy, 32(8), 1343–1363. https://doi.org/10.1016/S0048-7333(02)00124-5
- Hassink, R., & Gong, H. (2019). Six critical questions about smart specialization. European Planning Studies, 27(10), 2049–2065. https://doi.org/10.1080/09654313.2019.1650898
- He, X., Gao, M., Kan, M. Y., & Wang, D. (2016). Birank: Towards ranking on bipartite graphs. IEEE Transactions on Knowledge and Data Engineering, Submission 2016, 1–15. https://doi.org/10.1109/TKDE.2016.2611584
- Hidalgo, C., Balland, P. A., Boschma, R., Deldago, M., Feldman, M., Frenken, K., Glaeser, E., He, C., Kogler, D., Morrison, A., Neffke, F., Rigby, D., Stern, S., Zheng, S., & Zhu, S. (2018). The principle of relatedness. In A. Morales, C. Gershenson, D. Braha, A. Minai, & Y. Bar-Yam (Eds.), Unifying themes in complex systems IX (pp. 451–457). Springer Nature.
- Hidalgo, C., & Hausmann, R. (2009). The building blocks of economic complexity. Proceedings of the National Academy of Sciences, 106(26), 10570–10575. https://doi.org/10.1073/pnas.0900943106
- Hidalgo, C., Klinger, B., Barabasi, A., & Hausmann, R. (2007). The product space conditions the development of nations. Science, 317(5837), 482–487. https://doi.org/10.1126/science.1144581
- Iacobucci, D. (2014). Designing and implementing a smart specialisation strategy at regional level: Some open questions. Scienze Regionali, Italian Journal of Regional Science, 13(1), 107–126. https://doi.org/10.3280/SCRE2014-001006
- Iacobucci, D., & Guzzini, E. (2016). Relatedness and connectivity in technological domains: Missing links in S3 design and implementation. European Planning Studies, 24(8), 1511–1526. https://doi.org/10.1080/09654313.2016.1170108
- Kogler, D., Esslezbichler, J., & Rigby, D. (2017). The evolution of specialization in the EU15 knowledge space. Journal of Economic Geography, 17(2), 345–373. https://doi.org/10.1093/jeg/lbw024
- Kogler, D., Rigby, D., & Tucker, I. (2013). Mapping knowledge space and technological relatedness in US cities. European Planning Studies, 21(9), 1374–1391. https://doi.org/10.1080/09654313.2012.755832
- Kogler, D., & Whittle, A. (2018). The geography of knowledge creation: Technological relatedness and regional smart specialization strategies. In A. Paasi, J. Harrison, & M. Jones (Eds.), Handbook on the geographies of regions and territories (pp. 153–168). Edward Elgar.
- Kroll, H. (2015). Efforts to implement smart specialization in practice – Leading unlike horses to the water. European Planning Studies, 23(10), 2079–2098. https://doi.org/10.1080/09654313.2014.1003036
- Le Gallo, J., & Paez, A. (2013). Using synthetic variables in instrumental variables estimation of spatial series models. Environment and Planning A, 45(9), 2227–2242. https://doi.org/10.1068/a45443
- Marrocu, E., Paci, R., Rigby, D., & Usai, S. (2020). Smart specialization strategy: Any relatedness between theory and practice? CRENOS Working Paper No. 2020_04. University of Cagliari.
- Maskell, P., & Malmberg, A. (1999). The competitiveness of firms and regions: ‘ubiquitification’ and the importance of localized learning. European Urban and Regional Studies, 6(1), 9–25. https://doi.org/10.1177/096977649900600102
- McCann, P., & Ortega-Argilés, R. (2015). Smart specialization, regional growth and applications to European Union cohesion policy. Regional Studies, 49(8), 1291–1302. https://doi.org/10.1080/00343404.2013.799769
- McCann, P., & Ortega-Argilés, R. (2016). The early experience of smart specialization implementation in EU cohesion policy. European Planning Studies, 24(8), 1407–1427. https://doi.org/10.1080/09654313.2016.1166177
- Mewes, L., & Broekel, T. (2020). Technological complexity and economic growth of regions. Research Policy, 104156. https://doi.org/10.1016/j.respol.2020.104156
- Moodysson, J., Trippl, M., & Zukauskaite, E. (2015). Policy learning and smart specialization: Exploring strategies for regional industrial change. Smart specialization for regional innovation. Reflection Paper: Work Package 4. European Union, Seventh Framework Programme.
- Morgan, K. (1997). The learning region: Institutions, innovation and regional renewal. Regional Studies, 31(5), 491–503. https://doi.org/10.1080/00343409750132289
- Morgan, K. (2015). Book review of Foray, D. Smart specialization: Opportunities and challenges for regional innovation policy. Abingdon, Regional studies association. Regional Studies, 49(3), 480–482. https://doi.org/10.1080/00343404.2015.1007572
- Nauwelaers, C., Magro, E., Aranguren, M., Navarro, M., Wilson, J., Trippl, M., Hansen, T., Grillitsch, M., Blazek, J., Morgan, K., & Healy, A. (2014). Underpinning effective strategy design. Smart specialization for regional innovation. Reflection Paper: Work Package 4. European Union, Seventh Framework Programme.
- Neffke, F. (2009). Productive places: The influence of technological change and relatedness on agglomeration externalities [Doctoral dissertation]. School of Geography, Utrecht University. https://dspace.library.uu.nl/handle/1874/34317
- Neffke, F., Henning, M., & Boschma, R. (2011). How do regions diversify over time? Industry relatedness and the development of new growth paths in regions. Economic Geography, 87(3), 237–265. https://doi.org/10.1111/j.1944-8287.2011.01121.x
- Pintar, N., & Scherngell, T. (2021). The complex nature of regional knowledge production: Evidence on European regions. Research Policy. https://doi.org/10.1016/j.respol.2020.104170.
- Pugh, R. (2018). Questioning the implementation of smart specialisation: Regional innovation policy and semi-autonomous regions. Environment and Planning C, 36(3), 530–547.
- Radosevic, S., Curaj, A., Gheorghiu, R., Andreescu, L., & Wade, I. (eds.). (2018). Advances in the theory and practice of smart specialization. Academic Press. https://doi.org/10.1177/2399654417717069
- Rigby, D. (2015). Technological relatedness and knowledge space: Entry and exit of US cities from patent classes. Regional Studies, 49(11), 1922–1937. https://doi.org/10.1080/00343404.2013.854878
- Rocchetta, S., Mina, A., Lee, C., & Kogler, D. (2021). Technological knowledge spaces and the resilience of European regions. Journal of Economic Geography, 22(1), 27–51. https://doi.org/10.1093/jeg/lbab001.
- Rodriguez-Pose, A., Di Cataldo, M., & Rainoldi, A. (2014). The role of government institutions for smart specialization and regional development. S3 Policy Brief Series No. 4/2014. European Commission Joint Research Centre, Institute for Prospective Technological Studies.
- Rodríguez-Pose, A., & Di Cataldo, M. (2015). Quality of government and innovative performance in the regions of Europe. Journal of Economic Geography, 15(4), 673–706. https://doi.org/10.1093/jeg/lbu023
- Santoalha, A. (2016). New indicators of smart specialization. A related diversification approach applied to European regions (TIK Working Papers on Innovation Studies No. 20161220). University of Oslo.
- Santoalha, A. (2019a). Technological diversification and smart specialization: The role of cooperation. Regional Studies, 53(9), 1269–1283. https://doi.org/10.1080/00343404.2018.1530753
- Santoalha, A. (2019b). New indicators of related diversification applied to smart specialization in European regions. Spatial Economic Analysis, 14(4), 404–424. https://doi.org/10.1080/17421772.2019.1584328
- Schmoch, U. (2008). Concept of a technology classification for country comparisons. Final report to the World Intellectual Property Organisation – WIPO.
- Seidman, S. (1983). Network structure and minimum degree. Social Networks, 5(3), 269–287. https://doi.org/10.1016/0378-8733(83)90028-X
- Trajtenberg, M. (1990). A penny for your quotes: Patent citations and the value of innovations. RAND Journal of Economics, 21(1), 172–187. https://doi.org/10.2307/2555502
- Trippl, M., Zukauskaite, E., & Healy, A. (2020). Shaping smart specialization: The role of place-specific factors in advanced, intermediate and less-developed European regions. Regional Studies, 54(10), 1328–1340. https://doi.org/10.1080/00343404.2019.1582763
- Unterlass, F., Reinstaller, A., Friesenbichler, K., Charos, A., Hranyai, K., Reschenhofer, P., & Weingartner, S. (2015). The relationship between export and technological specialization profiles across EU countries and regions and the identification of development potentials. Research Report. Vienna: Austrian Institute of Economic Research (WIFO).
- Uyarra, E., Marzocchi, C., & Sorvik, J. (2018). How outward looking is smart specialisation? Rationales, Drivers and Barriers. European Planning Studies, 26(12), 2344–2363. https://doi.org/10.1080/09654313.2018.1529146
- Wanzenböck, I., & Frenken, K. (2018). The subsidiarity principle: Turning challenge-oriented innovation policy on its head. Papers in Evolutionary Economic Geography, 18.06. Utrecht University.
- Whittle, A., & Kogler, D. (2020). Related to what? Reviewing the literature on technological relatedness: Where we are now and where can we go? Papers in Regional Science, 99(1), 97–113. https://doi.org/10.1111/pirs.12481
- Whittle, A., Lengyel, B., & Kogler, D. (2020). Understanding regional branching-knowledge diversification via inventor collaboration networks. Papers in Evolutionary Economic Geography #20.06. Utrecht University.
