
 ?Mathematical formulae have been encoded as MathML and are displayed in this HTML version using MathJax in order to improve their display. Uncheck the box to turn MathJax off. This feature requires Javascript. Click on a formula to zoom.
ABSTRACT
This paper addresses the gaps in understanding green regional path development and the role of firm-level agency in driving regional green transitions. By analysing a large patent dataset covering 30 years, we provide a systematic account of green regional path development in 70 regions across four Nordic countries. We identify six types of green path development – extension, stagnation, extinction, diversification, renewal and creation – and explore how different types of organisations – incumbents and new entrants – contribute to these paths. We show that regions often have multiple green paths, and the dominant types are mostly driven by incumbents.
1. INTRODUCTION
The world faces numerous critical environmental challenges rooted in our current production and consumption systems. This calls for an urgent need to understand the underlying mechanisms by which new green industries develop and existing industries become greener. A growing literature focuses on green technological diversification of regions (Barbieri et al., Citation2020; Montresor & Quatraro, Citation2020; Perruchas et al., Citation2020; Santoalha & Boschma, Citation2020; Tanner, Citation2016; van den Berge et al., Citation2020) and finds that pre-existing related green and non-green knowledge bases play a role in explaining where green paths develop (Corradini, Citation2019; Montresor & Quatraro, Citation2020; Santoalha & Boschma, Citation2020; Tanner, Citation2016; van den Berge et al., Citation2020). While the recent literature enhances our understanding of the role of relatedness in green industrial path development, the empirical case studies (e.g., Baumgartinger-Seiringer et al., Citation2022; Jolly & Hansen, Citation2022; Trippl et al., Citation2020) illustrating the phenomenon tend to obscure the nuanced reality of green transitioning happening at the regional level. The selected case studies, despite their ability to describe the process of transition in detail in the specific context, are unable to show how multiple green paths arise, disappear, develop and transform in parallel at the regional level. This paper aims to fill this gap and provide systematic analyses of green regional path development based on a large patent dataset encompassing 30 years. We expand the existing typology of green regional path development with our findings.
In addition to providing a systematic account of green path development at the regional level, we also address the current literature’s lack of attention to the firm-level agency in the regional green transition. Responding to the criticism for overlooking the role of agency − actors, institutions and policy in driving green technology development (Beer et al., Citation2023), a more recent stream of literature began to provide evidence on institutional entrepreneurship and system-level agency (Baumgartinger-Seiringer et al., Citation2022; Beer et al., Citation2023; Bellandi et al., Citation2021; Isaksen et al., Citation2019; Jakobsen et al., Citation2021; Sotarauta et al., Citation2021), which is a collective form of agency that seeks to mould institutions and other conditions in favour of green path development (Sotarauta et al., Citation2021). Although this literature acknowledges the critical role of firm-level agency in green regional path development (Jolly & Hansen, Citation2022; Trippl et al., Citation2020), systematic empirical analysis of the types of firms and what role they play has received little attention (see e.g., Sotarauta et al., Citation2021). The lack of firms in these analyses also led to an oversimplified literature on green regional path development where each region follows one out of four different paths of either extension, diversification, renewal or creation.
We argue that to understand the underlying mechanisms and diversity of green path development at the regional level, one must consider the firm-level agency that is carrying out the activities of transforming knowledge bases, developing new business models, and commercialising the knowledge into new products and services. Firms follow different strategies and push different technological trajectories of which some might even be competing, which support different types of regional path developments. For example, incumbents might support green path diversification, while new entrants might push for green path creation. Furthermore, regions might have begun on a particular regional path that could stagnate or even become extinct. Therefore, we argue that green regional path development depends on the relative prominence of the different types of green path developments in a region.
This paper analyses six types of green regional path development – extension, stagnation, extinction, diversification, renewal and creation – and how different types of organisations contribute to these paths. The empirical setting of this study is all 70 regions in four Nordic countries (Denmark, Sweden, Norway and Finland) from 1985 to 2015. We analyse the different paths by investigating the changes in regional industry specialisations in green technologies relative to all 1166 EU NUTS-3 regions.
We find that green transition measured by green patents is highly concentrated in Nordic countries. In the dominant regions, the type of green regional path development largely depends on the actions of incumbents, while regions with a low number of green patents are often dominated by entrants. We also find that regions often have different levels of multiple types of green regional path development. For example, regions can show trajectories of both extension and renewal, where existing green regional technological specialisations are extended, while new green regional technological specialisations emerge supporting the renewal of the green regional path. We also find evidence of the extinction of green regional technological specialisations. Thus, we contribute to the literature on regional path development by showing that green regional path development is best understood as the primary development trajectory in a region, but that there is often evidence of multiple types of green regional path development occurring simultaneously. Furthermore, we add two new types of green regional path development.
The diverse patterns of how incumbents and new entrants move into green technologies and how that supports different types of green regional path development strengthen our argument that uncovering firm-level agency is important for understanding the green transition at the regional level.
In the next section, we will present our typology of green regional path development. We also argue why it is important to account for the role of firm-level agency in understanding the regional path development. Then, we move on to explaining our method and measures before presenting the results of empirical analysis followed by a discussion and conclusions.
2. REGIONAL PATH DEVELOPMENT
In recent decades, there has been a fast-growing interest in understanding the processes by which economic activities emerge, develop and are distributed across space. The evolutionary economic geography (EEG) literature argues that historically produced regional preconditions, such as industrial and technological skills, increase the likelihood for future path development that are related to pre-existing industries (Frenken & Boschma, Citation2007). Relatedness and related variety have become key concepts in explaining regional path development in EEG (Boschma et al., Citation2017). Empirically, numerous studies (see Boschma, Citation2017 for an overview) have shown that relatedness is a powerful explanatory factor for regional path development. Also, in the case of green regional path development, empirical studies have shown that pre-existing related green and non-green knowledge bases help to explain where green paths develop (Corradini, Citation2019; Montresor & Quatraro, Citation2020; Santoalha & Boschma, Citation2020; Tanner, Citation2016; van den Berge et al., Citation2020). While many quantitative studies have confirmed that relatedness is the most common and fundamental principle of regional restructuring, other studies have shown that path development can also rely on knowledge sources that are unrelated to the region's existing industries (Grillitsch et al., Citation2018; Hassink et al., Citation2019; Isaksen & Trippl, Citation2016). These results suggest that the role of relatedness may vary depending on the type of regional path development, and that it is important to understand the underlying micro-mechanisms of restructuring at the regional level.
Another stream of literature around regional innovation systems (RIS) takes an institutional perspective and argues that regions differ in terms of the regional support system for innovation and entrepreneurship, which has implications for the development of new industries (Hassink et al., Citation2019; Isaksen & Trippl, Citation2014). The RIS approach distinguishes between metropolitan, specialised and peripheral regions (Tödtling & Trippl, Citation2005). Because metropolitan regions have diverse resources, such as thick labour markets, R&D active firms and universities, the window for new industries to emerge and grow is more likely to open here than in peripheral regions, without these resources and weak support organisations (Tödtling & Trippl, Citation2005). In specialised regions, resources are often too tightly tied to fulfil the needs of the specialised industry than the needs of new industries.
The RIS approach has also brought attention to the importance of system-level agency (Isaksen et al., Citation2019; Trippl et al., Citation2020) in changing or creating regional conditions to better support new regional industrial paths. In particular, it is argued that new path development requires broader changes to institutions and organisational support systems at multiple spatial levels (Grillitsch & Sotarauta, Citation2020), for example, by creating or protecting markets for emerging green industries (Trippl et al., Citation2020). In addition, the RIS literature has emphasised that firms are typically the primary agents of change and their engagement and dedication to taking advantage of new opportunities are critical for new regional paths to materialise (Jolly & Hansen, Citation2022; Trippl et al., Citation2020). So even though we fully acknowledge the role of system-level agency, following the objective of this paper to contribute to a better understanding of the role different types of firms play across different types of green regional path development, the remainder of this paper will focus on the role of firms.
2.1. Types of green regional path development
The literature on regional path development (e.g., Grillitsch & Hansen, Citation2019; Trippl et al., Citation2020) typically identifies four main types of regional path development, such as the extension of an existing path, diversification or renewal of a path or creation of a new path. Building on this literature, this study distinguishes between six main types of green regional path development: extinction, stagnation, extension, renewal, diversification and creation. We conceptualise the green regional path as represented by the change and development of industries, as proxied by the green technological specialisations in the region. The typology describes the degree of change and restructuring of the regional economy, from continuity (path extension) to higher degrees of change (path diversification and creation).
Depending on the greenness of the existing industry structure, regions have different path development options. The typology distinguishes between regions based on three different parameters. The first parameter is whether the region already has green specialisation in existing industries. If the region already has a green specialisation, the second parameter can be applied to determine whether the green specialisation disappears, stays the same, or grows. Green path extension represents the continued growth of existing green specialisation. Green path extinction happens when the region loses its green specialisation. Path stagnation is the continuation of green specialisation without substantial growth. The third parameter applies when a new green specialisation arises: the new green specialisation can emerge in the existing non-green industry (path renewal), in a new industry that is related to the existing green or non-green industry (path diversification) or in a new industry that is not related to the existing green or non-green industry (path creation). Thus, green path renewal captures processes where existing non-green industries renew themselves in a sustainable direction (e.g., Grillitsch & Hansen, Citation2019). Green path diversification represents the cases where new green specialisation arises in new industries that are related to existing industries, and often involves restructuring that targets markets and new customer needs (Tödtling et al., Citation2014).
Expanding on the literature (e.g., Grillitsch & Hansen, Citation2019; Trippl et al., Citation2020), we argue that regions with existing green specialisation can also experience green regional path diversification, renewal and creation. Regions might have a green industry specialisation that could cross-fertilise the emergence of new green industry specialisations. In other words, if the new specialisations are related to existing green specialisations, this is a sign of green regional path diversification, i.e., a widening of the green transition of the region. Similarly, this widening could also come from renewal by the greening of existing industry specialisations with a focus on supplying similar product markets and customer needs, or from the creation of new green industry specialisations unrelated to both existing green and non-green industries in the region. Finally, regions with existing green specialisations might experience a narrowing of the green regional development path, if some of these specialisations become extinct. The relative strength of all these different trajectories will result in a dominant green regional development path. The different agents in the regions play an important role in shaping these different trajectories.
summarises the path types along the three parameters discussed above: pre-existence of green specialisations (yes or no), how the green specialisation changes (disappears, stays the same or emerges), and in which industries the new green specialisation arises (existing industry, new industry related to an existing industry or new industry unrelated to existing industry). Note that the taxonomy refers to the region-industry level. Consequently, while a region might have one dominant path, it is commonly represented as a mix of different paths across multiple industries.
Table 1. Taxonomy of green development paths at the region-industry level.
2.2. Firm-level agency in green regional path development
Micro-level actions are important for understanding regional path development. By this, we mean the actions taken by individuals or organisations that together shape a collective outcome (Hedstrom & Swedberg, Citation1998). In EEG, firm-based micro-level mechanisms driving economic restructuring operate through various routine replication processes, including firm diversification, spinoffs and labour mobility (Frenken & Boschma, Citation2007).
Prior research in emerging industries has demonstrated that entrepreneurial spinoffs are the driving force behind new regional path development (Klepper, Citation2010). The role new entrants play in new regional path development has also been affirmed by Neffke et al. (Citation2018) who found that new entities such as subsidiaries relocating to a region, are more likely to contribute to the development of new regional paths. In contrast, incumbents tend to maintain and reinforce regional economic development along existing paths through their activities and investments (Neffke et al., Citation2018). Foreign incumbents also tend to support existing paths but may eventually lead to path diversification (Elekes et al., Citation2019). Boschma et al. (Citation2017) and Boschma (Citation2017) argue that niche development occurs in regions without dominant regime actors (i.e., incumbents) and is driven by new entrants. Hence, in the EEG literature, there is a prevailing perception that new entrants drive regional restructuring concerning path creation and path diversification.
Challenging this conventional view, we present several characteristics of green industry development and explain how activities by different types of firms may relate to various types of green development paths. Here, we draw from the literature on technological regimes and differentiate between new entrants and incumbents. This literature argues that the cumulativeness of knowledge, technological opportunities, appropriability regimes and entry barriers leads to distinct patterns of innovation for new entrants (Schumpeter Mark I) and incumbents (Schumpeter Mark II) (Breschi et al., Citation2000; Leoncini et al., Citation2019; Oltra & Saint Jean, Citation2009).
In recent decades, research has focused on the characteristics of green industry development, defined as industries that ‘develop and sell products, solutions or technologies that reduce carbon emissions and pollution, enhance energy and resource efficiency, and prevent the loss of biodiversity and ecosystem services’ (Grillitsch & Hansen, Citation2019, p. 4). This research aims to understand how green technology and industry development differ from non-green innovation. These distinctions manifest in several ways.
First, green technological development tends to be groundbreaking and therefore more resource-intensive. It requires long-term public and private investments that prioritise environment sustainability over the short-sighted returns of investments in a brown-growth economy (Smulders et al., Citation2014). Second, green technological development and innovations have been shown to build upon more complex knowledge bases (Barbieri et al., Citation2020; Barbieri et al., Citation2023). Third, Oltra and Saint Jean (Citation2009) demonstrate that greening existing industries often involves trade-offs between the exploitation of the dominant design and the exploration of alternative greener technological regimes. This can lead to compromises in existing product performance to meet environmental standards (Oltra & Saint Jean, Citation2009). Finally, positive externalities related to the development of green technologies and products are not adequately valued through market mechanisms, potentially leading to underinvestment (Cecere et al., Citation2014).
The first two characteristics of green industry development may provide certain advantages to incumbents over new entrants in transitioning to a green economy. Incumbents often have access to investment resources, broader collaboration networks, and the capacity to work with the complex knowledge bases they have accumulated over time. Cainelli et al. (Citation2015) found that firms’ R&D spending positively correlates with the introduction of environmental innovation. Horbach (Citation2008) demonstrated that collaboration is more crucial for environmental innovation than for other types of innovation. Additionally, incumbents appear to benefit more from the introduction of green technologies. Leoncini et al. (Citation2019) found that older firms are more proficient at translating green patents into employment growth than younger firms. Barbieri et al. (Citation2023) discovered that the development of green technologies is positively linked to the development of interdependent non-green patents. Thus, incumbents play a significant role in green path extension.
However, other actors can also contribute to path extension. For instance, the presence of localised externalities in a specialised green region may attract subsidiaries from incumbents outside the region or spinoffs from incumbents within the region. Recent studies argue that localised knowledge spillovers are crucial for the development of green technologies. Corradini (Citation2019) finds that green technological entry is positively associated with the number of patents, particularly those related to environmental technologies, within the region. Giudici et al. (Citation2019) observed that the number of patents and the presence of high-tech incumbents are positively linked to the creation of cleantech startups in the region. Colombelli and Quatraro (Citation2019) identified a positive relationship between the number of green patents and the emergence of green startups in energy-related technologies. Foreign direct investment has been shown to enhance existing regional specialisations in green technologies (Castellani et al., Citation2022).
However, incumbents may also facilitate the diversification of green regional paths by diversifying into new green technologies based on their technologically related know-how (Steen & Hansen, Citation2014; Tanner, Citation2014). Other micro-level mechanisms involved in green path diversification include branching by spinoffs (Klepper, Citation2010).
Climate change mitigation regulations, which impose sanctions on incumbents in brown industries, motivate firms to invest in greener technologies with a long-term perspective (Oltra & Saint Jean, Citation2009). In the process of path renewal, the accumulated capabilities of incumbents play an important role, although they need to break away from the dominant technological paradigm and adopt new visions and search heuristics (Dosi, Citation1982). An example of renewal is when car producers replace the internal combustion engine (ICE) with an alternative means of propulsion, such as fuel cells or batteries (Oltra & Saint Jean, Citation2009; Tanner, Citation2014). This new green technology is unrelated to the existing technological specialisation in ICE technologies, but incumbents can leverage their complementary assets. However, incumbent car producers might also engage in path diversification by improving the ICE to make it less polluting.
The creation of green regional paths often relies on breakthrough technologies involving new scientific principles, routines and search heuristics. Therefore, the agents of change are typically startups or firms from outside the region (Neffke et al., Citation2018; Trippl et al., Citation2020). Universities and research institutes can play a crucial role in generating the knowledge required for breakthrough inventions (Tanner, Citation2014), as well as in producing knowledge spillovers that support green startups (Giudici et al., Citation2019). However, incumbents could also participate in path creation if they find themselves tied to end-of-the-road polluting products or technologies.
3. METHODOLOGICAL APPROACH
3.1. Patent data
We study green regional path development by analysing green inventive activities (i.e., patents) as a proxy. Patent statistics provide relatively consistent data for analysing technological development in a longitudinal and comparative approach (Perruchas et al., Citation2020) and rich information about green technological development, including actors, locations and technological fields.
Previous research generally indicates that patents are a valid indicator of inventive output, value and utility (Trajtenberg, Citation1990). Yet, it has long been recognised that the technological as well as economic significance of patents varies broadly (Griliches, Citation1998) and that they do not capture the complete account of knowledge production and technological development. Comparing inventive activities across technological fields can also be challenging because of different practices of patenting across fields and over time (Park et al., Citation2005). As a result, interpretations of absolute numbers should be made with care. Therefore, we supplement patent statistics with qualitative analysis of firms’ patent documents, webpages, strategies, annual reports, etc.
3.2. Database, sources and population
We use European Patent Office’s (EPO) PATSTAT database (2022 autumn edition) as our primary source of patent information. We retrieve patents in the period 1985–2015 as this is when we observed a rapid increase in green inventive activity. To ensure commercial relevance, we focus solely on granted patents. Following De Rassenfosse et al. (Citation2013), we only include priority filings, considering only the earliest priority per DOCDB patent family.
In our sample, we include a subset of patents with at least one inventor located in one of the 70 regions in Denmark, Finland, Norway or Sweden. We chose the Nordic countries because they are often considered leaders in the green transition and have a relatively high share of green patents. While these countries have comparable institutional systems, their regional industrial structures differ. This allows for the analysis of various green regional path developments in different countries, while simplifying the interpretation of the data. We assign patents to geographical locations using the inventor instead of applicant addresses to capture the location of inventive activity rather than the location of intellectual property right ownership (Squicciarini et al., Citation2013).Footnote1 While we mainly consider the region of the inventor, we also retrieve fine-grained geographical locations leveraging the global patent geocoding data provided by De Rassenfosse et al. (Citation2019). Patent counts per location are fractionalised by the share of the patent’s inventors in the corresponding location.
We link these patents to industries by linking the patent’s Cooperative Patent Classification (CPC) classifications with the probability of belonging to a certain industry (ISIC Rev.4), following the methodology proposed by Lybbert and Zolas (Citation2014) and Goldschlag et al. (Citation2020). Here, a patent’s industry (ISIC Rev.4, group level) is determined by the technologies (CPC, subclass level) associated with it. The strength of a patent’s association with different industries is calculated as the sum of CPC-industry probabilities divided by the number of CPC classes assigned to the patent. Consequently, a patent can be associated with several industries, and assignees might operate in multiple industries simultaneously. We use the group (3rd) level of the hierarchical ISIC classification, resulting in 238 unique industry classes.
3.3. Identifying green patents
To identify green patents, we use the ‘Climate Change Mitigation Technologies’ (CCMT) classification developed by the EPO, United Nations Environmental Programme and International Centre on Trade and Sustainable Development, with the Y02-Y04S tagging scheme being fully integrated within the CPC (Angelucci et al., Citation2018; Veefkind et al., Citation2012). This scheme allows us to identify CCMT-related green patents by filtering for the corresponding CPC tags. It covers the main categories of energy, greenhouse gases (GHGs) capture, buildings, industry (including agriculture), transport, waste, wastewater management and smart grids (see Table A1 in the Appendix in the online supplemental data).
3.4. Method and measures
Our aim is to identify and classify green development paths of regions based on inventive activity measured with patent data. To do so, we calculate a variety of indicators for all Nordic regions. To increase the robustness and ease the application of the proposed method across European regions, we calculate all comparative indicators (e.g., RCA) based on all European regions.
3.4.1. Specialisation
We measure regional specialisation through the revealed comparative advantage (RCA) index (Balassa, Citation1965). We adapt the RCA to the industry and technology specialisation to capture multiple green paths stemming from a diversified regional industrial and technological structure. Here, the RCA of a region r among a set of regions R in an industry i within a set of industries I is calculated as follows:
An RCA > 1 indicates that a region r is specialised in an industry i, since the industry’s share of the region's patents is higher than the industry’s share in all European regions. We calculate this binary specialisation index (1: RCA > 1; 0: RCA ≤ 1) for all regions and industries, separately for the subsets of green and non-green patents. The RCA index is widely used in the literature as a measure of relative specialisation (e.g., Hidalgo et al., Citation2007; Montresor & Quatraro, Citation2020), but it has some shortcomings. RCA is a measure of strength of an area relative to others and it is not a performance indicator, since every region is specialised in some areas (Laursen, Citation2015). The indicator shows whether the Nordic regions are specialised in the production of green technologies rather than non-green technologies relative to other European regions. Ideally, these new green technologies should assist the green transition in these regions, but the patent data does not show whether these are implemented in the production of goods and if they alter the regional composition of employment. The use of relative specialisation indices allows us to compare green developments across regions of different sizes. However, it also leads to cases where small regions display a green specialisation even though the absolute number of patents is small, and vice versa.
3.4.2. Relatedness
The consideration of how distinct technologies relate to each other has been crucial to explain variations in local technological development (Boschma et al., Citation2015; Petralia et al., Citation2017; Santoalha et al., Citation2021), and the emergence of new industries (Feldman et al., Citation2015; Tanner, Citation2016). To analyse the underlying relationship between technologies (relatedness), we exploit that patents can be assigned to multiple IPC technology classes and consequently, also to ISIC industries. Based on all selected European patents, we derive a symmetrical matrix ‘C’ of co-occurrences of ISIC classes in patents, which we normalise by the cosine index S to avoid overestimating the relatedness of ubiquitous industries (Breschi et al., Citation2003). This normalised relatedness indicator si,j between every pair of industries ‘i’ and ‘j’ is calculated as follows:
The resulting normalised co-occurrence matrix can be visually inspected and analysed by using a network perspective (Hidalgo et al., Citation2007). We construct such a network based on all European patents, which can be interpreted as an industry space with ISIC classes as nodes and their relatedness as edges (see Figure A1 in the Appendix).
3.4.3. Actor type
Most of the analysis is on the meso-level of regions, industries or technologies, but without considering firms as agents of change, possible insights into industry and technology dynamics are limited.
Therefore, we also consider the applicants of Nordic patent applications, particularly to understand whether technological development is driven by incumbents or by new entrants. We classify applicants as incumbents if more than 10 years have passed since their first recorded patent application and they have been granted at least 10 patents. These thresholds are motivated by a balance of the quality of the patent data which has some lags and that we want to distinguish between young firms of which many do not survive and the older and larger incumbents (see also Protogerou et al., Citation2017). By identifying incumbents exclusively on data available in PATSTAT, we avoid further matching procedures with firm databases, which eases scaling and updating of the analysis. However, as a drawback, we can only approximate age by time since the first patent filing, and size by the number of granted patents.
3.5. Identifying green paths
We use the indicators derived from patent data to identify and classify green paths on a regional level. Our goal is to identify the main green path per region. However, in regions with diversified industrial and technological landscapes, it is likely that multiple green paths exist. Therefore, we identify paths on a region-industry level and represent a region’s development as a mix of paths, ranked by the industry’s importance in the region. Here, we assume that meaningful green technology development within a region will be indicated by a regional specialisation, meaning that the share of the region’s green patents within an industry is above the EU NUTS-3 region average. To identify the green regional path development, we follow several steps.
First, for a green path to exist, there needs to be a minimum level of green patenting activity. Since the Nordics tend to be concentrated in terms of population, economic and scientific activity, in some regions no green path might be found. We set a lower bound of a minimum of 25 green patent applications in a region for the 30-year period. This lower bound is reached by all but a few peripheral Finnish and Norwegian regions. Although low, this number of patents should enable the identification of at least meaningful traces of green development paths and avoid some of the limitations of the RCA when dealing with small numbers (Laursen, Citation2015).
Second, we focus on the development of existing green specialisations. Departing from the existing green specialisations in period 1 (1985–2000), we observe whether these are maintained in period 2 (2001–2015). If that is not the case , we conclude that this green specialisation has been abandoned and label the region’s path for this industry to be green path extinction. If the specialisation is maintained, we distinguish the paths by the amount of green patenting in period 2 relative to period 1. If the number of green patents per period increased by less than 10% between period 1 and 2, we label this as green path stagnation. A growth of green patents above 10% in contrast, we interpret as a significant further development of the existing green specialisation, which we call green path extension.
Third, we focus on the development of new green specialisations, meaning the region displays a green specialisation in a certain industry in period 2 but not period 1. Here, we are particularly focused on the new green specialisation’s relatedness to existing green and non-green specialisations in period 1. We consider a 2 × 2 matrix with relatedness to existing non-green industries on the x-axis and relatedness to green specialisations on the y axis, as illustrated in . If the new specialisation is unrelated to both existing green and non-green specialisations (QI), we consider this as unrelated diversification and label it green path creation. All other types of green paths based on new green specialisation are variants of related diversification, where we distinguish between the relatedness to existing green and non-green specialisations. A high relatedness to existing non-green (but not green) specialisations can be interpreted as the greening of an existing industrial specialisation, which we label as green path renewal (QII). Lastly, relatedness to existing green specialisations (QIII–IV), can be interpreted as a branching out of an existing green path, which we label green path diversification. We do not consider separately the relatedness to green as well as non-green specialisations, which we also classify as green diversification.
Figure 1. Types of new specialisation-based green paths.
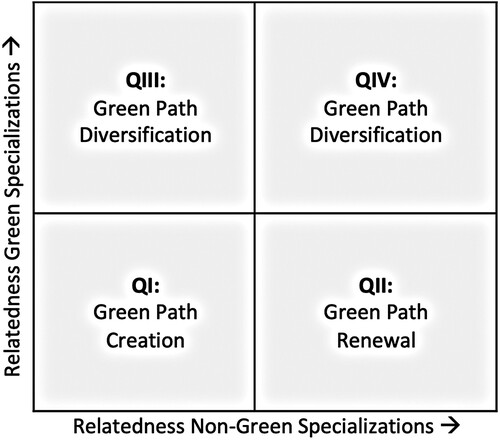
We measure relatedness to green and non-green existing specialisations via the maximum relatedness of the current specialisation i to all previous specialisations. We separate the paths by comparing the achieved value to the mean value across all industries and regions. If the maximum relatedness to an existing non-green industry specialisation is above average, the industry will fall into quadrant II or IV, and for above average relatedness to a green specialisation in quadrant III or IV.Footnote2 The whole classification scheme is summarised in .
Table 2. Operationalisation of green paths (region-industry level).
4. ANALYSIS
4.1. Geography and trends in green technological development
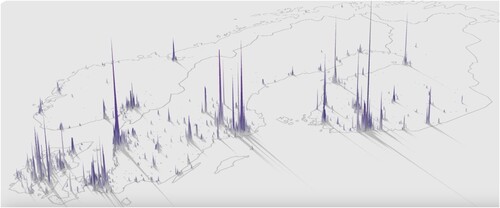
shows the distribution of green patents in the Nordic countries in 2.5 km cells. It can clearly be seen that green patenting activity is not only concentrated in a few regions per country, but also within regions. The map shows a concentration of green patents in the four capital regions, as well as in regions that are home to large incumbents, such as the wind turbine companies Vestas Wind Systems and Siemens Gamesa in the Danish regions Østjylland (DK041) and Vestjylland (DK042) as well as the automobile firm Volvo in Västa Götalands län (SE232) in Sweden.
Figure 2. Geographical distribution of green patents in the Nordics.
Note: Green patenting activity is clustered in 2.5 km cells during the 1985–2015 period.
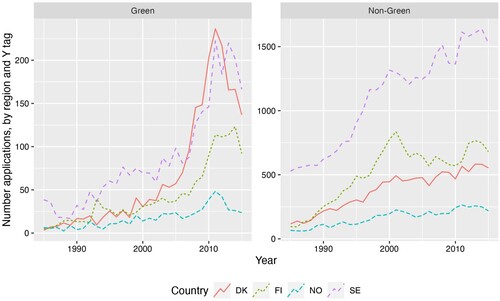
shows the amount of annual green and non-green patents in the four Nordic countries between 1985–2015. We see that green as well as non-green patent applications have been steadily increasing in Denmark, Finland and Sweden, while Norway has not experienced the same growth. While Sweden is far ahead in terms of non-green patent applications, Denmark is in recent years roughly on par with Sweden for green patents.
Figure 3. Development of Nordic green and non-green patents by country.
Note: Numbers are fractionalised by the share of inventors in the corresponding region.
4.2. Identification of green development paths
In our analysis, we first focus on the development of green (and non-green) specialisations in terms of number and relatedness to existing specialisations between period 1 (1985–2000) and period 2 (2001–2015). After doing so on the regional level, we disaggregate our analysis to the region-industry level, where we aim to discover the potential of multiple jointly existing paths within a region. Finally, we depict the composition of different paths per region, where we also focus on the type of firms driving these developments.
4.2.1. Development of specialisations
illustrates the development of the overall number of non-green (x-axis) and green (y-axis) specialisations per region over the two periods. Changes in a region’s position indicate a reconfiguration of specialisation pattern.
Figure 4. Development of the number of non-green and green specialisations in selected Nordic regions.
Note: The dot at the start of the arrow represents the region in period 1 (1985–2000), and the one at the end of the arrow period 2 (2001–2015). Size indicates the number of Y-tagged patent applications in the corresponding period and colour the Hirschman-Herfindahl index of concentration of green patenting across industries.
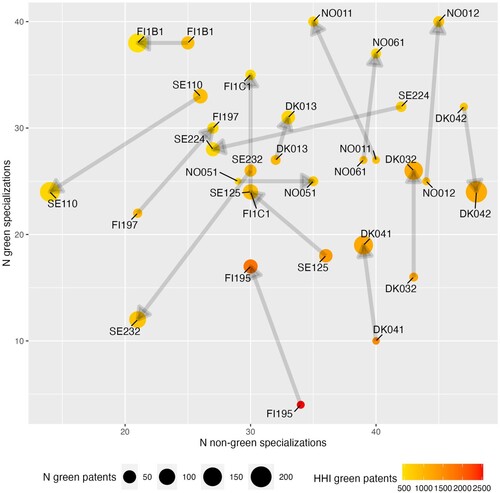
The figure indicates dynamism of specialisation patterns, where most regions change their number of green and non-green specialisations significantly. For most of the regions in the figure (FI195, FI197, FI1C1, DK041, DK032, SE125, NO061, NO011, NO012), the number of green specialisations increase as the concentration decreases. This pattern demonstrates that Nordic regions are gaining relative ‘green’ strength in a larger number of industries compared to the rest of Europe, while the greening effort becomes distributed in different industries.
4.2.2. Emergence of new green specialisations in 2001–2015
This section analyses the relatedness between new green specialisations and existing green and non-green specialisations. These new green specialisations are in some cases a major share of overall green patenting activity, but not in others. A green specialisation is when the industry’s share of the region's patents is higher than the industry’s share in all European regions. The four quadrants in shows the relatedness between new green specialisations and existing green or non-green specialisations in the Nordic regions in 2001–2015.
Figure 5. Relatedness of new green specialisations on a regional level.
Note: For every new specialisation, the maximum relatedness to existing green or non-green specialisations in period 1 are calculated. Average relatedness across all new green specialisations is calculated on regional level. Dashed horizontal and vertical lines indicate the average value across EU regions and industries. The size of the dots indicates the number of green patents in period 2.
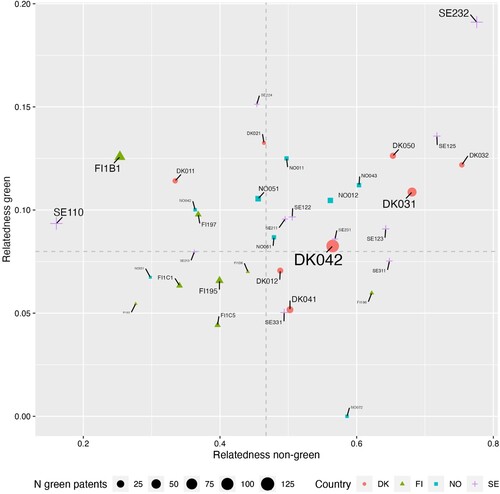
As introduced in , QI with generally low relatedness indicates that the regions’ new specialisations are mainly of the green path creation type, while QII with high relatedness to previous non-green specialisations signals green path renewal, and finally QIII–IV with high green relatedness is associated with green diversification. We again see a diversity of green paths, where some of the regions associate with green path creation (e.g., FI195), green path renewal (e.g., DK041, DK012, SE331), while the regions with the highest number of green patents in new specialisations are mostly pursuing green path diversification (e.g., DK042, DK031). This result is in line with recent research that shows that the development of green technologies benefits from spill-over effects from the development of other green technologies and from related non-green technologies (Barbieri et al., Citation2023).
While informative for the overall tendency of a region, averaging over all new specialisations might blur multiple potential joint developments. Consequently, in we illustrate the relatedness of all new specialisations per region. For the sake of readability, only the top four regions per Nordic country in terms of green patent applications are shown.
Figure 6. Relatedness of new green specialisations on a region-industry level.
Note: For every new specialisation, the maximum relatedness to existing green or non-green specialisation in period 1 are calculated. Dashed horizontal and vertical lines indicate the average value across EU regions and industries.
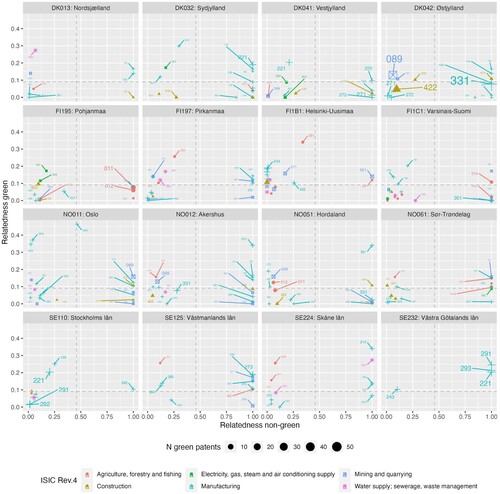
We indeed see multiple possible configurations unfolding across regions and industries. While new green industry specialisations in some regions are all aligned and consistent with one path (e.g., SE232 with almost all specialisations in QIII, indicating green diversification), others display dynamics associated with multiple paths jointly (e.g., DK042, which shows activities in QI associated with green path creation, but also green renewal in QII and green diversification in QIII–IV).
4.2.3. Identified green path composition
Changes in existing green specialisations are also associated with different green paths by a declining (green extinction), maintaining (green stagnation), or increasing (green extension) levels of activity. To provide a complete overview over green development in the Nordic regions, in we report the number of patents associated with every path. For the sake of readability, we focus on the four main regions per country (values for all regions are reported in Table A2 in the Appendix).
Figure 7. Path composition by regions 2001–2015.
Note: Y axis indicates the number of patents in the region associated with the particular green path.
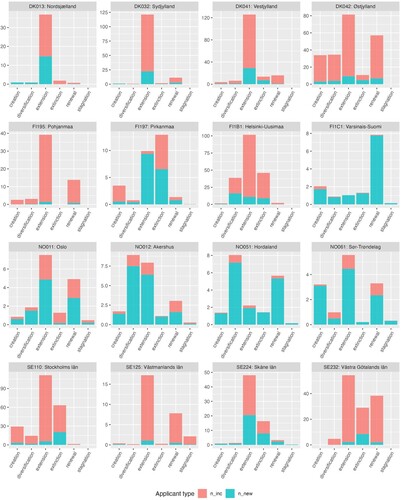
shows that multiple trajectories of green regional path development can be found in the different regions. In regions with many green patents, incumbents account for the majority, while entrants typically dominate in regions with fewer green patents. In the Norwegian regions, for example startups push green regional path renewal by drawing on the existing competencies within oil and gas to patent within green technologies, such as the parent spinoff Aker Engineering Technology (NO012) that has patents related to carbon capture and storage. Since new entrepreneurial firms often fail, it is not surprising to see that many new firms are involved in the extinction path.
A distinctive example of path extension is Østjylland (DK042) and Vestjylland (DK041), with their decades-long green path in the wind-power industry. Here incumbents play a significant role with the wind turbine producer, Vestas Wind Systems A/S as the main driving force (see Table A2). However, entrants are also involved in path extension, for example Envision Energy APS, a subsidiary of a large Chinese wind-turbine producer. This is similar to the findings by Castellani et al. (Citation2022), who found that FDI often supported path extensions and opposite to the arguments by Neffke et al. (Citation2018), who argue that these entrants often support path creation.
The Västra Götaland region (SE232) experiences both green path extension and extinction. This is related to the region’s historic strength in the automotive and aerospace industries and incumbents, such as Volvo and GKN Aerospace Sweden dominating the green patenting. The green regional path development is extension, which could be a result of these incumbents process’ of replacing core technologies with greener alternatives.
Green regional path diversification is prominent in Helsinki-Uusimaa (FI1B1), where the large incumbent Nokia is involved in extensions of the green path of reducing energy consumption in communication networks as well as diversifying into related green technologies.
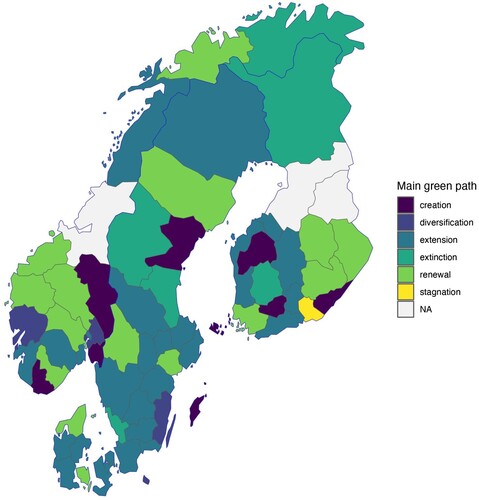
provides an overview of the main green path of all Nordic regions. While some nuances from the earlier figures are hidden by collapsing regional development to one main path per region, it can provide a high-level overview of the diverse green regional path development.
Figure 8. Map of main green path of Nordic regions 2001–2015.
Note: Excluding NO0B1, NO0B2 for visualisation purposes. NA (grey areas) indicates the absence of enough patents to meaningfully determine a potential green path.
5. DISCUSSION
This paper systematically analyses 70 Nordic regions to shed light on the six types of green path development and firm-level agency observed. By conceptualising path development through the distinction between regions with and without pre-existing green specialisations, we argue that the typology for green regional path development should be expanded to include path stagnation and path extinction. Our empirical analyses supports our argument and demonstrates that all six types of path development are observed among the 70 regions. While path stagnation and extinction are seldom the dominant path in the regions, they are observed to some extent in 45 and 65 regions, respectively. By paying attention to the multiplicity of path types in each region, we also make the case that the discussion on regional green transition should be more nuanced, acknowledging that there can be different forces driving the green transition. Therefore, it is necessary to analyse the changes in green specialisations at the region-industry level.
Our analysis of firm-agency reveals that incumbents are key actors in most regions with a high level of patenting. While their contribution varies across regions, it is clear that incumbents not only pursue continuity, but their patenting also leads to green regional path diversification and renewal. Contrary to the conventional view that incumbents simply reinforce the existing economic structure (Neffke et al., Citation2018), some incumbents, such as Volvo (SE232) and GKN Aerospace Sweden (SE232), show signs of breaking with the potential ‘lock-in’ to non-green technological paradigms. Hence, incumbents are important for the understanding of a substantial part of green technological development in the Nordic regions. This result contrasts with the conventional understanding that new entrants, such as startups and spinoffs, are the main drivers of emerging industry development (e.g., Boschma et al., Citation2017). However, future econometric studies are needed to analyse the causal relationship.
A closer look at incumbents shows that they are involved in diverse development paths. For example, Vestas (DK042) drives path extension based on an existing specialisation, but it is also involved in diversification into offshore wind. In this case, the incumbents are deepening and widening the technological knowledge in the region. Conversely, firms like Volvo (SE232) and Wärtsilä (FI195) find themselves in ‘dirty’ industries, where regulations are being tightened to reduce environmental damage. These firms are pressured to pursue green technologies to a greater degree to meet current or expected future demand. When developing green technologies, Nordic incumbents are involved in path extension, -renewal, and -diversification building on varying degrees of related technological competences. However, we also find incumbent activities that lead to path extinction. In regions with fewer patents, we see that new entrants account for a larger share of green patents and thereby contribute more to path development. This is especially the case for Norwegian regions, where they contribute to various path types. Outside the Norwegian regions, new entrants are important for path extension as in Nordsjælland (DK013), Vestjylland (DK41), Pirkanmaa (FI197) and Skåne (SE224). Since new entrepreneurial firms often fail, it is not surprising to see that they are involved in the extinction path. New entrants’ contributions to path extension, on the other hand, suggests that the existing industry structure induce localised learning and generates knowledge spillovers that support the entry of new actors in green path development (Colombelli & Quatraro, Citation2019; Corradini, Citation2019). In contrast to the existing literature, which points out that new entrants are likely to widen the scope of technological development with higher degrees of unrelated knowledge combinations (Neffke et al., Citation2018), our analysis shows that they also extend the current path with related knowledge.
Regarding the types of regions, we observe that metropolitan regions do not show a clear pattern in terms of the dominant firm-level agency. While one metropolitan region (SE110) has path development dominated by incumbents, some other metropolitan regions (DK013 and NO011) have path development with contributions from new entrants. The path types in metropolitan regions are diverse, with path creation, extinction, extension, diversification and renewal observed across the regions. Contrary to the existing RIS literature, we do not find strong evidence that metropolitan regions are better equipped to facilitate new green path creation than peripheral regions.
6. CONCLUSION
In this paper we develop a typology of six main types of green regional path development, ranging from path extension to path creation, based on the greenness of the existing industry structure and the degree of change in the regional economy. This typology enables the systematic mapping of geographies according to their composition of industry specific green development paths based on patent data.
In most Nordic regions, multiple types of green path development coexist with varying degrees of dominance. By focusing on the agents driving technological change, we better understand the multiplicity and complexity of green regional path development, which is partly driven by organisational-level strategies. These insights are valuable for fostering green technological development in the region. Isaksen et al. (Citation2019) argue that new growth paths require both firm-level agency and system-level agency to transform the system settings to support structural change. Our results suggest that system-level agents should be aware of the multiple paths that coexist in the region and provide suitable system conditions to facilitate the transition efforts of the various types of firms engaged in structural change. This is also an important area for future research.
Additionally, our results challenge the common belief that new entrants are the driving force behind new regional path development, especially in the case of green industry development, which tends to be more resource-demanding and built on more complex knowledge bases (Barbieri et al., Citation2020; Barbieri et al., Citation2023). Incumbents may have advantages over new entrants in developing green technologies, such as access to investment resources and accumulated knowledge bases. However, they may also face trade-offs between exploiting existing technologies and exploring alternative, greener technologies. Incumbents are also under pressure to comply with increasingly stringent climate change regulations, which may explain their relatively high contribution to green path development.
With regard to the interplay between the agency and technological development in fostering regional green path development, there is much more to be explored. Our focus has been to provide a systematic empirical analysis of identifying various green path types at the regional level and highlighting the role of incumbents and entrants in path development.
While our analysis remains exploratory and descriptive, the analytic workflow described and developed in this paper, as well as the resulting dataset of regional green specialisations and development paths provides the foundation for more thorough econometric investigations and the isolation of causal effects. All code to reproduce our analysis, as well as the resulting datasets can be accessed under https://github.com/daniel-hain/paper_2022_green_regional_path. Our database, which spans three decades, can be utilised for econometric analyses to identify statistically meaningful relationships between various types of agencies, green technology development and regional path development, as well as for further exploratory studies to distil patterns of green regional path development. We particularly suggest two promising avenues for future research utilising the provided dataset. First, the drivers of initial and continuous green path development warrant further econometric investigation. Possible mechanisms that make regions more likely to create or expand green technological development paths might be found in the configuration of the historical local knowledge base, the collaboration patterns of firms (Christensen et al., Citation2019), or regional investments (Christensen & Hain, Citation2017). Second, data-driven methods, such as clustering techniques, can be used to distil insights on general patterns of green path development and inform the creation of taxonomies of green regional development.
Another promising avenue of future research is a more fine-grained analysis of the longitudinal component of the present analysis. While we limit ourselves to a two-period comparison for simplicity, a more continuous assessment of development paths would allow us to measure, for instance, the stability and volatility of regional development paths. Likewise, it would allow the development of further taxonomies and groupings with respect to typical regional development patterns over time.
While our analysis of patent data provides an in-depth understanding of the green transition from the technological perspective, it does not capture all regional aspects of the green transition, nor any environmentally derived effects of the technological development nor the role of institutions and policy (Jolly & Hansen, Citation2022). We need to be cautious in interpreting the results of the study, as green transition efforts can be made outside the technological sphere, just as patented technologies may not be actively exploited. Lastly, our analysis is less attentive to more incremental and smaller-scale technological development, as technologies of this sort are less patentable due to the high costs of patenting.
Supplemental Material
Download PDF (422.3 KB)DISCLOSURE STATEMENT
No potential conflict of interest was reported by the authors.
Additional information
Funding
Notes
1. For harmonisation and regionalisation of patents we use further standard tools from the OECD and Eurostat: the REGPAT database (OECD, Citation2020b) was used to improve regionalisation and the HAN database (OECD, Citation2020a) and EEE-PPAT (EPO, Citation2020) were used during name-harmonisation.
2. Notice the relatedness to green as well as non-green specialisations is calculated based on the maximum relatedness to one rather than the average relatedness to all existing specialisations. Since a region might display several heterogeneous specialisations, this guarantees that closeness of a new specialisation to any of the existing ones will be recognised, even though it is unrelated to other specialisations in the region.
REFERENCES
- Angelucci, S., Hurtado-Albir, F. J., & Volpe, A. (2018). Supporting global initiatives on climate change: The EPO’s “Y02-Y04S” tagging scheme. World Patent Information, 54, S85–S92. https://doi.org/10.1016/j.wpi.2017.04.006
- Balassa, B. (1965). Trade liberalisation and “revealed” comparative advantage. The Manchester School, 33(2), 99–123. https://doi.org/10.1111/j.1467-9957.1965.tb00050.x
- Barbieri, N., Marzucchi, A., & Rizzo, U. (2023). Green technologies, interdependencies, and policy. Journal of Environmental Economics and Management, 118, 102791. https://doi.org/10.1016/j.jeem.2023.102791
- Barbieri, N., Perruchas, F., & Consoli, D. (2020). Specialization, diversification, and environmental technology life cycle. Economic Geography, 96(2), 161–186. https://doi.org/10.1080/00130095.2020.1721279
- Baumgartinger-Seiringer, S., Fuenfschilling, L., Miörner, J., & Trippl, M. (2022). Reconsidering regional structural conditions for industrial renewal. Regional Studies, 56(4), 579–591. https://doi.org/10.1080/00343404.2021.1984419
- Beer, A., Barnes, T., & Horne, S. (2023). Place-based industrial strategy and economic trajectory: Advancing agency-based approaches. Regional Studies, 57(6), 984–997. https://doi.org/10.1080/00343404.2021.1947485
- Bellandi, M., Plechero, M., & Santini, E. (2021). Forms of place leadership in local productive systems: From endogenous rerouting to deliberate resistance to change. Regional Studies, 55(7), 1327–1336. https://doi.org/10.1080/00343404.2021.1896696
- Boschma, R. (2017). Relatedness as driver of regional diversification: A research agenda. Regional Studies, 51(3), 351–364. https://doi.org/10.1080/00343404.2016.1254767
- Boschma, R., Balland, P. A., & Kogler, D. F. (2015). Relatedness and technological change in cities: The rise and fall of technological knowledge in US metropolitan areas from 1981 to 2010. Industrial and Corporate Change, 24(1), 223–250. https://doi.org/10.1093/icc/dtu012
- Boschma, R., Coenen, L., Frenken, K., & Truffer, B. (2017). Towards a theory of regional diversification: Combining insights from evolutionary economic geography and transition studies. Regional Studies, 51(1), 31–45. https://doi.org/10.1080/00343404.2016.1258460
- Breschi, S., Lissoni, F., & Malerba, F. (2003). Knowledge-relatedness in firm technological diversification. Research Policy, 32(1), 69–87. https://doi.org/10.1016/S0048-7333(02)00004-5
- Breschi, S., Malerba, F., & Orsenigo, L. (2000). Technological regimes and Schumpeterian patterns of innovation. The Economic Journal, 110(463), 388–410. https://doi.org/10.1111/1468-0297.00530
- Cainelli, G., De Marchi, V., & Grandinetti, R. (2015). Does the development of environmental innovation require different resources? Evidence from Spanish manufacturing firms. Journal of Cleaner Production, 94, 211–220. https://doi.org/10.1016/j.jclepro.2015.02.008
- Castellani, D., Marin, G., Montresor, S., & Zanfei, A. (2022). Greenfield foreign direct investments and regional environmental technologies. Research Policy, 51(1), 104405. https://doi.org/10.1016/j.respol.2021.104405
- Cecere, G., Corrocher, N., Gossart, C., & Ozman, M. (2014). Lock-in and path dependence: An evolutionary approach to eco-innovations. Journal of Evolutionary Economics, 24(5), 1037–1065. https://doi.org/10.1007/s00191-014-0381-5
- Christensen, J. L., & Hain, D. S. (2017). Knowing where to go: The knowledge foundation for investments in renewable energy. Energy Research & Social Science, 25, 124–133. https://doi.org/10.1016/j.erss.2016.12.025
- Christensen, J. L., Hain, D. S., & Nogueira, L. A. (2019). Joining forces: Collaboration patterns and performance of renewable energy innovators. Small Business Economics, 52(4), 793–814. https://doi.org/10.1007/s11187-017-9932-0
- Colombelli, A., & Quatraro, F. (2019). Green start-ups and local knowledge spillovers from clean and dirty technologies. Small Business Economics, 52(4), 773–792. https://doi.org/10.1007/s11187-017-9934-y
- Corradini, C. (2019). Location determinants of green technological entry: Evidence from European regions. Small Business Economics, 52(4), 845–858. https://doi.org/10.1007/s11187-017-9938-7
- De Rassenfosse, G., Dernis, H., Guellec, D., Picci, L., & De La Potterie, B. V. P. (2013). The worldwide count of priority patents: A new indicator of inventive activity. Research Policy, 42(3), 720–737. https://doi.org/10.1016/j.respol.2012.11.002
- De Rassenfosse, G., Kozak, J., & Seliger, F. (2019). Geocoding of worldwide patent data. Scientific Data, 6(1), 260. https://doi.org/10.1038/s41597-019-0264-6
- Dosi, G. (1982). Technological paradigms and technological trajectories. Research Policy, 11(3), 147–162. https://doi.org/10.1016/0048-7333(82)90016-6
- Elekes, Z., Boschma, R., & Lengyel, B. (2019). Foreign-owned firms as agents of structural change in regions. Regional Studies, 53(11), 1603–1613. https://doi.org/10.1080/00343404.2019.1596254
- EPO. (2020). ‘EEE-PPAT: ECOOM-EUROSTAT-EPO PATSTAT Person Augmented Table’.
- Feldman, M. P., Kogler, D. F., & Rigby, D. L. (2015). rKnowledge: The spatial diffusion and adoption of rDNA methods. Regional Studies, 49(5), 798–817. https://doi.org/10.1080/00343404.2014.980799
- Frenken, K., & Boschma, R. (2007). A theoretical framework for evolutionary economic geography: Industrial dynamics and urban growth as a branching process. Journal of Economic Geography, 7(5), 635–649. https://doi.org/10.1093/jeg/lbm018
- Giudici, G., Guerini, M., & Rossi-Lamastra, C. (2019). The creation of cleantech startups at the local level: The role of knowledge availability and environmental awareness. Small Business Economics, 52(4), 815–830. https://doi.org/10.1007/s11187-017-9936-9
- Goldschlag, N., Lybbert, T. J., & Zolas, N. J. (2020). Tracking the technological composition of industries with algorithmic patent concordances. Economics of Innovation and New Technology, 29(6), 582-602.
- Griliches, Z. (1998). Patent statistics as economic indicators: A survey. In Z. Griliches (Ed.), R&D and productivity: The econometric evidence (pp. 287–343). University of Chicago Press.
- Grillitsch, M., Asheim, B., & Trippl, M. (2018). Unrelated knowledge combinations: The unexplored potential for regional industrial path development. Cambridge Journal of Regions, Economy and Society, 11(2), 257–274. https://doi.org/10.1093/cjres/rsy012
- Grillitsch, M., & Hansen, T. (2019). Green industry development in different types of regions. European Planning Studies, 27(11), 2163–2183. https://doi.org/10.1080/09654313.2019.1648385
- Grillitsch, M., & Sotarauta, M. (2020). Trinity of change agency, regional development paths and opportunity spaces. Progress in Human Geography, 44(4), 704–723. https://doi.org/10.1177/0309132519853870
- Hassink, R., Isaksen, A., & Trippl, M. (2019). Towards a comprehensive understanding of new regional industrial path development. Regional Studies, 53(11), 1636–1645. https://doi.org/10.1080/00343404.2019.1566704
- Hedstrom, P., & Swedberg, R. (1998). Social mechanisms: An introductory essay. In P. Hedstrom, & R. Swedberg (Eds.), Social mechanisms: An analytical approach to social theory (pp. 1–30). Cambridge University Press.
- Hidalgo, C. A., Klinger, B., Barabási, A. L., & Hausmann, R. (2007). The product space conditions the development of nations. Science, 317(5837), 482–487. https://doi.org/10.1126/science.1144581
- Horbach, J. (2008). Determinants of environmental innovation—new evidence from German panel data sources. Research Policy, 37(1), 163–173. https://doi.org/10.1016/j.respol.2007.08.006
- Isaksen, A., Jakobsen, S. E., Njøs, R., & Normann, R. (2019). Regional industrial restructuring resulting from individual and system agency. Innovation: The European Journal of Social Science Research, 32(1), 48–65. https://doi.org/10.1080/13511610.2018.1496322
- Isaksen, A., & Trippl, M. (2014). Regional industrial path development in different regional innovation systems: A conceptual analysis, Papers in Innovation Studies from Lund University, CIRCLE.
- Isaksen, A., & Trippl, M. (2016). Path development in different regional innovation systems: A conceptual analysis. In M. Davide Parrilli, & A. R.-P. Rune Dahl Fitjar (Eds.), Innovation drivers and regional innovation strategies (pp. 66–84). Routledge.
- Jakobsen, S. E., Uyarra, E., Njøs, R., & Fløysand, A. (2021). Policy action for green restructuring in specialized industrial regions. European Urban and Regional Studies 29(3), 312–331. https://doi.org/10.1177/09697764211049116
- Jolly, S., & Hansen, T. (2022). Industry legitimacy: Bright and dark phases in regional industry path development. Regional Studies, 56(4), 630–643. https://doi.org/10.1080/00343404.2020.1861236
- Klepper, S. (2010). The origin and growth of industry clusters: The making of Silicon Valley and Detroit. Journal of Urban Economics, 67(1), 15–32. https://doi.org/10.1016/j.jue.2009.09.004
- Laursen, K. (2015). Revealed comparative advantage and the alternatives as measures of international specialization. Eurasian Business Review, 5(1), 99–115. https://doi.org/10.1007/s40821-015-0017-1
- Leoncini, R., Marzucchi, A., Montresor, S., Rentocchini, F., & Rizzo, U. (2019). Better late than never: The interplay between green technology and age for firm growth. Small Business Economics, 52(4), 891–904. https://doi.org/10.1007/s11187-017-9939-6
- Lybbert, T. J., & Zolas, N. J. (2014). Getting patents and economic data to speak to each other: An ‘algorithmic links with probabilities’ approach for joint analyses of patenting and economic activity. Research Policy, 43(3), 530–542. https://doi.org/10.1016/j.respol.2013.09.001
- Montresor, S., & Quatraro, F. (2020). Green technologies and smart specialisation strategies: A European patent-based analysis of the intertwining of technological relatedness and key enabling technologies. Regional Studies, 54(10), 1354–1365. https://doi.org/10.1080/00343404.2019.1648784
- Neffke, F., Hartog, M., Boschma, R., & Henning, M. (2018). Agents of structural change: The role of firms and entrepreneurs in regional diversification. Economic Geography, 94(1), 23–48. https://doi.org/10.1080/00130095.2017.1391691
- OECD. (2020a). OECD HAN database.
- OECD. (2020b). OECD REGPAT database.
- Oltra, V., & Saint Jean, M. (2009). Sectoral systems of environmental innovation: An application to the French automotive industry. Technological Forecasting and Social Change, 76(4), 567–583. https://doi.org/10.1016/j.techfore.2008.03.025
- Park, Y., Yoon, B., & Lee, S. (2005). The idiosyncrasy and dynamism of technological innovation across industries: Patent citation analysis. Technology in Society, 27(4), 471–485. https://doi.org/10.1016/j.techsoc.2005.08.003
- Perruchas, F., Consoli, D., & Barbieri, N. (2020). Specialisation, diversification and the ladder of green technology development. Research Policy, 49(3), 103922. https://doi.org/10.1016/j.respol.2020.103922
- Petralia, S., Balland, P. A., & Morrison, A. (2017). Climbing the ladder of technological development. Research Policy, 46(5), 956–969. https://doi.org/10.1016/j.respol.2017.03.012
- Protogerou, A., Caloghirou, Y., & Vonortas, N. S. (2017). Determinants of young firms’ innovative performance: Empirical evidence from Europe. Research Policy, 46(7), 1312–1326. https://doi.org/10.1016/j.respol.2017.05.011
- Santoalha, A., & Boschma, R. (2020). Diversifying in green technologies in European regions: Does political support matter? Regional Studies, 55(2), 82–195.
- Santoalha, A., Consoli, D., & Castellacci, F. (2021). Digital skills, relatedness and green diversification: A study of European regions. Research Policy, 50(9), 104340. https://doi.org/10.1016/j.respol.2021.104340
- Smulders, S., Toman, M., & Withagen, C. (2014). Growth theory and “green growth”’. Oxford Review of Economic Policy, 30(3), 423–446. https://doi.org/10.1093/oxrep/gru027
- Sotarauta, M., Suvinen, N., Jolly, S., & Hansen, T. (2021). The many roles of change agency in the game of green path development in the north. European Urban and Regional Studies, 28(2), 92–11. https://doi.org/10.1177/0969776420944995
- Squicciarini, M., Dernis, H., & Criscuolo, C. (2013). Measuring patent quality: Indicators of technological and economic value, OECD science, Technology and Industry Working Papers, No. 2013/03, OECD Publishing, Paris.
- Steen, M., & Hansen, G. H. (2014). Same sea, different ponds: Cross-sectorial knowledge spillovers in the north sea. European Planning Studies, 22(10), 2030–2049. https://doi.org/10.1080/09654313.2013.814622
- Tanner, A. N. (2014). Regional branching reconsidered: Emergence of the fuel cell industry in European regions. Economic Geography, 90(4), 403–427. https://doi.org/10.1111/ecge.12055
- Tanner, A. N. (2016). The emergence of new technology-based industries: The case of fuel cells and its technological relatedness to regional knowledge bases. Journal of Economic Geography, 16(3), 611–635. https://doi.org/10.1093/jeg/lbv011
- Tödtling, F., Höglinger, C., Sinozic, T., & Auer, A. (2014). Factors for the emergence and growth of environmental technology industries in upper Austria. Mitteilungen der Österreichischen Geographischen Gesellschaft, 156, 1–25.
- Tödtling, F., & Trippl, M. (2005). One size fits all? Research Policy, 34(8), 1203–1219. https://doi.org/10.1016/j.respol.2005.01.018
- Trajtenberg, M. (1990). A penny for your quotes: Patent citations and the value of innovations. The Rand Journal of Economics, 21 (1), 172–187. https://doi.org/10.2307/2555502
- Trippl, M., Baumgartinger-Seiringer, S., Frangenheim, A., Isaksen, A., & Rypestøl, J. O. (2020). Unravelling green regional industrial path development: Regional preconditions, asset modification and agency. Geoforum, 111, 189–197. https://doi.org/10.1016/j.geoforum.2020.02.016
- van den Berge, M., Weterings, A., & Alkemade, F. (2020). Do existing regional specialisations stimulate or hinder diversification into cleantech? Environmental Innovation and Societal Transitions, 35, 185–201. https://doi.org/10.1016/j.eist.2019.10.002
- Veefkind, V., Hurtado-Albir, J., Angelucci, S., Karachalios, K., & Thumm, N. (2012). A new EPO classification scheme for climate change mitigation technologies. World Patent Information, 34(2), 106–111. https://doi.org/10.1016/j.wpi.2011.12.004