
Abstract
Background: Dietary recommendations in inflammatory bowel disease (IBD) are inconclusive, and patients may follow restrictive diets with increased risk of malnutrition. The aim of this study was to compare dietary intakes and nutritional status in men and women with newly diagnosed IBD with a general population sample, and to investigate whether intakes were in line with the Nordic Nutrition Recommendations. Methods: This was a cross-sectional study including adults≥ 40 years with IBD from the Inflammatory Bowel Disease in South-Eastern Norway (IBSEN) III cohort study. A validated food frequency questionnaire (FFQ) was used in dietary data collection, and a sample from the seventh survey of the Tromsø Study was included as a comparison group. Results: A total of 227 men and women with IBD were included. IBD patients had higher intake of grain products, sweetened beverages, energy, fat and polyunsaturated fat (PUFA), but lower intake of dairy products, alcohol and iodine compared to adults from the comparison sample (p < 0.01). Intakes of saturated fat and carbohydrates in both genders, and vitamin D in women were not within recommended levels. Anemia and hypoalbuminemia were more prevalent in IBD patients than in the comparison sample. Conclusions: Dietary intakes in newly diagnosed IBD patients were mostly in line with Nordic Nutrition Recommendations. Higher proportion of IBD patients exceeded recommended allowances of fat and added sugar than the comparison sample. Insufficient micronutrient intake, anemia and hypoalbuminemia are present challenges in IBD patients that require monitoring.
KEY MESSAGES
Self-prescribed dietary restrictions in patients with inflammatory bowel disease (IBD) due to inconclusive dietary guidance may influence their risk of malnutrition. Comprehensive assessment of both dietary intake and nutritional status as early as time of diagnosis may help identify challenges in this patient group and implement appropriate interventions.
Introduction
There is a huge interest among patients and health professionals to identify beneficial dietary interventions in the management of inflammatory bowel disease (IBD) [Citation1]. Recently, some recommendations have emerged, but evidence supporting them is inadequate leaving patients unsure and frustrated. A study on dietary behavior in IBD reported that adults with Crohn’s disease (CD) and ulcerative colitis (UC) believe dietary factors could worsen their symptoms and trigger disease relapse, hence about two-thirds of them avoided one or more food items [Citation2].
Restrictive diets over time may result in inadequate food intake and aggravate the risk of malnutrition posed by inflammation-related factors such as malabsorption, loss of nutrients and medical interactions [Citation3,Citation4]. Underweight and nutrient deficiencies are well-documented features of IBD, frequently occurring in newly diagnosed patients and during active disease [Citation4,Citation5]. However, this picture is changing as the prevalence of obesity (15–40%) in IBD patients is increasing [Citation6].
Both under- and over-nutrition have been associated with raised health costs due to risk of complications, hospitalizations and reduced treatment response [Citation3,Citation6]. Thus, it is of interest to assess dietary intake and nutritional status in newly diagnosed IBD patients to quantify possible challenges. This can help optimize patient’s nutritional status, improve the quality of life and develop future dietary interventions.
Currently, data on dietary intake and nutritional status in IBD from the time of diagnosis are sparse [Citation5,Citation7], especially from Norway. Dietary habits differ across countries, and findings from different populations may not be directly comparable. Therefore, the aim of this study was to compare 1) intakes of energy, macro and micronutrients, and food groups and 2) nutritional status in women and men with newly diagnosed IBD with a general population sample. Dietary intakes were also compared with the Nordic Nutrition Recommendations 2012 (NNR2012).
Materials and methods
Study population
This is a cross-sectional study of dietary intakes and nutritional status in patients with newly diagnosed IBD from the IBSEN III (Inflammatory Bowel Disease in South-Eastern Norway) study. The IBSEN III study is a large (N = 2168) population-based inception cohort study conducted during the period of 1 January 2017 to 31 December 2019 [Citation8]. Participants from both genders and all age groups with suspected symptoms in accordance with IBD were invited and recruited through general practitioners, private centers and hospitals in the Southeastern health region of Norway [Citation8].
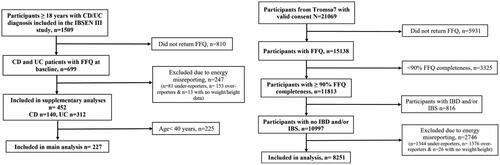
Exclusion criteria for this study were 1) No IBD diagnosis, 2) lacking dietary data, 3) implausible energy reporting and 4) age < 40 years (). Age limitation was included to facilitate comparability to a sample (n = 8251) from the Norwegian general population: the 7th survey of the Tromsø Study (Tromsø7), where only adults ≥ 40 years were included [Citation9]. The Tromsø Study is a large ongoing population-based cohort study with seven surveys to date. In Tromsø7, all inhabitants of Tromsø municipality in Norway were invited, of which 65% attended (N = 21,083) during 14 March 2015 to 31 October 2016 [Citation9]. Since we did not find any notable differences in diet between CD and UC, we combined them into one group to increase sample size and statistical power. In addition to the main analysis, we performed a Supplementary analysis including all IBD patients (n = 452, CD n = 140 and UC n = 312) regardless of age to utilize all available data, and assess any possible differences from the main analysis.
Figure 1. Flow chart of the exclusion and inclusion criteria for IBD patients from the IBSEN III study and the Tromsø7 sample. IBSEN: Inflammatory Bowel Disease in South-Eastern Norway; CD: Crohn’s disease; UC: ulcerative colitis; FFQ: food frequency questionnaire; IBD: inflammatory bowel disease; IBS: irritable bowel syndrome.
Ethical considerations
Both the IBSEN III study and Tromsø7 have been approved by The Regional Committee for Medical and Health Research Ethics in South-Eastern and Northern Norway (reference: 2015/946 and 2014/940, respectively). The IBSEN III study was also registered in clinicaltrials.gov (NCT02727959). A signed consent was obtained from participants in both studies prior to inclusion.
Data collection
Dietary data
During inclusion, all adult participants (≥18 years) in the IBSEN III study were asked to fill out a web-based food frequency questionnaire (FFQ) covering intake for the preceding year. The same FFQ was applied in Tromsø7, but administered in article format and could be completed either upon attendance or at home [Citation9,Citation10]. Both formats were developed and evaluated at the Department of Nutrition, University of Oslo and have been previously validated [Citation11,Citation12].
The FFQ consists of questions about 279 food items including dietary supplements, subcategorized according to Norwegian dietary habits [Citation11]. It provides information about the type, quantity and frequency of food consumed. Images of portion sizes (in web-based version only) as well as household measures were used to simplify estimation for participants [Citation11]. Information regarding how to answer the questionnaire was given on the front page.
Dietary data were imported to the Dietary Calculation Program (KBS version 7.4, Oslo, Norway) at University of Oslo. A food database originating from the Norwegian food Composition Table 2018 was used to compute intake of energy (MJ/d), macro (g/d) and micronutrients (unit/d), as well as food groups (g/d). Estimated micronutrient intakes included reported dietary supplements. Dietary intakes in Tromsø7 were calculated using a food database from the food composition table 2014–2015 [Citation10].
To evaluate under- and over-reporting, we calculated the resting metabolic rate (RMR) for each participant from IBSEN III study and Tromsø7. Henry’s equations [Citation13] were applied in normal weight (BMI < 25 kg/m2) and Mifflin’s equation in overweight (BMI ≥ 25 kg/m2) [Citation14]. Since RMR is suggested to be about 5% higher than basal metabolic rate (BMR) [Citation15], this fraction was subtracted from RMR for a more precise BMR estimation. The energy intake (EI) to BMR ratio was further calculated, where EI misreporting was estimated as in previous publications [Citation16,Citation17] using Goldberg cut-offs [Citation18]. A cut-off < 1.08 was considered as under-reporting, 1.08–2.22 as plausible reporting, and> 2.22 as over-reporting. Participants with EI/BMR ratio < 1.08 or > 2.22 were hence excluded from analysis.
Background and clinical data
IBD diagnosis was set according to the Lennard-Jones Criteria [Citation19], and subcategorized using the Montreal classification [Citation20]. Background data were collected via an online questionnaire and included age, marital status, ethnicity, educational level, smoking, snuff tobacco use and physical activity. Questions about adherence to a specific diet (vegan, lactose-free, etc.) the previous year were also included. Upon clinical visit, health personnel registered the anthropometric measures height and weight.
Blood and fecal samples
Collection of routine blood and fecal samples was carried out in local hospitals according to standard procedures [Citation8]. Blood values reflecting nutritional status; hemoglobin (Hb), albumin, ferritin, serum 25-OH vitamin D and serum vitamin B12 are reported in this article. Calprotectin in feces was used as an inflammation marker to categorize patients according to disease activity together with C-reactive protein (CRP) [Citation8].
Biochemical markers
The following definitions were used: anemia as Hb < 12 mg/dL in women and < 13 mg/dL in men [Citation21], iron deficiency either as ferritin < 30 ng/L [Citation3] for inactive IBD (fecal calprotectin ≤ 250 mg/kg and/or CRP ≤ 4 mg/L) [Citation22,Citation23] or < 100 ng/L [Citation3] for active IBD (fecal calprotectin > 250 mg/kg and/or CRP > 4 mg/L) [Citation22,Citation23], hypoalbuminemia as albumin < 35 g/dL [Citation24], vitamin D deficiency as 25-OH vitamin D levels < 50 nmol/L [Citation25] and vitamin B12 deficiency as serum levels < 200 pg/mL [Citation26]. Iron deficiency was differentiated by disease activity since it can be caused by inflammation [Citation3].
Body mass index
BMI was calculated as body weight divided by squared height (kg/m2). Underweight was defined as BMI < 18.5 kg/m2, normal weight 18.5–24.9 kg/m2, overweight ≥ 25 kg/m2 and obesity ≥ 30 kg/m2 [Citation3].
Statistics
Statistical analyses were performed using IBM SPSS, version 27 (IBM Corp, Armonk, NY). Categorical variables were presented as frequencies with proportions using the χ2 test. For continuous variables, mean and standard deviation (SD) were used if normally distributed data and median with 25th and 75th percentiles if not. Comparisons of the means were performed by the t-test or the Mann–Whitney U test as appropriate from data distribution. Given the proportion of missing values was < 20% for almost all analyzed variables (Supplementary Table 1), no imputation of missing data was performed and we only analyzed complete cases. A two-sided p value < 0.01 was considered statistically significant.
Results
Background and clinical characteristics
Clinical characteristics of the IBD study population (n = 227, 50% women) according to CD and UC diagnoses are given in . Background characteristics of the IBD study population and the Tromsø7 sample (n = 8251, 53% women) are presented in . A small proportion (9.2%) of IBD patients reported following a specific diet.
Table 1. Clinical characteristics of IBD patients.
Table 2. Background characteristics of IBD patients and the Tromsø7 sample.
Dietary intakes
FFQ response and energy misreporting
Of 1509 participants with confirmed IBD diagnosis initially included in the IBSEN III study, 699 (46.3%) completed the FFQ. In Tromsø7, 71.8% completed the FFQ. The proportion of participants considered as under-reporters was 12% in both IBD patients and Tromsø7, whereas 22.2% of IBD patients and 12% in the Tromsø7 sample were over-reporters. There were more women, and participants with higher education among IBD patients who completed the FFQ compared to non-respondents (Supplementary Table 2).
Energy and macronutrients
The intake of energy and macronutrients in IBD patients and Tromsø7 sample are presented in . Compared to the Tromsø7 sample, IBD patients had higher intake of energy, fat, and polyunsaturated fatty acids (PUFA) reflected in higher intake of omega 6 and the omega6/3 ratio. However, alcohol intake was lower in IBD patients. Men with IBD had higher intake of monounsaturated fatty acids (MUFA) compared to men in Tromsø7. Except for carbohydrates and saturated fatty acids (SFA), intake of all macronutrients was within recommended allowances in IBD patients.
Table 3. Intake of macro- and micronutrients* in IBD patients compared to the Tromsø7 sample and Nordic nutrition Recommendations.
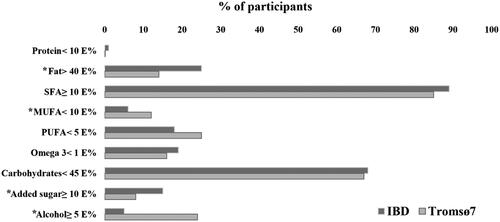
A higher proportion of IBD patients exceeded recommended intake of fat and added sugar compared to the Tromsø7 sample (). The opposite was observed for alcohol.
Figure 2. Percentage of IBD patients (n = 227) and the Tromsø7 sample (n = 8251) with intakes not in line with recommendations. *Significant difference between IBD and Tromsø7. IBD: inflammatory bowel disease. E%: energy percent; SFA: saturated fatty acids; MUFA: monounsaturated fatty acids; PUFA: polyunsaturated fatty acids.
Micronutrients
IBD patients had lower intake of iodine in comparison to the Tromsø7 sample (). The intake of calcium and vitamin B12 was lower in men with IBD, while women had higher intake of folate compared to men and women in the Tromsø7 sample. All micronutrients were within recommended levels, except for vitamin D in women with IBD (<10 µg/d). Estimations excluding supplements showed an average intake of selenium below recommended levels in IBD patients, apart from men with UC (Supplementary Table 3).
Food groups and dietary supplements
The intake of different food groups is reported in . IBD patients had higher intake of grain products other than bread and sweetened beverages, and lower intake of milk and cream, cheese and alcoholic beverages compared to the Tromsø7 sample. Compared to women in Tromsø7, women with IBD had higher intake of vegetables and lower intake of coffee. There were higher intakes of multivitamins (24%), vitamin D (20%) and iron (8%) supplementation in IBD patients compared to the Tromsø7 sample (18%, 9% and 2%, respectively), with no differences regarding omega 3, folate and vitamin B, C and E supplements.
Table 4. Median daily intake of food groups (g/d) in IBD patients compared to the Tromsø7 sample.
Nutritional status
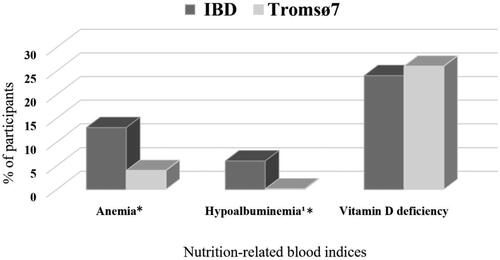
illustrates higher prevalence of anemia and hypoalbuminemia in IBD patients compared to Tromsø7. Iron and vitamin B12 deficiencies were present in 35% and 8% of IBD patients, respectively. Blood indices of iron and vitamin B12 were not available in Tromsø7. No difference was found between the two populations regarding prevalence of underweight (0.4% in both) and obesity (19.7% in IBD patients and 21.9% in Tromsø7, respectively).
Figure 3. Percentage of IBD patients (n = 227) and the Tromsø7 sample (n = 8251) with suboptimal nutrition-related blood indices. *Significant difference between IBD and Tromsø7, anemia: 99% CI for IBD (0.08, 0.19) and Tromsø7 (0.03, 0.04), hypoalbuminemia: 99% CI for IBD (0.02, 0.11) and Tromsø7 (3.62 × 10ˉ6, 0.005). IBD: inflammatory bowel disease.
Supplementary analysis
Results from the supplementary analyses (Supplementary Tables 4–11) including all IBD patients confirmed our findings from main analyses of dietary intake and nutritional status.
Discussion
To the best of our knowledge, this is the first study to investigate both dietary intake and nutritional status in a large population of newly diagnosed adults with IBD using standardized and validated methods, and compared to a sample from general population. According to our results, dietary intakes and nutritional-related biochemical indexes in newly diagnosed IBD patients may differ in some aspects from the general population. Patients with IBD had higher intake of grain products, sweetened beverages, energy and fat, yet lower intake of milk and dairy products, alcohol and iodine. Also, the prevalence of anemia and hypoalbuminemia was more common in IBD patients, whereas suboptimal level of vitamin D was observed in both populations.
Energy intake and misreporting
The EI in this study was higher in IBD patients than in the Tromsø 7 sample, which may relate to them being taller or having an inflammatory disease. Energy requirements increase proportionally with the amount of fat free mas in the body [Citation15]. Geerling et al. found larger quantity of fat free mass in CD patients compared to controls that they explained by a higher body length [Citation7]. For IBD, available evidence suggests the energy requirements in patients with no critical symptoms (sepsis and fever) to be similar to healthy adults [Citation27,Citation28].
Misreporting of EI is a challenge in dietary research, which could impede the interpretation of results and its associations with health-related outcomes [Citation29]. Available studies mainly addressed under-reporting and found high prevalence in different populations. However, over-reporting is also of interest as it represents another source for bias in nutrition assessment, and may be influenced by social desirability regarding healthy food [Citation29].
Limited data exist on misreporting in IBD populations. In Opstelten et al. 12–20% of adults with longstanding IBD were considered as under-reporters, but only 1% as over-reporters [Citation17]. The prevalence of under-reporting in IBD patients in this study was similar to that found in Opstelten et al. and the Tromsø7 sample. Still, the rate of over-reporting was about twice as high. This can be explained by our definition of over-reporting based on an estimated BMR or the recent IBD diagnosis in our study population. Any reduction or modification of dietary intakes following diagnosis could have influenced patients to over-report what they ate the previous year.
Macronutrients
The intake of fat was higher in IBD patients than the Tromsø7 sample, in particular PUFA and omega-6 in both genders and MUFA in men. Our findings differs from those in Geerling et al. who found no difference in fat intake between IBD patients and controls, except for lower PUFA intake in CD patients [Citation7]. Fat intake and its metabolism in IBD patients have received much interest, especially regarding the proposed role of PUFAs in inflammation [Citation30]. Despite acting like precursors to pro-inflammatory cytokines [Citation31], both epidemiological studies and RCTs have failed to establish an association between omega-6 PUFAs and inflammation [Citation32,Citation33]. Still, Ferreira et al. reported an interaction between high intakes of fat (including its subtypes) as well as elevated omega-6/3 ratio and more CD activity in specific genotypes [Citation34].
Mean intake of SFA in the IBD population exceeded recommendations. The same was seen in the Tromsø7 sample and is also confirmed by results from the latest Norwegian dietary survey (Norkost 3), which suggests a similar trend in the general population [Citation35]. Nevertheless, we did not expect that more adults with IBD would exceed recommended intakes (E%) of fat and added sugar compared to the Tromsø7 sample.
Micronutrients and food groups
Average micronutrient intakes in this study met recommended levels, except for vitamin D in women. However, iodine intakes were significantly lower in IBD patients compared to the Tromsø7 sample, which can relate to the observed lower consumption of milk and dairy products. These foods are also sources of calcium and vitamin B12 [15] that men with IBD had lower intakes of compared to men in the Tromsø7 sample. It is worth noting that even though some differences in intakes between the two populations were statistically significant, they were probably too small to have clinical relevance. Insufficient calcium intake was previously described in patients with recent UC diagnosis, but iodine intake was not reported in that study [Citation7]. Calcium and vitamin D are key nutrients for optimal bone health and adequate bone mineralization [Citation3]. Insufficient calcium and vitamin D intake may exacerbate the risk of fractures and osteoporosis already existing in IBD patients [Citation3,Citation4]. Restriction of calcium rich food should be limited to those with allergies or intolerances, and nutritional advice about good alternative products should be provided. The higher reported use of vitamin D, iron and multivitamin supplementation in IBD patients did not result in higher intakes of micronutrients compared to the Tromsø7 sample. Supplements may still help patients reach recommended levels of micronutrient intakes, as we observed average selenium intake to be within recommended levels only when supplements were included in the assessment.
Fatty, processed and sweet foods, carbonated beverages, milk and dairy, coffee and alcohol are some classic foods described by patients to worsen symptoms and trigger flares [Citation2]. Lower intake of alcoholic beverages, milk, cheese and coffee (in women) in our study sample may reflect some restrictive food behavior as often seen in IBD patients. This could be present despite that only 12% of our patients stated to follow a specific diet. We could possibly have obtained a better estimation of food restrictive behavior in our study sample if we have used questions about restricting or avoiding foods.
Our findings are in line with Geerling et al. regarding alcohol, as they also reported lower consumption in CD, but not UC patients [Citation7]. Both alcoholic beverages and dairy products are sources to Sulphur derivatives [Citation36]. Jowette et al. found increased risk of UC relapse related to high intake of Sulphur and its food sources, but their findings were limited by incomplete Sulphur data and a subjective relapse definition [Citation36].
Nutritional status
IBD patients presented with more anemia and hypoalbuminemia than the Tromsø7 sample. Geerling et al. previously reported IBD patients with recent diagnosis to have lower albumin concentrations compared to controls [Citation7]. Another study observed insufficient levels of one or more micronutrients in 78% of patients with IBD [Citation5], but they did not include Hb data. The proportions of our study sample with iron deficiency and suboptimal vitamin D and B12 levels are lower than those observed in Gold et al. which could be explained by use of different cut-offs [Citation5]. Anemia can result from either deficiencies in iron, folate or vitamin B12, chronic inflammation, and/or medication [Citation3,Citation4]. Thus, the likelihood of micronutrient deficiencies may be related to prolonged active disease characterized by bleeding, diarrhea, fistulae formation and reduced absorptive surface due to intestinal resection [Citation3].
Vitamin D deficiency may be a general challenge in the Norwegian population since no difference was found between IBD patients and the Tromsø7 sample. Northern latitude and low sun exposure in winter could explain part of this, and intake through diet and supplements should therefore be encouraged [Citation3]. According to the European Crohn’s and Colitis Organization, there is inconclusive evidence supporting use of micronutrient supplementation for remission induction in IBD, but regular monitoring of patients to prevent deficiencies should be conducted [Citation37].
The prevalence of both underweight and obesity was similar in IBD patients and the Tromsø7 sample. Unexpectedly, the prevalence of obesity in IBD patients was higher compared to underweight, which has been widely reported to occur in IBD [Citation4,Citation5]. What comes first of IBD and obesity is not fully understood as available data is still conflicting [Citation6]. The observed increase of obesity in IBD patients mirror the global pandemic seen in the general population. However, preclinical research proposed a link between IBD and obesity development explained by altered intestinal microbial environment, but this still needs to be studied [Citation6].
Strengths and limitations
The large sample size, estimation of energy misreporting and comparison with a Norwegian general population is strengths of this study. Moreover, we used a validated comprehensive FFQ capturing the whole diet. The study also has some limitations. First, as discussed previously, the issue of misreporting is high in FFQs due to reliance on participant’s memory and literacy skills [Citation38]. Still, the FFQ is both cost and time saving making it a first choice in epidemiological studies with large populations as this study [Citation38]. Validation studies of this FFQ showed that it provided valid estimations of habitual dietary intakes at group level in healthy Norwegian adults [Citation11,Citation12].
Second, different food databases and FFQ administration formats (web-based versus article-based) were used in IBSEN III and Tromsø7. A web-based FFQ may reduce the working burden associated with article handling, probability of missing data and time consumption [Citation38]. The proportion who returned the FFQ in Tromsø7 was nevertheless higher, which could be due to the possibility to complete the FFQ on site. In addition, a paper questionnaire could be easier to remember and fill out anywhere, whereas internet access is necessary for the web-based version. The food database we used was an updated version of a former applied in Tromsø7, and it contained portion illustrations. Minor differences in food quantity estimations as well as some inequalities in nutrient values may therefore be present. These inequalities could also be due to dissimilarity in age between IBD patients and the Tromsø7 sample.
Third, the population from Tromsø7 is inhabitants of a Northern Norwegian mainly urban area, while IBD patients are from the entire Southeast of Norway including both urban and rural areas. Regional differences in food traditions and intake may exist, and results from the Norkost 3 survey confirm this [Citation35]. Still, it is considered that the population of Tromsø may be comparable to populations from the same age range elsewhere in Norway [Citation10]. To ensure that the populations from Tromsø7 and the IBSEN III study were as comparable as possible, we performed a complementary data handling regarding misreporting of EI and included only IBD patients ≥ 40 years in the main analysis.
People who participate in epidemiological studies and complete questionnaires may not be representative for the population on which the study population is drawn [Citation39]. There were no differences between the sample of participants included in analyses and those not included (Supplementary Table 2), also when compared according to age < or ≥ 40 years. However, some differences (sex and education) exist between participants with and without dietary data in this study, which may affect the external validity. Thus, our findings may reflect the diet of IBD patients under 40 years of age but not of those who are males, or have lower education.
In conclusion, dietary intakes in newly diagnosed IBD patients were overall in line with Nordic Nutrition Recommendations. Excess intake of fat and added sugar, insufficient intakes of some micronutrients together with suboptimal blood levels of nutrition-related biomarkers were present. In future studies from IBSEN III, we will investigate how intake of added sugar and fat (omega-6 fatty acids in particular), and malnutrition may influence IBD outcomes. To prevent development of and correct existing deficiencies, health care should include dietary guidance to ensure adequate intake of calcium, iodine, iron and vitamin D including supplement use when necessary.
Author contributions
IZ: data analysis and interpretation, drafting the article and final version writing; AMA, CS, JV: study design, data interpretation, critical revision of drafts and final approval of the final article to be published; MHC: data analysis and interpretation, critical revision of drafts and final approval of the article to be published; RO, VAK, MLH and AWM: study conception and design, critical revision of drafts and final approval of the article to be published; MCS: statistical advice, critical revision of drafts and final approval of the article to be published; LAH: acquisition of data, critical revision of drafts and final approval of the article to be published; CL, IJ, RBC, MBB, RT, ØH, GHH, TED, TBA, PR and SOF: patient recruitment, data collection, critical revision of drafts and final approval of the article to be published.
Summary of main point
The diet of patients with newly diagnosed IBD met Nordic Nutritional Recommendations in general, but suboptimal intake and blood levels of some micronutrients require careful monitoring.
| Abbreviations | ||
| IBD | = | Inflammatory bowel disease |
| CD | = | Crohn’s disease |
| UC | = | ulcerative colitis |
| NNR 2012 | = | Nordic Nutrition Recommendations 2012 |
| IBSEN III | = | Inflammatory Bowel Disease in South-Eastern Norway |
| FFQ | = | food frequency questionnaire |
| RMR | = | resting metabolic rate |
| BMR | = | basal metabolic rate |
| EI | = | energy intake |
| Hb | = | hemoglobin |
| SFA | = | saturated fatty acids |
| MUFA | = | monounsaturated fatty acids |
| PUFA | = | polyunsaturated fatty acids |
| E% | = | energy percent |
| CRP | = | C-reactive protein. |
Supplemental Material
Download MS Word (67.8 KB)Acknowledgments
The authors thank the following members of the IBSEN III study group for participating in this study: Aina Pedersen, Akershus University Hospital, Kongsvinger; Audun Hasund and Ole Høie, Sørlandet Hospital Trust; Kristiansand and Arendal; Bjørn Olsen, Telemark Hospital Trust, Skien; Carl Magnus Ystrøm and Øyvind Asak, Innlandet Hospital Trust, Elverum and Lillehammer; Magne Henriksen, Østfold Hospital Trust, Grålum; Tor Tønnessen and Arnt Sagosen, Vestre-Viken Hospital Trust, Gjettum and Kongsberg. We also thank Gunn Helen Malmstrøm, Jennifer T. Fiennes and Anita Tollisen at Unger-Vetlesens Institute, Lovisenberg Diaconal Hospital for handling and analyzing the fecal samples.
Disclosure statement
VAK has reported consultant fees from Janssen-Cilag AS, advisory boards and consultant fees from Takeda and advisory board for Tillotts Pharma. MLH reported speaker fees from Galapagos, Ferring, BMS, Janssen, AbbVie, Meda, Tillotts Pharma and Takeda; advisory boards for Takeda, Galapagos, BMS, Lilly and AbbVie; researcher-initiated research grants from Takeda, Pfizer, Tillotts Pharma and Ferring. AWM has received an unrestricted research grant from Takeda. ØH has received personal fees from AbbVie, Janssen-Cilag AS, Takeda and Ferring. SOF reports personal fees from Takeda, Galapagos, Jansen-Cilag AS, AbbVie, Pharma Cosmos, Norgine and Bristol-Myers-Squibb outside the submitted work.
Data availability statement
The data underlying this article cannot be shared publicly due to the privacy of individuals that participated in the study. Data will be shared on reasonable request to the corresponding author.
Additional information
Funding
References
- Levine A, Rhodes JM, Lindsay JO, et al. Dietary guidance from the international organization for the study of inflammatory bowel diseases. Clin Gastroenterol Hepatol. 2020;18(6):1381–1392. doi: 10.1016/j.cgh.2020.01.046.
- Limdi JK, Aggarwal D, McLaughlin JT. Dietary practices and beliefs in patients with inflammatory bowel disease. Inflamm Bowel Dis. 2016;22(1):164–170. doi: 10.1097/MIB.0000000000000585.
- Balestrieri P, Ribolsi M, Guarino MPL, et al. Nutritional aspects in inflammatory bowel diseases. Nutrients. 2020;12(2):12. doi: 10.3390/nu12020372.
- Lomer MC. Dietary and nutritional considerations for inflammatory bowel disease. Proc Nutr Soc. 2011;70(3):329–335. doi: 10.1017/S0029665111000097.
- Gold SL, Rabinowitz LG, Manning L, et al. High prevalence of malnutrition and micronutrient deficiencies in patients With inflammatory bowel disease early in disease course. Inflamm Bowel Dis. 2022;29:423–429.
- Singh S, Dulai PS, Zarrinpar A, et al. Obesity in IBD: epidemiology, pathogenesis, disease course and treatment outcomes. Nat Rev Gastroenterol Hepatol. 2017;14(2):110–121. doi: 10.1038/nrgastro.2016.181.
- Geerling BJ, Badart-Smook A, Stockbrügger RW, et al. Comprehensive nutritional status in recently diagnosed patients with inflammatory bowel disease compared with population controls. Eur J Clin Nutr. 2000;54(6):514–521. doi: 10.1038/sj.ejcn.1601049.
- Kristensen VA, Opheim R, Perminow G, et al. Inflammatory bowel disease in South-Eastern Norway III (IBSEN III): a new population-based inception cohort study from South-Eastern Norway. Scand J Gastroenterol. 2021;56(8):899–905. doi: 10.1080/00365521.2021.1922746.
- Hopstock LA, Grimsgaard S, Johansen H, et al. The seventh survey of the tromsø study (Tromsø7) 2015–2016: study design, data collection, attendance, and prevalence of risk factors and disease in a multipurpose population-based health survey. Scand J Public Health. 2022;50(7):919–929. doi: 10.1177/14034948221092294.
- Lundblad MW, Andersen LF, Jacobsen BK, et al. Energy and nutrient intakes in relation to national nutrition recommendations in a Norwegian population-based sample: the tromso study 2015–16. Food Nutr Res. 2019;63. doi: 10.29219/fnr.v63.3616.
- Carlsen MH, Lillegaard ITL, Karlsen A, et al. Evaluation of energy and dietary intake estimates from a food frequency questionnaire using independent energy expenditure measurement and weighed food records. Nutr J. 2010;9(1):37. doi: 10.1186/1475-2891-9-37.
- Medin AC, Carlsen MH, Hambly C, et al. The validity of a web-based FFQ assessed by doubly labelled water and multiple 24-h recalls. Br J Nutr. 2017;118(12):1106–1117. doi: 10.1017/S0007114517003178.
- Henry CJ. Basal metabolic rate studies in humans: measurement and development of new equations. Public Health Nutr. 2005;8(7A):1133–1152. doi: 10.1079/phn2005801.
- Mifflin MD, St Jeor ST, Hill LA, et al. A new predictive equation for resting energy expenditure in healthy individuals. Am J Clin Nutr. 1990;51(2):241–247. doi: 10.1093/ajcn/51.2.241.
- Nordic co-operation. Nordic nutrition recommendations 2012- integrating nutrition and physical activity. 5 ed. Copenhagen: Nordic Council of Ministers; 2014.
- Black AE. Critical evaluation of energy intake using the Goldberg cut-off for energy intake: basal metabolic rate. A practical guide to its calculation, use and limitations. Int J Obes Relat Metab Disord. 2000;24(9):1119–1130. doi: 10.1038/sj.ijo.0801376.
- Opstelten JL, de Vries JHM, Wools A, et al. Dietary intake of patients with inflammatory bowel disease: a comparison with individuals from a general population and associations with relapse. Clin Nutr. 2019;38(4):1892–1898. doi: 10.1016/j.clnu.2018.06.983.
- Goldberg GR, Black AE, Jebb SA, et al. Critical evaluation of energy intake data using fundamental principles of energy physiology: 1. Derivation of cut-off limits to identify under-recording. Eur J Clin Nutr. 1991;45(12):569–581.
- Lennard-Jones JE. Classification of inflammatory bowel disease. Scand J Gastroenterol Suppl. 1989;170:2–6. discussion 16-9 doi: 10.3109/00365528909091339.
- Silverberg MS, Satsangi J, Ahmad T, et al. Toward an integrated clinical, molecular and serological classification of inflammatory bowel disease: report of a working party of the 2005 Montreal world congress of Gastroenterology. Can J Gastroenterol. 2005;19:5a–36a. doi: 10.1155/2005/269076.
- Haemoglobin concentrations for the diagnosis of anaemia and assessment of severity Geneva. Vitamin and Mineral Nutrition Information System.World Health Organization; 2011. [accessed February 13, 2023]. Available from: http://www.who.int/vmnis/indicators/haemoglobin.pdf
- D’Haens G, Ferrante M, Vermeire S, et al. Fecal calprotectin is a surrogate marker for endoscopic lesions in inflammatory bowel disease. Inflamm Bowel Dis. 2012;18(12):2218–2224. doi: 10.1002/ibd.22917.
- Mosli MH, Zou G, Garg SK, et al. C-Reactive protein, fecal calprotectin, and stool lactoferrin for detection of endoscopic activity in symptomatic inflammatory bowel disease patients: a systematic review and meta-analysis. Am J Gastroenterol. 2015;110(6):802–819; quiz 820. doi: 10.1038/ajg.2015.120.
- Nguyen GC, Du L, Chong RY, et al. Hypoalbuminaemia and postoperative outcomes in inflammatory bowel disease: the NSQIP surgical cohort. J Crohns Colitis. 2019;13(11):1433–1438. doi: 10.1093/ecco-jcc/jjz083.
- Ross AC, Manson JE, Abrams SA, et al. The 2011 report on dietary reference intakes for calcium and vitamin D from the Institute of Medicine: what clinicians need to know. J Clin Endocrinol Metab. 2011;96(1):53–58. doi: 10.1210/jc.2010-2704.
- Yakut M, Ustün Y, Kabaçam G, et al. Serum vitamin B12 and folate status in patients with inflammatory bowel diseases. Eur J Intern Med. 2010;21(4):320–323. doi: 10.1016/j.ejim.2010.05.007.
- Kushner RF, Schoeller DA. Resting and total energy expenditure in patients with inflammatory bowel disease. Am J Clin Nutr. 1991;53(1):161–165. doi: 10.1093/ajcn/53.1.161.
- Schneeweiss B, Lochs H, Zauner C, et al. Energy and substrate metabolism in patients with active Crohn’s disease. J Nutr. 1999;129(4):844–848. doi: 10.1093/jn/129.4.844.
- Poslusna K, Ruprich J, de Vries JH, et al. Misreporting of energy and micronutrient intake estimated by food records and 24 hour recalls, control and adjustment methods in practice. Br J Nutr. 2009;101(2):S73–S85. doi: 10.1017/S0007114509990602.
- Geerling BJ, V Houwelingen AC, Badart-Smook A, et al. Fat intake and fatty acid profile in plasma phospholipids and adipose tissue in patients with Crohn’s disease, compared with controls. Am J Gastroenterol. 1999;94(2):410–417. doi: 10.1111/j.1572-0241.1999.869_a.x.
- Lands WEM. Biosynthesis of prostaglandins. Annu Rev Nutr. 1991;11(1):41–60. doi: 10.1146/annurev.nu.11.070191.000353.
- Fritsche KL. Too much linoleic acid promotes inflammation-doesn’t it? Prostaglandins Leukot Essent Fatty Acids. 2008;79(3–5):173–175. doi: 10.1016/j.plefa.2008.09.019.
- Johnson GH, Fritsche K. Effect of dietary linoleic acid on markers of inflammation in healthy persons: a systematic review of randomized controlled trials. J Acad Nutr Diet. 2012;112(7):1029–1041.e15. 1041.e1-15 doi: 10.1016/j.jand.2012.03.029.
- Ferreira P, Cravo M, Guerreiro CS, et al. Fat intake interacts with polymorphisms of Caspase9, FasLigand and PPARgamma apoptotic genes in modulating Crohn’s disease activity. Clin Nutr. 2010;29(6):819–823. doi: 10.1016/j.clnu.2010.06.008.
- Totland THMB, Lundberg-Hallén N, Helland-Kigen KML-BN, et al. Norkost 3; en landsomfattende kostholdsundersøkelse blant menn og kvinner i norge i alderen 18-70 år, 2010–11. Oslo, Norway: Helsedirektoratet; 2012.
- Jowett SL, Seal CJ, Pearce MS, et al. Influence of dietary factors on the clinical course of ulcerative colitis: a prospective cohort study. Gut. 2004;53(10):1479–1484. doi: 10.1136/gut.2003.024828.
- Torres J, Ellul P, Langhorst J, et al. European Crohn’s and colitis organisation topical review on complementary medicine and psychotherapy in inflammatory bowel disease. J Crohns Colitis. 2019;13(6):673–685e. doi: 10.1093/ecco-jcc/jjz051.
- Ngo J, Engelen A, Molag M, et al. A review of the use of information and communication technologies for dietary assessment. Br J Nutr. 2009;101(2):S102–S112. doi: 10.1017/S0007114509990638.
- Åsvold BO, Langhammer A, Rehn TA, et al. Cohort profile update: the HUNT study, Norway. Int J Epidemiol. 2022;52(1):e80–e91. doi: 10.1093/ije/dyac095.