
ABSTRACT
To determine methane (CH4) emission differences between edible and forage rice cultivars, we conducted a pot experiment in Yamagata, Japan to grow edible rice Haenuki, and forage rice Fukuhibiki (for feed rice) and Tachisuzuka (for whole-crop silage (WCS) rice) under similar soil and meteorological conditions. The total amounts of N, P, and K fertilizers applied for Fukuhibiki and Tachisuzuka were 1.7, 1.3, and 1.3 times, respectively, higher than those of Haenuki. CH4 fluxes, and rice plant night respirations were measured once weekly or fortnightly. As per the results, for the whole growth period, shoot height, maximum and productive tiller numbers, and plant biomass were significantly different among the three rice varieties. The rice growth period for Haenuki and Fukuhibiki was 107 days after transplanting (DAT), while that for Tachisuzuka was 135 DAT. The highest peak of CH4 flux occurred around the heading stage for the three varieties. Consistently significant (P < 0.05) or obvious (P < 0.1) positive correlations between CH4 flux and night respiration among the varieties were observed from 9 weeks after rice transplanting to harvest, indicating that much of the CH4 flux was from newly produced root exudates and plant debris through plant photosynthesis. The cumulated CH4 emissions during the same growth period, 106 DAT, from Haenuki, Fukuhibiki, and Tachisuzuka were 55.36, 77.46, and 78.40 g C m−2, respectively. Additionally, Tachisuzuka emitted 25.11 g C m−2 more CH4 between 106–134 DAT. The final cumulated CH4 emissions from Fukuhibiki and Tachisuzuka were 39.9% and 87.0% higher than that from Haenuki, respectively, throughout their growth period.
1. Introduction
Rice (Oryza sativa L.) is a staple of the Japanese diet, and rice production is important to the food supply in Japan. However, occasioned by changes in the Japanese diet with people consuming more milk, meat, and bread than rice (Smil and Kobayashi Citation2012), rice cultivation area in Japan decreased from 3.3 million ha in the 1960s to 1.6 million ha in 2015 leading to an increase in the area of abandoned agricultural land (Fig. S1). Rice consumption decreased in Japan from the 118 kg per person per year peak in 1962 to 55 kg in 2015 (MAFF Citation2017). On the other hand, the percentage of self-sufficient food supply was about 40% on a calorie basis in Japan during the recent two decades. About 75% of the domestic demand of feed for livestock is dependent on import from overseas (Kato Citation2008; Ozawa and Yoshida Citation2009). To increase the percentage of self-sufficient food supply and improve the domestic demand of livestock feed in Japan, production of forage rice is increasing in Japan quickly since the last decade (Fig. S2). The harvest area of forage rice was increased to 131 kha in 2016, and this was about 8.2% of the total rice harvest area (1.6 Mha) in Japan. Currently, forage rice production is being promoted by the government in Japan as it has the potential to, firstly stop the increase of abandoned agricultural land since 1970s, which if not addressed will prove a serious menace to the basis of Japanese agriculture and farm structure, secondly improve self-sufficiency in food, which is a more important issue for the national strategy. The production of forage rice will be increasing continually in the future (MAFF Citation2017).
Normally, there are two types of forage rice, one is feed rice whose cultivars are harvested as edible rice and only the grain is used to feed domestic fowl and animal as concentrate feed, the other is whole-crop silage (WCS) rice, whose cultivars are harvested at the yellow ripening stage, and the whole rice plant including panicles, leaves, and stems are conditioned into silage, and used to feed cattle (Kato Citation2008; Ozawa and Yoshida Citation2009; Matsushita et al. Citation2011). As shown in Fig. S2, the harvest area of feed rice is increasing more quickly than that of WCS rice in recent years. In 2015, 61.8%, 28.3%, and 9.9% of feed rice grains were for fowls, pigs, and cows, respectively, as concentrate feed in Japan (MAFF Citation2017). Since the forage rice is used to feed livestock, the grain weight and total above ground biomass of feed and WCS rice, respectively, are larger than those of edible rice. The fertilization rates of forage rice cultivars are also higher than those for edible rice.
After carbon dioxide (CO2), methane (CH4) is the most important greenhouse gas, responsible for approximately 20% of the anthropogenic global warming effect. Most of the atmospheric CH4 is produced by the bacterial activities in extremely anaerobic ecosystems such as natural and cultivated wetlands, sediments, sewage, landfills, and the rumen of herbivorous animals. Rice paddy fields are considered as one of the most important sources of CH4. During the past decades, there were many studies carried out around the world, especially in Japan to understand the CH4 dynamics in rice paddies (Yagi and Minami Citation1990; Watanabe and Kimura Citation1998; Inubushi et al. Citation2003; Cheng et al. Citation2008; Itoh et al. Citation2011; Hayano et al. Citation2013; Win et al. Citation2016; Cheng et al. Citation2016; Nakajima et al. Citation2016). It is well known that there are different CH4 emission potentials among different rice varieties (Huang et al. Citation1997; Wassmann and Aulakh Citation2000; Yao et al. Citation2000; Aulakh et al. Citation2002; Jia et al. Citation2006; Lou et al. Citation2008; Gutierreza et al. Citation2013; Zhang et al. Citation2015). However, the previous studies were mainly focused on the edible rice varieties. As forage rice has different morphological and physiological properties, cultivated practice, and usage compared to the edible rice, the CH4 production, oxidation, and emission in rice paddies should be different. Recently, some studies were carried out in Japan to measure CH4 emission from WCS rice with biogas slurry application (Riya et al. Citation2012; Win et al. Citation2014; Citation2016). However, there was no research simultaneously comparing the differences of CH4 emission between forage and edible rice varieties.
The objective of the present study is to determine the CH4 emissions from three types of rice varieties (edible rice, forage rice for feed and forage rice for WCS) under similar soil and meteorological conditions.
2. Materials and methods
2.1. Experimental site, cultural practice, rice varieties, and soil
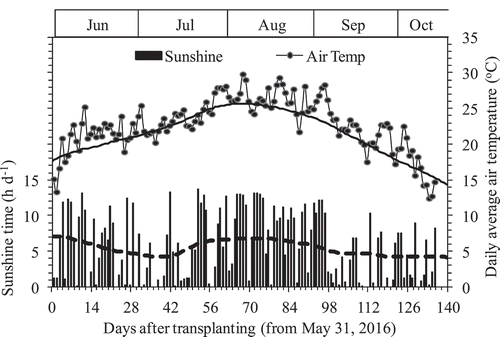
This research was conducted in 2016 at the Experiment Farm, Faculty of Agriculture, Yamagata University, Tsuruoka, Yamagata Prefecture, located in northeastern Japan (38° 44ʹ N, 139° 50ʹ E, 16 m elevation). According to the Japan Meteorological Agency database for Tsuruoka Meteorological Observatory (http://www.data.jma.go.jp/obd/stats/etrn/index.php), which is located inside of the Experiment Farm, Faculty of Agriculture, Yamagata University, the climate condition during rice growth season (June–October) in 2016 was hotter and sunnier than the historic average of 1981–2010 (). The daily average air temperature and sunshine times were 22.75°C and 5.52 h than those of historic average of 1981–2010 at 21.65°C and 5.46 h, respectively.
Figure 1. Daily sunshine time (■) and average air temperature (●) during the experiment period from 31 May to 13 October 2016 in Tsuruoka, Japan. The bold line and dish line crossed Air Temp and Sunshine time are the average values for 1981–2010 (Av. 30 years). Data was from Japan Meteorological Agency.
Three types of rice varieties, Haenuki, Fukuhibiki, and Tachisuzuka were used in this study. Haenuki is one popular edible variety grown widely in the local area, Yamagata Prefecture. Fukuhibiki is one Japonica type high-yield variety which was recommended as feed rice grown in Tohoku region (Fukushima Citation2012; Morita et al. Citation2012). Fukuhibiki is cultivated widely for piggery in Shonai area, Yamagata (Ozawa and Yoshida Citation2009). Tachisuzuka is a new rice cultivar with high straw yield and high sugar content for WCS use (Matsushita et al. Citation2011).
On 31 May 2016, seedlings of 3 types of rice varieties were transplanted to 12 plastic pots (19.5-cm inside diameter, 27-cm height, 0.2-cm thickness) filled with 6.0 kg alluvial soil (4.5 kg dry soil equivalent, water content was 25% in w/t), which was collected from rice field at the University Farm and light air-dried for sieving at 5-mm mesh size. The soil had been piled up outdoors for 2 years before being used, visible plant residues were absent. Each variety had four replications. The soil contained 28.5 g kg–1 organic C and 2.90 g kg–1 total N with a pH value of 6.3. Soil was air dried, sieved (5-mm mesh size) and mixed well before use. Before rice transplanting, 0.87 g CO(NH2)2 and 0.87 g KH2PO4 were mixed to the soil in each pot as basal fertilizers for Haenuki. The amounts of nitrogen (N), phosphorus (P), and potassium (K) of the basal fertilizers were 0.40, 0.20, 0.25 g pot–1, respectively. While, the basal fertilizers for forage rice of Fukuhibiki and Tachisuzuka were 1.5 time higher than Haenuki. At 50 days after transplanting (DAT), we applied first added fertilization with 0.20 g N, 0.10 g P, and 0.13 g K pot–1 for all varieties by 0.43 g CO(NH2)2 and 0.43 g KH2PO4. The second added fertilization (0.43 g CO(NH2)2 only) was carried out at 78 DAT for Fukuhibiki and at 92 DAT for Tachisuzuka. The total amounts of N, P, and K fertilizers applied for Fukuhibiki and Tachisuzuka were 1.7, 1.3, and 1.3 times, respectively, higher than those of Haenuki. The flooding water was maintained at about 5-cm depth throughout the entire experimental period.
2.2. Daily CH4 flux and night respiration (CO2 flux) measurement
CH4 and CO2 fluxes were collected with a cylindrical, transparent, acrylic, closed-top chamber (20.5-cm inside diameter, 100-cm height, and 0.3-cm thickness). The frequency of flux measurement is once weekly or fortnightly. During the sampling time of 30 min, we covered each pot with the chamber to capture gas exchanged between the pots and the atmosphere. At 0, 15, and 30 min after the chamber was placed, a gas sample of about 30 ml was drawn with a 30-ml plastic syringe through a capillary tube at the top of the chamber and injected into a 19-ml vacuum bottle with a rubber stopper and screw cap. The bottles were taken back to the laboratory, where the amounts of CO2 and CH4 were analyzed using an automated analysis system for three gases of CO2, CH4, and N2O. This system consists of two gas chromatographs (GC-14B, Shimadzu, Kyoto, Japan), of which one has both a thermal conductivity detector (TCD) and a flame ionization detector (FID), and the other has an electron capture detector (ECD). This system can analyze 40 samples consecutively with a modified automated headspace sampler (HSS-2B, Shimadzu, Kyoto, Japan) (Sudo Citation2006). The flux was calculated from the increase in the gas concentration inside the chamber per square meter per hour (Cheng et al. Citation2006; Citation2008). We measured CH4 fluxes at night time about 20:00–22:00, because the average of daily CH4 flux from rice paddy was similar to the flux at day time 8:00–10:00 and night time 20:00–22:00 (Cheng et al. Citation2008; Minamikawa et al. Citation2015). The increase in CO2 concentration in the chamber in the evening samples was used to calculate plant night respiration. The N2O fluxes were detected at first gas sampling on 15 June (about 8 μg N m−2 h−1) only from denitrification process of initial nitrate after the moisture soil was flooded. After that, N2O flux was not detected, so we did not include N2O emission data in the paper.
2.3. Growth investigation, destructive sampling, and dry matter measurements
Plant height and tiller numbers of each rice hill (or pot) were measured once a week beginning 8 days after transplanting (DAT). At that time, top rice leaf greenness (SPAD value, indicating the amount of chlorophyll present) was measured using a SPAD-502 Plus chlorophyll meter (Konica Minolta Inc., Tokyo, Japan). Haenuki and Fukuhibiki were harvested at 107 DAT (on 15 September), and Tachisuzuka was harvested at 135 DAT (on 13 October 2016), respectively, depending on the physiological maturity. At harvest, we collected plants from the pots, carefully washed the soil from the roots in running water, and then separated the plants into stems, leaves, roots, and ears. The parts were then oven-dried at 70°C for 2 days and weighed (Cheng et al. Citation2009). For Haenuki and Fukuhibiki, much of the ears were lost to the field mouse invasion, so only the ears dry weight of Tachisuzuka was shown in this paper.
2.4. Statistical analyses
Analysis of variance (ANOVA) using SPSS 19 (SPSS Inc., Chicago, IL, USA) was used to determine the statistical significance among the three varieties. Least significant difference (LSD) values were calculated for each parameter for which significant differences were found at P < 0.05.
3. Results
3.1. Changes in rice plant height, tiller number, and SPAD value during entire experimental period
Rice growth period from transplanting to harvesting was about 107 DAT for both Haenuki and Fukuhibiki, and 135 DAT for Tachisuzaka. Tachisuzaka was 4 weeks late compared to Haenuki and Fukuhibiki. Plant height increased steadily until the grain-filling stage at about 85 DAT in Haenuki and Fukuhibiki and 113 DAT in Tachisuzuka (). At harvest, the shoot height was 78.0, 82.2, and 111.7 cm for Haenuki, Fukuhibiki and Tachisuzuka, respectively. There was a significant difference in rice plant height among the three varieties ().
Table 1. The main rice growth parameters, dry weight of rice plant at harvest and the accumulated CH4 emission during the experimental period among three rice varieties.
Figure 2. Changes in plant heights (A), tiller numbers of rice plants (B) and leaf color in SPAD values (C) among three rice varieties throughout the experiment. Bars indicate standard deviation (n = 4). Arrows indicate the days of fertilizer addition.
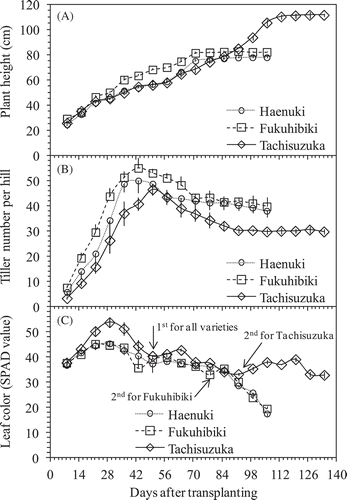
Rice tiller numbers reached a maximum at 43 DAT for Haenuki and Fukuhibiki, and at 50 DAT for Tachisuzuka (). The maximum tiller numbers per hill were 50.8 for Haenuki, 55.8 for Fukuhibiki, and 46.5 for Tachisuzuka. At harvest, the productive tiller numbers per hill were 39.5 for Haenuki, 41.5 for Fukuhibiki, and 30.5 for Tachisuzuka ().
Top rice leaf greenness (SPAD value) increased to maximum value until 22–29 DAT, then declined sharply for Tachisuzuka, but slowly for Haenuki and Fukuhibiki. Later, the leaf greenness was improved by first added fertilization on 49 DAT for all varieties and second added fertilization on 78 DAT for Fukuhibiki and 92 DAT for Tachisuzuka (). During the entire rice growth period, SPAD value of Tachisuzuka was mostly darker than that of Haenuki and Fukuhibiki. SPAD values of Tachisuzuka were larger than 30 during the entire rice growth period, even at the harvest stage (),
3.2. Dry weight of rice plants at harvest
Though we lost the measure of ear dry weight of Haenuki and Fukuhibiki due to damage by field mouse, the data showed that there were significant differences of leaf, stem, and root dry weights among the three varieties (P < 0.05). Leaf, stem, and root dry weights of Tachisuzuka were significantly larger than those of Fukuhibiki. And those of Fukuhibiki were significantly larger than those of Haenuki (). The leaf biomass was 9.36, 13.75, and 28.95 g per hill for Haenuki, Fukuhibiki, and Tachisuzuka, respectively. Fukuhibiki and Tachisuzuka were 46.9% and 209.3% higher than Haenuki. The stem biomass was 57.11, 65.39, and 162.30 g per hill for Haenuki, Fukuhibiki, and Tachisuzuka, respectively. Fukuhibiki and Tachisuzuka were 14.5% and 184.2% higher than Haenuki. The root biomass was 9.75, 15.24, and 23.24 g per hill for Haenuki, Fukuhibiki and Tachisuzuka, respectively. Fukuhibiki and Tachisuzuka were 56.3% and 138.4% higher than Haenuki ().
3.3. Changes in daily CH4 fluxes and accumulated emissions
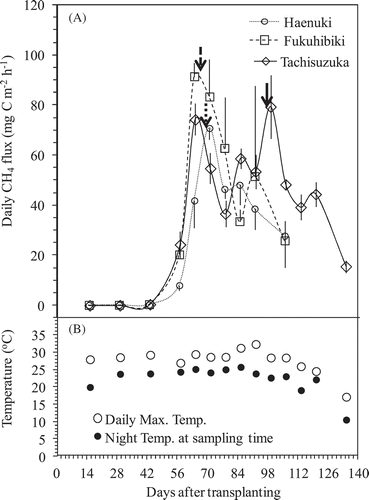
The changes in daily CH4 fluxes and the daily maximum temperature on the sampling day and night temperature at sampling time during the entire experimental period were shown in . CH4 fluxes were not detected or were relatively low during the early period of rice growth (until 6 weeks after flooding or rice transplanting), but increased quickly to the highest peak on the 9–10th weeks after rice transplanting from Haenuki and Fukuhibiki pots. The highest peak of Tachisuzuka was detected on the 14th week after rice transplanting. The largest fluxes coincided with the heading stage for all varieties (). There was no relationship between the daily CH4 flux and daily maximum temperature or the night temperature at sampling time ( and ). The cumulated CH4 emissions during the same growth period until 106 DAT were 55.36, 77.46, and 78.40 g C m−2 from Haenuki, Fukuhibiki, and Tachisuzuka pots, respectively. Fukuhibiki and Tachisuzuka were significantly higher than Haenuki (, P < 0.05). Since Tachisuzuka growth period was 4 weeks longer than Fukuhibiki, the accumulated CH4 emission from Tachisuzuka pots increased to 103.51 g C m−2, which was also significantly larger than that of Fukuhibiki (, P < 0.05). Total CH4 emissions from Fukuhibiki and Tachisuzuka pots were 39.9% and 87.0% higher than that of Haenuki throughout their entire growth season ( and Fig. S3).
Figure 3. Changes in the daily CH4 flux (A) from the pots planted among three rice varieties and the daily maximum temperature and the night temperature at sampling time (B) throughout the experiment period. Bars indicate standard deviation (n = 4). Bold arrows in (A) indicate the heading days for each variety.
3.4. Changes in daily night respiration
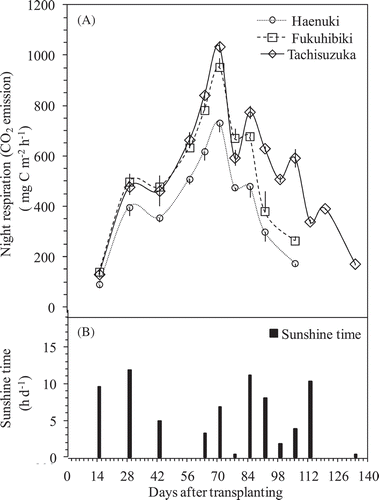
Night respiration (the CO2 mostly emitted from rice plant) ranged from 90.4 to 1034.1 mg C m–2 h–1 during the entire experimental period, and this parameter varied with growth stage. The highest peak of nighttime CO2 respiration was found at the 10th week after rice transplanting for all the three varieties (). Obviously, the small peaks before and after the highest one were as a result of the daily sunshine time (). Nighttime CO2 respiration was always significantly higher from Fukuhibiki and Tachisuzuka than that from Haenuki (P < 0.01). The average values of nighttime CO2 respiration during entire experimental period were 412.6, 547.4, and 452.1 mg C m–2 h–1 from Haenuki, Fukuhibiki, and Tachisuzuka plants, respectively.
Figure 4. Changes in night respiration (CO2 emission) of rice plants grown in the pots among three rice varieties throughout the experiment period (A). Bars indicate standard deviation (n = 4). The sunshine time on day for CO2 and CH4 fluxes sampling (B).
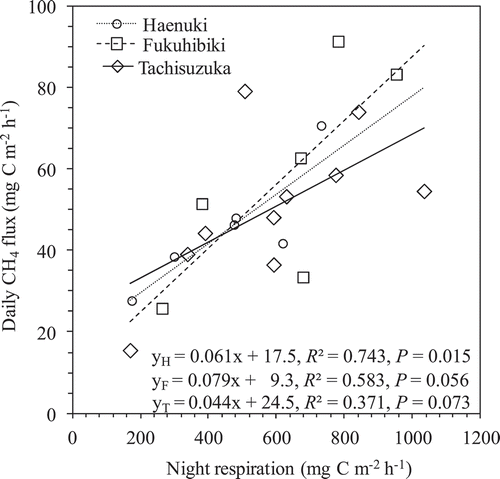
3.5. Relationships between CH4 flux and night respiration
Except the first 4 times gas sampling, significant (P < 0.05) or obvious (P < 0.1) positive correlations were found between CH4 flux and night respiration among the three varieties throughout after 9 weeks of rice transplanting (). The samples for Haenuki, Fukuhibiki, and Tachisuzuka were 6, 6, and10 times, respectively. Although the P values were 0.015, 0.056, and 0.073 for Haenuki, Fukuhibiki, and Tachisuzuka, respectively, the P value was 0.004 for the three varieties combined together.
Figure 5. Relationship between daily CH4 flux and night respiration (CO2 emission) among three rice varieties throughout after 9 weeks of rice transplanting. The samples for Haenuki, Fukuhibiki and Tachisuzuka were 6, 6, and 10, respectively.
4. Discussion
For cultivating forage rice, 1.5–2 times of conventional N fertilizer applications for edible rice have been recommended. In this pot experiment, we applied 1.5 times of basal fertilizers for forage rice Fukuhibiki and Tachisuzuka compared to Haenuki. Further, Fukuhibiki and Tachisuzuka had an extra one time added N fertilization. The total amounts of N, P, and K fertilizers applied for Fukuhibiki and Tachisuzuka were 1.7, 1.3, and 1.3 times, respectively, higher than those of Haenuki. As the results, the rice growth periods of Fukuhibiki and Haenuki were similar to those of field cultivations in Tsuruoka,Yamagata as reported by Morita et al. (Citation2012), while the growth parameters of Tachisuzuka, such as shoot height, heading day, and total growth period, were also similar to Matsushita et al. (Citation2011), for rice plants grown in Kanto and Shikoku regions, Japan. Therefore, the results obtained from our pots experiment could be representative of the rice grown under field condition. In this experiment, flooding water depth was maintained for the entire rice growth period until harvest, so total CH4 emission from this pots experiment should be higher than those from the field condition where the middle and before harvest drainage are normally carried out (Itoh et al. Citation2011; Ma et al. Citation2013). However, the different CH4 emission rates between the edible and forage rice varieties from this experiment could be of importance to explain the emission differences under field conditions.
Most CH4 released from flooding paddies is released through the rice plants (Nouchi et al. Citation1990; Cheng et al. Citation2006). The sources of CH4 production are from both older matter (e.g., native soil organic matter, incorporated organic material such as straw and manure) (Chidthaisong and Watanabe Citation1997; Nakajima et al. Citation2017) and new matter from plant growth (e.g., root exudates and plant debris) (Watanabe et al. Citation1999; Tokida et al. Citation2011). In this pot experiment, we used light air-dried soil (at 25% w/t moisture) without any visible plant residues for cultivating the three rice varieties, no obvious CH4 flux was detected during early rice growth period until 43 DAT (). The CH4 flux increased sharply after 43 DAT and reached to the highest peaks at heading stage for Haenuki and Fukuhibiki, and the second highest peak for Tachisuzuka around the 9–10th weeks after rice transplanting. During the same period, the plant night respirations also recorded the highest peaks for the three rice varieties ( and ). Also significant (P < 0.05) or obvious (P < 0.1) positive correlations were found between CH4 flux and plant night respiration among the three varieties throughout 9 weeks after rice transplanting (). Since there were significant relationships between night respiration and gross or net rice photosynthesis rates (Sakai et al. Citation2001), the plant night respiration could be representative of the plant photosynthesis potential in day-time, which can become the carbon source to soil for CH4 production (Cheng et al. Citation2008). Thus, our results implied that the source of CH4 emissions from the three varieties was mostly from new matter through root exudates and plant debris, and not from older matter, such as native soil organic matter and incorporated organic material, which is consistent with our previous results (Cheng et al. Citation2006; Citation2008; Lou et al. Citation2008). Compared to Haenuki and Fukuhibiki, Tachisuzuka had multiple CH4 flux peaks from the longer growth period under continuous flooded condition (). Though the highest peak of CH4 flux for Tachisuzuka also occurred around the heading stage at 99 DAT, the plant night respiration on the same day was 506.4 mg C m−2 h−1, which was lower than the largest value (1034.1 mg C m−2 h−1) at 71 DAT, when the second highest peak of CH4 flux occurred. The two largest CH4 peaks at 64 and 99 DATs for Tachisuzuka could partly be attributed to, among other factors, the differences in CH4 flux pattern and growth periods between Tachisuzuka and Fukuhibiki or Haenuki. However, we have no clear reference to support our observation.
In this experiment, we also found that there was a high relationship between dry weight of root biomass at harvest and accumulated CH4 emission during the entire experimental period from the three varieties with four replicates (Fig. S4). The net CH4 emission is determined by the balance between its production and oxidation in rice plant and paddy soil ecosystems (Inubushi et al. Citation2003). Large root biomass of rice can affect CH4 production and oxidation simultaneously. It could be presumed that large root biomass increased CH4 production by root exudates and increased CH4 oxidation through delivery of oxygen from atmosphere to the rhizosphere (Cheng et al. Citation2008). The root biomass of forage rice, Fukuhibiki and Tachisuzuka were 56.3% and 138.4% higher than edible rice Haenuki at harvest. The cumulated CH4 emissions were 39.9% and 87.0% higher from Fukuhibiki and Tachisuzuka pots than that of Haenuki in this study (). Though we had no effective method to detect the CH4 oxidation among the three rice varieties, the increasing rate of root biomass, and the cumulated CH4 emissions by forage rice shown above implied that large root biomass increased the net CH4 emission (gross CH4 production minus CH4 oxidation). Since this pot experiment was conducted under flooded conditions throughout the entire experimental period, the balance between CH4 production and oxidation would be different to the real forage rice cultivation in the fields. More measurements are needed to carry out under field condition in future.
In addition, developing domestic feed production can decrease atmospheric CO2 emission from the transportation sector, though the cost of domestic forage crop production is higher than the importation cost in some cases. However, the CH4 emission from forage rice production is still not considered by scientists and policy makers. To our knowledge, this study is the first to compare the CH4 flux and emission from edible and forage rice, including feed rice and WSC varieties together. Our results showed that forage rice Fukuhibiki (for concentrate feed) and Tachisuzuka (for roughage feed as WCS) emitted larger CH4 than edible rice Haenuki when they were grown under similar soil and meteorological conditions and managements, except the heavier fertilizations during the rice growth period (). The cumulated CH4 emissions from Fukuhibiki and Tachisuzuka were 39.9% and 87.0% higher than that from Haenuki throughout their growth period (). This implied that promoting the forage rice production would increase more CH4 emission from Japanese agriculture sector. But the comprehensive effect from decreasing CO2 emission from transportation sector and possibly decreasing soil C loss from rice paddies should be considered together by life-cycle inventory analysis (Harada et al. Citation2007) and reflect into National Greenhouse Gas Inventory Report of Japan (NIES Citation2016).
5. Conclusions
Edible rice Haenuki, forage rice Fukuhibiki (for concentrate feed), and Tachisuzuka (for roughage feed as WCS) were cultivated under similar soil and meteorological conditions to compare the CH4 emissions in pots experiment. The rice growth period was 107 DAT for Haenuki and Fukuhibiki, and 135 DAT for Tachisuzuka, which was 4 weeks later than Haenuki and Fukuhibiki. The highest peak of CH4 flux occurred around the heading stage for the three varieties, while Tachisuzuka had multiple peaks of CH4 fluxes from the longer growth period Since the soil used for the pot experiment had been piled up outdoors for 2 years before being used, the C source for CH4 production was mostly from new matter through rice plant photosynthesis in the current-season. Our results indicated that forage rice Fukuhibiki (for concentrate feed) and Tachisuzuka (for roughage feed as WCS) emitted larger CH4 than edible rice Haenuki. The cumulated CH4 emissions were 39.9% and 87.0% higher from Fukuhibiki and Tachisuzuka, respectively, than that from Haenuki throughout their growth seasons. It should be noted that our results are based on pot experiment, field studies should be carried out in future.
Supplementary_for_journal_of_SSPN-forage_rice_by_Cheng_et_al..docx
Download MS Word (136.2 KB)Acknowledgments
Second author Samuel Munyaka Kimani would like to appreciate the African Business Education Initiative program for supporting his study in Japan.
Supplemental material
Supplemental data for this article can be accessed here.
Additional information
Funding
Related Research Data
References
- Aulakh MS, Wassmann R, Rennenberg H 2002: Methane transport capacity of twenty-two rice cultivars from five major Asian rice-growing countries. Agr. Ecosyst. Environ., 91, 59–71. doi:10.1016/S0167-8809(01)00260-2
- Cheng W, Padre AT, Sato C, Shiono H, Hattori S, Kajihara A, Aoyama M, Tawaraya K, Kumagai K 2016: Changes in the soil C and N contents, C decomposition and N mineralization potentials in a rice paddy after long-term application of inorganic fertilizers and organic matters. Soil Sci. Plant Nutr., 62, 212–219. doi:10.1080/00380768.2016.1155169
- Cheng W, Sakai H, Hartley AE, Yagi K, Hasegawa T 2008: Increased night temperature reduces the stimulatory effect of elevated carbon dioxide concentration on methane emission from rice paddy soil. Glob. Change Biol., 14, 644–656. doi:10.1111/j.1365-2486.2007.01532.x
- Cheng W, Sakai H, Yagi K, Hasegawa T 2009: Interactions of elevated [CO2] and night temperature on rice growth and yield. Agr. For. Meteorol., 149, 51–58. doi:10.1016/j.agrformet.2008.07.006
- Cheng W, Yagi K, Sakai H, Kobayashi K 2006: Effects of elevated atmospheric CO2 concentrations on CH4 and N2O emission from rice soil: An experiment in controlled-environment chambers. Biogeochemistry, 77, 351–373. doi:10.1007/s10533-005-1534-2
- Chidthaisong A, Watanabe I 1997: Methane formation and emission from flooded rice soil incorporated with 13C-labeled rice straw. Soil Biol. Biochem., 29, 1173–1181. doi:10.1016/S0038-0717(97)00034-5
- Fukushima A 2012: Yield potential of high-yield rice varieties in the Tohoku region of Japan. JARQ, 46, 199–204. doi:10.6090/jarq.46.199
- Gutierreza J, Kim SY, Kim PJ 2013: Effect of rice cultivar on CH4 emissions and productivity in Korean paddy soil. Field Crops Res., 146, 16–24. doi:10.1016/j.fcr.2013.03.003
- Harada H, Kobayashi H, Shindo H 2007: Reduction in greenhouse gas emissions by no-tilling rice cultivation in Hachirogata polder, northern Japan: Life-cycle inventory analysis. Soil Sci. Plant Nutr., 53, 668–677. doi:10.1111/j.1747-0765.2007.00174.x
- Hayano M, Fumoto T, Yagi K, Shirato Y 2013: National-scale estimation of methane emission from paddy fields in Japan: Database construction and upscaling using a process-based biogeochemistry model. Soil Sci. Plant Nutr., 59, 812–823. doi:10.1080/00380768.2013.836943
- Huang Y, Sass RL, Fisher FM 1997: Methane emission from Texas rice paddy soils, 1, quantitative multi-year dependence of CH4 emission on soil, cultivar and grain yield. Glob. Change Biol., 3, 479–489. doi:10.1046/j.1365-2486.1997.00083.x
- Inubushi K, Cheng W, Aonuma S, Hoque MM, Kobayashi K, Miura S, Kim HY, Okada M 2003: Effects of free-air CO2 enrichment (FACE) on CH4 emission from a rice paddy field. Glob. Change Biol., 9, 1458–1464. doi:10.1046/j.1365-2486.2003.00665.x
- Itoh M, Sudo S, Mori S et al. 2011: Mitigation of methane emissions from paddy fields by prolonging midseason drainage. Agr. Ecosyst. Environ., 141, 359–372. doi:10.1016/j.agee.2011.03.019
- Jia Z, Cai Z, Tsuruta H 2006: Effect of rice cultivar on CH4 production potential of rice soil and CH4 emission in a pot experiment. Soil Sci. Plant Nutr., 52, 341–348. doi:10.1111/j.1747-0765.2006.00043.x
- Kato H 2008: Development of rice varieties for whole crop silage (WCS) in Japan. JARQ, 42, 231–236. doi:10.6090/jarq.42.231
- Lou Y, Inubushi K, Mizuno T, Hasegawa T, Lin Y, Sakai H, Cheng W, Kobayashi K 2008: CH4 emission with differences in atmospheric CO2 enrichment and rice cultivars in a Japanese paddy soil. Glob. Change Biol., 14, 2678–2687.
- Ma J, Ji Y, Zhang G, Xu H, Yagi K 2013: Timing of midseason aeration to reduce CH4 and N2O emissions from double rice cultivation in China. Soil Sci. Plant Nutr., 59, 35–45. doi:10.1080/00380768.2012.730477
- MAFF 2017: About Promoting Forage Rice (Shiryoyoumei no Suishin ni Tsuite). Ministry of Agriculture, Forestry and Fisheries (MAFF) (in Japanese). http://www.maff.go.jp/j/seisan/kokumotu/pdf/siryomai_meguji_2902.pdf (February, 2017).
- Matsushita K, Iida S, Ideta O, Sunohara Y, Maeda H, Tamura Y, Kouno S, Takakuwa M 2011: ‘Tachisuzuka’, a new rice cultivar with high straw yield and high sugar content for whole-crop silage use. Breed. Sci., 61, 86–92. doi:10.1270/jsbbs.61.86
- Minamikawa K, Tokida T, Sudo S, Padre A, Yagi K 2015: Guidelines for Measuring CH4 and N2O Emissions from Rice Paddies by a Manually Operated Closed Chamber Method. National Institute for Agro-Environmental Sciences, Tsukuba.
- Morita M, Ishikawa M, Yoshida N, Horiguchi K, Takahashi T 2012: Influence of ammonium sulfate fertilizer recovered through ammonia-collecting equipment on growth on yield of forage rice. Jpn. J. Grassl. Sci., 58, 166−172 (in Japanese with English summary).
- Nakajima M, Cheng W, Hanayama S, Okada M 2017: Shallow autumn tillage does not reduce CH4 emission from an Andisol paddy field in Morioka, a cold region in Japan. J. Agri. Meteorol., 73, 92–99. doi:10.2480/agrmet.D-16-00009
- Nakajima M, Cheng W, Tang S, Hori Y, Yaginuma E, Hattori S, Hanayama S, Tawaraya K, Xu X 2016: Modeling aerobic decomposition of rice straw during the off-rice season in an Andisol paddy soil in a cold temperate region of Japan: Effects of soil temperature and moisture. Soil Sci. Plant Nutr., 62, 90–98. doi:10.1080/00380768.2015.1121116
- NIES (National Institute for Environmental Studies, Japan) 2016: National Greenhouse Gas Inventory Report of JAPAN (in Japanese). http://www-gio.nies.go.jp/aboutghg/nir/2016/NIR-JPN-2016-v3.0_rev_web.pdf (April, 2016).
- Nouchi I, Mariko S, Aoki K 1990: Mechanism of methane transport from the rhizosphere to the atmosphere through rice plants. Plant Physiol., 94, 59−66. doi:10.1104/pp.94.1.59
- Ozawa W, Yoshida N 2009: Forage Rice Cultivation and Usage (Shiryoyoumei No Saibai to Riyou). Soshisha Press, Tokyo (in Japanese).
- Riya S, Zhou S, Watanabe Y, Sagehashi M, Terada A, Hosomi M 2012: CH4 and N2O emissions from different varieties of forage rice (Oryza sativa L.) treating liquid cattle waste. Sci. Total Environ., 419, 178–186. doi:10.1016/j.scitotenv.2012.01.014
- Sakai H, Yagi K, Kobayashi K, Kawashima S 2001: Rice carbon balance under elevated CO2. New Phytolog., 150, 241–249. doi:10.1046/j.1469-8137.2001.00105.x
- Smil V, Kobayashi K 2012: Japan’s Dietary Transition and its Impacts. The MIT Press, Massachusetts Institute of Technology, Cambridge, MA.
- Sudo S 2006: Method and instrument for measuring atmospheric gas. Industrial Property Digital Library, Patent of Japan (no. 2006–275844).
- Tokida T, Adachi M, Cheng W, Nakajima Y, Fumoto T, Matsushima M, Nakamura H, Okada M, Sameshima R, Hasegawa T 2011: Methane and soil CO2 production from current-season photosynthates in a rice paddy exposed to elevated CO2 concentration and soil temperature. Glob. Change Biol., 17, 3327–3337. doi:10.1111/j.1365-2486.2011.02475.x
- Wassmann R, Aulakh MS 2000: The role of rice plants in regulating mechanisms of methane missions. Biol. Fertil. Soils, 31, 20–29. doi:10.1007/s003740050619
- Watanabe A, Kimura M 1998: Factors affecting variation in CH4 emission from paddy soils grown with different rice cultivars: A pot experiment. J. Geophys. Res., 103, 18947–18952. doi:10.1029/98JD01679
- Watanabe A, Takeda T, Kimura M 1999: Evaluation of origins of CH4 carbon emitted from rice paddies. J. Geophys. Res., 104, 23623–23629. doi:10.1029/1999JD900467
- Win AT, Toyota K, Ito D, Chikamatsu S, Motobayashi T, Takahashi N, Ookawa T, Hirasawa T 2016: Effect of two whole-crop rice (Oryza sativa L.) cultivars on methane emission and Cu and Zn uptake in a paddy field fertilized with biogas slurry. Soil Sci. Plant Nutr., 62, 99–105.
- Win AT, Toyota K, Win KT, Motobayashi T, Ookawa T, Hirasawa T, Chen D, Lu J 2014: Effect of biogas slurry application on CH4 and N2O emissions, Cu and Zn uptakes by whole crop rice in a paddy field in Japan. Soil Sci. Plant Nutr., 60, 411–422. doi:10.1080/00380768.2014.899886
- Yagi K, Minami K 1990: Effect of organic matter application on methane emission from some Japanese paddy fields. Soil Sci. Plant Nutr., 36, 599–610. doi:10.1080/00380768.1990.10416797
- Yao H, Yagi K, Nouchi I 2000: Importance of physical plant properties on methane transport through several rice cultivars. Plant Soil, 222, 83–93. doi:10.1023/A:1004773810520
- Zhang Y, Jiang Y, Li Z, Zhu X, Wang X, Chen J, Hang X, Deng A, Zhang J, Zhang W 2015: Aboveground morphological traits do not predict rice variety effects on CH4 emissions. Agr. Ecosyst. Environ., 208, 86–93. doi:10.1016/j.agee.2015.04.030