
 ?Mathematical formulae have been encoded as MathML and are displayed in this HTML version using MathJax in order to improve their display. Uncheck the box to turn MathJax off. This feature requires Javascript. Click on a formula to zoom.
ABSTRACT
Plant nitrogen (N)-acquisition strategy affects soil N availability, community structure, and vegetation productivity. Cultivated grasslands are widely established to improve degraded pastures, but little information is available to evaluate the link between N uptake preference and forage crop biomass. Here an in-situ 15N labeling experiment was conducted in the four cultivated grasslands of Inner Mongolia, including two dicots (Medicago sativa and Brassica campestris) and two monocots (Bromus inermis and Leymus chinensis). Plant N uptake rate, shoot- and root biomass, and concentrations of soil inorganic-N and microbial biomass-N were measured. The results showed that the root/shoot ratios of the dicots were 2.6 to 16.4 fold those of the monocots. The shoot N concentrations of the dicots or legumes were 40.6% to 165% higher than those of the monocots or non-legumes. The four forage crops in the cultivated grassland preferred to uptake more NO3−-N than NH4+-N regardless of growth stages, and the NH4+/NO3− uptake ratios were significantly lower in the non-legumes than in the legumes (p < 0.05). Significant differences in the NH4+-N rather than NO3−-N uptake rate were observed among the four forages, related to plant functional types and growth stages. The NH4+ uptake rate in the perennial forages exponentially decreased with the increases in shoot-, root biomass, and root/shoot ratio. Also, the plant NH4+/NO3− uptake ratio was positively correlated with soil NH4+/NO3− ratio. Our results suggest that the major forage crops prefer to absorb soil NO3−-N, depending on soil inorganic N composition and belowground C allocation. The preferential uptake of NO3−-N by forages indicates that nitrate-N fertilizer could have a higher promotion on productivity than ammonium-N fertilizer in the semi-arid cultivated grassland.
1. Introduction
Nitrogen (N) is an essential element for plant growth and a limiting factor in the productivity of terrestrial ecosystems (LeBauer and Treseder Citation2008). Plants can directly take up NH4+-N, NO3–N, and low molecular weight organic N from soils (Jones et al. Citation2005), and then they are assimilated and synthesized into proteins for the construction of plant tissues and organs. In order to take up enough N to meet the needs of its growth and development, plant develops various N-acquisition strategies (e.g., N uptake preference) (Silvertown Citation2004). Plant N-acquisition strategy directly and indirectly affects soil N availability, species coexistence and diversity, community structure, and vegetation productivity (Houlton et al. Citation2007). Therefore, understanding plant N-acquisition strategy is critical to promote productivity and stability in terrestrial ecosystems (Van Der Heijden, Bardgett, and Van Straalen Citation2008).
Ammonium (NH4+) and nitrate (NO3−) in soil solution diffuse and migrate to the root–soil interface before they are absorbed by plants. Ammonium ions are absorbed by the plant via ammonia (NH3) transporters. Both absorbed and synthesized NH3 is incorporated into amino acids via the glutamine synthetase-glutamate synthase (GS-GOGAT) pathway (Masclaux-Daubresse et al. Citation2006). While nearly all the NH3 in the root is usually incorporated into amino acids at the root itself (Kiyomiya et al. Citation2001), plants may transport significant amounts of NH4+ in the xylem to be fixed in the shoots (Schjoerring et al. Citation2002). In contrast, NO3− is taken up by several NO3− transporters that use a proton gradient to power the transport (Sorgona et al. Citation2011). Nitrate is first reduced to nitrite (NO2−) in the cytosol by NO3− reductase using NADH or NADPH, and NO2− is then reduced to NH3 in the chloroplasts (plastids in roots) by a ferredoxin dependent nitrite reductase (Tischner Citation2000). Most of the NO3− reduction is carried out in the shoots while the roots reduce only a small fraction of the absorbed NO3− to NH3 (Scheurwater et al. Citation2002). Thus, most plants exhibit higher affinity for absorption of NH4+ than NO3− due to low energy consumption (5 ATP mol−1 NH4+ vs 20 ATP mol−1 NO3−), but the accumulation of NH4+ in the cells is not conducive to plant growth due to ammonium toxicity (Boudsocq et al. Citation2012). It is still controversial that plants will preferentially absorb which N ion.
The ability of a plant to capture NH4+-N or NO3–N from the soil depends on soil type, environment, and species, etc. Soil water content influences the rate of oxygen supply and several N transformation processes within the soils, while soil properties especially hydraulic conductivity affects soil N loss pathways. In aerobic and arid soils where nitrification can occur, NO3–N is usually the predominant form of available N that is absorbed (Xu et al. Citation2011); however, NH4+-N can predominate in forests and in flooded, anaerobic soils like rice paddies (Houlton et al. Citation2007; Ishii et al. Citation2011). Plant N uptake preference is closely related to soil inorganic N composition (NO3−/NH4+ ratio, Kahmen, Wanek, and Buchmann Citation2008). Soil pH affects the plant N uptake preference through choosing the high- or low-affinity transport systems of NH4+-N and NO3–N (Van Beusichem, Kirkby, and Baas Citation1988). The rate of NO3–N uptake is usually high and is favored under high-pH conditions, while NH4+-N uptake is best under neutral condition (Hawkins and Robbins Citation2010). Additionally, the plant species with low nitrate activity (e.g., blueberries) are almost completely dependent on NH4+-N as the N source, whereas the monocots particularly grasses seem to be willing to use NO3–N (Maathuis Citation2009). Monocots generally have an excess of anion uptake over cation uptake which results in an increased pH in the rhizosphere. So monocots may prefer NH4+-N in acid soil conditions, but NO3–N under alkaline conditions (Marschner et al., Citation1991). Also, NO3–N are presumably related to the cation exchange capacity of the root tissue, and the dicots are higher than the monocots (Haynes Citation1980).
China’s natural grassland area is approximately 400 million ha, accounting for 40% of the country’s land area (Li et al. Citation2017). It is estimated that 31.8% of grassland in China (1.05 × 10⁸ ha) has been undergoing different degrees of degradation due to climate change and overgrazing (Wang et al. Citation2017). Cultivated grassland has higher productivity than natural pasture, which can to some extent relieve the pressure of natural pasture and increase the number of livestock. In 2013, the area of cultivated grassland in China has reached 1.2 × 10⁷ ha (Xu et al. Citation2018), becoming a necessary business model of modern grassland farming system. However, the conversion of natural grassland to cultivated grassland will raise several ecological problems, including decline in soil water and nutrients (Connell et al. Citation2011) and decrease in ecosystem stability (Xu et al. Citation2018). Species-specific differences in direct uptake of different N forms in the temperate grassland ecosystems have been regarded as an important mechanism influencing species coexistence (Weigelt, Bol, and Bardgett Citation2005). Exploring the N-acquisition strategies of representative forage crops as well as its driving mechanisms is critical to construct reasonable cropping pattern and fertilizer regime. Unfortunately, previous studies mainly focused on natural grassland ecosystems, and little information is available about forage crops N-acquisition strategies in cultivated grassland.
In the Hulunber region of Inner Mongolia, managed grasslands of legumes (Medicago sativa), non-legumes (Bromus inermis), and oil crop (Brassica campestris) are common land-use types to substitute the native temperate grasslands (Leymus chinensis). To date, the characteristics and controlling factors of the N preferential use in the four forage crops are still unclear. We hypothesized that plant N content was closely related to soil mineral N content. The four test species could prefer to absorb more NO3−-N than NH4+-N because NO3−-N dominates inorganic N in the aerobic and managed grassland soil (Xu et al. Citation2018). Also, we hypothesized that the N uptake preference could depend on plant adaptation to soil conditions, which is closely related to the plant functional type (dicots vs monocots), above- and belowground biomass, and soil N composition. In order to test the two hypotheses, we conducted an in situ 15N labeling experiment in Hulunber. The main objectives were to: (1) investigate the effects of different forage crop cultivations on general soil properties, above- and belowground biomass, plant and microbial biomass N concentration, and soil NH4+-N and NO3−-N concentration; (2) compare the rates of NH4+-N and NO3−-N uptake of the four species at the different growth stages; and (3) clarify the relationships between forage N uptake rates and key driving factors.
2. Materials and methods
2.1. Site description and herbage cultivation
This study was conducted at the Hulunber Grassland Ecosystem Observation and Research Station (N 49°19ʹ35”, E 119°56ʹ52”, 650 m a. s. l.), located in the northeast of Inner Mongolia, China. The region has a characteristic of mid-temperate semi-arid continental climate. Average monthly temperature varies from −48.5°C in January to 36.2°C in July, with a mean annual temperature of −1.5°C. Accumulated temperature above 10°C is between 1700°C and 2300°C, and the frostless season is about 110 days. The mean annual precipitation ranges from 350 mm to 400 mm between 2000 and 2010, of which approximately 80% falls in June to September (Xu et al. Citation2018). The soil in this region is classified as a chernozem (IUSS WG WRB Citation2015). The type of land use is farmland, which has been continuously planting oilseed rape (Brassica campestris) for more than two decades. In 2010, some oilseed rape cropland was converted and grow leymus, alfalfa, and bromegrass, respectively. Here, we use oilseed rape farmland as a control.
Two monocots (Bromus inermis and Leymus chinensis) and two dicots (Medicago sativa and Brassica campestris) were selected to compare the differences in N uptake. Both B. inermis and L. chinensis are perennial grasses, M. sativa is a perennial legume forage, while B. campestris is an annual oil crop. The four species are widely cultivated in the Hulunber region. The multiple-species cultivation experiment was established using a randomized block design in 2010. Each treatment had four replicated plots, with an area of 12 m × 20 m for each plot. The seeding rates for M. sativa, B. inermis, L. chinensis, and B. campestris were 15.0, 22.5, 37.5, and 75.0 kg ha−1, respectively. Three perennial forages were cultivated in 2010, while B. campestris was cultivated for four years since 2010. The aboveground biomasses were removed and the roots were retained in the soil at the end of September. No fertilizer was applied for any experimental treatments. The general soil properties in the surface layer (0–20 cm) in different experimental treatments are shown in .
Table 1. General soil properties in the 0–20 cm soil depth under different forage crop cultivations after four years of forage crop cultivation
2.2. 15N labeling experiment
In 2014, the mean annual temperature and mean annual precipitation in Hulunbeier area were −1.6°C and 365 mm, respectively, which was close to the multi-year average of air temperature (−2~-1oC) and precipitation (300–500 mm). The forage crops were growing well because there was no obvious drought. 15N labeling was performed for each experimental treatment during the flowering phase (in July) and maturation phase (in August), respectively. At each plot, three micro-plots (30 cm × 30 cm) were randomly established to label N, including 15N-labeled (NH4)2SO4 (15NH4+), 15N-labeled KNO3 (15NO3−), and a zero N control. The 15N labeling experiment was conducted at 10:00 a.m. on a sunny day. At each micro-plot, an equal amount of 23.2 mg 15NO3−-N (K15NO3, 10 atom% 15N) or 15NH4+-N ((15NH4)2SO4, 10 atom% 15N) was dissolved in 20 mL deionized water. A previous study by in the same region showed that temperate plants acquired 67% of their N from the 0–5 cm soil layer and 33% from the 5–15 cm layer (Liu et al. Citation2016). Therefore, we focused on the uptake of targeted plants from the upper 5 cm soil and injected N at 2.5 cm depth. In order to avoid N fertilization effect, we used N at a low rate of 2.58 kg ha−1, equal to <5.0 μg g−1 soil. To ensure the even distribution of the 15N, a total of 4 mL of labeled solution was injected into the soil around the plant using a triangular fashion (i.e., with the plant generally growing in the center of a triangle). The solution was injected at a distance of about 0.5 cm from the center to avoid injecting the roots. The control micro-plots only received the same amount of deionized water.
2.3. Crop harvest and measurement
After labeling for 24 h, shoot (leaf plus stem) and root samples in each micro-plot of 30 cm × 30 cm were collected. The shoot was cut off, and then the soil core in the 0–30 cm depth was excavated. All the roots were carefully separated from the soil. The shoot and root samples were dried at 75°C for 48 h to measure their biomass using the oven-drying method.
A part of dried shoot and root subsamples were ground to a fine powder in a planetary mill (FSD-100A, China). 15N/14N ratio and N concentration of samples were determined simultaneously on an isotope ratio mass spectrometer (Finnigan MAT-253, Thermo Electron) coupled to an automatic, online elemental analyzer (Flash EA1112, Thermofinnigan) (Fang et al. Citation2011).
2.4. Soil sampling and measurement
The soil core in the 0–30 cm depth at each micro-plot was excavated after plant collection. The soil samples were sieved (2 mm mesh) to remove coarse plant residues and gravels, and stored at 4°C for the measurements of soil NH4+-N, NO3−-N, and microbial biomass N (MBN).
Soil samples were extracted using 2 M KCl solution (soil:water = 1:10) and shaken for 1 h. Then, soil suspensions were filtered using Whatman #1 filters, and the extracts were determined for NH4+-N and NO3–N concentrations on a continuous-flow autoanalyzer (AA3, SEAL company, Germany) (Fang et al. Citation2014). Soil MBN was determined on a 15-g oven-dry equivalent field-moist soil sample using the chloroform fumigation–extraction method (Brookes et al. Citation1985). In brief, organic N from the fumigated (24 h) and non-fumigated (control) soil were quantified by a CN analyzer (Model TOC-V/CPH-TN; Shimadzu, Kyoto, Japan). The non-fumigated control values were subtracted from the fumigated values. The MBN was calculated using a kEC factor of 0.54 (Jenkinson Citation1988). The MBN content was determined once a month during the growing season (from May to September). Also, another soil subsamples were ground to a fine powder to measure 15N/14N ratio and N concentration on an isotope ratio mass spectrometer (Finnigan MAT-253, Thermo Electron). Except soil total N (TN), other general soil properties including soil organic carbon (SOC), available potassium (AK), soil moisture (MS), bulk density (BD), and pH value were measured by the potassium dichromate volumetric method, ammonium acetate extraction method, oven-drying method, ring knife method, and pH meter, respectively (Lu Citation1999).
2.5. Data calculation and statistical analysis
15N uptake of by plants (15Nuptake, mg 15N m−2) was calculated using Equationequation (1)(1)
(1) (McKane et al. Citation2002):
where [N] is plant N concentration (%), APE is atom percent excess (atom%labeled − atom%control), Biomass is the sum of shoot and root biomass (g m−2).
The uptake rates of NO3–N or NH4+-N by plants (MNuptake rate, mg N kg−1 root h−1) were calculated using the Equationequations (2)(2)
(2) and (Equation3
(3)
(3) ) (Xu et al. Citation2011):
where MNuptake is the rate of NO3–N or NH4+-N uptake by plants, 15Nadded is the total amount of added 15NO3− or 15NH4+ (mg kg−1), [MN] is the concentrations of soil NO3–N or NH4+-N in the control plot (mg kg−1), Root biomass is equal to belowground biomass (g m−2), T is the duration of 15N labeling experiment (24 h).
One-way analysis of variance (ANOVA) combined with Tukey’s honestly significant difference (HSD) test was used to evaluate the effects of the four forage crop cultivations on general soil properties, shoot and root biomass, N concentrations of shoot and microbial biomass, soil inorganic N concentration, and mineral N uptake rates in plants at different growth stages. Paired t-test was used to examine the difference in each response variable between the flowering and maturation phases. Also, the relationships between mineral N uptake rates in plants and shoot-, root biomasses, and root/shoot ratios, as well as the relationship between plant NH4+/NO3− uptake ratios and soil NH4+/NO3− ratios were evaluated using the stepwise regression analyses. All statistics analyses were performed using the SPSS software package (version 16.0) and the graphs were drawn using the Sigmaplot software (version 12.5). Statistical significant differences were set with p values <0.05 unless stated otherwise.
3. Results
3.1. Soil general properties
After four years of forage crop cultivation, there was no significant difference in the TN concentration and pH value in the 0–20 cm depth among the four species cultivation treatments (). However, the SOC concentration was the highest in the cultivated M. sativa and L. chinensis plots, followed by the B. inermis plots, and the B. campestris plots was the lowest (). Similar to the pattern of SOC, soil available potassium concentration followed the order: M. sativa > L. chinensis > B. inermis > B. campestris (). L. chinensis cultivation tended to increase soil bulk density and decrease soil moisture content relative to the other three species cultivations ().
3.2. Shoot and root biomass
During the flowering phase, the shoot biomass of B. campestris was significantly higher than those of the other species; moreover, the shoot biomass of L. chinensis was significantly higher than that of B. inermis (-). However, no significant difference in the shoot biomass among the four species cultivations was observed during the maturation phase (-). Also, the shoot biomass of B. inermis and B. campestris was higher during the flowering phase than during the maturation phase (-).
Figure 1. Shoot- and root biomass in the four forage crop cultivations during the flowering and maturation phases. Values are means ± standard error (n = 4). Different lowercase and uppercase letters mean significant difference in a given variable during the flowering and maturation phases, respectively. Asterisk (*) means a significant difference between the two growth stages at the level of 0.05 based on t-test
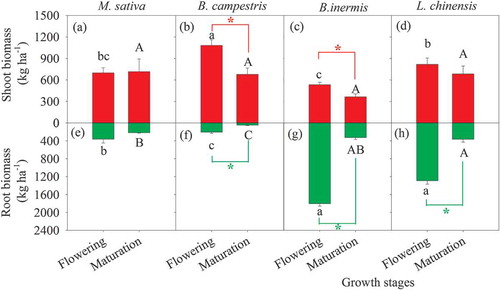
For the root biomass of flowering period, the two monocots, B. inermis and L. chinensis, were higher than the two dicots (i.e., M. sativa and B. campestris); the former was 3.5 to 8.8 fold those of the latter (-). Similar pattern was observed during the maturation phase, and the root biomass of L. chinensis was significantly higher than those of M. sativa and B. campestris (-). Except the cultivated M. sativa treatment, the root biomass was higher during the flowering phase than during the maturation phase (-). At the different growth stages, the root/shoot ratios in the two monocots, B. inermis and L. chinensis, averaged 2.13 and 1.05, respectively, which was greater than those of the two dicots (0.41 for M. sativa and 0.13 for B. campestris) ().
3.3. Nitrogen concentrations in shoot, soil, and microbial biomass
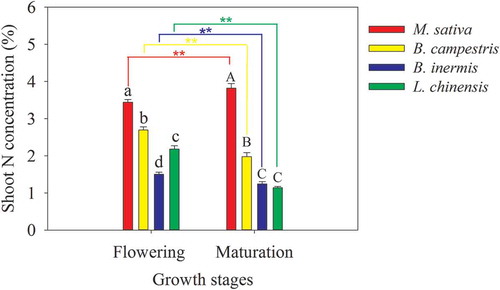
The N concentration of B. inermis shoot was the lowest among the four species, while that of M. sativa was the highest, attributed to the nature of atmospheric N2 fixation (). During the flowering phase or the maturation phase, the N concentrations of dicotyledonous M. sativa and B. campestris shoots were higher than those of monocotyledonous B. inermis and L. chinensis (p < 0.05, ). Significant difference in the shoot N concentration between the flowering phase and the maturation phase was observed (p < 0.01, ). From the flowering to maturity, the shoot N concentrations of B. inermis, L. chinensis, and B. campestris significantly decreased by 17.1% to 47.8%, whereas the shoot N concentration of M. sativa increased by 10.9% (p < 0.01, ).
Figure 2. Shoot N concentrations in the four forage crops during the flowering and maturation phases. Values are means ± standard error (n = 4). Different lowercase and uppercase letters mean significant difference in shoot N concentration during the flowering and maturation phases, respectively. Two Asterisks (**) mean a significant difference between the two growth stages at the level of 0.01 based on t-test
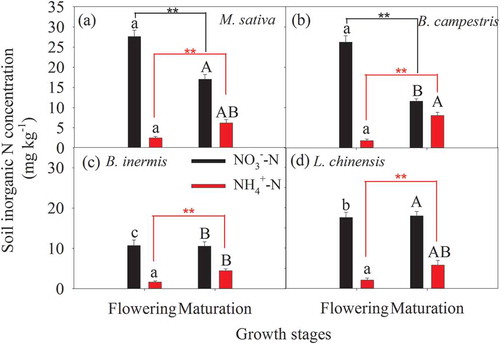
In the temperate cultivated grassland, soil inorganic N is dominated by NO3−-N, and soil NO3−-N concentrations were 1.4 to 14.9 fold those of soil NH4+-N at the different growth stages and species cultivations (). During the flowering phase, soil NO3−-N concentrations in the dicotyledonous M. sativa and B. campestris cultivations were significantly higher than those of monocotyledonous B. inermis and L. chinensis cultivations (p < 0.01, ). Similarly, during the maturation phase, soil NO3−-N concentration was the highest in the M. sativa cultivation, while the lowest soil NO3−-N concentration was observed in the B. inermis cultivation plots (). Significant difference in soil NO3−-N concentration was found in the dicots plots between the two growth stages (). In contrast, there was no significant difference in soil NH4+-N concentration among the four species cultivations during the flowering phase, but the soil NH4+-N concentration was significantly lower in the B. inermis cultivation than in the B. campestris cultivation during the maturation phase (). Furthermore, the soil NH4+-N concentration was lower during the flowering phase than during the maturation phase regardless of plant functional types ().
Figure 3. Soil NO3−-N and NH4+-N concentrations in the four species cultivations during the flowering and maturation phases. Different lowercase and uppercase letters mean significant difference in soil NO3−-N or NH4+-N concentration during the flowering and maturation phases, respectively. Two asterisks (**) mean a significant difference between the two growth stages at the level of 0.01 based on t-test
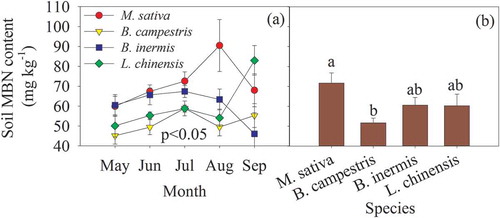
There was significant monthly variation in the soil MBN content, with the peak occurring in July to September for the different species cultivations (P < 0.05, )). Compared with the other non-legumes, M. sativa cultivation exhibited a higher MBN content throughout the growing season. However, the lowest soil MBN content was observed in the B. campestris cultivation treatment ()). The average soil MBN content in the M. sativa cultivation was 27.9% higher than that of B. campestris cultivation ()).
Figure 4. Monthly variation and mean of soil microbial biomass N (MBN) concentration in the different species cultivation plots. Different lowercase letters indicate significant difference among the four species cultivations
3.4. Inorganic N uptake by plants
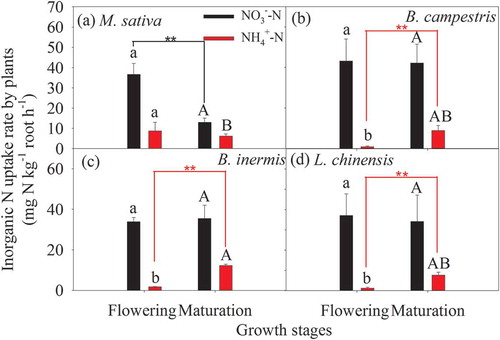
Forage crop species and growth stages influenced the preferential uptake of inorganic N in soils. In the artificial grasslands of Hulunbeier, forage crops absorbed more NO3−-N than NH4+-N regardless of forage crop species and growth stages (). The average ratio of plant NH4+/NO3− uptake ranged from 0.021 to 0.24 during the flowering phase, which was lower than those of the maturation phase ranging from 0.21 to 0.48; moreover, the average ratio of plant NH4+/NO3− uptake followed the order: B. campestris < L. chinensis < B. inermis < M. sativa (p < 0.05, ). Also, there was no significant difference in plant NO3−-N uptake rate during the flowering and maturation phases among the four species, but the plant NH4+-N uptake rate was significantly different among the four species regardless of the growth stages (). The NH4+-N uptake rate of leguminous M. sativa was significantly higher than those of the other non-legumes during the flowering phase, but was significantly lower than that of B. inermis during the maturation phase (p < 0.05, ). In addition, the difference in the NO3−-N uptake rate by M. sativa between the two growth stages as well as the differences in the NH4+-N uptake rate by the three non-legumes between the two growth stages were significant (p < 0.01, ).
Figure 5. Plant inorganic N uptake rates in the four species cultivations during the flowering and maturation phases. Different lowercase and uppercase letters mean significant difference in plant NO3−-N or NH4+-N uptake rates during the flowering and maturation periods, respectively. Two asterisks (**) mean a significant difference between the two growth stages at the level of 0.01 based on t-test
3.5. Relationships between plant N uptake and driving factors
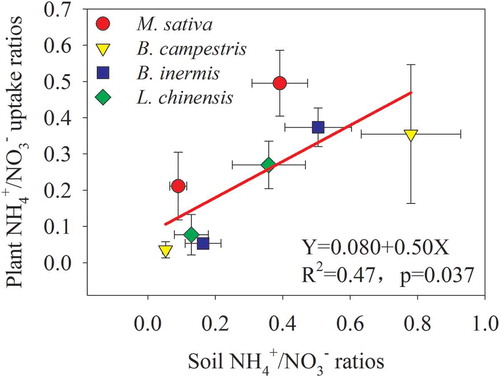
Except the M. sativa cultivation treatment, the plant NO3− uptake rates did not change obviously with the increase in shoot- and root biomass, and root/shoot ratios (-). Except the annual B. campestris, the NH4+ uptake rates in the perennial forages significantly decreased with the increases in shoot- and root biomass, and root/shoot ratios, and the relationships could be well fitted by linear or exponential decay equations (-). Also, the plant NH4+/NO3− uptake ratios were positively correlated with soil NH4+/NO3− ratios, and the latter could explain 47% of the former’s variation ().
Figure 6. Relationships between plant inorganic N uptake rates and shoot-, root biomass, and root/shoot ratios. B. campestris is removed from the statistical analysis
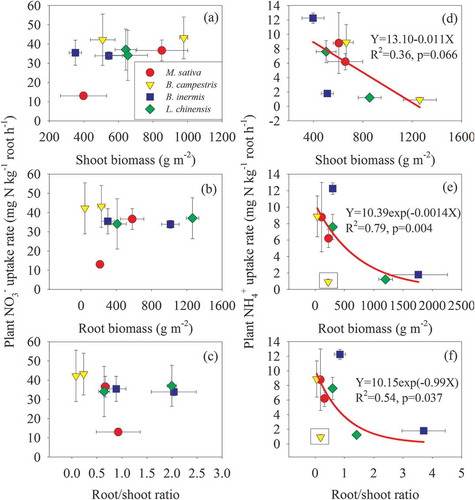
Figure 7. Relationships between plant NH4+/NO3− uptake ratios and soil NH4+/NO3− ratios
4. Discussion
According to the content of SOC in surface soil layer (), we found that M. Sativa and L. chinensis cultivations were more conducive to maintain SOC content compared with B. campestris cultivation. Although the shoot biomass in the B. campestris cultivation treatment was the highest, its root biomass was the lowest either during the flowering phase or during the maturation phase (). Considering that most of the aboveground biomass was usually removed before winter, the root biomass plays a dominant role in SOC pool dynamics (Ma et al. Citation2008). Also, the root/shoot ratios of the two monocots, B. inermis and L. chinensis, were greater than those of the two dicots (M. Sativa and B. campestris), indicating that the former has a higher return of plant residues than the latter.
The shoot N concentrations in the dicots especially legumes were significantly higher than those of the monocots. Generally, the content of Rubisco enzyme in dicots is higher than that of monocots (Sage and Seemann Citation1993), and N is the major constituent element of this enzyme (Han et al. Citation2005). Also, M. sativa, a leguminous forage, requires less inorganic N from the soil because it can fix N2 in the atmosphere through establishing a symbiosis with rhizobium and producing NH3 (Cui et al. Citation2017). In this study, the contents of soil inorganic N in the dicot cultivations were significantly higher than those of monocot cultivations, attributed to higher N concentration of plant residues (), and symbiotic N fixation (e.g., M. sativa), and higher soil microbial activity relative to the monocot cultivations. For instance, legumes cultivation tends to promote soil nitrifying bacteria activity leading to an accumulation in soil NO3−-N (Ollivier et al. Citation2011). Based on the resource competition/ratio theory proposed by Tilman (Citation1982), species with lower nutrient content are more suitable for growth in nutrient-limited areas in the long run. Plants with lower N and phosphorus (P) contents will become dominant species in N-limited or P-limited environments (Tilman Citation1997). Thus, the monocots with low N content are more competitive in growth and development relative to the dicots with high N content (Sewell Citation2004), which should be fully considered in plant-mixed farming. The N concentration in plant tissue, such as leaves and petioles, strongly depends on N availability (Subedi and Ma Citation2005). Overall, tissue N concentrations can be used to determine critical and optimal N concentrations in specific plant parts at defined periods of growth. Timing and rates of fertilizer N applications can be optimized based on critical N values to increase N use efficiency and prevent N losses.
Plant N uptake preference largely depends on the most abundant form of N in the soil, and soil NH4+/NO3− ratio is a pivotal proxy (Cui et al. Citation2017). In NH4+-enriched forest soil, plants preferentially absorb soil NH4+-N, and foliar δ15N is positively correlated with δ15N-NH4+ in soil (Cheng et al. Citation2010). In contrast, the four forage crops, M. sativa, B. inermis, L. chinensis, and B. campestris, preferred to absorb more NO3−-N than NH4+-N regardless of plant functional types and growth stages, which confirmed our first hypothesis. In the temperate-cultivated grassland, soil NO3−-N concentration accounted for 59% to 94% of total inorganic N concentration in different species cultivation and growth stages (). Semi-arid climate and artificial grassland management (e.g., tillage, irrigation, and fertilization, etc.) could be responsible for soil NO3−-N accumulation (Sapek, Estavillo, and Corre Citation2000). Similarly, in the alpine cultivated grassland where the soil NH4+/NO3− ratio less than 1, Cui et al. (Citation2017) documented that both legumes (alfalfa) and grasses preferred NO3−-N to NH4+-N during their growth stages. Here we observed that the plant NH4+/NO3− uptake ratios were positively correlated with soil NH4+/NO3− ratios (), which was partly supported our second hypothesis. Beside soil NH4+/NO3− ratio, the preferential uptake of soil NO3−-N by the four temperate forage crops was attributed to other aspects. For instance, NO3−-N synergistically promotes the uptake of cations, such as K, Ca, and Mg, while NH4+-N competes for the uptake with these cations (Sonneveld and Voogt Citation2009). Nitrates also limit the uptake of harmful elements, such as chloride, into large quantities (Cram Citation1973). Also, NO3−-N is the major anion taken up by most monocots in calcareous soil, and its uptake would contribute to antagonize Fe deficiency through elevating pH in the rhizosphere for the function of phytosiderophores (Abadía, et al. Citation2012). The conversion of NO3− and NH4+ into amino acids occurs in the leaves and roots, and they are fueled by solar energy and carbohydrates, respectively; the former is an energy-efficient process, whereas the latter are at the expense of other plant life processes, such as plant growth and fruit fill (Sonneveld and Voogt Citation2009). Forage preferential absorption of NO3−-N suggests that soil NO3−-N accumulation resulting from exogenous N inputs or accelerated soil nitrification could have a promotion on vegetation productivity in the cultivated grassland.
From the flowering phase to the maturation phase, the uptake rate of NO3−-N in the leguminous M. sativa decreased while the uptake rate of NH4+-N in the other non-legumes significantly increased (). This suggests that plant N uptake has a significant difference in different growth stages, and N in the plant tissues will be moved or reallocated during the senescence. The cumulative N uptake curve of annual crops from planting to maturity generally follows an S-shaped (sigmoid) curve (Martins et al. Citation2017). Little N is taken up during germination and seedling development. Nitrogen uptake is high and reaches a maximum during vegetative growth as the root system expands and leaves and stems develop. During the reproductive phase, the uptake pattern flattens off as N is moved or reallocated from the vegetative components to reproductive structures, such as seeds, fruits or tubers (Lemaire and Gastal Citation1997; Lemaire et al. Citation2008). Although the four forage crops in the temperate cultivated grassland prefer to absorb NO3−-N, the uptake rate of non-legumes did not variate obviously with the increase in shoot- and root biomass, indicating that soil NO3−-N content in the temperate cultivated grassland is sufficient and redundant for non-legumes growth. When N supply is adequate, crop N uptake mainly depends on crop growth rate and is influenced by nutrient and water availability (Gastal and Lemaire Citation2002). In contrast, the NH4+-N uptake rate of perennial forages significantly decreased with the increases in shoot- and root biomass as well as root/shoot ratios (-), suggesting the negative effect of plant NH4+-N uptake on biomass accumulation. The accumulation of NH4+-N in plant tissue cells can cause toxicity, which is not conducive to plant growth (Britto and Kronzucker Citation2002). Both NH4+ and NH3 easily diffuse through the cellular membranes, which leads to the protons are being transported from thylakoids to stroma; as a consequence, increased pH in thylakoids and decreased pH in stroma are toxic to plant photosynthesis (Werdan, Heldt, and Milovancev Citation1975). These results partly supported our second hypothesis that the N uptake preference could depend on plant adaptation to soil conditions.
5. Conclusions
Based on an in situ 15N labeling experiment and auxiliary plant and soil measurements, we found that the shoot N concentration was higher in the dicots or legumes than in the monocots or non-legumes. The test forage crops in the cultivated grassland preferred NO3−-N to NH4+-N regardless of plant functional type and growth stages. If the influences of other factors (e.g., genetic) are not considered, the rate of NH4+-N uptake could largely determine the difference in the N concentration in various forage shoots. MBN is the highest in soils planted with leguminous alfalfa, suggesting that the potential N supply and retention capacity is the strongest. The plant N uptake preference largely depended on soil inorganic N composition as well as plant belowground C allocation. Our results reveal to a certain extent the mechanisms of N acquisition in the representative forages, which contributes to the management of fertilization and mix farming in the temperate artificial grassland.
Acknowledgments
This research was funded by the National Key R&D Program of China (2016YFC0500603, 2017YFA0604802, 2017YFA0604804, 2016YFC0503603), CAS Strategic Priority Program (Nos. XDA2002040203, XDA23060401), the “973” Program (2015CB150803), National Natural Science Foundation of China (41703081, 31770558, 41977041, 41907036), the Development Plan Program of State Key Basic Research [2015CB150803]. the China agriculture research system (CARS-34), and the National Nonprofit Institute Research Grant of CAAS (647-53).
Disclosure statement
No potential conflict of interest was reported by the authors.
Additional information
Funding
References
- Abadía, J. 2012. Iron Nutrition in Soils and Plants: Proceedings of the Seventh International Symposium on Iron Nutrition and Interactions in Plants. Vol. 59. Zaragoza, Spain: Springer Science & Business Media 2 June 27–July 1993.
- Boudsocq, S., A. Niboyet, J. C. Lata, X. Raynaud, N. Loeuille, J. Mathieu, M. Blouin, L. Abbadie, and S. Barot. 2012. “Plant Preference for Ammonium versus Nitrate: A Neglected Determinant of Ecosystem Functioning?” The American Naturalist 180: 60–69. doi:10.1086/665997.
- Britto, D. T., and H. J. Kronzucker. 2002. “NH4+ Toxicity in Higher Plants: A Critical Review.” Journal of Plant Physiology 159: 567–584. doi:10.1078/0176-1617-0774.
- Brookes, P., A. Landman, G. Pruden, and D. Jenkinson. 1985. “Chloroform Fumigation and the Release of Soil Nitrogen: A Rapid Direct Extraction Method to Measure Microbial Biomass Nitrogen in Soil.” Soil Biology & Biochemistry 17: 837–842. doi:10.1016/0038-0717(85)90144-0.
- Cheng, S. L., H. J. Fang, G. R. Yu, T. H. Zhu, and J. J. Zheng. 2010. “Foliar and Soil 15N Natural Abundances Provide Field Evidence on Nitrogen Dynamics in Temperate and Boreal Forest Ecosystems.” Plant and Soil 337: 285–297. doi:10.1007/s11104-010-0524-x.
- Connell, J., D. Hancock, R. Durham, M. Cabrera, and G. Harris. 2011. “Comparison of Enhanced-efficiency Nitrogen Fertilizers for Reducing Ammonia Loss and Improving Bermudagrass Forage Production.” Crop Science 51: 2237–2248. doi:10.2135/cropsci2011.01.0052.
- Cram, W. 1973. “Internal Factors Regulating Nitrate and Chloride Influx in Plant Cells.” Journal of Experimental Botany 24: 328–341. doi:10.1093/jxb/24.2.328.
- Cui, J., C. Yu, N. Qiao, X. Xu, Y. Tian, and H. Ouyang. 2017. “Plant Preference for NH4+ versus NO3− at Different Growth Stages in an Alpine Agroecosystem.” Field Crops Research 201: 192–199. doi:10.1016/j.fcr.2016.11.009.
- Fang, H., S. Cheng, G. Yu, J. Cooch, Y. Wang, M. Xu, L. Li, X. Dang, and Y. Li. 2014. “Low-level Nitrogen Deposition Significantly Inhibits Methane Uptake from an Alpine Meadow Soil on the Qinghai–Tibetan Plateau.” Geoderma 213: 444–452. doi:10.1016/j.geoderma.2013.08.006.
- Fang, H., G. Yu, S. Cheng, T. Zhu, J. Zheng, J. Mo, J. Yan, and Y. Luo. 2011. “Nitrogen-15 Signals of Leaf-litter-soil Continuum as a Possible Indicator of Ecosystem Nitrogen Saturation by Forest Succession and N Loads.” Biogeochemistry 102: 251–263. doi:10.1007/s10533-010-9438-1.
- Gastal, F., and G. Lemaire. 2002. “N Uptake and Distribution in Crops: An Agronomical and Ecophysiological Perspective.” Journal of Experimental Botany 53: 789–799. doi:10.1093/jexbot/53.370.789.
- Han, W., J. Fang, D. Guo, and Y. Zhang. 2005. “Leaf Nitrogen and Phosphorus Stoichiometry across 753 Terrestrial Plant Species in China.” The New Phytologist 168: 377–385. doi:10.1111/j.1469-8137.2005.01530.x.
- Hawkins, B. J., and S. Robbins. 2010. “pH Affects Ammonium, Nitrate and Proton Fluxes in the Apical Region of Conifer and Soybean Roots.” Physiologia Plantarum 138: 238–247. doi:10.1111/j.1399-3054.2009.01317.x.
- Haynes, R. J. 1980. “Ion Exchange Properties of Roots and Ionic Interactions within the Root Apoplasm: Their Role in Ion Accumulation by Plants.” The Botanical Review; Interpreting Botanical Progress 46: 75–99. doi:10.1007/BF02860867.
- Houlton, B. Z., D. M. Sigman, E. A. Schuur, and L. O. Hedin. 2007. “A Climate-driven Switch in Plant Nitrogen Acquisition within Tropical Forest Communities.” Proceedings of the National Academy of Sciences of the United States of America 104: 8902–8906. doi:10.1073/pnas.0609935104.
- Ishii, S., S. Ikeda, K. Minamisawa, and K. Senoo. 2011. “Nitrogen Cycling in Rice Paddy Environments: Past Achievements and Future Challenges.” Microbes and Environments / JSME 26: 282–292. doi:10.1264/jsme2.me11293.
- IUSS WG WRB. 2015. “World Reference Base for Soil Resources 2014, Update 2015.” International soil classification system for naming soils and creating legends for soil maps. World soil resources reports No. 106. FAO, Rome. 153–154.
- Jenkinson, D. 1988. “Determination of Microbial Biomass Carbon and Nitrogen in Soil.” Advances in nitrogen cycling, 368–386.
- Jones, D. L., J. R. Healey, V. B. Willett, J. F. Farrar, and A. Hodge. 2005. “Dissolved Organic Nitrogen Uptake by Plants – An Important N Uptake Pathway?” Soil Biology & Biochemistry 37: 413–423. doi:10.1016/j.soilbio.2004.08.008.
- Kahmen, A., W. Wanek, and N. Buchmann. 2008. “Foliar δ15N Values Characterize Soil N Cycling and Reflect Nitrate or Ammonium Preference of Plants along a Temperate Grassland Gradient.” Oecologia 156: 861–870. doi:10.1007/s00442-008-1028-8.
- Kiyomiya, S., H. Nakanishi, H. Uchida, A. Tsuji, S. Nishiyama, M. Futatsubashi, H. Tsukada, N. S. Ishioka, S. Watanabe, and T. Ito. 2001. “Real Time Visualization of 15n-translocation in Rice under Different Environmental Conditions Using Positron Emitting Tracer Imaging System.” Plant Physiology 125: 1743–1753. doi:10.1104/pp.125.4.1743.
- LeBauer, D. S., and K. K. Treseder. 2008. “Nitrogen Limitation of Net Primary Productivity in Terrestrial Ecosystems Is Globally Distributed.” Ecology 89: 371–379. doi:10.1890/06-2057.1.
- Lemaire, G., and F. Gastal 1997. “N Uptake and Distribution in Plant Canopies.” Diagnosis of the Nitrogen Status in Crops. Springer. 3–43.
- Lemaire, G., and G. F. Jeuffroy M-H. 2008. “Diagnosis Tool for Plant and Crop N Status in Vegetative Stage: Theory and Practices for Crop N Management.” European Journal of Agronomy 28: 614–624. doi:10.1016/j.eja.2008.01.005.
- Li, Y., J. Zhao, X. Guo, Z. Zhang, G. Tan, and J. Yang. 2017. “The Influence of Land Use on the Grassland Fire Occurrence in the Northeastern Inner Mongolia Autonomous Region, China.” Sensors 17: E437. doi:10.3390/s17050968.
- Liu, Q., N. Qiao, X. Xu, X. Xin, H. J Y, Y. Tian, H. Ouyang, and Y. Kuzyakov. 2016. “Nitrogen Acquisition by Plants and Microorganisms in a Temperate Grassland.” Scientific Reports-United Kingdom 6: 22642. doi:10.1038/srep22642.
- Lu, R. K. 1999. Analytical Methods of Soil Agrochemistry, 1–638. Beijing: Chinese agriculture science and technology press. (In Chinese). doi:10.1016/s0021-9673(99)00837-7.
- Ma, W., Y. Yang, J. He, H. Zeng, and J. Fang. 2008. “Above- and Belowground Biomass in Relation to Environmental Factors in Temperate Grasslands, Inner Mongolia.” Science in China Series C 51: 263–270. doi:10.1007/s11427-008-0029-5.
- Maathuis, F. J. 2009. “Physiological Functions of Mineral Macronutrients.” Current Opinion in Plant Biology 12: 250–258. doi:10.1016/j.pbi.2009.04.003.
- Marschner, H. 1991. “Mechanisms of Adaptation of Plants to Acid Soils.” Plant and Soil 134: 1–20. doi:10.1007/BF00010712.
- Martins, K. V., D. Dourado-Neto, K. Reichardt, J. L. Favarin, F. F. Sartori, G. Felisberto, and S. C. Mello. 2017. “Maize Dry Matter Production and Macronutrient Extraction Model as a New Approach for Fertilizer Rate Estimation.” Anais Da Academia Brasileira De Ciencias 89: 705–716. doi:10.1590/0001-3765201720160525.
- Masclaux-Daubresse, C., M. Reisdorf-Cren, K. Pageau, M. Lelandais, O. Grandjean, J. Kronenberger, M. H. Valadier, M. Feraud, T. Jouglet, and A. Suzuki. 2006. “Glutamine Synthetase-Glutamate Synthase Pathway and Glutamate Dehydrogenase Play Distinct Roles in the Sink-source Nitrogen Cycle in Tobacco.” Plant Physiology 140: 444–456. doi:10.1104/pp.105.071910.
- McKane, R. B., L. C. Johnson, G. R. Shaver, K. J. Nadelhoffer, E. B. Rastetter, B. Fry, A. E. Giblin, K. Kielland, B. L. Kwiatkowski, and J. A. Laundre. 2002. “Resource-based Niches Provide a Basis for Plant Species Diversity and Dominance in Arctic Tundra.” Nature 415: 68–71. doi:10.1038/415068a.
- Ollivier, J., S. Töwe, A. Bannert, B. Hai, E. M. Kastl, A. Meyer, M. X. Su, K. Kleineidam, and M. Schloter. 2011. “Nitrogen Turnover in Soil and Global Change.” FEMS Microbiology Ecology 78: 3–16. doi:10.1111/j.1574-6941.2011.01165.x.
- Sage, R. F., and J. R. Seemann. 1993. “Regulation of Ribulose-1, 5-bisphosphate Carboxylase/oxygenase Activity in Response to Reduced Light Intensity in C4 Plants.” Plant Physiology 102: 21–28. doi:10.1104/pp.102.1.21.
- Sapek, B., J. Estavillo, and W. Corre 2000: “Amounts of Ammonium and Nitrate in Grassland Soil as a Function of Soil pH and Fertiliser Nitrogen Application.” Effects of liming and nitrogen fertilizer application on soil acidity and gaseous nitrogen oxide emissions in grassland systems. 25–37.
- Scheurwater, I., M. Koren, H. Lambers, and O. K. Atkin. 2002. “The Contribution of Roots and Shoots to Whole Plant Nitrate Reduction in Fast- and Slow-growing Grass Species.” Journal of Experimental Botany 53: 1635–1642. doi:10.1093/jxb/erf008.
- Schjoerring, J. K., S. Husted, G. Mäck, and M. Mattsson. 2002. “The Regulation of Ammonium Translocation in Plants.” Journal of Experimental Botany 53: 883–890. doi:10.1093/jexbot/53.370.883.
- Sewell, G. W. 2004. “Evaluation of Chemical and Biological Loading to the Blue River.” Oklahoma Water Resources Research Institute. https://water.usgs.gov/wrri/AnnualReports/2005/FY2005_OK_Annual_Report. pdf
- Silvertown, J. 2004. “Plant Coexistence and the Niche.” Trends in Ecology and Evolution 19: 605–611. doi:10.1016/j.tree.2004.09.003.
- Sonneveld, C., and W. Voogt 2009. “Nutrient Management in Substrate Systems.” Plant nutrition of greenhouse crops. Springer. 277–312.
- Sorgona, A., A. Lupini, F. Mercati, L. Di Dio, F. Sunseri, and M. R. Abenavoli. 2011. “Nitrate Uptake along the Maize Primary Root: An Integrated Physiological and Molecular Approach.” Plant, Cell & Environment 34: 1127–1140. doi:10.1111/j.1365-3040.2011.02311.x.
- Subedi, K., and B. Ma. 2005. “Nitrogen Uptake and Partitioning in Stay-green and Leafy Maize Hybrids.” Crop Science 45: 740–747. doi:10.2135/cropsci2005.0740.
- Tilman, D. 1982. Resource Competition and Community Structure. Princeton, N.J.: Princeton university press.
- Tilman, D. 1997. “Mechanisms of Plant Competition.” Plant Ecology 2: 239–261.
- Tischner, R. 2000. “Nitrate Uptake and Reduction in Higher and Lower Plants.” Plant, Cell & Environment 23: 1005–1024. doi:10.1046/j.1365-3040.2000.00595.x.
- Van Beusichem, M. L., E. A. Kirkby, and R. Baas. 1988. “Influence of Nitrate and Ammonium Nutrition on the Uptake, Assimilation, and Distribution of Nutrients in Ricinus Communis.” Plant Physiology 86: 914–921. doi:10.1104/pp.86.3.914.
- Van Der Heijden, M. G. A., R. D. Bardgett, and N. M. Van Straalen. 2008. “The Unseen Majority: Soil Microbes as Drivers of Plant Diversity and Productivity in Terrestrial Ecosystems.” Ecology Letters 11: 296–310. doi:10.1111/j.1461-0248.2007.01139.x.
- Wang, Z., X. Deng, W. Song, Z. Li, and J. Chen. 2017. “What Is the Main Cause of Grassland Degradation? A Case Study of Grassland Ecosystem Service in the Middle-south Inner Mongolia.” Catena 150: 100–107. doi:10.1016/j.catena.2016.11.014.
- Weigelt, A., R. Bol, and R. D. Bardgett. 2005. “Preferential Uptake of Soil Nitrogen Forms by Grassland Plant Species.” Oecologia 142: 627–635. doi:10.1007/s00442-004-1765-2.
- Werdan, K., H. W. Heldt, and M. Milovancev. 1975. “The Role of pH in the Regulation of Carbon Fixation in the Chloroplast Stroma. Studies on CO2 Fixation in the Light and Dark.” BBA-Bioenergetics 396: 276–292. doi:10.1016/0005-2728(75)90041-9.
- Xu, L., X. Xu, X. Tang, X. Xin, L. Ye, G. Yang, H. Tang, S. Lv, D. Xu, and Z. Zhang. 2018. “Managed Grassland Alters Soil N Dynamics and N2O Emissions in Temperate Steppe.” Journal of Environmental Science-China 66: 20–30. doi:10.1016/j.jes.2017.04.003.
- Xu, X., H. Ouyang, G. Cao, A. Richter, W. Wanek, and Y. Kuzyakov. 2011. “Dominant Plant Species Shift Their Nitrogen Uptake Patterns in Response to Nutrient Enrichment Caused by a Fungal Fairy in an Alpine Meadow.” Plant and Soil 341: 495–504. doi:10.1007/s11104-010-0662-1.