
 ?Mathematical formulae have been encoded as MathML and are displayed in this HTML version using MathJax in order to improve their display. Uncheck the box to turn MathJax off. This feature requires Javascript. Click on a formula to zoom.
ABSTRACT
We compared the protein and oil contents, seed yields, and natural abundance of 15N (σ15N) of seeds from the plants of the cultivar Enrei, which has moderate nodulating ability (Enrei) with those of its two near-isogenic lines (NILs), a super-nodulating genotype of Enrei, i.e., En-b0-1, and a non-nodulating genotype of Enrei, i.e., En1282. Plants of these three genotypes were grown on four types of field plots with different types of urea coated slow-release nitrogen (N) fertilizers (CUSLNFs) which delivered N in different manners during plant growth . The seed yield of the En1282 plants was similar to that of the Enrei plants but much greater than that of the En-b0-1 plants when the plants were grown on the field to which a CUSLNF with a long lifespan was applied. The amounts of protein per seed were positively correlated with those of oil per seed in the case of En1282 plants irrespective of the field N conditions. The seed protein contents were proportional to the seed weight in both En1282 and Enrei plants. Such a relationship was not observed in the En-b0-1 plants, and the protein and oil contents in the seeds of En-b0-1 plants were negatively correlated with each other. These observations suggested that the N supply to maturing seeds was a key to the protein contents in the En1282 and Enrei plants and that the C supply to maturing seeds was a key to the protein contents in the En-b0-1 plants. The comparison of the σ15N values, protein contents, and seed yields of seeds from En1282 plants suggested that the Enrei plants assimilated considerable amounts of N from the soil during the late plant growth. We concluded that high N2 fixation activity depressed the amounts of oil per seed and changed the protein and oil contents in soybean seeds.
1. Introduction
Soybean plants can fix atmospheric nitrogen (N2) in their nodules on roots, and they use fixed N for plant growth. It has thus been speculated that N fertilizers are not useful to increase seed yields, with the exception of the application of N during an early stage of plant growth to promote the initiation of nodulation; this is the so-called ‘starter nitrogen.’ However, it was also shown that soybean plants assimilated considerable amounts of N from the soil following the deep placement of N fertilizer (Takahashi et al. Citation1991). The observation that the activity of nitrate reductase in leaves was decreased after the initiation of flowering (Fabre and Planchon Citation2000) supported the idea that N fertilization has no effect on soybean seed yields. These conflicting observations demonstrate that N metabolism in soybean plants is not well understood.
As soybean seeds have the highest protein content among crops, soybeans require a high N supply for maturing seeds. Soybean plants have nodules on their roots. Nodules are the machinery that plants use to symbiotically fix N2, and supply much amounts of N to satisfy the seeds’ high N demand. Soybean super-nodulating plants (SNPs) were developed (Carroll, McNeil, and Gresshoff Citation1985) in order to improve seed yields without the use of N fertilizer. Contrary to the expectation, the yields of the SNPs were less than those of normal soybean plants (Wu and Harper Citation1991), implying that excess consumption of photosynthate by the SNPs’ nodules caused the low seed yields.
Normal types of soybean plants synthesize organic N derived from both symbiotic N2 fixation and the assimilation of mineral N (including fertilized N) in soil, and thus seed yields were observed to be correlated with the amounts of synthesized N in plants (Ohyama et al. Citation2013). In SNPs, the nodules are thought to supply a quantity of N to maturing seeds that is greater than the seeds’ demand for N. In contrast, soybean non-nodulating plants (NNPs) have no nodules, and the NNPs can utilize only soil N (not atmospheric N2). Therefore, NNP was possible to use as a negative control for estimating the effect of nodulation on seed yields.
The natural abundance of 15N (i.e., σ15N) of mature seeds is applicable as an indicator of the dependence of whole-plant N on the N2 fixation activities of plants (Shearer, Kohl, and Harper Citation1980). Plants with no N2 fixation activity had higher σ15 values compared to plants with N2 fixation activities, and thus the N2 fixation activity can be used to discriminate the origins of N in plant tissues such as soil N and fixed N (Yoneyama et al. Citation1986).
Both the nodule formation and the N2 fixation activity of nodules were inhibited by nitrate in soil (Streeter Citation1985). The inhibition of the N2 fixation activity of soybean plants by the application of N at the flowering stage (Sugimoto et al. Citation1998) and the application of coated urea slow-release nitrogen fertilizers (CUSNFs) maintained a high soil N level and inhibited the N2 fixation activity resulted in an increase in the oil concentrations of mature seeds (Sugimoto, Shiraishi, and Oji Citation2005). These observations suggested that the N2 fixation activities of soybean plants affect the accumulation of storage compounds in maturing soybean seeds.
Soybean seeds are a source for the production of vegetable oil and processed foods such as tofu (Liu Citation1997). The contents of these compounds are thus crucial to the quality of soybean seeds. The contents of the storage compounds in seeds are genetically variable, and Liu (Citation1997) reported that the contents of soybean seeds produced from plants of the same cultivar (CV) that were grown at different sites or in different years were not always the same as each other, indicating that some environmental conditions changed the contents of soybean seeds.
We conducted the present study to determine whether nodulation affects the protein content and oil content of soybean seeds and whether nodulation affects the seed yields. We investigated the effects of nodulation on the yields and contents of seeds by using different types of CUSLNFs as inhibitors of the N2 fixation activity of soybean plants.
2. Materials and methods
2.1. Fertilizers, plant materials, and field conditions
A compound fertilizer (N:P:K = 8:8:8) was a product of Shoken Sangyo (Chiba, Japan). The three types of CUSLNF were products of JCAM Agri (Tokyo): MEISTER-5 (M5) which was a 30-day type coated urea and release 80% urea in water at 25°C for 30 days; MEISTER-S9 (MS9) which releases urea between 60 and 120 days after application; and MEISTER-15 (M15) which was a 100-day type coated urea and release 80% urea in water at 25°C for 100 days. These CUSLNFs release urea at a constant rate during certain periods depending on their characteristics, as shown at http://www.jcam-agri.co.jp/en/product/meister.html.
Seeds of the three genotypes of soybean (Glycine max. L.) used in this experiment were as follows. (1) Enrei, a popular CV in Japan (JP No. 28862 in the Ministry of Agriculture, Forestry and Fisheries [MAFF] Gene Bank, Japan; https://www/gene.affrc.go.jp/database-plant_search_en.php) which has normal and moderate nodulation ability. (2) En-b0-1, a super-nodulating mutant of Enrei, which is a hybrid between Enrei and the SNP En6400 (Akao and Kouchi Citation1992) produced by the ethyl methane sulfonate (EMS) treatment of Enrei seeds (Takahashi et al. Citation2003). (3) En1282, a non-nodulating mutant of Enrei produced by EMS treatment (Francisco and Akao Citation1993).
Soil type of the field was Udorthents. No organic materials had been applied from the time when the soil had been carried in the field from mountainside of Mt Rokko (Citation1993).
2.2. Fertilization and plant growth conditions and the seed harvests
We prepared four types of fertilizing conditions applied with one of the three CUSNFs, M5, MS9 or M15 or no CUSNF based on the assumption that theoretically, 20 g N/m2/month was released into the soil during the CUSNFs’ lifespans. Amounts of each CUSLNF applied per 1 m2 were as 50 g, 100 g and 163 g for M5, MS9, and M15, respectively. All four areas were fertilized with 20 g/m2 of the compound fertilizer. We designated these four types of N plots as ‘L-L’, ‘H-L’, ‘L-H’, and ‘H-H’ based on the expected soil N levels (H, high or L, low) during the early and late periods of plant growth.
Seeds of each genotype were germinated in the plant culture soil on 15 June 2015. Approximately 2 weeks after germination, 10 seedlings each of En1282, Enrei, and En-b0-1 were transplanted to each fraction of the N plot. The field experiment was performed one iteration. The site for plants of one genotype in an N plot was 3 m in length and 0.8 m in width, respectively. The plants were placed 30 cm apart in rows that were 80 cm apart. Individual plants were harvested on the day when all of the plants' leaves had fallen or when the color of half of the pods had changed to brown. The pods were then removed from the plants and air-dried, and the seeds were collected.
2.3. Measurements of the seed yields and the contents of seed compounds
The numbers of seeds per plant were counted manually. The seed weights were measured after the seeds were air-dried for >3 months from harvest. The contents of protein, oil, carbohydrate, and water of mature seeds from four plant samples of the same genotypes grown on the same N fertilization type were measured with a near-infrared spectrophotometer, an Infratec 1242 grain analyzer (Foss, Hillerød, Denmark), which was mentioned elsewhere (Yamamoto et al. Citation2019). Measurement was done three times and got the average value. One sample basically consisted of seeds from one plant except the cases mentioned below. In cases in which the seed yield of a plant was <18 g (which we set the minimum weight to avoid inaccurate measurement), seeds from two or three plants of the same genotype that had undergone the same N plot were mixed together and measured. Genotypes, N plots, number of plants mixed together as one sample for NIR and total number of samples measured were as follows: En1282, L-L, 3 and 2, En-b0-1, L-L, 3 and 1, En-b0-1, H-L,2 and 4, En-b0-1, L-H, 2 and 1, En-b0-1, H-H, 2 and 1, respectively. We calculated the contents of each storage compound on a water-free basis.
2.4. Estimation of the origins of seed N by calculating the σ15N values of seed N from plants of the three genotype
The σ15N values of the seeds from the respective two plants grown on the 4 N plots were measured by mass spectrometry at Shoko Co. (Saitama, Japan). All seeds from one plant were thoroughly milled for measuring the σ15N values. The ratio of N derived from N2 fixation (%Ndfa) of plants of the two genotypes, Enrei and En-b0-1, was calculated by EquationEquation (1)(1)
(1) which was the authorized method to estimate N2 fixation activity using En1282 as non-nodulating reference plant (Unkovich et al. Citation2008).
where i–ii is the estimated N levels of the early and late periods of plant growth (H or L levels of N) and the same with those of N plots of fields. The σ15N of air is zero.
The σ15N values of two N sources, soil plus compound fertilizer and CUSLNF were assumed to be indicated as the value of seeds from plants grown on L-L N plot (3.36) and that of M15 (−1.41), respectively. The ratios of these N origins of seeds from plants of En1282 grown on the other N plots were estimated by using these σ15N values.
where X indicates the percentage of the sum of soil N and compound fertilizer N against the total N, and Y represents the percentage of CUSLNF-N against the total N.
2.5. Estimation of the contributions of N originating from N2 fixation and from CUSLNFs in seeds from the Enrei and En-b0-1 plants based on the results obtained by 2.4 methods
We estimated the contributions of the three N fractions, the N in both the soil and the basal compound fertilizer, the N in each SLNF, and the N fixed in nodules based on another method by the following assumptions: (1) the N in seeds from En1282 plants grown on L-L soil originated from the N in the soil and the compound fertilizer; and (2) the N in seeds from En-b0-1 plants grown on L-L soil originated from N2 fixation, which was supported by the results obtained by the authorized method mentioned in 2.4; and (3) the σ15N value of two types of CUSNFs, M5 and MS9, was the same as that of the other type of CUSLNF, M15.
where A is the genotype of plants, i–ii is the expected N levels of the early and late periods of plant growth (H or L levels of N). X indicates the percentage of the sum of soil N and compound fertilizer N (SN) against the total N. Y represents the percentage of CUSLNF-N (FN) against the total N, and Z is the percentage of fixed-N (XN) against the total N.
Based on the values of %Ndfa obtained by the method described in 2.4 that the contribution of SN to the seed N in En-b0-1 plants grown on L-L N plot was negligible, the σ15N values of the seeds from the En-b0-1 plants grown on L-L N plot corresponded to those of the fixed N (−0.61). The σ15N value of FN in the seeds from Enrei and En-b0-1 plants grown on the same type of N plot was assumed to be identical to the σ15N value of En1282 plants grown on the same type of N plot (Ai–ii).
The ratio of fixed N to total N in seeds was calculated by the equation:
where Zi–ii is the percentage of fixed N in seeds from plants grown on i–ii N plots. The Zi–ii value was calculated by using the value of σ15Ni–ii obtained in the experiment, which is listed in .
Table 1. Effects of N fertilization on the seed growth of the three soybean genotypes with different nodulation abilities.
Table 2. The σ15N values of mature seeds from plants of three genotypes of soybean.
The total amount of N in the seeds/plant was calculated by multiplying the N content (%) and the seed yield/plant. The amount of N from both the SN and FN (Wi–ii) was estimated by subtracting the amount of XN from the total amount of N in the seeds/plant. The amounts of SN and FN were obtained by multiplying Xi–ii or Yi–ii by Wi–ii, respectively. The ratios of SN, FN, and XN to the total N were obtained by dividing their respective values against the total N.
2.6. Statistical analyses
The data on both plant growth and seed properties were analyzed by Tukey’s honest significant difference (HSD) test and Student’s t-test as described in the table legends.
3. Results
3.1. Different effects of N fertilization on seed yields of the three genotypes
The average weight (SW) and number (SN) of seeds are listed in . For the En1282 plants, the SW of the plants grown on the four types of N fertilization became larger in the order of L-L, H-L, L-H, and H-H. Similar but faint changes were observed in the En-b0-1 plants. For the Enrei plants, the largest SW was 0.30 (L-L and L-H) and the smallest was 0.26 (H-L), which was different from the other two genotypes. In the cases of En1282 and En-b0-1 plants, the SN of the plants grown on L-L soil was one-half of that of the plants grown on H-H soil. For the Enrei plants, there was no difference in the SN between the plants grown on L-L and H-H soils.
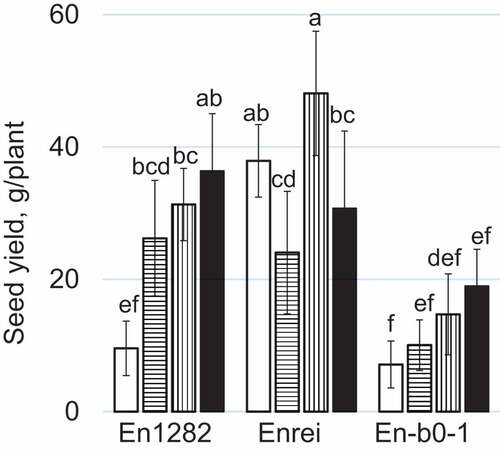
illustrates the different effects of the N fertilization on the seed yields in the three soybean genotypes. The differences in the seed yield of each genotype were similar to those observed in the SW. In the En1282 and En-b0-1 plants, the lowest seed yields were observed in the plants grown on the L-L N plot and the highest were on the H-H N plot. The seed yields of the En1282 and En-b0-1 plants grown on the L-L N plot were 1/4 and 1/3 of those of the corresponding cultivars grown on the H-H N plot, respectively. The seed yields of the En1282 and En-b0-1 plants grown on H-L and L-H N plot s were higher than and lower than those of the corresponding plants grown on the L-L and H-H N plots, respectively. The Enrei plants grown on the H-L N plot showed significantly lower seed yields than those grown on the L-L and L-H N plots. On the L-L N plot, the seed yields of the En1282 and En-b0-1 plants were significantly lower than that of the Enrei plants. Among the plants grown on the H-H N plot, the seed yield of the En1282 plants was almost the same at that of the Enrei plants and significantly higher than that of the En-b0-1 plants.
Figure 1. Effects of the N fertilization on the seed yields of three genotypes of soybean. Symbols indicate the types of N treatment where plants were grown: white, L-L; horizontal stripe, H-L; vertical stripe, L-H; black, H-H. Different letters indicate significant differences between genotypes and N treatments.
3.2. Effects of the N fertilization on the contents of seed storage compounds of the three genotypes
We observed that the seed protein contents were inversely proportional to the contents of oil and carbohydrate (data not shown) in the seeds from all three genotypes of soybean plants. The average protein, oil, and carbohydrate contents of seeds from the plants of the same genotype grown in the same type of N plot varied among the plants grown in the four fertilization N conditions. The inter-relationships among the protein and oil concentration and the SW of the seeds from plants of the three genotypes are illustrated in . The protein content was proportional to the SW in the seeds from En1282 and Enrei plants (). There was no such relationship in the En-b0-1 plants. The protein contents were inversely correlated with the oil content in the seeds from En-b0-1 plants (). The oil contents in seeds were not correlated with the SW or the protein content in the En1282 and Enrei plants (,). Seeds from En-b0-1 plants grown on the L-L N plot showed the highest protein content and the lowest oil content among all seeds from plants of the three genotypes (). The reverse was true for the seeds from En1282 plants grown on the L-L N plot ().
Figure 2. Effects of the N fertilization on the protein content and oil content in seeds from plants of three soybean genotypes. (a): The relationship between the protein content and the seed weight. (b): The relationship between the oil content and the seed weight. (c): The relationship between the oil content and the protein content. Shapes of symbols circles, squares, and triangles indicate the genotypes, En1282, Enrei and En-b0-1, respectively. Patterns inside symbols indicate the types of N treatment described in legend. The correlation coefficients between the protein content and seed weight from the En1282 and Enrei plants were 0.982 and 0.907, respectively. The significance levels were 0.02 and 0.10 for En1282 and Enrei, respectively. The correlation coefficient between the protein content and the oil content from the En-b0-1 plants was −0.924 (p = 0.10).
The effects of the N treatments on the interrelationship between protein and oil contents in seeds differed among the plants of the three genotypes (). The seed protein and oil contents of the En1282 plants grown on the L-H and H-H N plots were higher and lower, respectively, than those of the En1282 plants grown on the L-L and H-L N plots. The reverse was true for the En-b0-1 plants grown on the same types of N plot. The seed oil contents from the Enrei plants grown on the four N plots were almost the same. The seed protein content of the Enrei plants grown on the L-L N plot was the highest among the four types of N plots, and the protein and oil contents of seeds from the plants of the three genotypes grown on the H-H N plot were almost the same.
Figure 3. Interrelationships between the protein content and oil content in seeds from plants of three soybean genotypes.
We calculated the amounts of protein and oil in a seed by multiplying the contents of protein or oil by the SW (). In the seeds of En1282 plants, the amount of oil per seed was proportional to the amount of protein per seed irrespective of the N treatment types (the r of the coefficient line was 0.998). The relationship between the amounts of oil per seed and the amounts of protein per seed seemed to be affected by the N treatments of plant growth in the case of the two nodulating genotypes. The positions of those amount values from the seeds of the Enrei and En-b0-1 plants grown on the L-H and H-H N plots were closer to the coefficient line than those of the plants grown on the H-L and L-L N plots.
Figure 4. Effects of the N fertilization on the amounts of protein and oil per seed from plants of the three soybean genotypes. Shapes of symbols indicate the same genotype as those described in legend. Numbers beside marks indicate types of N plots where plants were grown as follows: 1: L-L, 2: H-L, 3: L-H, and 4: H-H. The dotted line indicates the coefficient line between the amount of oil per seed and the amount of protein per seed from En1282 plants (p = 0.01).
3.3. Estimation of contribution of N originated from N2 fixation in total N in seeds of the two nodulating genotypes and those from soil and N fertilizers in those of the non-nodulating genotype
We estimated the ratios of N originated from N2 fixation (%Ndfa) in total N in seeds using the authorized method () (Unkovich et al. Citation2008). Plants of both the nodulating genotypes grown on the L-L N plot were estimated to be more than 100% of N from N2 fixation. Other types of N treatment decreased the ratio of N derived from N2 fixation in the order of H-L, L-H, and H-H N plots.
Table 3. Contribution of N derived from N2 fixation of plants of two nodulating genotypes grown on fields where had different N treatments (%Ndfa).
We discriminated the N present at the start of plant growth (N from the soil and basal compound fertilizer) from N released from CUSLNFs using EquationEquation (2)(2)
(2) (). Seeds from plants grown on H N treatments at the late plant growth stage showed the lower ratios of N present at the start of plant growth against total N than those grown on L N treatments at the late plant growth in seeds, and seeds of plants grown on H-H N plot showed the lowest (52.0%).
Table 4. The ratios and amounts of N originated from the two origins, soil+compound fertilizer, and CUSLNFs, in the total N in seeds from plants of non-nodulating genotype, En1282.
3.4. Estimated contribution ratios of the three origins of seed N of the three genotypes based on the seeds’ σ15N values
The ratios of the three fractions of N (i.e., the N from the soil and the basal compound fertilizer, the N from each CUSLNF, and the N from N2 fixation in protein) in a single seed are estimated by EquationEquation (3)(3)
(3) provided above in the Materials and Methods section (). As the En1282 plants utilized the mineral N that was present in the fields where the plants grew, the σ15N value of the seeds from En1282 plants grown on the L-L N plot (3.36) indicated the σ15N value of the N supplied by the soil and the basal compound fertilizer. We distinguished the FN from the SN by using EquationEquations (3)
(3)
(3) and (Equation4
(4)
(4) ). By using the σ15N values of the seeds of En1282 plants grown on H-L, L-H, and H-H N plots, we estimated the ratios of FN as 16.6%, 44.8%, and 48.0%, respectively. In the case of En-b0-1 plants grown on the L-L N plot, the N from both the soil and the compound fertilizer was assumed to be negligible as %Ndfa of the plants was estimated to 118.1% ().
Table 5. The ratios and amounts of N originated from the three origins, soil+compound fertilizer, CUSLNFs, and N2 fixation, in total N in seeds from plants of the two nodulating genotypes, Enrei and En-b0-1.
We presumed that the σ15N value (−0.61) of the seeds from the En-b0-1 plants grown on the L-L N plot indicated the σ15N value of the N from N2 fixation. We used EquationEquations (3)(3)
(3) and (Equation4
(4)
(4) ) to estimate the contributions of N2 fixation of both Enrei and En-b0-1 plants (Table 4(2)). The contribution rates of the N2 fixation of the Enrei plants grown on L-L, H-L, L-H, and H-H N plots were 89.9%, 14.2%, 48.9%, and −47.9%, and those of the En-b0-1 plants grown on the respective N plots were 100%, 35.0%, 8.9%, and −36.5%, respectively. The calculated values of the fixed-N ratio in the seeds from the plants of these nodulating genotypes grown on the H-H N plot were negative because these σ15N values of these plants were higher than those of the En1282 plants. The contribution of N from the N2 fixation of both the Enrei and En-b0-1 plants to the total N was assumed to be zero.
3.5. Differences in the amounts of N from the three N origins (soil, SLNF, and N2 fixation) of plants grown on the four types of soils
The estimated amounts of N from the two origins (the soil and compound fertilizer and the SLNF) in plants of a non-nodulating genotype, En1282, grown with the 4 N treatments are listed in . Those from the three origins (the former two origins and N2 fixation) in plants of the two nodulating genotypes grown with the four N treatments are listed in . In the En1282 plants, the amount of N/plant from both the soil and compound fertilizer was similar among three N-treatment fields (H-L, L-H, and H-H), and the amounts of N/plant from the CUSLNF were estimated to 0.30, 0.98, and 1.22 g for the plants grown on H-L, L-H, and H-H N plots, respectively. In the Enrei plants, the amount of N/plant from N2 fixation from plants grown on the L-H N plot was 1.68 g, which was two-thirds of that of the plants grown on the L-L N plot. In contrast, the amount of N/plant from N2 fixation from the En-b0-1 plants grown on the L-H N plot was 0.09 g/plant, which was one-fifth of the amount from the plants grown on L-L N plot.
In the Enrei and En-b0-1 plants grown on the H-H N plot, the amount of N from N2 fixation was negligible and the amount of N from the CUSLNF was the highest among the N amounts from the soils using the respective N treatments.
4. Discussion
The yield is an important factor for soybean seed production. We observed that the seed yield and the SW increased with the increase in the amount of N released from the CUSLNF in the case of En1282 plants (, ). The En-b0-1 plants increased their seed yields along with the increase in the supply of N from CUSLNFs, and this increase was quite different from the result observed for the Enrei plants and was similar to that of the En1282 plants (). A notable difference between the En-b0-1 and En1282 plants was the amounts of seed per plant from the plants grown on the same types of N plot, except for the L-L N plot. The σ15N value of mature seeds indicates the contribution of N2 fixation to the total organic N in plants (Shearer, Kohl, and Harper Citation1980). The σ15N value of the seeds from the En-b0-1 plants grown on the H-H N plot was similar to that of the Enrei plants (), which suggested that the activities of both N2 fixation and N assimilation of the En-b0-1 plants were almost the same with those of the Enrei plants grown on the H-H N plot. Therefore, the lower seed yield of the En-b0-1 plants compared to that of the Enrei plants cannot be ascribed to the Enrei and En-b0-1 plants’ N2 fixation activities. The results listed in also suggest that the En-b0-1 plants assimilated less absorbed N from the soil than the En1282 plants did. These results suggest that the amounts of raw materials for the synthesis of storage compounds in maturing seeds were lowered by some mechanism working in En-b0-1 plants.
For the Enrei plants, the N supply from the soil had no apparent effect on the seed yield or SW, which means that the N derived from N2 fixation compensates for the low supply of soil N for plant growth. Among the Enrei plants grown on the four types of N treatment, we observed a lower yield, a smaller SW, and a smaller number of seeds from the plants grown on the H-L N plot, and thus our present observation that the σ15N values of mature seeds from the plants grown on the H-L N plot were the highest among the Enrei plants grown on the four types of N treatment implies that the ratio of N from N2 fixation to the total N of the plants grown on the H-L N plot was less than that of the Enrei plants grown in the other conditions. Nodules of Enrei plants develop during the early stage of plant growth (Francisco and Akao Citation1993), and soil nitrate inhibited nodule growth (Streeter Citation1985). In an earlier study we observed that the number of nodules from plants grown on H-L N plot was half of the number from plants grown on L-L N plot (Sugimoto, Shiraishi, and Oji Citation2005), and we speculated that Enrei plants grown on H-L N plot cannot develop enough nodules at the early stage of plant growth and have much less N stored in nodules. In the present study, the plants grown on L-H N plot (where changes in the amount of N released from the CUSNLF were opposite to the changes in the plants grown on H-L N plot) had higher seed yields than the plants grown with the other three N plots, but the σ15N value of their seeds was slightly higher than that of the plants grown on L-L N plot. Considering this observation and the result that En1282 plants assimilated N well in the late growth stage (), it was suggested the importance of N assimilation at the late plant growth. Moreira et al. reported that foliar N application at the pod formation period increased seed yield under certain environmental conditions (Citation2017). The work of Takahashi et al. (Citation1991) that the deep placement of N fertilizers improved seed yields suggested the effectiveness of N fertilization at the late period of plant growth of soybean. We suspect that the N supply (including N2 fixation and N assimilation during the late period of plant growth) is very important to seed production, and we speculate that the plants grown on the H-L N plot subsequently provide lower seed yields than plants grown on either L-L or L-H N plot.
Although Zhang et al. (Citation2018) described some candidate genes affecting the protein content in soybean seeds, the mechanisms underlying how the protein contents of soybean seeds are controlled remain unclear. We demonstrated that the inhibition of the N2 fixation activity of soybean plants resulted in both an increase in the seeds’ oil contents and nearly the same ratio of protein/oil as that of a non-nodulating genotype (Sugimoto et al. Citation2001). Our present study’s results establish that the amount of protein per seed changed in the same ratio as the amount of oil per seed in the case of the non-nodulating genotype, En1282 (). This observation implies that organic substances such as sucrose and low-molecular-weight nitrogenous compounds transported into seeds changed to amino acids (protein) in a fixed ratio in the case of En1282 plants. Higher ratio of the inhibition of N2 fixation by CUSLNFs on Enrei and En-b0-1 plants seemed to reduce the decreasing amount of oil per plant (). We previously observed a similar decrease in the ratio of amounts of oil and protein by a CUSLNF (Sugimoto et al. Citation2001). We guess that nodules having high N2 fixation consumed sugar and resultantly decreased the amounts of C to be transported into developing seeds.
In the En1282 and Enrei plants, the increase in the seeds’ protein content was proportional to the increase in the SW (). The organic N supply to maturing seeds may be a controlling factor of the seeds’ protein content in En1282 and Enrei plants. We observed that in the En-b0-1 plants, the seed protein contents were inversely correlated with the seed oil contents (), and the protein contents were increased by the soil N conditions in the order of the H-H, L-H, H-L, and L-L N plots (). These increases were concomitant with the decreases in the seed weight () but not with the decrease in the seeds’ σ15N values (). Since C (sucrose) is a constituent element of both protein and oil, this observation suggests that the C supply but not the N supply to maturing seeds limited the accumulations of protein and oil in the seeds of En-b0-1 plants.
A potential reason why the En1282 plants’ seed protein contents (%) were not the same among plants grown under different N plots is as follows: the increases in the amounts of carbohydrate and oil per seed during seed growth were not related to the increase in the amount of protein per seed. The main component of carbohydrates in soybean seeds present as cell wall but not as storage compounds (Liu Citation1997). We previously observed that the accumulation profiles of protein and oil in maturing seeds of plants of the CV Enrei differed from each other (Sugimoto et al. Citation1998). We speculated that the accumulations of protein and oil were affected by the factor(s) distinct from each other in maturing seeds of Enrei and En1282 plants.
Here we estimated the ratios of the fixation-, the CUSLNF-, and the soil-originated N in the seed N by comparing the σ15N values of mature seeds from plants of three soybean genotypes (En1282, Enrei, and En-b0-1) based on the assumptions described in the materials and methods ( and ). The one contradictory result was our observation that the σ15N value of the seeds from En1282 plants grown on the H-H N plot was lower than those of the Enrei and En-b0-1 plants grown on the same type of N treatment (). One possible factor is the high activity of the N assimilation of soybean plants. Suganuma et al. (Citation2001) observed about one-third of N from plants of two supernodulating genotype soybeans was derived from soil N . Kanayama et al. (Citation2002) purified nitrate reductase from the nodule cytosol of soybean. A possibility was that plants of both nodulating genotypes assimilated more CUSLNF-N than plants of non-nodulating genotype in the case of the H-H N plot in our experiments. More refined experiments are necessary to estimate the accurate ratios of the origins of N in seeds (such as soil, fertilizer and N2 fixation).
In summary, our present findings demonstrated that the N2 fixation activity of Enrei plants affected the seed yields and contents of storage compounds in the soybean seeds by decreasing oil accumulation.
Disclosure statement
No potential conflict of interest was reported by the authors.
References
- Akao, S., and H. Kouchi. 1992. “A Supernodulating Mutant Isolated from Soybean Cultivar Enrei.” Soil Science and Plant Nutrition 38: 183–187. doi:10.1080/00380768.1992.10416966.
- Carroll, B. J., D. McNeil, and P. M. Gresshoff. 1985. “A Supernodulation and Nitrate-tolerant Symbiotic (Nts) Soybean Mutant.” Plant Physiology 78: 34–40. doi:10.1104/pp.78.1.34.
- Fabre, F., and C. Planchon. 2000. “Nitrogen Nutrition, Yield and Protein Content in Soybean.” Plant Science : an International Journal of Experimental Plant Biology 152: 51–58. doi:10.1016/S0168-9452(99)00221-6.
- Francisco, P. B., and S. Akao. 1993. “Autoregulation and Nitrate Inhibition of Nodule Formation in Soybean Cv. Enrei and Its Nodulation Mutant.” Journal of Experimental Botany 44: 547–553. doi:10.1093/jxb/44.3.547.
- Kanayama, Y., K. Kimura, Y. Nakamura, and T. Ike. 2002. “Purification and Characterization of Nitrate Reductase from Nodule Cytosol of Soybean Plants.” Plant Physiology 105: 396–401. doi:10.1034/j.1399-3054.1999.105302.x.
- Liu, K. 1997. “Chemistry and Nutritional Value of Soybean Components.” In Soybeans Chemistry, Technology, and Utilization edited by Kosher Liu, 25–113.New York, NY: Chapman Hall.
- Moreira, A., L. A. Morares, G. Schroth, F. J. Becker, and M. G. Mandarino. 2017. “Soybean Yield and Nutritional Status Response to Nitrogen Sources and Rates of Foliar Fertilization.” Agronomy Journal 109: 1–7. doi:10.2134/agronj2016.04.0199.
- Ohyama, T., R. Minagawa, S. Ishikawa, M. Yamamoto, N. V. P. Huang, N. Ohtake, K. Sueyoshi, T. Sato, Y. Nagumo, and Y. Takahashi. 2013. “Soybean Seed Production and Nitrogen Nutrition.” In A Comprehensive Survey of International Soybean Research — Genetics, Physiology, Agronomy and Nitrogen Relationships, edited by J. E. Board, 115–157. London, UK: InTechOpen Limited. doi:105772/45867.
- Shearer, G., D. H. Kohl, and J. E. Harper. 1980. “Distribution of 15N among Plant Parts of Nodulating and Nonnodulating Isolines of Soybeans.” Plant Physiology 66: 57–60. doi:10.1104/pp.66.1.57.
- Streeter, J. G. 1985. “Nitrate Inhibition of Legume Nodule Growth and Activity. I. Long Term Studies with a Continuous Supply of Nitrate.” Plant Physiology 77: 321–324. doi:10.1104/pp.77.2.321.
- Suganuma, T., H. Fujikake, N. Ohtake, K. Sueyoshi, and T. Ohyama. 2001. “Comparison of the Growth and Nitrogen Fixation Activity of the Hypernodulation Soybean Mutant NOD1-3 and Its Parent Cv. Williams in Field Cultivation.” Bulletin of the Faculty of Agriculture, Niigata University 53: 123–131.
- Sugimoto, T., R. Masuda, M. Kito, N. Shiraishi, and Y. Oji. 2001. “Nitrogen Fixation and Soil N Level during Maturation Affect the Contents of Storage Compounds of Soybean Seeds.” Soil Science and Plant Nutrition 47: 273–279. doi:10.1080/00380768.2001.10408391.
- Sugimoto, T., K. Nomura, R. Masuda, K. Sueyoshi, and Y. Oji. 1998. “Effect of Nitrogen Application at the Flowering Stage on the Quality of Soybean Seeds.” Journal of Plant Nutrition 21: 2065–2075. doi:10.1080/01904169809365544.
- Sugimoto, T., N. Shiraishi, and Y. Oji. 2005. “Daizu Shusi Hinshitsu No Chissosehi Niyoru Hendo [Changes in Contents of Storage Compounds in Soybean Seeds by Application of Nitrogen fertilizers].” In Daizu No Seisan Hinshitsu Kojyo to Eiyouseiri [Improvement of Production and Quality of Soybean in Relation to Plant Nutrition and physiology], edited by T. Ohyama, 40–58. Tokyo: Hakuyusha Co.
- Takahashi, M., J. Arihara, N. Nakayama, and M. Kokubun. 2003. “Characterization of Growth and Yield Formation in the Improved Genotype of Supernodulating Soybean (Glycine Max L. merr.).” Plant Production Science 6: 112–118. doi:10.1626/pps.6.112.
- Takahashi, Y., T. Chinushi, Y. Nagumo, T. Nakano, and T. Ohyama. 1991. “Effect of Deep Placement of Controlled Release Nitrogen Fertilizer (Coated urea) on Growth Yield, and Nitrogen Fixation of Soybean Plants.” Soil Science and Plant Nutrition 37: 223–231. doi:10.1080/00380768.1991.10415032.
- Unkovich, M., D. Herridge, M. Peoples, G. Cadisch, B. Boddey, K. Giller, B. Alves, and P. Chalk. 2008. “15N Natural Abundance Method.” In Measuring Plant-associated Nitrogen Fixation in Agricultural Systems, ACIAR Monograph No.136, edited by Peter Core, 131–162. Australia: Australian Center for International Agricultural Research.
- Wu, S., and J. E. Harper. 1991. “Dinitrogen Fixation Potential and Yield of Hypernodulating Soybean Mutants: A Field Evaluation.” Crop Science 31: 1233–1240. doi:10.2135/cropsci1991.0011183X003100050031x.
- Yamamoto, N., T. Masumura, K. Yano, and T. Sugimoto. 2019. “Pattern Analysis Suggests that Phosphoenolpyruvate Carboxylase in Maturing Soybean Seeds Promotes the Accumulation of Protein.” Bioscience, Biotechnology, and Biochemistry 83. doi:10.1080/09168451.2019.1648205.
- Yoneyama, T., H. Nakano, M. Kuwahara, T. Takahashi, I. Kambayashi, and J. Ishizuka. 1986. “Natural 15N Abundance of Field Grown Soybean Grains Harvested in Various Localizations in Japan and Estimate of the Fractional Contribution of Nitrogen Fixation.” Soil Science and Plant Nutrition 32: 443–449. doi:10.1080/00380768.1986.10557524.
- Zhang, K., S. Li, W. Li, S. Liu, X. Li, Y. Fang, J. Zhang, et al. 2018. “Identification of QTNs Controlling Seed Protein Content in Soybean Using Multi-locus Genome-wide Association Studies.” Frontiers in Plant Science 9 :1690. doi:10.3389/fpls.2018.01690.