
 ?Mathematical formulae have been encoded as MathML and are displayed in this HTML version using MathJax in order to improve their display. Uncheck the box to turn MathJax off. This feature requires Javascript. Click on a formula to zoom.
ABSTRACT
Pyrogenic carbon (PyC) or black carbon (BC), the residue of grassland and forest fires and fossil fuel combustion, plays an important role in carbon storage and pollutant adsorption in soil. To understand its roles in soil, it is necessary to accurately assess the PyC fraction. Soil is, however, a complex mixture of inorganic and organic matter, usually containing humic substances, i.e., non-PyC organic matter, in concentrations one to two orders of magnitude higher than PyC. This engenders difficulty in determining the PyC content in soils; thus, various quantitative methods have been proposed for different research purposes. In this study, the two widely used methods of chemo-thermal oxidation at 375°C (CTO-375) and acid dichromate oxidation (Cr2O7) method were reconsidered in terms of the suitability for determining the PyC content of soil by using model soil. The CTO-375 method was simpler, but the quantified PyC was suggested to be the combustion residue of non-PyC organic matter. By contrast, 29 to 40% of PyC content was determined as non-PyC organic matter by the Cr2O7 method. Therefore, we proposed an improved Cr2O7 method by increasing acidic K2Cr2O7 concentration threefold for quantification accuracy: although time-consuming, it resulted in the lowest overestimation on the PyC content, that is, 16 to 23% from non-PyC organic matter. The application of the improved Cr2O7 method to natural soil was confirmed with 99 to 103% certainty (recovery rate).
1. Introduction
Soil organic matter (SOM) plays an important role in the environment because it is one of the largest reservoirs of carbon and the main medium for organic chemical sorption in soil. It can be approximately divided into metabolites of biogenic and burned residues. The main part of SOM comprises humic substances, one type of the biogenically metabolite residues, which are formed via the biological metabolism of plant residues and root exudates by the animals and microorganisms in soil (Myneni Citation2019). The burned residue is called either pyrogenic carbon (PyC) or black carbon (BC) (Hammes et al. Citation2007; Bird et al. Citation2015; Zimmerman and Mitra Citation2017) and originates from vegetation fire, e.g., biochar (Santín et al. Citation2016), or from the incomplete combustion of fossil fuels, e.g., soot (Wang Citation2004). Both, humic substances and PyC, have multiple origins and take part in multiple metabolic cycles; therefore, their chemical compositions and structures are continuously changing. Generally, humic substances have more functional group and higher O/C and H/C ratios than PyC (Hammes et al. Citation2007), while PyC has a carbon-condensed aromatic structure (Hammes et al. Citation2007; Bird et al. Citation2015). PyC in soil has recently been considered in contributions to counteracting global warming because of its long mean residence time for carbon storage (Spokas et al. Citation2012). Meanwhile, PyC is able to sorb organic and inorganic pollutants due to its higher sorption capacity (Qi et al. Citation2017), and its role in amending soil fertility (Lehmann Citation2007). PyC generated unintentionally by wildfire or burning of fossil fuel ubiquitously exists in soil, and other forms of PyC, especially biochars, are intentionally applied to soil (Murano et al. Citation2009; Zhang et al. Citation2013; Schmidt et al. Citation2019): for these reasons, an accurate analysis of the PyC content in soil is becoming increasingly important.
To analyze roles PyC played in carbon reservoir and sorbent, accurately measuring its quantity in soil is imperative (Reisser et al. Citation2016). Soils and sediments are media with extremely diverse components including non-PyC, such as humic substances, and inorganic compounds, rendering the quantification of PyC is challenging. Studies have reported high total organic carbons (TOCs) of 2.04%–11.8% for Baltic sediment (Sánchez-García, Cato, and Gustafsson Citation2012), but less than 2.5% of TOC in many other cases (Seiter et al. Citation2004; Elmquist et al. Citation2008; Lohmann et al. Citation2009; Salvadó et al. Citation2017). In contrast, soils that are more important to humans tend to have higher TOC: for example, it is recommended to use compost to increase soil fertility in agricultural fields, and the TOCs of Chernozem and Andosol, famous for their high SOM, are 5% to 15% (FAO Citation2001) and 1% to 19% (Nanzyo, Dahlgren, and Shoji Citation1993), respectively. In addition, compost is generally added to soils artificially (Barthod, Rumpel, and Dignac Citation2018). Thus, the quantification of PyC is more difficult, because of large amounts of non-PyC SOM in soil. Not to speak of that the main components of soil are inorganic minerals including clay minerals that may unfortunately affect the quantification.
In this study, we evaluated whether or not two recommended methods for the quantification of PyC, i.e., acid dichromate oxidation (Cr2O7) and chemo-thermal oxidation at 375°C (CTO-375), are applicable to soils with high SOM contents. Hammes et al. (Citation2007) compared 7 PyC quantification methods in 12 different materials by 17 laboratories. Of the seven methods that they surveyed, the Cr2O7 and CTO-375 methods are relatively simple and prevalent. Their study, however, did not examine the artificial mixtures of PyC with non-PyC organic materials and inorganic materials, nor with each material, despite the fact that inorganic materials, such as clay minerals and oxides, enhance PyC oxidation by the CTO-375 method (Elmquist et al. Citation2006). Therefore, model mixtures were prepared herein, which allowed us to examine the two methods in detail. Based on the examination, the Cr2O7 method was selected and then improved for developing a more accurate analysis of PyC.
2. Materials and methods
2.1. Materials
Industrial forklift exhaust diesel particulate matter (SRM-2975, National Institute of Standards and Technology, Maryland, USA) was used as a model material of soot. Rice straw biochar was prepared according to the method of Kuo, Herbert, and Louchouarn (Citation2008) as a model material for particulate PyC. Rice straws of 5 cm length were dried for 3 days at 60°C. These dried rice straws were pyrolyzed in a capped quartz crucible for 5 h at 450°C. Ottmar (Citation2014) reported that the temperature of wildfires during the smoldering stage ranges from 300°C to 600°C. However, it must be noted that the prepared biochar is not a complete model PyC. Santín et al. (Citation2017) point out that anthropogenically prepared biochar has different physicochemical properties from that wildfire charcoals, which were formed under wider temperature ranges, higher maximum temperatures, larger oxygen, and shorter heating durations. The biochar was ground in an agate mortar and pestle and passed through a 250 μm sieve. Melanoidin, a humic material without PyC, was prepared using the method of Schmidt (Citation2007). One hundred grams of glucose and 10 g of urea were added to 1 L of distilled water and incubated for 30 days at 90°C. During this incubation, the mixture was stirred twice a day to prevent the formation of a skin near the liquid surface. Afterward, the urea and glucose in the supernatant were removed by centrifugation, washed three times with deionized water, and freeze-dried. Kaolinite (Wako Pure Chemical, Osaka, Japan) was used as a model material for inorganic mineral. Kaolinite was ground and passed through a 250 μm sieve. One gram of sieved kaolinite was then soaked in 5 mL of 0.2 N hydrochloric acid (HCl), sonicated for 10 min, and centrifuged. This kaolinite was then washed with distilled water, with 0.2 N (sodium hydroxide) NaOH, and with distilled water 10 times in total in the same manner as described above. The washed kaolinite was dried for 1 day at 80°C. Volcanic ash soil (JSAC 0411, the Japan Society for Analytical Chemistry, Tokyo, Japan) was used for confirming the certainty of the improved Cr2O7 method. Unless otherwise stated, all chemicals were of analytical grade (Kanto Chemical, Tokyo, Japan).
2.2. Organic carbon and pyrogenic carbon contents in materials
After removing inorganic carbon via adding 1 M HCl to the materials and drying the solution, OC contents were measured by the combustion method using an elemental analyzer (ANCA-GSL, Sercon, Crewe, UK) connected to a continuous flow isotope ratio mass spectrometer (Hydra 20–20, Sercon). The mean (1 standard deviation: SD, n = 3) OC contents of soot, biochar, melanoidin, and kaolinite were 85.3 (1.86)%, 52.4 (0.29)%, 54.0 (0.36)%, and 0.0240 (0.00000)%, respectively. These OC contents were used for our experiments. To prepare mixture samples, the PyC/OC ratios of the materials, with the exception of biochar, were measured using the CTO-375 method shown in the results. Biochar PyC/OC ratios measured by the Cr2O7 method were used for the preparation of mixtures. This is because the PyC/OC ratios of the soot, melanoidin, and kaolinite were not different in case of the CTO-375 and Cr2O7 methods. The ratios of biochar measured by the CTO-375 method were the same as melanoidin, but much lower than that by Cr2O7.
2.3. Mixing of materials
Kaolinite was mixed with melanoidin, biochar, or soot to mimic environmental soil. Unless otherwise stated, kaolinite and melanoidin mixtures were prepared with 4% OC content. The mixtures of kaolinite and biochar, and of kaolinite and soot, were prepared with 0.4% PyC contents. When kaolinite was mixed with melanoidin and biochar, or with melanoidin and soot, the PyC/OC ratio was adjusted to 10% of the TOC content in the mixed sample. The mixing ratio of kaolinite, melanoidin and biochar was calculated from the following simultaneous equations of (1) and (2) with the OC and PyC contents, respectively:
where W is the weight, CTOC the total organic carbon content (%), and CPyC the pyrogenic carbon content (%). When preparing the kaolinite-melanoidin-soot mixture, ,
, and
were used, instead of
,
, and
. Since soot is very hydrophobic, a few droplets of 80% (v/v) acetone were added to the mixed samples to ensure that the materials were well-mixed. Thereafter, the materials were dried at 80°C for 1 day.
2.4. Investigating the quantification method of pyrogenic carbon
2.4.1. CTO-375 method
The CTO-375 method was conducted according to Gustafsson et al. (Citation1997). A sample was weighed in a silver capsule (5 × 9 mm, Sercon). Kaolinite, melanoidin, biochar, soot, and mixed samples weighed 50, 0.5, 0.5, 0.5 and 3 to 45 mg, respectively. These weighed amounts were determined by preliminary tests and by calculation from the PyC contents of each material, ensuring that the carbon contents measured by the combustion method were within the appropriate quantifying range. The silver capsules were placed on a stainless-steel combustion boat and inserted into a tubular furnace (ARF series, Asahi Rika, Chiba, Japan) with a temperature controller (AMF-N, Asahi Rika). The temperature was increased every 30 min from room temperature to 60°C, and then to 160°C, to 260°C, to 350°C, finally to 375°C, under an actively filtered airflow of 200 mL min−1. Samples were combusted at 375°C for 18 h to oxidize non-PyC organic matter. Thereafter, the samples were wetted with 25 μL of distilled water and 25 μL of 1 M HCl, three times to remove carbonates. Finally, the samples were dried at 60°C for 24 h.
2.4.2. CTO method in the temperature range from 260°C to 405°C
To examine the change in the amount of organic matter removed depending on the temperature, the CTO method was performed as aforementioned except that the final combustion temperatures were set at 260, 275, 290, 305, 320, 335, 350, 365, 375, 390, and 405°C.
2.4.3. Original Cr2O7 method
The Cr2O7 method was performed according to the method proposed by Lim and Cachier (Citation1996). Samples were weighed in a high-density polyethylene centrifuge tube (Nalgene, Nunc International, New York, USA). The weighed amounts of kaolinite, melanoidin, biochar, soot, and mixed samples were 2000, 150, 8, 8, and 2000 mg, respectively, which were determined based on the amount of organic matter and PyC in the samples. The amount of the sample used for the analysis of the Cr2O7 method was larger than that of the CTO-375 method due to the various steps as shown below. Samples were soaked in 15 mL of 3 M HCl, sonicated for 10 min, and left standing at room temperature for 24 h in order to remove carbonate. The solution was centrifuged at 5000 × g for 45 min at 20°C to remove the supernatant. The precipitate was transferred to a Teflon beaker using 7.5 mL of 2 M HCl and 20 M hydrogen fluoride (HF) solution to remove kaolinite and silicate, left standing for 2 h at room temperature, then heated at 200°C to evaporate HF: even after this treatment, not all kaolinite or silicate would be removed, and a solid residue was obtained in all the samples. The residue was dissolved in 10 mL of 10 M HCl for 24 h at room temperature. Samples solution was moved into a high-density polyethylene centrifuge tube using 20 mL of distilled water, centrifuged at 5000 × g for 45 min at 20°C. Afterward, the supernatant was removed by passing through 0.1 μm cellulose nitrate membranes (GE Healthcare, California, USA), and the retentate was washed down with distilled water onto the filter. The filtered residue was dried with the filter for 24 h at 80°C. A portion of dried residue was placed in a thick glass centrifuge tube. The portion amount of kaolinite, melanoidin, biochar, soot, and mixed samples was 200, 60, 2, 2, and 200 mg, respectively, determined by the preliminary tests. The sample was treated with 10 mL of 0.1 M potassium dichromate (K2Cr2O7)/2 M Sulfuric acid (H2SO4) and stirred with a Teflon coated stir bar in a magnetic-water bath stirrer at 120 rpm for 60 h at 55°C to remove non-PyC organic matter. The solution was centrifuged at 5000 × g for 45 min at 20°C. The supernatant was removed and passed through 0.1 μm cellulose nitrate membranes, and the residue was washed down with distilled water onto the filter. The filtered residue was dried with in filter for 24 h at 80°C.
2.5. Application of improved Cr2O7 method to natural soil
The original Cr2O7 method was improved as described in Results and Discussion section. The applicability of the improved Cr2O7 method to natural soil was confirmed using the volcanic ash soil with application of soot or biochar. The PyC/OC ratio after addition of soot or biochar was 20% higher than that of the original soil. 2000 mg of these soils were tested with the improved method. The soil-K2Cr2O7/H2SO4 solution ratio was adjusted so that the volume of the solution used for determining each OC content of these samples corresponds to 4% of OC in the model soil. The recovery rates of PyC in the samples, which indicated the certainty of the improved method, were calculated by dividing the measured PyC/OC ratios by those expected values.
2.6. Quantification of carbon content
The carbon content in each treated sample was measured by the combustion method using an elemental analyzer connected to a continuous flow isotope ratio mass spectrometer. To calculate PyC/OC ratios, the measured carbon content after performing the CTO-375 or Cr2O7 method was divided by organic carbon content described above. To calculate PyC content in the Cr2O7 method, the mass loss after HF treatment was considered.
2.7. Observation of material surface and element mapping
Morphologies and chemical maps of the material surface were observed using scanning electron microscope-energy dispersive X-ray spectrometry (SEM-EDS, JSM-IT100, JEOL, Tokyo, Japan). The sample was mounted on an aluminum stub using double-faced carbon tape and sputtered with a thin layer of platinum using magnetron sputtering (AutoFineCoater JEC-3000FC, JEOL).
2.8. Statistical analysis
All experiments were conducted in triplicate and data were reported as mean (SD), unless otherwise specified. Statistical analyses were performed using the software R version 3.10 (The R Foundation for Statistical Computing).
The breakdown of the PyC/OC ratio in the kaolinite-melanoidin-biochar mixture was calculated as follows:
The calculation method of the breakdown in the kaolinite-melanoidin-soot mixture was the same as Eqs. (3) and (4), with the biochar parameters replaced by the soot parameters.
3. Results and discussion
3.1. CTO-375 method
3.1.1. Organic carbon content and PyC/OC ratio of each material treated by CTO-375 method
The PyC/OC ratios of soot, biochar, melanoidin, and kaolinite were 77.0 (2.78)%, 6.68 (2.24)%, 4.04 (0.202)%, and undetected, respectively (). These values were consistent with previous research (Elmquist et al. Citation2006). The OC contents of soot and melanoidin were 84.4 (0.9)% and 61.9 (4.1)%, respectively, and the PyC/OC ratios of those were 78.3 (1.3)% and 4.1 (0.5)%, respectively (Elmquist et al. Citation2006). These results indicate that the procedure of the CTO-375 method was appropriately conducted in our laboratory. The rice straw biochar contained 52.4% of OC, but this decreased to 3.69% after treatment by the CTO-375 method, giving the PyC/OC ratio of 6.68%. Hammes et al. (Citation2007) also reported that the treatment of grass char by the CTO-375 method resulted in a PyC/OC ratio of 1.5%, much lower than that of diesel soot reported by Elmquist et al. (Citation2006). The fact that both kaolinite OC content and PyC/OC ratio were below the detection limit was important in that it showed that the kaolinite does not affect them. The measured values of each material were used for calculation of the OC and PyC contents in the mixtures described in the next section.
Figure 1. PyC/OC ratio of each material (alone) after treatment using the CTO-375, original Cr2O7, and improved Cr2O7 methods. Error bar indicates 1 standard deviation (n = 3). ND: not detected
3.1.2. PyC/OC ratio of mixtures treated by CTO-375 method
In the case where each of soot, biochar, or melanoidin alone was treated by the CTO-375 method, the PyC/OC ratio was 77.0%, 6.68%, or 4.04%, respectively; however, when these materials were mixed with kaolinite, the PyC/OC ratio was 0.285 (0.0627)%, undetected, or 2.75 (0.242)%, respectively (). This suggests that kaolinite enhanced the oxidation of both PyC and non-PyC materials. Elmquist, Gustafsson, and Andersson (Citation2004) reported that silica enhanced the oxidation of soot (SRM-2975) because of the smearing effect of soot at its surface. In addition, the application of copper oxide (CuO) to such mixtures further enhanced oxidation. Due to Lewis acid sites at the edges of the kaolinite structure, oxygen on the sites is highly reactive (Soma and Soma Citation1989). It is presumed that oxygen catalyzes the oxidation of carbon materials, and the catalytic effect was stronger with condensed carbon, such as soot and biochar. Kaolinite is ubiquitous in many types of soil; in addition, the Lewis acid sites are also found in allophane and imogolite in Andosol (Henmi and Wada Citation1974).
Figure 2. PyC/OC ratio of mixed samples after treatment using the CTO-375, original Cr2O7, and improved Cr2O7 method. For the kaolinite-melanoidin mixture, melanoidin was added to kaolinite at 4% TOC. For the kaolinite-soot mixture and the kaolinite-biochar mixture, pyrogenic carbons were added to kaolinite to set a 10% PyC/OC ratio in the case of the 4% TOC of kaolinite-melanoidin mixture. Values of OC content and PyC content of each material measured by the CTO-375 method were used to make the mixtures, except for the PyC content of biochar. For the content of biochar, the value measured by the Cr2O7 method was used. Error bar indicates 1 standard deviation (n = 3). ND: not detected
The kaolinite, melanoidin, and soot, as well as the mixtures of kaolinite, melanoidin, and biochar that were designed to mimic environmental soil, were treated using the CTO-375 method (). The TOC content and PyC/OC ratio of each mixture were set to 4% and 10%, respectively, i.e., the PyC/OC ratio obtained in this experiment should theoretically be 10%. However, neither achieved 10%; the PyC/OC ratios of the soot- and biochar-containing mixtures were 3.67 (0.323)% and 3.28 (0.290)%, respectively. Shown in , the breakdown of the PyC/OC ratio was estimated to be 99.0% from melanoidin and only 1.0% from soot in the soot-containing mixture. For the biochar-containing mixture, all PyC was supposed to be from melanoidin, as the PyC contents were under the detection limit.
Figure 3. PyC/OC ratio of mixed samples designed to mimic environmental soil after treatment using the CTO-375, original Cr2O7, and improved Cr2O7 method. The TOC content and PyC/OC ratio of the mixture were set to 4% and 10%, respectively. The values of OC content and PyC content of each material measured by the CTO-375 method were used to make the mixtures, except for the PyC content of biochar. For the content of biochar, the value measured by the Cr2O7 method was used. The error bar indicates 1 standard deviation (n = 3) of each constituent material
3.1.3. Thermograms of mixture samples of CTO method
The residual carbon, apparent PyC, contents after treatment of CTO were measured between 260°C and 405°C, especially for soot and melanoidin commonly used as standard materials (). In this experiment, the TOCs of kaolinite-melanoidin and kaolinite-melanoidin-soot mixtures were set at 4%. The PyC/OC ratio of kaolinite-melanoidin-soot mixture was set to 10% at 375°C. For the kaolinite and soot mixture, soot was added to the kaolinite to have the PyC content at 375°C equal to that of the kaolinite-melanoidin-soot mixture; therefore, in , the residual C/OC ratio of the kaolinite and soot mixture should appear to be 10% of that of kaolinite-melanoidin-soot mixture at 375°C. The carbon in the kaolinite and soot mixture remained at 9.8% of the residual C/OC ratio at 260°C. However, the ratio decreased with increasing temperature, reaching 0.29% at 375°C. Meanwhile, thermograms of the residual C/OC ratio of the kaolinite and melanoidin mixture showed the same trend as the kaolinite-melanoidin-soot mixture. By assuming that fertile farmland contained high SOM we also measured the residual C/OC ratios of the kaolinite and melanoidin mixture ranging the OC from 2.5% to 15% (). For all mixtures, the residual C/OC ratios decreased with increasing temperature and were 3.7% to 5.1% at 375°C.
Figure 4. Thermograms of mixture samples after CTO treatment. For the kaolinite-melanoidin mixture, the samples were prepared as 4% TOC. For the kaolinite-soot mixture and kaolinite-melanoidin-soot mixture, the samples were prepared as 4% TOC, and as theoretically 10% PyC/OC ratio at 375°C. OC and PyC contents for each material measured using the CTO-375 method were used to make the mixtures. The arrows shown in the figure indicate whether the legend depends on the value of the left or right axis. Error bar indicates 1 standard deviation (n = 3)
Figure 5. Thermograms of kaolinite-melanoidin mixtures after CTO treatment. Error bar indicates 1 standard deviation (n = 3)
These results indicate a high possibility that the PyC/OC ratio of high-SOM samples, measured by the CTO-375 method, derives mostly from the residues of non-PyC organic matter, but very little from actual PyC. In soil, the humic substance content is higher by 1 to 2 orders of magnitude than the PyC content (Agarwal and Bucheli Citation2011; Kerré et al. Citation2016; Qi et al. Citation2017). Therefore, this study showed that even though the residual amount of non-PyC organic matter is only several percentage, it makes significant contribution to the PyC/OC ratio. This has been undocumented up to date.
3.2. Original Cr2O7 method
3.2.1. Organic carbon and PyC contents of each material treated by the original Cr2O7 method
The PyC/OC ratios of soot, biochar, melanoidin, and kaolinite were 69.6 (6.60)%, 54.0 (17.70)%, 4.81 (2.491)%, and undetected, respectively (). The PyC/OC ratio of the soot was 7.4% lower than the ratio measured by the CTO-375 method (t-test p-value = 0.145). On the other hand, the PyC/OC ratio of biochar was 47.3% higher (t-test p-value = 0.0102). Hammes et al. (Citation2007) used n-hexane soot as an alternative to diesel soot (SRM-2975), grass char, and melanoidin. In their experiment, the PyC/OC ratios of n-hexane soot and grass char treated by the Cr2O7 method were approximately 5% and 30% higher than those treated by the CTO-375 method, respectively. On the other hand, they reported that the ratio of melanoidin treated by the Cr2O7 method was nearly 0%. Although the materials used were not identical to those used herein, the trends in PyC/OC ratio obtained by the CTO-375 and the Cr2O7 methods for each sample were comparable.
3.2.2. PyC/OC ratio of mixtures treated by the original Cr2O7 method
The PyC/OC ratio of the mixed sample treated by the original Cr2O7 method was also measured. Mixed samples were prepared in the same manner as those measured using the CTO-375 method. The PyC/OC ratios of soot, biochar, and melanoidin mixed with kaolinite were 68.7 (0.36)%, 70.5 (6.88)%, and 4.21 (1.836)%, respectively (). In the CTO-375 method, the PyC/OC ratio of the soot and kaolinite mixture was 0.285%, whereas that of soot alone was 77.0%. In contrast, the differences of the PyC/OC ratios between the mixture and soot alone by the original Cr2O7 method were not found (t-test p-value = 0.838). In the CTO-375 method, all biochar contents were removed after mixing with kaolinite. While the biochar was still detectable after mixing with kaolinite. The PyC/OC ratio of the kaolinite and biochar mixture was 16.5% higher than that of biochar alone, although this difference was not significant (t-test p-value = 0.206). The remaining amount of melanoidin in the mixture was 4.21%, similar to the 4.81% when treated alone (t-test p-value = 0.749).
Kaolinite-melanoidin-soot and kaolinite-melanoidin-biochar mixtures designed to mimic environmental soil were treated with the original Cr2O7 method (). Mixture samples were prepared in the same manner as those measured using the CTO-375 method. The PyC/OC ratios of the soot- and biochar-containing mixtures were 9.96 (0.298)% and 9.52 (0.520)%, respectively, close to 10% of the theoretical PyC/OC ratio. Taking into consideration the results shown in , it was estimated for the soot-containing mixture that 60.4% and 39.6% of measured PyC/OC ratios originated from soot and melanoidin, respectively. Similarly, 70.9% and 29.1% of biochar-containing mixtures approximately derived from biochar and melanoidin, respectively. The physicochemical properties of natural charcoal depend on the production conditions in nature environment, which, in particular, cannot be represented by biochar that is generally produced in laboratory (Santín et al. Citation2017). Changes in the physicochemical properties of humic substances (Ikeya et al. Citation2015) and charcoal (Dong et al. Citation2017) in soil also occur over time. Although the model biochar herein is not representative of naturally occurring charcoals, these results indicate that the original Cr2O7 method can measure the origin of PyC in the soil more accurately than the CTO-375 method.
3.3. Improved Cr2O7 method
3.3.1. Examination of Cr2O7 method
Cr2O7− will react with OC in the presence of excess protons from sulfate as follows:
In the original Cr2O7 method, 0.1 M K2Cr2O7/2 M H2SO4 was used. Thus, the molar ratio of H+ to Cr2O72− was 1 to 20, and sulfate was present in significant excess. When we increased the concentration of Cr2O72− threefold (), melanoidin was found to be undetected. To minimize the effect of the oxidation of the soot and biochar, 0.3 M K2Cr2O7/2 M H2SO4 was used in subsequent experiments. The PyC/OC ratio of the kaolinite and melanoidin mixture (TOC: 4%) treated by 0.3 M K2Cr2O7/2 M H2SO4 was 2.44 (0.55)%, which is almost half of the 4.1% by the original Cr2O7 method. It was suspected that the decomposition residue of OC was adsorbed on the residual kaolinite and soot or biochar surface. To desorb these residues, 30 mL of 1 M potassium chloride (KCl) was used when filtering the precipitate.
Figure 6. PyC/OC ratios of melanoidin according to different K2Cr2O7 concentrations using the Cr2O7 method. Error bar indicates 1 standard deviation (n = 3). ND: not detected
3.3.2. Organic carbon and PyC contents of each material treated by the improved Cr2O7 method
The PyC/OC ratios of soot, biochar, melanoidin, and kaolinite were 53.1 (5.78)%, 41.3 (14.42)%, undetected, and undetected, respectively (). The PyC/OC ratio of soot treated using our improved Cr2O7 method was the lowest among the three methods examined (ANOVA p-value = 0.00396, Tukey honestly significant difference p-value(CTO-375-Improved Cr2O7) = 0.00358, p-value(Original Cr2O7-Improved Cr2O7) = 0.0210, p-value(CTO-375-Original Cr2O7) = 0.273). The value for biochar was 12.7% lower than the example treated by the original Cr2O7 method but 34.6% higher than that treated by the CTO-375 method (ANOVA p-value = 0.0117, Tukey HSD p-value(CTO-375-Improved Cr2O7) = 0.0430, p-value(Original Cr2O7-Improved Cr2O7) = 0.509, p-value(CTO-375-Original Cr2O7) = 0.0112). The decrease tendency of the PyC/OC ratio, due to the increase of Cr2O72− concentration, is also confirmed by Zhu et al. (Citation2019) for geological sediments where Cr2O72− levels in kerogen were monitored. Although the PyC/OC ratios of soot and biochar treated by the improved Cr2O7 method were lower than those treated by the original Cr2O7 method, it was particularly noteworthy that PyC was not detected after the treatment of melanoidin by the improved Cr2O7 method.
3.3.3. PyC/OC ratio of mixtures treated by the improved Cr2O7 method
The PyC/OC ratios of soot, biochar, and melanoidin mixed with kaolinite were 51.1 (5.32)%, 50.3 (4.83)%, and 1.33 (0.538)%, respectively (). The soot PyC/OC ratio was lowest in the improved Cr2O7 method when carbon materials were mixed with kaolinite (ANOVA p-value = 0.00015, Tukey HSD p-value(CTO-375-Improved Cr2O7) = 0.00275, p-value(Original Cr2O7-Improved Cr2O7) = 0.00926, p-value(CTO-375-Original Cr2O7) = 0.00012), similar to observations when individual carbon materials were treated using the improved method. As observed in biochar alone, the PyC/OC ratio of biochar-kaolinite mixture treated by the improved Cr2O7 method was lower than that treated by the original method (t-test p-value = 0.0140). Thus, the improved method tended to estimate low soot and biochar content in soil. However, the improved method is also able to accurately evaluate PyC amounts in soil when compared with the CTO-375 method, in which PyC is markedly oxidized because of the catalytic effect of aluminosilicate minerals. Furthermore, the PyC/OC ratio of melanoidin-kaolinite mixture when using the improved method could be kept as low as 1.33%, i.e., the lowest among the three methods examined (ANOVA p-value = 0.00015, Tukey HSD p-value(CTO-375-Improved Cr2O7) = 0.00275, p-value(Original Cr2O7-Improved Cr2O7) = 0.00926, p-value(CTO-375-Original Cr2O7) = 0.00012). Thus, treatment using the improved method can suppress the overestimation of PyC content that was caused by substantial amounts of humic substances in soil.
By the same token, this advantage was observed when applying the improved method to environmentally simulated soil (). The PyC/OC ratios of the soot- and biochar-containing mixtures were 9.68 (0.183)% and 9.18 (0.612)%, respectively. These values were only slightly lower than the original method (t-test p-value = 0.226 for the soot-containing mixture, 0.498 for the biochar-containing mixture) and were close to the theoretical value of 10%. The overestimation from melanoidin in the soot- and the biochar-containing mixture was suppressed to 23.1% and 15.6%, respectively. In the environmental soil, humic substances, and PyC are mixed to various extents. This ratio cannot be known in advance. In spite of this uncertainty, the improved method could still be considered as a more accurate method for measuring PyC content, because so far it is the only one that can effectively suppress the overestimation.
3.3.4. Application of the improved Cr2O7 method to natural soil
The applicability of the improved Cr2O7 method to natural soil was confirmed by using volcanic ash soil with a high OC content of 16.4 (0.32)% (). The PyC/OC ratio measured by the improved method was 18.9 (4.38)%: the soot or biochar was added to set the PyC/OC ratio by 20% higher than the original soil; for this addition, the PyC/OC ratio of the soot or biochar was that measured by the improved method (). Consequently, the OC contents of the soot- and biochar-added soils were measured as 18.1 (0.35)% and 18.6 (0.36)%, respectively, and therefore the PyC/OC ratios were estimated as 22.9% and 22.7%, respectively. The measured PyC/OC ratios of the two soils were 22.6 (1.59)% and 23.3 (6.32)%, respectively, and then the ratios of the measured to the estimated PyC contents were 98.8 (6.92)% and 102.5 (27.80)%, respectively. Though the coefficient of variation of biochar-added soil was as large as 27%, those results showed that the improved method was applicable to natural soil.
Table 1. PyC/OC ratio of volcanic ash soil, and the recovery rate of PyC of the soil mixed with soot or biochar, after treatment using the improved Cr2O7 method
3.3.5. Effect of treatment of improved Cr2O7 method
After treating soot and biochar using the improved Cr2O7 method, the surface structure of these materials did not significantly change, although the edges became slightly rounded (). Since melanoidin was completely removed by this treatment, no major shape changes could be observed. Furthermore, the O/C ratios of the remaining soot and char decreased once with HF treatment but became higher with subsequent K2Cr2O7/H2SO4 treatment (), which was considered to be the effect of oxidation by Cr2O7. These SEM- and EDS-results suggest that the quantified PyC by the improved Cr2O7 method in still include those from melanoidins, but certainly those from soot or biochar.
Figure 7. Scanning electron microscope micrographs showing the changes in surface morphology of the soot and biochar after treatment using the improved Cr2O7 method. (A) Soot before treatment. (B) Soot after HF treatment. (C) Soot after HF and K2Cr2O7/H2SO4 treatment (D) Biochar before treatment. (E) Biochar after HF treatment. (F) Biochar after HF and K2Cr2O7/H2SO4 treatment. The enclosed area indicates the regions in which EDS elemental analyses were performed by EDS
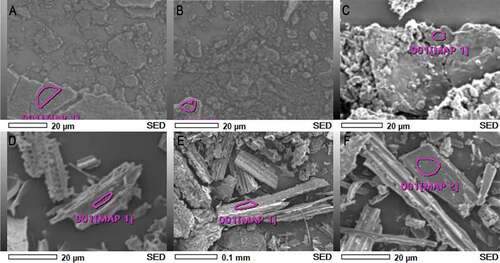
Table 2. EDS analyses showing the hanging O/C ratios in soot and biochar treated by HF and K2Cr2O7/H2SO4.
4. Conclusions
Soil is a mixture of inorganic and organic matter, and the composition of PyC keeps changing with environment, making it difficult for the measurement of the PyC content. Herein, the widely used CTO-375 and the Cr2O7 methods were examined for highly organic-rich soils. We firstly measured humic substances, PyC, and inorganic substances separately, and then the mixtures of the three types of materials that can be regarded as model soil. The results suggested that the PyC content obtained by the CTO-375 method may mostly derive from non-PyC humic substances, but the improved Cr2O7 method could suppress the overestimation due to humic substances. In addition, good applicability of the improved method to natural soil with a high OC content was confirmed with 99 to 103% recovery rate. To the best of our knowledge, this is the first study in which the accuracy of the quantification method of PyC content in soils was examined in detail and improved in accordance.
Disclosure statement
The authors have no conflicts of interest directly relevant to the content of this article.
Correction Statement
This article has been republished with minor changes. These changes do not impact the academic content of the article.
References
- Agarwal, T., and T. D. Bucheli. 2011. “Adaptation, Validation and Application of the Chemo-thermal Oxidation Method to Quantify Black Carbon in Soils.” Environmental Pollution 159 (2): 532–538. doi:10.1016/j.envpol.2010.10.012.
- Barthod, J., C. Rumpel, and M.-F. Dignac. 2018. “Composting with Additives to Improve Organic Amendments. A Review.” Agronomy for Sustainable Development 38 (2): 17. doi:10.1007/s13593-018-0491-9.
- Bird, M. I., J. G. Wynn, G. Saiz, C. M. Wurster, and A. McBeath. 2015. “The Pyrogenic Carbon Cycle.” Annual Review of Earth and Planetary Sciences 43 (1): 273–298. doi:10.1146/annurev-earth-060614-105038.
- Dong, X., G. Li, Q. Lin, and X. Zhao. 2017. “Quantity and Quality Changes of Biochar Aged for 5 years in Soil under Field Conditions.” CATENA 159: 136–143. doi:10.1016/j.catena.2017.08.008.
- Elmquist, M., Ö. Gustafsson, and P. Andersson. 2004. “Quantification of Sedimentary Black Carbon Using the Chemothermal Oxidation Method: An Evaluation of Ex Situ Pretreatments and Standard Additions Approaches.” Limnology and Oceanography-Methods 2 (12): 417–427. doi:10.4319/lom.2004.2.417.
- Elmquist, M., G. Cornelissen, Z. Kukulska, and Ö. Gustafsson. 2006. “Distinct Oxidative Stabilities of Char versus Soot Black Carbon: Implications for Quantification and Environmental Recalcitrance.” Global Biogeochemical Cycles 20 (2): GB2009. doi:10.1029/2005GB002629.
- Elmquist, M., I. Semiletov, L. Guo, and Ö. Gustafsson. 2008. “Pan-Arctic Patterns in Black Carbon Sources and Fluvial Discharges Deduced from Radiocarbon and PAH Source Apportionment Markers in Estuarine Surface Sediments.” Global Biogeochemical Cycles 22 (2): GB2018. doi:10.1029/2007gb002994.
- FAO. 2001. “Lecture Notes on the Major Soils of the World.” In World Soil Resources Reports, 94, edited by P. Driessen, J. Deckers, O. Spaargaren, and F. Nachtergaele, pp. 334. Rome, Italy:FAO. Accessed 2 March 2020. http://www.fao.org/3/a-y1899e.pdf.
- Gustafsson, Ö., F. Haghseta, C. Chan, J. MacFarlane, and P. M. Gschwend. 1997. “Quantification of the Dilute Sedimentary Soot Phase: Implications for PAH Speciation and Bioavailability.” Environmental Science & Technology 31 (1): 203–209. doi:10.1021/es960317s.
- Hammes, K., M. W. I. Schmidt, R. J. Smernik, L. A. Currie, W. P. Ball, T. H. Nguyen, P. Louchouarn, et al. 2007. “Comparison of Quantification Methods to Measure Fire-derived (Black/elemental) Carbon in Soils and Sediments Using Reference Materials from Soil, Water, Sediment and the Atmosphere.” Global Biogeochemical Cycles 21 (3): GB3016. doi:10.1029/2006GB002914.
- Henmi, T., and K. Wada. 1974. “Surface Acidity of Imogolite and Allophane.” Clay Minerals 10 (4): 231–245. doi:10.1180/claymin.1974.010.4.02.
- Ikeya, K., R. L. Sleighter, P. G. Hatcher, and A. Watanabe. 2015. “Characterization of the Chemical Composition of Soil Humic Acids Using Fourier Transform Ion Cyclotron Resonance Mass Spectrometry.” Geochimica Et Cosmochimica Acta 153: 169–182. doi:10.1016/j.gca.2015.01.002.
- Kerré, B., C. T. Bravo, J. Leifeld, G. Cornelissen, and E. Smolders. 2016. “Historical Soil Amendment with Charcoal Increases Sequestration of Non-charcoal Carbon: A Comparison among Methods of Black Carbon Quantification.” European Journal of Soil Science 67 (3): 324–331. doi:10.1111/ejss.12338.
- Kuo, L.-J., B. E. Herbert, and P. Louchouarn. 2008. “Can Levoglucosan Be Used to Characterize and Quantify Char/charcoal Black Carbon in Environmental Media?.” Organic Geochemistry 39 (10): 1466–1478. doi:10.1016/j.orggeochem.2008.04.026.
- Lehmann, J. 2007. “Bio-energy in the Black.” Frontiers in Ecology and the Environment 5 (7): 381–387. doi:10.1890/1540-9295(2007)5[381:BITB]2.0.CO;2.
- Lim, B., and H. Cachier. 1996. “Determination of Black Carbon by Chemical Oxidation and Thermal Treatment in Recent Marine and Lake Sediments and Cretaceous-Tertiary Clays.” Chemical Geology 131 (1–4): 143–154. doi:10.1016/0009-2541(96)00031-9.
- Lohmann, R., K. Bollinger, M. Cantwell, J. Feichter, I. Fischer-Bruns, and M. Zabel. 2009. “Fluxes of Soot Black Carbon to South Atlantic Sediments.” Global Biogeochemical Cycles 23 (1): GB1015. doi:10.1029/2008gb003253.
- Murano, H., T. Otani, T. Makino, N. Seike, and M. Sakai. 2009. “Effects of Application of Carbonaceous Adsorbents on Pumpkin (Cucurbita Maxima) Uptake of Heptachlor Epoxide in Soil.” Soil Science and Plant Nutrition 55 (2): 325–332. doi:10.1111/j.1747-0765.2009.00361.x.
- Myneni, S. C. B. 2019. “Chemistry of Natural Organic Matter-the Next Step: Commentary on a Humic Substances Debate.” Journal of Environmental Quality 48 (2): 233–235. doi:10.2134/jeq2019.02.0002c.
- Nanzyo, M., R. Dahlgren, and S. Shoji. 1993. “Chapter 6 Chemical Characteristics of Volcanic Ash Soils.” In Developments in Soil Science, edited by S. Shoji, M. Nanzyo, and R. Dahlgren, 145–187. Amsterdam, Netherlands: Elsevier. doi:10.1016/S0166-2481(08)70267-8.
- Ottmar, R. D. 2014. “Wildland Fire Emissions, Carbon, and Climate: Modeling Fuel Consumption.” Forest Ecology and Management 317: 41–50. doi:10.1016/j.foreco.2013.06.010.
- Qi, F., S. Kuppusamy, R. Naidu, N. S. Bolan, Y. S. Ok, D. Lamb, Y. Li, L. Yu, K. T. Semple, and H. Wang. 2017. “Pyrogenic Carbon and Its Role in Contaminant Immobilization in Soils.” Critical Reviews in Environmental Science and Technology 47 (10): 795–876. doi:10.1080/10643389.2017.1328918.
- Reisser, M., R. S. Purves, M. W. I. Schmidt, and S. Abiven. 2016. “Pyrogenic Carbon in Soils: A Literature-based Inventory and A Global Estimation of Its Content in Soil Organic Carbon and Stocks.” Frontiers in Earth Science 4: 80. doi:10.3389/feart.2016.00080.
- Salvadó, J. A., L. Bröder, A. Andersson, I. P. Semiletov, and Ö. Gustafsson. 2017. “Release of Black Carbon from Thawing Permafrost Estimated by Sequestration Fluxes in the East Siberian Arctic Shelf Recipient.” Global Biogeochemical Cycles 31 (10): 1501–1515. doi:10.1002/2017gb005693.
- Sánchez-García, L., I. Cato, and Ö. Gustafsson. 2012. “The Sequestration Sink of Soot Black Carbon in the Northern European Shelf Sediments.” Global Biogeochem. Cycles 26 (1): GB1001. doi:10.1029/2010gb003956.
- Santín, C., S. H. Doerr, A. Merino, T. D. Bucheli, R. Bryant, P. Ascough, X. Gao, and C. A. Masiello. 2017. “Carbon Sequestration Potential and Physicochemical Properties Differ between Wildfire Charcoals and Slow-pyrolysis Biochars.” Scientific Reports 7 (1): 11233. doi:10.1038/s41598-017-10455-2.
- Santín, C., S. H. Doerr, E. S. Kane, C. A. Masiello, M. Ohlson, J. M. De La Rosa, C. M. Preston, and T. Dittmar. 2016. “Towards a Global Assessment of Pyrogenic Carbon from Vegetation Fires.” Global Change Biology 22 (1): 76–91. doi:10.1111/gcb.12985.
- Schmidt, H.-P., A. Anca-Couce, N. Hagemann, C. Werner, D. Gerten, W. Lucht, and C. Kammann. 2019. “Pyrogenic Carbon Capture and Storage.” GCB Bioenergy 11 (4): 573–591. doi:10.1111/gcbb.12553.
- Schmidt, M. W. I. 2007. “Potentially Interfering Materials: Melanoidin.” Accessed 20 January 2015. http://www.geo.uzh.ch/microsite/bc/web-content/HTML%20pages/referencematerials/interfere.html.
- Seiter, K., C. Hensen, J. Schröter, and M. Zabel. 2004. “Organic Carbon Content in Surface Sediments—defining Regional Provinces.” Deep Sea Research Part I: Oceanographic Research Papers 51 (12): 2001–2026. doi:10.1016/j.dsr.2004.06.014.
- Soma, Y., and M. Soma. 1989. “Chemical Reactions of Organic Compounds on Clay Surfaces.” Environmental Health Perspectives 83: 205–214. doi:10.1289/ehp.8983205.
- Spokas, K. A., K. B. Cantrell, J. M. Novak, D. W. Archer, J. A. Ippolito, H. P. Collins, A. A. Boateng, et al. 2012. “Biochar: A Synthesis of Its Agronomic Impact beyond Carbon Sequestration.” Journal of Environmental Quality 41 (4): 973–989. doi:10.2134/jeq2011.0069.
- Wang, C. 2004. “A Modeling Study on the Climate Impacts of Black Carbon Aerosols.” Journal of Geophysical Research, [Atmospheres] 109 (D3): D03106. doi:10.1029/2003jd004084.
- Zhang, X., H. Wang, L. He, K. Lu, A. Sarmah, J. Li, N. S. Bolan, J. Pei, and H. Huang. 2013. “Using Biochar for Remediation of Soils Contaminated with Heavy Metals and Organic Pollutants.” Environmental Science and Pollution Research 20 (12): 8472–8483. doi:10.1007/s11356-013-1659-0.
- Zhu, M., M. Li, S. Wei, J. Song, J. Hu, W. Jia, and P. Peng. 2019. “Evaluation of a Dichromate Oxidation Method for the Isolation and Quantification of Black Carbon in Ancient Geological Samples.” Organic Geochemistry 133: 20–31. doi:10.1016/j.orggeochem.2019.03.009.
- Zimmerman, A. R., and S. Mitra. 2017. “Trial by Fire: On the Terminology and Methods Used in Pyrogenic Organic Carbon Research.” Frontiers in Earth Science 5: 95. doi:10.3389/feart.2017.00095.