
 ?Mathematical formulae have been encoded as MathML and are displayed in this HTML version using MathJax in order to improve their display. Uncheck the box to turn MathJax off. This feature requires Javascript. Click on a formula to zoom.
Abstract
The objective of this research work was, to study the level of stickiness and type of sugars found on commercially grown cotton varieties (Gossypium hirsutum L.), collected before and after saw ginning. To identify the types of sugars in the sticky deposits collected from the H2SD aluminum foil, it was assayed with high performance liquid chromatography. Trehalulose was found as the dominant sugar from the Tendaho cotton growing area which demonstrates insect’s honeydew contamination in this growing area. Finally, FTIR was used to investigate the nature of infrared radiation absorption between trehalulose contaminated and non-contaminated cottons. Cotton samples for the FTIR study, were selected based on their high-speed stickiness detector readings and sugar content as determined by high performance liquid chromatography. The principal component analysis of FTIR spectra permitted to discriminate between trehalulose contaminated and non-contaminated cottons. Trehalulose was responsible for creating sticky residue.
KEYWORDS:
Introduction
Stickiness is a type of contamination of cotton fibres caused by excess sugars on the lint. The source of stickiness can be the plant itself (physiological sugars) or from the feeding insects such as whitefly Bemisia tabaci (Gennadius) and aphid Aphis gossypii (Glover), Hequet et al. (Citation2005). Stickiness causes severe losses to cotton growers and textile industry. Because, it can be a problem during mechanical harvest with stripper or spindle pickers, Brashears and Baker (Citation2000) and during cotton ginning, Khalifa and Gameel (Citation1982), Carlson and Mohamed (Citation1986). Physiological plant sugars, primarily sucrose, that normally appear in mature cotton fiber are evenly distributed within the lint and generally do not cause stickiness (Elsner et al., Citation1983).
As shown by the International Textile Manufacturers Federation (ITMF) cotton contamination surveys which covered the period 2005-2016, the average degree of contamination with stickiness of the world production was 18.83%, with a minimum of 16% in 2009 and 2016 and a maximum of 23% in 2013 (International Textile Manufacturers Federation (ITMF), Citation2016). When compared to the year 2016, stickiness remains nearly constant in the year 2019 (i.e. 16% in 2016 vs. 15.7% in 2019), (International Textile Manufacturers Federation (ITMF), Citation2020). This reveals that, stickiness remains a worldwide contamination problem.
To growers, stickiness means higher costs for insect control and reduced cotton marketability. To ginners, stickiness may mean special handling and processing requirements. At the textile mill, stickiness means reduced processing efficiency, lower yarn quality, and in severe cases total shutdown, Ellsworth et al. (Citation1999).
Many valuable research works, (Abidi & Hequet, Citation2004; Abidi & Hequet, Citation2007; Abidi, Citation2007), have been conducted to instrumentally characterize the level of stickiness found on commercial cottons and the type of sugars suspected to contaminate textile machines with sticky residues.
Instrumental characterization of fibrous faults as well as amount and properties of foreign matters constituents in commercial cottons, will help to maintain specified levels of operation efficiency and product quality (Tesema & Drieling, Citation2019).
Most of the stickiness measuring techniques can be divided into: chemical methods (Perkins, Fehling, Color reaction, KOTITI, HPLC and GC), physical (Infra-red), Mechanical (Mini-card), Thermo-mechanical (SCT, H2SD, FCT/FQT, Quickspin), (Gourlot et al., Citation2016; Gourlot et al., Citation2020). These testing instruments are used particularly to measure level of stickiness and/or type of sugars.
Recently, there is an approach to introduce a single comprehensive instrument which can measure main fibre constraints including stickiness (e.g. Mesdan CONTEST® and Loepfe LabMaster FIBERMAP®).
Both instruments, integrates the stickiness tester with other measurements, such as Micronaire, Maturity ratio, Fineness (calculated), Neps count and size, Seed coat count and size, Trash count and size, (Meier, Citation2018).
In addition, to these properties, relevant for processing, Loepfe LabMaster® measures all the parameters that are required for cotton classification, such as: bundle length, elongation, colour and trash.
A number of valuable studies that primarily attempted to examine the presence of stickiness on the commercial bales are presented below:
Anthony (Citation2000) used sample cotton bales and provide two models of Stoneville Stickiness Tester (SST) which is a direct contact and non-destructive method using near infrared spectroscopy and electrical resistance to independently measure moisture and predict stickiness for ginned cotton.
Frydrych et al. (Citation2000) studied sticky cotton effects on the carded spinning process. They used samples from 26 bales of cotton of different grades. The study provided several important results concerning carded spinning.
Hequet and Abidi (Citation2002) studied the effect of temperature settings and relative humidity on the result of high-speed stickiness detector measurement. Researchers selected 150 commercial bales representing a wide range of stickiness and types of contamination from whiteflies, aphids, and physiological sugars.
Chun investigates (Chun, Citation2002) the relationship between cotton stickiness and cotton dust potential. The researcher used the lint cotton samples sent to the cotton quality research station representing major domestic growing areas of USA.
Meier (Meier, Citation2018), using the latest laboratory testing instruments (Mesdan CONTEST® and Loepfe LabMaster FIBERMAP®), evaluated the stickiness of three lint cotton types (Type A, Type B, Type C) using the first stickiness round trial samples organized by the stickiness task force of the ITMF-ICCTM, 2017. The researcher stated that the instrument-to-instrument variation lies within the natural variation of the stickiness.
Most of the above reviewed investigations, focused to study the level of stickiness in commercial bales (after ginning). However, due to the extraction and distribution of stickiness during the process of ginning, it is difficult to understand the grade and level of stickiness in the seed cotton and further to draw a proper inference with the stickiness in the lint cotton.
A recent guideline issued by, ITMF international committee on cotton testing methods (ICCTM) and by ICAC task force on commercial standardization of instrument testing of cotton (CSITC), also mentioned that, nowadays, stickiness characterization is made on fibre samples, which only can be taken after the ginning operations. Therefore, no ‘predictive’ measurement can be done from seed-cotton samples to predict seed-cotton processing at the gin in the stickiness dimension (ITMF-ICCTM, 2020).
The current study aims to instrumentally characterize the level of stickiness present in the seed (before ginning) and lint (after ginning) commercial cottons collected from nine farm places. The high-speed stickiness detector (H2SD) with hot plate temperature of 53 °C was used to instrumentally characterize the level of stickiness in the studied commercial cottons. The stickiness levels (less than 5 H2SD = non-sticky cotton, 5 to 14 H2SD = light stickiness, 15 to 24 moderate stickiness and above 24 heavy stickiness), adopted from the previous trends of spinning mills, were used as a reference standard, for this study. The effects of ginning and lint cleaning on the level of cotton lint stickiness was also studied. The result will help, the ginneries to optimize the speed and settings of machine parts, and for the spinners to optimize the proportions of cottons to be used in a mix desired to allow a minimum level of stickiness that cannot affect the productivity of spinning machines.
In the study the type of sugars and their composition present on the commercial lint cottons were identified and quantified using high-performance liquid chromatography (HPLC). Fourier transform infrared (FTIR) was also used to investigate the nature of infrared radiation absorption between non-contaminated and trehalulose contaminated cottons.
Materials and methods
In the study, the first experiment was done for evaluating the stickiness properties of seed cottons and the second experiment of the study was done to assess the effect of ginning on cotton stickiness properties by evaluating the stickiness properties of lint cotton after ginning and comparing with the values found prior to ginning. For the after-ginning stickiness testing, the bales were open and two samples per bale were taken. The level of stickiness was tested by SDL high speed stickiness detector (H2SD). In the study, the sugars present on the samples were also identified and quantified using high-performance liquid chromatography (HPLC). FTIR (Fourier Transform Infrared Analysis) were also used to investigate the nature of sugar present in the seed, lint and non-contaminated cotton.
Experiment 1: For evaluating the stickiness properties of seed cotton, samples from nine cotton growing farms, namely: Bonta, Tendaho, Jinka Birala, Middle Awash State Farm (MASF), Warer Agricultural Research Centre (WARC), SODO, Arbaminch, Metama, Humara were collected (Tesema & Drieling, Citation2019).
The major cotton growing regions covered for collecting the samples were: North Ethiopia (Tigray, Amhara & Benishangul Gumuz); North-Central Ethiopia (Upper Awash, Middle Awash & Lower Awash) and South Ethiopia (Oromia, Arba Minch & Gambelia)1 (see ).
Table 1. Particulars of different regions of Ethiopia used for collection of samples (Tesema & Drieling, Citation2019).
Samples were directly collected from the hand-harvested seed cotton modules in the field and/or warehouses before ginning to avoid any mixing between the farm places. Fibres from the seed cotton were later removed by careful hand ginning for conducting the experiments (Tesema & Drieling, Citation2020).
On all the testing instruments: H2SD, HPLC and FTIR, five replications per sample were performed. IBM SPSS statistics-25 software was used to conduct all the statistical analysis. Analysis of variance (ANOVA) at 0.01 level of significancy were conducted to study the effect of ginning and lint cleaning on the level of H2SD seed cotton sticky points. The variation of stickiness between cotton growing areas is also analyzed using ANOVA at 0.01 level of significancy. The same software was used to evaluate the mean, minimum and maximum level of high-performance liquid chromatography (HPLC) sugar contents for the studied cottons from nine growing areas. OriginLab 2019b, 64Bit 9.6.5.169 (Copyright 1991-2019 OriginLab Corporation) software was used to analyze the the nature of infrared radiation absorption between non-contaminated and trehalulose contaminated cottons.
High speed stickiness detector (H2SD) study
The H2SD before ginning stickiness properties was tested with (9 farm places × 3 modules × 10 samples × 5 tests) replications. One technician per every instrument was used throughout the testing days. Since, the stickiness measurement is strongly influenced by moisture (i.e. lower relative humidity, equals lower stickiness detection), all the samples were pre-conditioned at standard atmosphere in compliance with ASTM D1776, “standard practice for conditioning and testing textiles” (temperature, 21 ± 1 °C, relative humidity 65% ± 2% RH) for 24 h. The high-speed stickiness detector (H2SD) hot plate temperature was 53 °C.
Experiment 2: It was done to assess effect of ginning on the cotton stickiness property. From the same farm places used to evaluate seed cotton properties, the amount required for ginning was transported using module trucks to the ginnery. Samples were ginned under standard commercial conditions at the full-scale gin (7 bales/h) of 217 kg bale. The sequence of ginning machines and protocol used were as it was described by Tesema and Drieling (Citation2020). The commercial bales were harvested in all plantation zones, in 2017. All the testing procedures were the same as those of seed cotton samples testing.
Three commercial cotton bales from one farm place harvested module were selected, a total of 27 bales from harvested modules of all farm places. The H2SD stickiness properties was tested with (9 farm places × 1 ginnery × 3 bales × 2 samples × 5 tests replications) for each instrument. One technician per every instrument was used throughout the testing days.
High performance liquid chromatography (HPLC) study
The type of sugars presents on the lint (ginned cotton) samples comes from the same farm places used to evaluate seed cotton properties, were identified and quantified using high-performance liquid chromatography.
To determine the sugar composition of the sticky deposits, the sticky spots were collected after the image analysis system using wet wipes (Kim wipes EX-L, wetted with distilled water, Kimberly-Clark, GA), stored in plastic bags, and frozen. The sticky deposits coming from three H2SD replications were placed in the same bag.
After completion of the stickiness tests, sugars were extracted from the wipes using 20 ml 18.2-megahom water, and the HPLC tests were conducted using the procedure described below.
Procedures used for identification of sugars present in the lint (Abidi & Hequet, Citation2007):
Cotton samples with a given H2SD sticky points were weighed and placed in plastic bags.
For each sample, 10 g of cotton fibres was placed into a plastic bag, and twenty ml of 18.2-megohm water were added. A sample of the aqueous solution was taken from the bag with a 10 cm3 syringe on which a 0.2-micron filter (nylon membrane polypropylene housing) was attached. A 1.5 ml filtered sample was deposited into the 1.5 ml autosampler vial.
Sugars were separated on the columns (CarboPac PA1 Anion exchange Guard column and two CarboPac PA1 Anion exchange Analytical Columns) in series with a Gradient Eluent system: Eluent 1:200 mM NaOH and Eluent 2:500 mM Sodium Acetate (C3H3NaO2⋅3H2O) and 200 mM NaOH.
The sugar content was calculated from the peak area of known chromatogram standard sugars used to calibrate the HPLC.
Five replications were performed on each sample (9 farm places × 1 Ginnery × 1 bale × 2 samples × 5 replications). The results were expressed in percentage of the fibre weight and in percentage of the total sugars.
UATR-FTIR micro-spectroscopy study
For FTIR analysis, cotton samples were placed on top of the ZnSe-Diamond crystal. Pressure was applied, using the two captive thumbscrews, to the sample to ensure a good contact between the sample and incident IR beam and to prevent loss of the IR beam. The ZnSe-Diamond crystal being small, and in order to represent the inherent variability of the honeydew droplets distribution on the lint, thirty FTIR spectra were collected from each sample at a spectrum resolution of 4 cm−1, with 32 co-added scans, over the range of 650-4000 cm−1. A background scan of clean ZnSe-Diamond crystal was acquired before acquiring the spectra of the sample.
Results and discussion
H2SD analysis on the level of stickiness
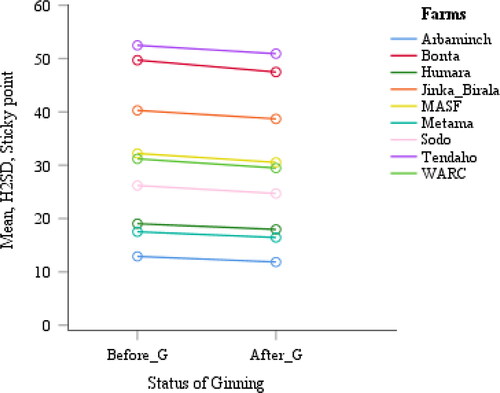
For the studied cottons from nine cotton growing farms, the “before ginning stickiness profiles” as measured by high-speed stickiness detector (H2SD) were diverse. For instance, the cotton from Tendaho farm was fairly heavily contaminated with the average value of stickiness 52.5 H2SD sticky points. While, the cotton from Arbaminch farm exhibited low contamination with the mean value of stickiness 6.2 H2SD sticky points (see ). The cottons from Metama and Humara farms also exhibited a very low contamination, following the Arbaminch, with the mean value of stickiness 8.1 and 10.0, respectively.
Table 2. H2SD, Sticky points: before ginning.
As expected, the “after ginning stickiness profiles”, on the studied cottons from nine cotton growing farms showed the decrease in H2SD cotton stickiness level.
The after ginning H2SD stickiness level differences between the farms keeps the order of decrease, as it was, before the application of ginning (see ).
Table 3. H2SD, Sticky points: After Ginning.
That means, order of farms in stickiness level before ginning (e.g. Tendaho, Bonta, Jinka_Birala, etc.) remains the same after ginning. After the treatment of ginning, Tendaho remains fairly heavily contaminated with the average value of 51.3 H2SD sticky points, and Bonta keeps its second position with the average value of 47.9 H2SD sticky points. Other farms also take the ranks from 3rd to 9th.
One of the reasons for the after-ginning decrease in H2SD stickiness level could be, the use two stages saw cylinder lint cleaners. In this type of lint cleaners, the teeth of the saw cylinder convey the fibres past several (5 to 9) cleaning points commonly referred to us grid bars, that are spaced 0.76 mm. to 1.52 mm. away from the saw teeth. Good fibres as well as undesirable foreign materials are ejected at each of these grid bars or cleaning points.
As we can see from the during the process of lint cleaning, the probability of removal of some sticky fibres from the mass of cotton is very high. The detached cotton contaminants (including sticky matters) escaped through the grid bars into the waste box.
Figure 1. Cross-section of Lummus SentinelTM lint cleaner (Left). The process of lint cleaning by beating the tufts against the grid bars (Right).
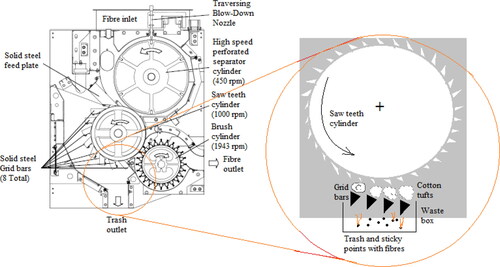
The ginning process may also scatter the honeydew, making it more difficult to be detected by visual inspection (Hequet & Frydrych, Citation1992).
From the ANOVA , it is observed that the ginning treatment results in H2SD sticky points variation but not significant at 0.01 level. Where, the significance of before ginning H2SD sticky points variation against the after-ginning treatment is 0.019 (i.e. p value > 0.01).
Table 4. ANOVA Analysis – Effect of Ginning on H2SD sticky points.
Whereas, it is observed that the before and after ginning H2SD sticky points variation between the growing areas were significant at 0.01 level (see ).
Table 5. ANOVA Analysis - H2SD stickiness variations between growing areas.
H2SD_BG, (H2SD Sticky points before ginning); H2SD_AG, (H2SD Sticky points after ginning)
This is also clearly shown in the line plots of mean stickiness values, (see ), of H2SD, before and after the application of ginning. The ginning treatment with lint cleaner changed the H2SD stickiness level of studied cottons.
Figure 2. Mean H2SD stickiness points befor and after ginning.
The found, before ginning (seed cotton) H2SD sticky points, result is an indicator for the level of stickiness in the raw cotton. Based on the raw cotton stickiness result, the ginneries can optimize the number of lint cleaners (if there is a bypass), setting between the grid bars and saw cylinder, and speed of saw cylinder.
After ginning (lint cotton) H2SD sticky points result, could help the spinners for their mixing cost optimization.
HPLC analysis of honeydew deposits collected from H2SD
Wet wipes were used to remove sticky deposits from the aluminum foil after they were analysed by the H2SD system. Sugars from the wet wipes were then extracted and analysed by HPLC. As a control, HPLC analyses were performed on clean aluminum foil wiped with wet Kim wipes. The HPLC profiles of the control did not show any significant peaks. Thus, all peaks shown in the chromatograms of the extracts are not due to an external source of contamination, i.e. wipes or aluminum but the peaks variation lies within the natural variation of the sugar types in the sticky deposits.
Examination of and , reveals that the percent out of total sugars of trehalulose and melezitose in Bonta, (trehalulose:24.0% and melezitose: 23%) and Tendaho (trehalulose:41% and melezitose: 13%), growing areas were relatively higher than the level of sucrose in these regions. Sucrose in Bonta was 4% and in Tendaho it was 1%.
Figure 3. HPLC: (% fibre weight).
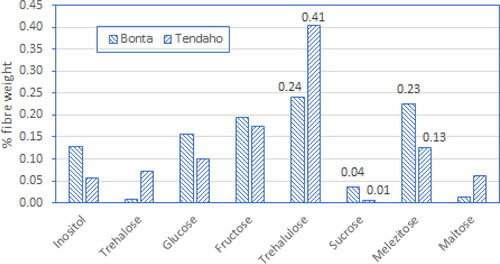
Table 6. Sugar contents, measured by high-performance liquid chromatography for the nine cotton growing areas, expressed as a percentage of the fiber weight.
As shown in and , the HPLC total sugars (expressed as a percentage of the total sugar) in Bonta was, 15% trehalulose and 22% melezitose. While, in Tendaho, it was 24% trehalulose and 14% melezitose. The level of sucrose in Bonta and Tendaho were in small amount when compared to the level of trehalulose and melezitose. Sucrose in Bonta was only 2.9% and in Tendaho it was 1.3%.
Figure 4. HPLC: (% total sugars).
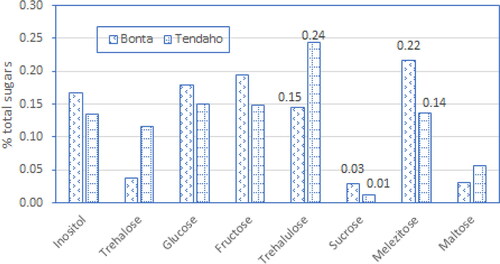
Table 7. Sugar contents, measured by high-performance liquid chromatography for the nine cotton growing areas, expressed as a percentage of the total sugars.
All tables and figures demonstrate that melezitose was the dominant sugar in Bonta while trehalulose was the dominant sugar in Tendaho.
Sucrose is virtually the only sugar in the phloem sap of the cotton plant (Hendrix et al., Citation1992). Insects produce trehalulose and melezitose by isomerization and polymerization of sucrose;
Formula 1. Example of sucrose isomerization catalyzed by isomaltulose synthase.
Where, G – Glucose, F – Fructose, S – Sucrose, M – Isomaltulose, T - Trehalulose
Inosit, (inositol); Tre, (trehalose); Glu, (glucose); Fru, (fructose); Trehal, (trehalulose); Suc, (Sucrose); Mel, (melezitose); Mal, (maltose)
The most abundant sugar in silverleaf whitefly (Bemisia argentifolii) honeydew is the disaccharide trehalulose, an oligomer of sucrose. Whereas, cotton aphid (Aphis gossypii) honeydew contains only trace amount of trehalulose but it contains large amount of trisaccharide melezitose. Neither of these sugars occur in the cotton plant (Hendrix, Citation1999). Therefore, their presence (in dominant amount) on the studied Bonta and Tendaho cotton lint (see and ) demonstrates insect’s honeydew contamination. In all other studied regions, the presence of trehalulose and melezitose were not dominant (see ). In (when sugar contents expressed as a percentage of the total sugar), the level of melezitose were dominant than the other sugars, in all the studied samples (except Bonta and Tendaho). This demonstrates the presence of aphis honeydew in the studied cotton growing areas.
Generally, the amount of insects’ sugars in the rain feed cotton growing areas, such as: Metema, trehalulose (0.3%), melezitose (2.3%) and Humera, trehalulose (0.2%), melezitose (3.2%) showed least stickiness level as compared the major irrigated cotton growing areas such as: Tendaho, trehalulose (40.5%), melezitose (12.5%) and Bonta, trehalulose (24.0%), melezitose (22.5%). This could be because of the classical irrigation system, which would be favourable for the population of insects, but it needs further investigation.
Insects sugars is also relatively less serious problem in the Southern cotton growing areas such as: Sodo, trehalulose (0.3), melezitose (2.9) and Arbaminch, trehalulose (0.4%), melezitose (2.9%).
FTIR spectra principal component analysis
shows the FTIR spectra of non-contaminated lint cotton (NCLC) fibres, non-contaminated seed cotton (NCSC) fibres (after careful removal of the seed by hand) and trehalulose contaminated lint cotton (CLC).
Figure 5. FTIR spectra: Non-contaminated lint cotton (after ginning) (NCLC), non-contaminated seed cotton (before ginning) (NCSC) and contaminated lint cotton (after ginning) (CLC).
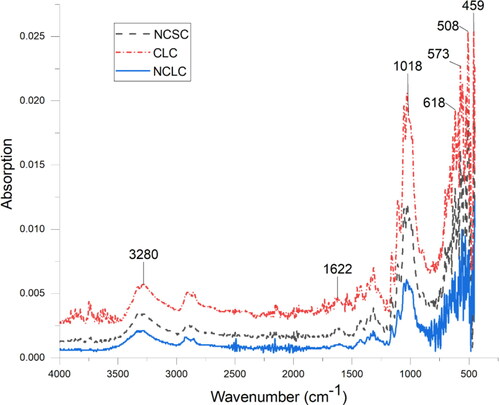
As shown in , the peaks located at 3280, 1622, 1018, 618,573,508,459 are relatively intense in the spectrum of contaminated lint cotton (CLC) from Tendaho growing area. From HPLC results, the sugar type from Tendaho was trehalulose. The combined effect of hygroscopicity and melting temperature on the stickiness properties of trehalulose in the textile machine parts is documented (Abide and Hequet et al., Citation2005). Accordingly, the intensity of FTIR spectra at 3280 and 1018 cm−1 (in other bands too) for the trehalulose contaminated cotton from Tendaho cotton growing area, was due to an increase in the intensity of vibration of these bands.
The combined effect of high hygroscopicity and low melting temperature (48 °C) could explain the higher concentration of trehalulose in the residues of textile equipment than on the original fibre (Hequet & Abidi, Citation2002).
Conclusion
Representative samples of commercial cotton varieties (Gossypium hirsutum L.), from 9 cotton growing areas, contaminated with unknown level of stickiness and unknown type of sugars, were collected and studied.
Some of the conclusions that can be drawn from this study are:
The “before ginning stickiness profiles” as measured by high-speed stickiness detector (H2SD) were diverse. For instance, the cotton from Tendaho farm was fairly heavily contaminated with the mean value of stickiness 52.5 H2SD sticky points. While, the cotton from Arbaminch farm exhibited low contamination with the mean value of stickiness 6.2 H2SD sticky points. The cottons from Metama and Humara farms also exhibited low contamination, following the Arbaminch, with the mean value of stickiness 8.1 and 10.0, respectively. Even though, the effect of ginning and lint cleaning on stickiness level were not significant at 0.01 level of significancy, decrease in amount of H2SD sticky points, were observed. The “after ginning H2SD stickiness level” differences between the farms keeps their order of ranks, as it was, “before the application of ginning”.
The type of sugars was studied using HPLC laboratory testing instrument. The found result demonstrated that the cottons from Bonta and Tendaho farms were particularly contaminated with Trehalulose and Melezitose. Neither of these sugars occur in the cotton plant (Hendrix, Citation1999). Therefore, their presence (in dominant amount) on the studied Bonta and Tendaho cotton lint demonstrates insect’s honeydew contamination. Trehalulose was found as a dominant sugar in Tendaho cotton growing area while Melezitose was a dominant sugar in Bonta cotton growing area.
The variation in the intensity of infrared radiation absorption at FTIR spectra 3280 cm−1 and 1018 cm−1 between non-contaminated and trehalulose contaminated cottons was observed. These peaks are attributed, respectively to, O-H stretching vibration of the water molecules, O-H bending vibration in H2O, and C-O stretching vibration in the primary alcohol (-H2C-OH) in trehalulose contaminated cotton. The intensity of these peaks (also peaks 1018, 618,573,508,459), are strong in the spectra of trehalulose contaminated cotton but weak in the spectra of non-contaminated cotton.
These results demonstrate the usefulness of the FTIR spectra for the analysis of cotton fibre contamination.
Acknowledgements
Author is thankful to the ginnery and farm places in Ethiopia and also farmers’ association of Gondar for their valuable cooperation during the sampling and ginning of the genotypes used in this research work.
Disclosure statement
No potential conflict of interest was reported by the author(s).
Notes
1 The clustering of Regions in the North, North-Central and South Ethiopia is used only for the purpose of categorizing cotton growing areas where samples are collected in this research.
References
- Abidi, N. (2007). Caractérisation de la structure et modification de la surface des macromolécules inorganiques et biologiques: synthèse des travaux. Habilitation à diriger des recherches, Université de Haute Alsace.
- Abidi, N., & Hequet, E. (2004). Analysis of sticky cotton yarn defects by scanning electron microscopy, textile topics 4.
- Abidi, N., & Hequet, E. (2007). Fourier transform infrared analysis of cotton contamination. Textile Research Journal, 77(2), 77–84.
- Anthony, W. S. (2000). Prediction of stickiness of selected cotton samples. Proceedings of the Beltwide Cotton Conference, Volume 2: 1514-1515), National Cotton Council.
- Brashears, A. D., Baker, R. V. (2000). Comparison of finger strippers, Brush roll strippers and spindle Pickers on the Texas high plains. Proceedings of the Beltwide Cotton Conference (Vol. 1, pp. 452–453).
- Carlson, G. A., & Mohamed, A. (1986). Economic analyses of cotton insect control in the Sudan Gezira. Crop Protection, 5(5), 348–354.
- Chun, D. T. W. (2002). The relationship between cotton stickiness and cotton dust potential. Journal of Cotton Science, 6(4), 126-132.
- Ellsworth, P. C., Tronstad, R., Leser, J., Goodell, P. B., Godfrey, L. D., Henneberry, T. J., Hendrix, D., Brushwood, D., Naranjo, S. E., Castle, S., & Nichols, R. L. (1999). Sticky cotton sources and solutions. The University of Arizona, Cooperative Extension. Publication, IPM series No. 13. AZ1156-12/1999
- Elsner, O., Hani, J., & Lubenevskaya, E. (1983). The sugar content in lint of growing bolls. Coton et Fibres Tropicales 38, 223–227.
- Frydrych, R. F., Tamime, O., Jean-Paul, G., & Eric, G. (2000). Sticky cotton effects on the carded spinning process. Proceedings of the Beltwide Cotton Conferences, San-Antonio (Etats-Unis), 4-8 January 2000. Memphis: NCCA, Résumé, p. 1517.
- Gourlot, J.-P., Drieling, A., Qaud, M., Gordon, S., Knowlton, J., Matusiak, M., van der Sluijs, M., Martin, V., Froese, K., & Delhom, C. (2020). Interpretation and use of instrument measured cotton characteristics. A guide by ICAC task force on commercial standardization of instrument testing of cotton (CSITC) and by ITMF international committee on cotton testing methods (ICCTM), version, 1.0, p. 75.
- Gourlot, J.-P., Lassus, S. & Gawrysiak, (2016). International round-test on stickiness measuring methods: New results and proposal for an harmonization step forward. International textile manufacturers federation (ITMF), International cotton committee on testing methods (ICCTM), Stickiness session. 33rd International cotton conference Bremen, March 16-18, 2016. Town Hall of Bremen, Germany.
- Hendrix, D. L. (1999). Sugar composition of cotton aphid and silverleaf whitefly honeydews. In P. Dugger and D. Richter (Eds.), Proceedings Beltwide Cotton Conferences, January 3–7, 1999, Orlando, FL, pp. 47–51. Memphis, TN: National Cotton Council of America.
- Hendrix, D. L., Wei, Y. -A, and Legett, J. E. (1992). Homopteran honeydew sugar composition is determined by both the insect and the plant species. Comp. Biochem. Physiol, 1001B(1/2), 23–27.
- Hequet, E., & Abidi, N. (2002). High-Speed Stickiness Detector Measurement: Effect of Temperature Settings and Relative Humidity. The Journal of Cotton Science, 6, 68–76.
- Hequet, E. F., Abidi, N., & Ethridge, D. (2005). Processing sticky cotton: Effect of stickiness on yarn quality. Textile Research Journal, 75(5), 402–410.
- Hequet, E., Henneberry, T. J., & Nichols, R. L. (2007). Sticky cotton: Causes, effects, and prevention. United States Department of Agriculture, Agricultural Research Service, Technical bulletin. Number 1915
- Hequet, E., & Frydrych, R. (1992). Sticky Cotton from Plant to Yarn. In New Methods to Test Stickiness in Cotton (pp. 3–19). International Cotton Advisory Committee.
- International Textile Manufacturers Federation (ITMF) (2016). Cotton contamination surveys (2005-2016). Wiedingstrasse 9, CH - 8055 Zürich. Web http://www.itmf.org
- International Textile Manufacturers Federation (ITMF) (2020). Cotton contamination surveys (2007•2009•2011•2013•2016•2019). Wiedingstrasse 9, CH - 8055 Zürich. Web http://www.itmf.org
- Khalifa, H., & Gameel, O. L. (1982). Control of cotton stickiness through breeding cultivars resistant to whitefly, Bemisia tabaci (Gene.) infestation. Improvement of oil seed industrial crops by induced mutations (pp. 181–186). IAEA.
- Meier, S. (2018). First experience of the automated stickiness testing with Loeofe FIBERMAP/Mesdan CONTEST. 34th International Cotton Conference, March 21-23, Bremen, Germany.
- Tesema, G. B., & Drieling, A. (2019). Statistical Analysis and Instrumental Characterization of commercial Ethiopian Cotton Varieties. Journal of Textile and Apparel, Technology Management, 11(1)
- Tesema, G. B., & Drieling, A. (2020). Effect of Ginning on Tenacity, Elongation and other Fibre Quality Properties. The Journal of the Textile Institute, 111(3), 326–333. volume