
Abstract
A key issue for geoforensic analysis is the ability to discriminate between geographical locations of close proximity, often with similar underlying geology. This paper addresses the lack of empirical research into the non-mineral components of sediment samples and presents the development of a method of sediment sample characterisation by High Performance Liquid Chromatography (HPLC) utilising the organic components of the sample. A sample preparation method and set of instrument parameters were developed such that the cost of the analysis could be reduced, efficiency increased and the sample amount required for analysis reduced fourfold. The re-developed method allows samples collected from different locations within the same forensically relevant site to be accurately discriminated in this study by both visual examination of the chromatography and the use of multivariate statistics. The results of the HPLC analysis were compared with those obtained by quartz grain surface texture analysis, and HPLC was found to offer better discrimination between the samples in this instance. The results of this study suggest that HPLC has the potential to offer an accurate and practical method of comparing soil samples based on characteristics that are independent of, and therefore complementary to, traditional mineralogical-based geoforensic analyses.
1. Introduction
The application of geological approaches to the investigation of crime has become increasingly established and the value of soil and sediments as a form of physical evidence has been documentedCitation1−4. There has been a focus on discriminating soil/sediment samples from different locations but only recently has the importance of being able to discriminate between crime scenes and alibi sites that are located in close proximity been identified and attention has therefore focused on addressing this aspect of geoforensic investigation. The body of literature addressing the analysis of the mineralogical components of soils is growing, but to date there is a lack of empirical research into the capability of the non-mineral component of soils/sediments to be able to provide discriminatory measures that can indicate provenance. This paper therefore addresses the development of an approach using High Performance Liquid Chromatography (HPLC) to discriminate between sites of close proximity utilising the organic component of the sediment sample.
Soils and sediments are valuable for geoforensic investigations as they are highly transferable and persistentCitation5−8 and present almost ubiquitously on land. The presence of sediments at a wide variety of crime scenes has led to geoforensic analysis being used in a multitude of scenarios to aid crime scene reconstruction, corroborate witness statements or verify suspect alibisCitation9. Trace geoforensic evidence can be used in a predictive manner in order to guide investigators to the location of its source, through the use of databases and maps in combination with expert local knowledgeCitation2,10,11. Alternatively, earth materials can be analysed for the purposes of comparison in order to exclude the possibility of a common source of known and questioned samples.
Due to the complexity of the structure and composition of geoforensic materials, which provide multiple criteria for comparison, there are a number of different ways in which geoforensic trace evidence can be described and classifiedCitation3,6,12–14. Typically, the techniques used to do this have focused on the physical or chemical characteristics of the mineral fraction of soilCitation12−14, and are well established methods within the earth sciences for the purpose of studying the processes and events involved in the formation of the earthCitation13. In the past, geoforensic analyses have been approached in much the same way as traditional geological analyses, arguably without due consideration of the practical and philosophical differences between the forensic and earth sciencesCitation5,15−17. For instance, many geoforensic investigations attempt to associate samples, rather than exclude them, as having a potential common source, which is a more forensically valid approachCitation5,16−18. The sites encountered in forensic casework tend to be closer in proximity than the sites chosen for some geoforensic studies, which often compare samples from geologically distinct sitesCitation19−24. In addition, some of the analytical techniques used can destroy the sample or require homogenisation of the sample. This offers potential for false positive or false negative results since components acquired before, during and after a forensic event can become mixedCitation16−18,Citation24−26. Furthermore, many existing techniques require sample quantities in excess of the materials recovered from items of forensic interest, such as shoes, clothing or vehiclesCitation5,20−22,Citation24,26. It is, therefore, valuable to develop analytical methods that take into account these specific requirements of forensic caseworkCitation27.
In addition to the weathered rock fragments, which currently attract the greatest scrutiny in geoforensic analyses, soil is comprised of biological material, liquid and gaseous componentsCitation28. There is therefore a need for more techniques capable of the analysis of soil components other than the inorganic mineralsCitation12,20. The uppermost layers of soils are rich in organic matterCitation29−30, which comprises living organisms, their intact remains and the organic compounds (molecules which, with very few exceptions, contains carbon-carbon bonds) produced by their decomposition plus any synthetic organic compounds added to the soil, such as agrochemicals or pollutantsCitation31. Analysis of the organic fraction of soils could be particularly beneficial since, in forensic scenarios, it is these uppermost layers of soils that interact with footwear or vehicle tyres most often. There are a number of techniques designed to analyse organic compounds, which are primarily concerned with their separation, identification and quantification, and are capable of handling solid, liquid and gaseous samples. These techniques are well established within forensic science since organic compounds are found in a fibresCitation32, explosivesCitation33−34, accelerantsCitation35, alcoholCitation36−37, drugs and poisonsCitation37−39.
High Performance Liquid Chromatography (HPLC) is a widely used analytical technique, which has been reported to be potentially useful in the analysis of forensic soil samplesCitation20−22,40, however these studies used larger sample sizes than are typically available in forensic analysis and relatively long sample preparation and analysis times, which could be problematic in a casework scenario. The purpose of this study was to develop the sample collection, preparation, analysis and interpretative approaches used in order to assess the feasibility of the use of HPLC for soil analysis in a more forensically relevant context. The re-developed method was intended to be appropriate for comparing trace soil samples for the purposes of excluding crime scene, alibi site and unknown samples. These contextual details are important, since the priorities in civil or environmental forensic cases, those involving bulk samples and those that aim to predict the geographic provenance of a sample are significantly different, as are the considerations required for the robust interpretation of the evidenceCitation5,19,27. Therefore, this paper seeks to address whether it is possible to distinguish groups of trace soil samples obtained from locations that are located in close proximity to one another (and thus forensically relevant to a crime reconstruction) using HPLC analysis for forensic applications.
It is, of course, recommended that forensic evidence is tested with techniques that analyse independent characteristics of the sample in order to provide significance to the conclusions drawnCitation5,16,17. To complement this study into the discriminatory value of the organic components of the soil, analysis of the inorganic fraction of the samples was also undertaken. Quartz grains are highly persistent and abundant in soil samples and analysis of quartz grain surface texture by SEM can be used to reconstruct the geological history of the quartz grains present in soils and sedimentsCitation41. The technique has previously been demonstrated to be highly informative in the investigation of the provenance of geoforensic samplesCitation18,42 and offers a number of advantages in forensic investigations since it requires very small quantities and a simple and non-destructive sample preparation, which aids the interpretation of data derived from samples comprising mixtures of material from different provenancesCitation16. Quartz grain surface texture analysis has been shown to work well in combination with other forensic analytical techniques in previous studiesCitation18,25 and was, therefore, considered a good candidate for use in conjunction with HPLC. The potential for HPLC to add value to geoforensic investigations was assessed by comparing the abilities of both techniques to distinguish between close-proximity sample locations.
2. Methods
2.1. Sample collection
Samples were collected from Brockwell Park in South London (Figure ), a site that represents both potential alibi sites and potential crime scenes. The site contained areas where a person could legitimately come into contact with earth materials, but also contains secluded spaces and thoroughfares, which could provide opportunities for crimes to be committed.
Figure 1. Aerial view of the sampling site.
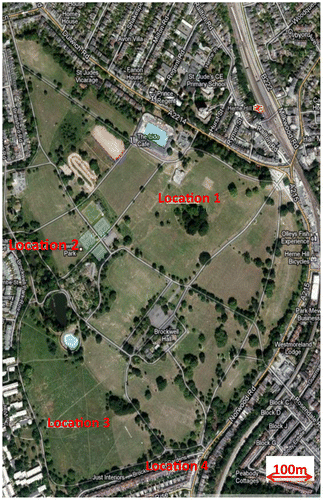
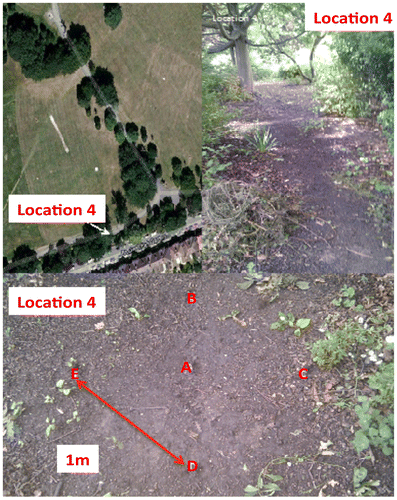
Four locations were chosen within the site: Location 1 was grassland (Figure ), location 2 was wetland (Figure ), location 3 was a wooded area (Figure ) and location 4 was a wild meadow (Figure ). Samples were taken from areas of exposed soil, which were deemed to be easily transferable and therefore forensically relevant. Five samples were collected from each location in order to assess intra-location variability, using the grid suggested for sampling footprints and tyre tracks by PyeCitation43. In accordance with SimmonsCitation44, samples were gathered using a stainless steel spoon, removing any turf or gravel, where present.
Figure 2. Overview of Location 1.
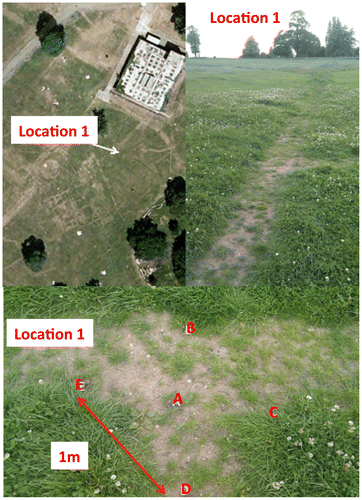
Figure 3. Overview of Location 2.
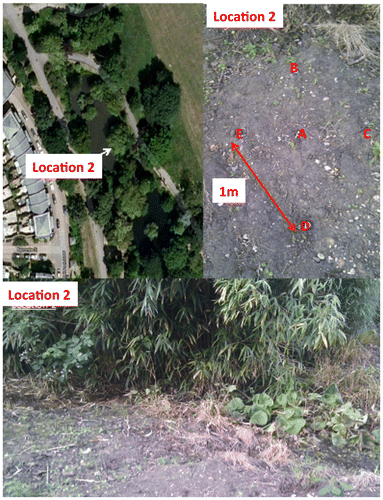
Figure 4. Overview of Location 3.
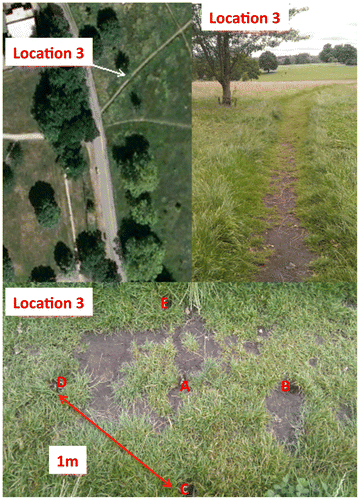
Figure 5. Overview of Location 4.
Samples were stored in individual, uniquely labelled, sealable LDPE (Low-density Polyethylene) bags. In order to prevent cross contamination each sample bag was sealed with adhesive tape and placed in a secondary bag, which was also sealed. Sampling utensils were rinsed with methanol and water then dried with tissue between samples. Each sample was assigned an anonymous identification number by a second analyst, the log cross-referencing identification numbers and their sample position was kept confidential throughout sample preparation and initial data analysis. Samples were stored at –20 °C in order to prevent changes to the organic composition of the samples caused by micro-organisms or thermal degradationCitation2,45.
2.2. Method development
Method development was performed prior to sample anonymisation in order to ensure the resulting sample preparation was generally appropriate for samples taken from each of the four locations.
2.2.1. Sample preparation
The samples were removed from storage and allowed to equilibrate to room temperature. Previous studiesCitation20−22 used a working concentration of 1 g of soil per millilitre (ml) of acetonitrile. This was therefore used as a starting point for method development in this study. Approximately 1 g was weighed into a centrifuge tube and 1 ml acetonitrile was added by pipette. The samples were then mixed and sonicated for 20 min at ambient temperature then centrifuged at 10,000 rpm for 10 min. The supernatant sample solution was transferred to an HPLC vial for analysis. A series of improvements were then made to this method.
Pressure issues were observed during the analysis of these samples, therefore the sample preparation method was modified such that centrifugation was increased to 15 min at 15,000 rpm and the supernatant was passed through a 0.22 μm PTFE syringe filter into the HPLC vial. Improved sensitivity and the use of vial inserts allowed the use of 250 mg of soil and 500 μl acetonitrile
2.2.2. HPLC Conditions
Bommarito et al.Citation20 presented good chromatography results, with well resolved peaks and good signal-to-noise ratios, enabling unambiguous assignment of distinctive peaks, however the method had an unusually long run time (100 min). In light of the reduced budgets of police forces internationally, it is more important than ever to bear in mind the importance of developing analytical techniques that are cost effective and practical for implementation in a commercially oriented laboratory. Longer run times reduce productivity and increase both the hard and soft costs to the laboratory, thereby reducing the likelihood of a technique being implemented by commercial end users and diminishing the ultimate impact of research beyond academia which is a key concern in the forensic science sector. Initial chromatographic conditions were therefore based on the research of Bommarito et al.Citation20 with the aim of optimising the conditions to reduce the analysis time whilst maintaining the ability to retain and resolve a sufficient number of peaks to allow useful and accurate comparisons to be made.
It was not possible to obtain a column of comparable length and particle size to that used by Bommarito et al.Citation20 for this study, therefore a larger column particle size was chosen since column length has the greater impact on retention time. Likewise, while the manufacturer and model of the HPLC instrument can often have subtle effects on retention time, peak shape and resolution, it was not feasible to use a Dionex HPLC system for this study.
2.2.2.1. Replication of Bommarito et al.Citation20
The HPLC system (a Shimadzu VP series), comprised an SIL-10AD autosampler with cooling tray, a FCV-10AL solvent mixing system, a DGU-14A vacuum degasser, a SCL-10A control unit, a SPD-M10A diode array detector and a CTO-10AS column oven. The column was a Whatman Partasil 10 ODS analytical column (10 μm particle size, C18 packing material, column dimensions 250 × 4.6 mm), which was held at 25 °C. The detector collected spectra from 190–800 nm with monitoring at 254 nm. Samples from points 1A, 2A, 3A, and 4A were injected into the HPLC system and eluted isocratically at 1 ml/min for 100 min. The mobile phase used was 65% acetonitrile 35% water, the injection volume was 10 μl and samples were held at 10 °C during analysis to minimise sample degradation.
2.2.2.2. Optimisation of HPLC conditions
A series of mobile phase gradients were used to determine the optimal conditions for separation of the samples’ components. In addition, the injection volume was increased to allow the sample concentration to be reduced. Sample 4A was injected using the parameters detailed in Table , all other instrument parameters remained the same as outlined in Section 2.2.2.1.
Table 1. Summary of HPLC parameters tested.
2.3. Solution stability
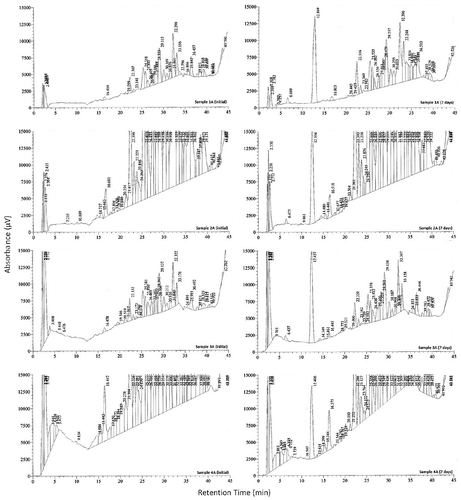
It was important for both the validation of an HPLC method, and its forensic application, to determine the length of time a prepared sample can be stored without significant changes to the obtained chromatography. Samples 1A, 2A, 3A and 4A were prepared using the optimised method detailed in Section 2.2.1 and injected using Gradient 6 (Section 2.2.2.2). After storage at 2–8 °C for seven days samples were re-injected.
2.4. Spatial variability of soil chromatographic profiles
2.4.1. Chromatographic profiles
Anonymised samples were prepared according to the optimised method (Section 2.2.1) and injected using Gradient 6 (Section 2.2.2.2).
2.4.2. Quartz grain surface texture analysis
Approximately 5 g of each sample was allowed to equilibrate to ambient conditions, and was then washed with deionised water until no further organic matter was visible adhering to the mineral grains. The remaining, inorganic fraction was transferred to a watch glass and allowed to dry. The samples were viewed under a binocular microscope (Nikon 10×/23) and 50 quartz grains were removed with forceps and placed onto a Scanning Electron Microscope (SEM) stub covered with double-sided adhesive tape. The SEM stubs were then sputter coated with gold and examined by SEM (Cambridge Instruments Stereoscan 90 at 5 keV).
3. Results
3.1. HPLC conditions
3.1.1. Replication of Bommarito et al.Citation20
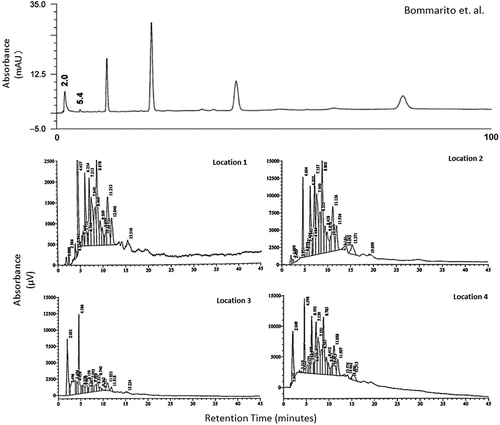
The chromatography obtained by Bommarito et al.Citation20 could not be replicated for this study, as shown in Figure . The results obtained in this study exhibited many more peaks, each of which exhibited poor retention and resolution with respect to those of Bommarito et al.Citation20 This may be a result of differences between the bulk soil characteristics, such as the proportion of organic matter present in the soils at the sample locations used in this study and in those studied by Bommarito et al.Citation20.
Figure 6. Chromatography obtained by Bommarito et al.Citation20 and using the same instrument parameters for samples collected at each location in Brockwell Park.
3.1.2. Optimisation of HPLC conditions
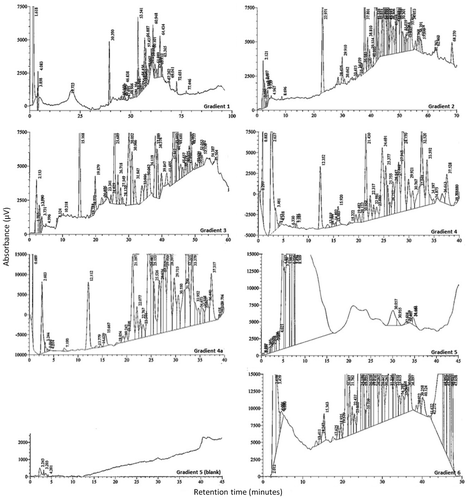
The successive changes to the mobile phase composition detailed in Section 2.2.2.2 (Gradients 1–4) reduced the run time, improved the shape of the baseline and separation of peaks, revealing additional sample components (see Figure ). Peaks were carried over from one sample to the next (Gradient 5 Blank). The addition of a wash step caused interferences in the subsequent chromatogram (Gradient 5) which were removed by the addition of a column conditioning step (Gradient 6).
Figure 7. Summary of the changes in chromatography observed for sample 4A with the instrument parameters detailed in Table
3.2. Solution stability
Solutions were not stable when refrigerated for 7 days, as shown in Figure . Chromatograms of sample solutions from each location showed qualitative and quantitative changes upon storage, most notably through the appearance of additional peaks with retention times around 6 min and 12 min, and changes in relative peak sizes. The composition of the samples were substantially altered in solution and these effects were not consistent across all sample locations. Newly formed compounds accounted for 18.8, 3.9, 16.9 and 4.5% of the total sample for samples 1A, 2A, 3A and 4A, respectively. The relative changes in area for the peaks eluting at around 16 min were 24.0%, –26.8%, 21.6% and –36.9% for samples 1A, 2A, 3A and 4A, respectively.
Figure 8. Solution stability for samples from each sample location after 7 days refrigeration.
3.3. Spatial variability of soil
3.3.1. Chromatographic profiles
3.3.1.1. Plot of sample groups by retention time
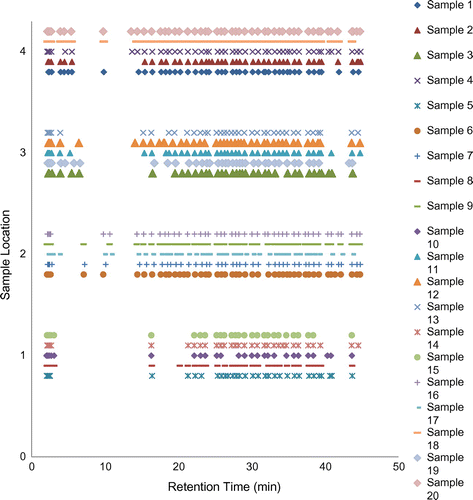
The plot of the observed retention times (Figure ) shows that it is not possible to group samples definitively solely on the basis of the retention times of their constituents. Samples from the same location showed a similar pattern of retention times, however none of the locations displayed a common set of peaks that were entirely distinct from the other location groups.
Figure 9. Plot of sample groups by retention time.
3.3.1.2. Plot of peak apexes
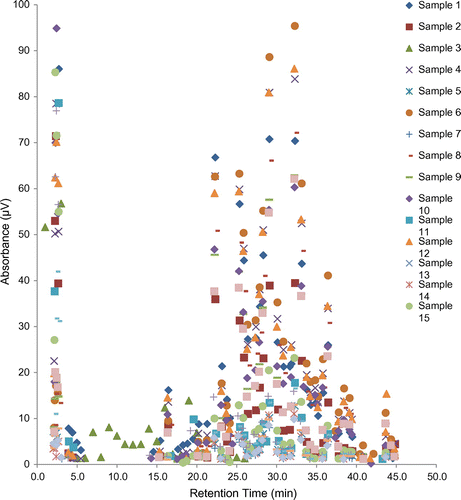
No clear patterns were observable in the data on the basis of the retention time and height of the peak apexes due to the number of samples and peaks, therefore samples could not be grouped on this basis (see Figure ).
Figure 10. Plot of peak apexes.
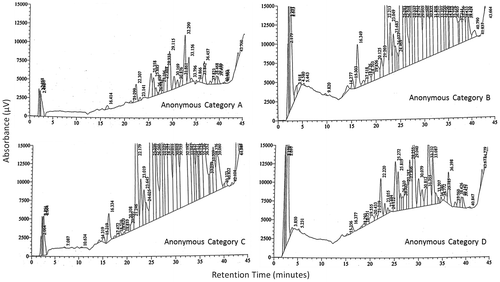
3.3.1.3. Visual comparison of chromatograms
Four distinctive chromatographic profiles were observed upon systematic visual examination of the chromatograms of anonymised samples (Figure ). Combinations of characteristic chromatographic features and groups of peaks were common to samples taken from the same location, which allowed samples to be grouped with 100% accuracy.
Figure 11. Visual comparison of chromatograms.
3.3.1.4. Canonical discriminant function analysis
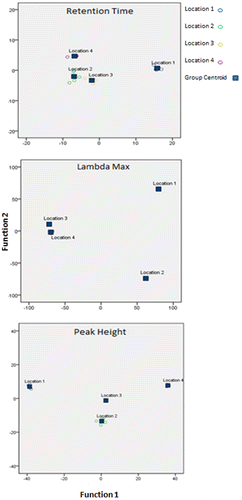
Canonical Discriminant Function Analysis (CDFA), a multivariate statistical technique that has been used in previous geoforensic work to analyse comparable geochemical dataCitation19, was applied to the data (the retention time, λmax, or height of the peaks present in the samples) since it is capable of determining the extent to which a particular variable can discriminate between pre-assigned groups of data, in this case the original sample locations.
The plots of the results of the CDFA analysis (Figure ) show that the intra-location variation of each location was less than the inter-location variation for retention time, λmax and peak height, and that locations 1, 2 and 4 could be discriminated from the other locations by at least one of these variables.
Figure 12. CDFA plots for retention time, λmax and peak height.
3.3.1.4.1. CDFA results for retention time
The results of the CDFA for the retention times of the peaks observed in the samples generated three functions with which to group the samples (see Table ). Functions 1, 2 and 3 accounted for 86.8, 9.3 and 3.9% of the variance between the locations and the discrimination between the groups was found to be significant at the 99% confidence level (p = 0.002 < 0.01), and samples were classified correctly
3.3.1.4.2. CDFA results for λmax
The results of the CDFA for λmax determined two main functions with which to categorise the samples (Table ). Functions 1 and 2 explained 67.1% and 32.9% of the variance between the sample groups respectively, and were significant at the 99% confidence level (p = 0.000 < 0.01), and all samples were classified correctly.
3.3.1.4.3. CDFA for peak height
The results of the CDFA for the peak height of each of the peaks observed determined three functions with which to categorise the samples (Table ). Functions 1, 2 and 3 explained 89.5, 9.3, and 1.2% of the variance between the sample groups respectively, and were significant at the 99% confidence level (p = 0.000 < 0.01). Again, all of the samples were classified correctly with these functions.
3.3.2. Quartz grain surface texture analysis
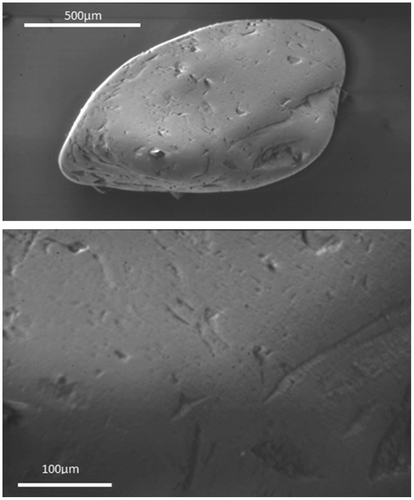
Analysis of the quartz grains revealed the presence of one predominant grain type in all the samples. This quartz grain type was a diagenetic grain with some marine and fluvial indentors with smooth etching on the surfaces. It was possible to distinguish between three ‘sub-types’ of grain within these samples on the degree of roundness (type Ia rounded grain, type Ib subrounded) and the presence of complete grain breakages (type Ic) as shown in Figure . It was also observed that many of the grains analysed were elongated, as shown in Figure .
Figure 13. SEM images of a rounded grain (top), a sub-rounded grain (middle) and a grain displaying complete grain- breakage.
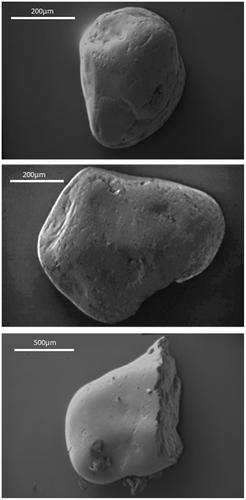
Figure 14. SEM images of an elongated grain (top) and of the observed fracture patterns (bottom).
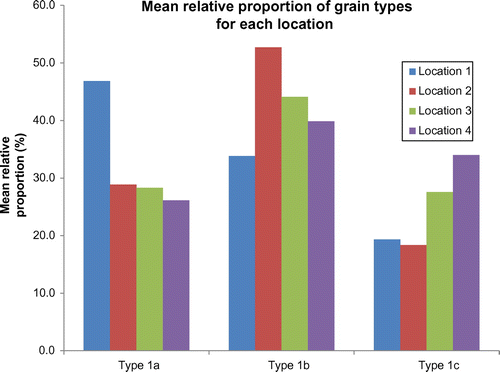
For each sampling location, the 50 grains were classified for each sample (n=5) into sub type and counted, and the mean relative proportions for each grain type present were calculated for comparison of the four different locations. These data are displayed in Table and Figure , respectively.
Figure 15. Mean (n=5) relative proportion of grain types for each location.
4. Discussion
4.1. Method development
4.1.1. Sample preparation
It was possible to simplify the sample preparation method into six steps, eliminating the drying, sieving, evaporation and resolvation steps detailed in previous studiesCitation20−22, which reduced the sample preparation time to 40 min. These changes removed the necessity to homogenise the sample and reduced the risk of thermal degradation and contamination of the samples. In addition, since the sample was prepared in a single vessel, complete recovery of the insoluble sample components was possible, which could allow independent corroborative analyses to be performed on the same sample. Optimisation of instrument parameters improved the sensitivity of the method, allowing the sample amount to be 250 mg, which was far lower than for previous studies. Only one filtration step was required, which reduces the cost of consumables in comparison to previous methods. Given the operational requirements of forensic science services the cost of any newly developed forensic analysis should not be overlooked.
Moisture may account for a large portion of the total sample weight, and may vary between locations. This complicates quantitative comparison of wet samples since the anhydrous sample concentrations are unknown. Further investigation is required to determine the effects of drying samples on the chromatography obtained. Removal of the sieving step raises questions as to the uniformity of the organic content of the samples. Further work to determine the extent of intra-sample variability should be performed as part of the method validation in order to ensure the representativeness of any samples analysed using this methodology.
The sample preparation used for the HPLC did not conflict with the sample preparation requirements for the SEM analysis, provided that the solid pellet separated during the centrifugation step was retained and that a sufficient number of quartz grains could be recovered from the pellet.
4.1.2. HPLC Conditions
4.1.2.1. Replication of Bommarito et al.Citation20
It was not possible to replicate the chromatography obtained in the Bommarito et al.Citation20 study. All of the samples taken from Brockwell Park exhibited poor chromatography with between 20 and 25 peaks eluting within 20 mins (Figure ). The vast majority of peaks were not baseline resolved, which is clearly problematic; not only is there potential for the presence of multiple components with similar retention times to be masked, but it is also difficult to accurately identify peaks with similar retention times. It is likely that the use of a larger stationary phase particle size contributed significantly to the poor resolution obtained for this experiment in comparison with the Bommarito et al.Citation20 study, however, since an identical column was not available it was necessary to redevelop the method to improve separation and reduce the run time.
4.1.2.2. Optimisation of HPLC conditions
Increasing the volume of sample injected onto the system increased the height of the peaks without significantly affecting peak resolution (Figure ). This allowed the sample concentration to be reduced without losing sensitivity, which allowed more forensically relevant sample sizes to be used. It should be noted that the peak responses were generally very weak, but were in line with previous studiesCitation20. Furthermore, only very few peaks were below the limit of detection, defined as the peak response with a signal to noise ratio of 3:1Citation46, which was calculated to be 174 μV.
The use of gradient elution in this study achieved better separation of the components of the samples, with respect to that obtained during the replication of the method conditions of Bommarito et al.Citation20. This allowed an additional 11 peaks to be detected, thereby offering more points for comparison between samples and aiding the assignment of peak identities (Figure ).
It is possible that a great many more compounds were present in the soil samples than were detected in this study, however since this HPLC method is intended to profile, rather than to exhaustively characterise, the sample composition, this does not affect data interpretation. The aim of this method development exercise was to retain and resolve a sufficient number of peaks to allow for any inter-location variability among the components to be detected, allowing simple and accurate comparison of profiles obtained at different locations. While it would of course have been possible to achieve better resolution of a greater number of peaks using a longer analytical run time, given the forensic considerations of this study, a longer run time would represent a compromise in an increased use of resources where accurate discrimination can be achieved with fewer peaks for comparison.
The majority of peaks were eluted with mobile phase composition between 50% and 80% acetonitrile and successive changes to the mobile phase composition reduced the total final run time from 100 min (16) to 50 min (Figure ). Shortening the chromatographic run time is highly important when one considers the fluctuating price and availability of acetonitrile in recent years. The reduction in run time also doubled potential productivity and therefore improved the practicability of the method in light of the increasing commercial pressures faced by the forensic science industry.
4.2. Solution stability
All samples exhibited both qualitative (Figure ) and quantitative changes after 7 days storage in solution at 2–8 °C, and these are outlined in Section 3.2. New peaks formed in all solutions, most notably the large peaks at around 6 min and 12 min. Quantitative changes were observed in the peak eluting at approximately 16 min, the magnitude and direction of which varied between samples. These results suggest that the solutions can be unstable under these conditions and that more detailed stability analyses are required to establish the optimum sample solution storage conditions.
4.3. Spatial variability of soil
As this was a preliminary study, and the identities of the various components in the chromatograms were unknown, it was not possible to use a certified reference standard to quantify the peaks, especially as the relative response factors between the standard material and the unknown compounds present in the samples were also unknown. Furthermore, the retention times of the compounds in the samples could not be known prior to running this analysis, therefore it was not possible to select an appropriate internal standard for this experiment, since any compound added to the samples may have co-eluted with the compounds of interest, masking useful marker peaks. In order to account for differences in the absolute concentration of the samples and therefore allow for direct comparisons of peak heights between samples, the height of each peak was standardised to the theoretical peak height of a 500 mg/ml solution prior to data analysis, for instance the peak heights in samples prepared at 508 mg/ml were adjusted by a factor of 0.984, those samples prepared at 493 mg/ml were adjusted by a factor of 1.014, and so on.
4.3.1. Chromatographic profiles
Since pre- syn- and post-forensic event mixing and sample degradation can affect relative peak heights, soil obtained from known locations should, ideally, be grouped together on the basis of peak retention time, and the sets of peaks present in each group should be distinct from one another. Figure shows that each location displayed internal variability in terms of the number and retention time of peaks present, therefore it was not possible to categorise samples in absolute terms on this basis. The retention time and height of all peaks above the limit of detection (LOD) were plotted for the anonymised samples (Figure ).
The height of each peak was adjusted to account for differences in sample concentration, however the number of peaks and the complexity of the chromatographic profiles obtained meant that it was not possible to discriminate sample locations in this manner. It is possible that inherent variations in the pump and detector efficiency of the HPLC could have led to inter-sample variations in peak retention times and heights. This could be remedied through the addition of an internal standard to future sample preparations to improve the accuracy of data interpretation.
4.3.1.1. Visual examination
Systematic visual inspection of the samples’ chromatographic profiles resulted in the correct grouping of all samples (Figure , Table ). The criteria used to assign samples to groups are detailed in Table . It is encouraging that classification of such complex data to such a high degree of accuracy was possible, particularly in a blind trial. As with other techniques, which however require detailed visual examination by an analyst, the classification process was very time consuming, which would need to be taken into account when considering the practicality of this approach for data analysis in routine forensic analyses.
Table 2. Classification of samples by visual comparison of chromatograms.
This visual inspection process was, naturally, subjective; the definition of ‘major peaks’ (Table ) was informed but technically arbitrary and it was noted that, within Locations 2, 3 and 4, some internal variability in terms of relative peak height and shape was discernible (Figure ). This means that it was not reasonable to apply any statistical treatments to the results in order to assess the significance of the differences between the groups with respect to intra-location variability.
4.3.1.2. CDFA
In order to enable quantitative assessment of the significance of the differences between the sample groups, data were analysed using CDFA based on the retention time, height and λmax for each peak. CDFA classified each sample correctly (100% correct for all three variables), and the results of this analysis, displayed in Tables , show that the discrimination was statistically significant at the 99% significance level (p=0.000) for each type of variable, when the three canonical functions were used together. The CDFA plots (Figure ) show that there is greater inter-location variability in comparison with the intra-location variability for each of the variables, however some locations were distinguished to greater degrees than others using the first two canonical functions. The positions of the Location 1 samples were consistently well separated from all other locations on the CDFA plots for all three types of variable, while the largest separation between the positions of the Location 2 samples and the positions of the nearest sample group (Location 1) was observed when λmax was used, and the best separation displayed on these plots for Location 4 (where the next nearest sample group was Location 3) was when peak height was used for the analysis. On the other hand, none of the CDFA plots displayed the same degree of separation between the positions of the Location 3 samples and the other sample groups; as can be seen in Figure , the Location 3 samples were plotted relatively closely to Locations 2 and 4 for the retention time data, to Location 4 for the λmax data, and to Location 2 for the peak height data. The discriminant analysis also used the third canonical function to separate the groups, which is not displayed on the CDFA plots and provided additional discrimination between the sample groups.
Table 3. CDFA results for retention time.
Table 4. CDFA results for λmax.
Table 5. Results of CDFA for peak height.
It may be possible to improve upon these results with the inclusion of additional λmax values, peak height at a separate wavelength, or additional variables, and future analyses could collect fluorescence data in addition to the UV data used in this study. Further development of the method to ensure compatibility with a mass spectrometry detection method would undoubtedly provide better confidence in the specificity of this HPLC method, if resources permitted, and the increased costs per analysis were acceptable to investigators, however comparison of the UV spectra was considered to be appropriate to the scope of this preliminary study. The clearest differences between the sites that could explain this variability were the nature and extent of vegetative cover (Figures ), the exposure of the site to sunlight and the pH and moisture content of the soils, however further investigation would be required to determine the exact sources of the similarities and differences observed.
These results represent significant improvements in both the accuracy and spatial precision presented in previous studies involving the use of HPLC for the comparison of forensic soil samples; the spatial variability in the locations chosen for this study was considered to be more representative of geoforensic casework and none of the previous studies addressing HPLC documented in the published literature have been able to successfully differentiate between all sample locations. The findings from this study indicate that it is possible that, with careful interpretation of results and in combination with corroborative analyses, HPLC could be used in crime reconstruction at the level of excluding specific locations within a crime scene, for instance entrance and exit points of a discrete area or the route travelled between points.
4.3.2. Quartz grain surface texture analysis
Each of the locations contained only three sub grain types; Ia rounded, Ib sub-rounded and Ic complete grain breakage. All of the samples analysed displayed a similar range and distribution of grain types, regardless of sample location. Grains from the samples from each location all displayed both weathering effects and surface markings consistent with having been formed in a high energy, aqueous environment. Furthermore, the distinctive, elongated grains observed were present at all locations. It has been demonstrated that across the UK, on average there are 2–3 distinct grain types present at a given locationCitation42, so the lack of diversity within these samples is distinctive, but ultimately for this study did not provide additional discriminatory information for these samples taken from different locations within the park.
The large relative standard deviations (RSD) displayed in Table demonstrate the wide variation observed in the relative proportions of each grain type across the five sample points. For each grain type the intra-sample variation was such that, in most cases, the range of grain type ratios for each location were overlapping and the inter-location variability, determined by the differences between the mean relative proportions for each grain type at each location, was therefore far less than the differences between the five samples at each location. As a result, it was not possible to discriminate samples from different locations with any degree of confidence based solely on the analysis of the surface textures of the quartz grains present.
Table 6. Summary of the relative proportions of the three main grain types for each sample point.
The most notable differences between the locations were that the proportion of rounded grains (Ia) at Location 1 was higher than at the other locations. Indeed, the mean proportion of these grains at Location 1 was outside the range of proportions of rounded grains at the other locations. In addition, the mean proportion of sub-rounded grains (Ib) at Location 2 was outside the range of that grain type at Location 1. The relative proportions of each grain type are clearly dependent on one another, therefore whilst these observations can be made it is not possible to use the proportion of a single grain type as a parameter for excluding different locations in isolation, since the parameters for the two other grain sub-types are inextricably correlated.
While quartz grain surface texture analysis has been able to provide valuable exclusionary, and in some cases diagnostic, intelligence and evidence in many forensic cases, the similarity of the underlying geology and the fluvial sediments that are widely present in the Thames Valley appear to have made the discrimination between sample locations within close proximity in this particular location difficult. This further highlights the importance of developing additional methods to add to the suite of techniques available for the analysis of geoforensic samples. It also, therefore, demonstrates the value that HPLC analysis can have for the analysis of samples of close proximity, where other arguably more well-established techniques are not able to yield discrimination between samples. It also serves as a valuable reminder of the importance of utilising a suite of multiple independent analytical techniques that can be applied to geoforensic samples on a case-by-case basis, in a manner that takes into account the different impinging variables of pertinence to each new case.
4.4. Sample collection
As with all preliminary studies, further assessments of extraneous variables are needed. For example, the use of LDPE bags to store samples, although practical, could contaminate the samples with plasticisers. In addition, while changes to soil chemistry resulting from microbial action are largely reduced upon freezing the sample, freezing samples can also affect the organic chemistry of soilCitation43,Citation45. Further assessment of the effects of sample storage conditions on the chromatographic profiles of soil samples is, therefore, required.
5. Conclusions
The results of this study show significant promise. For the first time, it has been demonstrated that it is possible to discriminate between soil samples taken from different locations within the same geographical site by HPLC with high levels of accuracy, which are essential to the evidential value of a technique. It was demonstrated that HPLC is applicable to the analysis of soil samples that are forensically relevant, with respect to both the precision in discriminating geologically similar locations within a small spatial scale and the amount of sample required.
In contrast, quartz grain surface texture analysis, which is an established geoforensic technique that has provided useful information to many criminal investigations in the past, was unable to provide the same level of discrimination at this location. HPLC has, therefore, been demonstrated to be of value in a situation where this more traditional, independent analytical technique would not have been able to provide exclusionary results for samples of differing provenance at this local scale.
Furthermore, the practicability of the HPLC method has been improved greatly by successfully simplifying the sample preparation, reducing the sample preparation time by a minimum of two hours per sample and reducing the run time by 50%. The benefits of these methodological improvements should not be underestimated as the resulting financial savings and increased productivity increases the potential impact of this research in the wider forensic community. In light of the transition to the provision of forensic services by commercial organisations in the UK, techniques that require equipment or skills that are not available in standard analytical laboratories, or are particularly costly, will be of little use in routine analyses. Likewise, high analysis costs limit the extent of research and development that can be performed in an academic environment.
Further empirical studies will be required in order to ascertain the spatial ranges within which soil chromatographic profiles exhibit homogeneity and define the exact precision limits for successful discrimination of soil locations by HPLC. In order for correct comparisons to be made between samples of known and unknown provenance, it will also be necessary to examine how the chromatography changes over time, in response to various environmental conditions and how well it is preserved in and recovered from various different substrates or matrices. It will also be necessary to demonstrate the ability to successfully discriminate locations within a range of different sites to ensure the validity of the use of the technique in a wider variety of crime scenarios. Nevertheless, the results of this preliminary study indicate that HPLC analysis is indeed a feasible and effective way of accurately comparing forensic soil samples.
HPLC has, therefore, been shown to offer significant potential to add to the suite of geoforensic techniques currently used to assist the investigation and detection of crimes, and is particularly beneficial since it expands the range of organic analyses available, which provides an independent form of analysis to complement other methods of physical analysis of soil or sediment samples.
Disclosure statement
No potential conflict of interest was reported by the authors.
Funding
This work was supported by Engineering and Physical Sciences Research Council [grant number EP/G037264/1].
Acknowledgements
The authors acknowledge that this research was funded by the Engineering and Physical Sciences Research Council of the UK through the Security Science Doctoral Research Training Centre based at University College London (EP/G037264/1).
References
- Ritz K, Dawson L, Miller D, editors. Criminal and environmental soil forensics. Netherlands: Springer; 2009.
- Ruffell A, McKinley J. Geoforensics. Chichester: John Wiley & Sons Ltd; 2008.10.1002/9780470758854
- Murray RC. Forensic geology: yesterday, today and tomorrow. In: Pye K, Croft DJ, editors. Forensic geoscience: principles, techniques and applications, geological society. London: The Geological Society; 2004; p. 7–9.
- Murray RC. Evidence from the earth forensic geology and criminal investigation. Missoula (MT): Mountain Press; 2004.
- Morgan RM, Bull PA. The philosophy, nature and practice of forensic sediment analysis. Prog Phys Geog. 2007;31:43–58.
- Morgan RM, Gibson A, Little M, Hicks L, Dunkerley S, Bull PA The preservation of quartz grain surface textures following vehicle fire and their use in forensic enquiry. Sci Justice. 2008;48(3):133–140
- Morgan RM, French JC, O’Donnell L, Bull PA. The reincorporation and redistribution of trace geoforensic particulates on clothing: an introductory study. Sci Justice. 2010;50(4):195–199.10.1016/j.scijus.2010.04.002
- Saferstein R. Criminalistics: an introduction to forensic science. Upper Saddle River (NJ): Prentice Hall; 2014.
- Stam M. Soil as significant evidence in a sexual assault/attempted homicide case. In: Pye K, Croft DJ, editors. Forensic geoscience: principles, techniques and applications, geological society. London: The Geological Society; 2004, p. 295–299.
- Brown AG, Smith A, Elmhurst O. The combined use of pollen and soil analyses in a search and subsequent murder investigation. J. Forensic Sci. 2002;47:614–618.
- Lombardi G. The contribution of forensic geology and other trace evidence analysis to the investigation of the killing of Italian prime minister Aldo Moro. J Forensic Sci. 1999;44:634–642.
- Anonymous, Forensic examination of soil evidence. In: Tontarski RE, Peel HW, editors. Proceedings of the 13th Interpol Forensic Science Symposium, 2001 October 16-19, Interpol. Lyon; 2001. p. D1 175–D1 191.
- Sugita R, Suzuki S, Katsumata Y. Forensic geology- a review: 2004-2007. In: Nic Daeid N, editors. 15th International Forensic Science Symposium Interpol – Lyon, 23 - 26 October 2007, Interpol. Lyon; 2007. p. 81–85.
- Sugita R, Suzuki S, Katsumata Y Forensic geology: review 2007 to 2009. In: Nic Daeid N, editors. 16th International Forensic Science Symposium Interpol – Lyon, 5th - 8th October 2010, Interpol. Lyon; 2010. p. 201–220
- Morgan RM, Bull PA. The use of grain size distribution analysis of sediments and soils in forensic enquiry. Sci Justice. 2007;47:125–135.10.1016/j.scijus.2007.02.001
- Morgan RM, Bull PA. Forensic geoscience and crime detection. Identification, interpretation and presentation in forensic geoscience. Minerva Medicolegale. 2007;127: 73–89.
- Bull PA, Morgan RM. Freudiger-Bonzon J. A critique of the present use of some geochemical techniques in geoforensic analysis, 2-3. Forensic Sci Int. 2007;178:e35–e40.
- Morgan RM, Wiltshire P, Parker A, Bull PA. The role of forensic geoscience in wildlife crime detection. Forensic Sci Int. 2006;162:152–162.10.1016/j.forsciint.2006.06.045
- Morgan RM, Bull PA. Data interpretation in forensic sediment and soil geochemistry. Environ Forensics. 2006;7:325–334.10.1080/15275920600996248
- Bommarito CR, Sturdevant AB, Szymanski DW. Analysis of forensic soil samples via high-performance liquid chromatography and ion chromatography. J Forensic Sci. 2007;52:24–30.
- Reuland DJ, Trinler WA. An investigation of the potential of high performance liquid chromatography for the comparison of soil samples. Forensic Sci Int. 1981;18:201–208.10.1016/0379-0738(81)90161-4
- Siegel JA, Precord C. The analysis of soil samples by reverse phase high performance liquid chromatography using wavelength ratioing. J Forensic Sci. 1995;30:511–525.
- Croft DJ, Pye K. Stable carbon and nitrogen isotope variations in soils: forensic applications. In: Croft DJ, Pye K, editors. Forensic geoscience: techniques, principles and applications: geological society. London: The Geological Society; 2004; p. 257–267.
- Dawson LA, Hillier SS. Measurement of soil characteristics for forensic applications. Surf Interface Anal. 2010;42:363–377.10.1002/sia.v42:5
- Bull PA, Parker A, Morgan RM. The forensic analysis of soils and sediment taken from the cast of a footprint. Forensic Sci Int. 2006;162:6–12.10.1016/j.forsciint.2006.06.075
- Rawlins BG, Cave M. Multi-element soil geochemical signatures. In: Pye K, Croft DJ, editors. Forensic geoscience: principles, techniques and applications, geological society. London: The Geological Society; 2004; p. 197–206.
- Morgan RM, Cohen J, McGookin I, Murly-Gotto JO Connor R, Muress S, Freudiger-Bonzon J, Bull PA. The relevance of the evolution of experimental studies for the interpretation and evaluation of some trace physical evidence. Sci Justice. 2009;49:277–285.
- Bergslien E. An introduction to forensic geoscience. Chichester: Wiley-Blackwell; 2012.
- Fitzpatrick RW. Forensic comparison of soils. In: Tibbett M, Carter DO, editors. Soil analysis in forensic taphonomy. Boca Raton: CRC Press; 2008. p. 1–28.10.1201/9781420069921
- Minasny B, McBratney AB, Salvador-Blanes S. Quantitative models for pedogenesis — a review. Geoderma. 2008;144:140–157.10.1016/j.geoderma.2007.12.013
- Hopkins DW. The role of organisms in terrestrial decomposition. In: Tibbett M, Carter DO, editors. Soil analysis in forensic taphonomy. Boca Raton: CRC Press; 2008. p. 53–66.10.1201/9781420069921
- Gallop A, Stockdale R. Trace and contact evidence. In: White P, editor. Crime scene to court the essentials of forensic science. 1st ed. Cambridge: Royal Society of Chemistry; 1998. p. 47–72.
- Ahmad UK, Rajendran SAbu Hassan S. Forensic analysis of explosive residues from hand swabs, Malaysian. J Anal Sci.. 2008;12:25–31.
- Tarvin M1, McCord B, Mount K, Miller ML Analysis of hydrogen peroxide field samples by HPLC/FD and HPLC/ED, et al. Forensic Sci Int. 2011;209: 166–172.10.1016/j.forsciint.2011.01.024
- Ide R. Fire investigation. In: White P, editor. Crime scene to court the essentials of forensic science. 1st ed. Cambridge: Royal Society of Chemistry; 1998. p. 133–158.
- Hodgson B. Alcohol in Blood. In: Siegel JA, editor. Encyclopedia of forensic sciences. Oxford: Elsevier; 2000. p. 74–80.10.1006/rwfs.2000.0402
- Pragst F, Balikova MA. State of the art in hair analysis for detection of drug and alcohol abuse. Clin Chim Acta. 2006;370:17–49.10.1016/j.cca.2006.02.019
- Pizzolato TM, Lopez de Alda MJ, Barcelo D. LC-based analysis of drugs of abuse and their metabolites in urine. TrAC-Trends Anal Chem. 2007;26:609–624.
- Gaillard Y1, Breuil R, Doche C, Romeuf L, Lemeur C,Prevosto JM, Fanton L Detection of amitriptyline, nortriptyline and bromazepam in liver, csf and hair in the homicidal poisoning of a one month old girl autopsied eight months after death. Forensic Sci Int. 2011;207:e16–e18.10.1016/j.forsciint.2010.11.010
- Reuland DJ, Trinler WA, Farmer MD. Comparison of soil samples by high performance liquid chromatography augmented by absorbance ratioing. Forensic Sci Int. 1992;52:131–142.10.1016/0379-0738(92)90101-2
- Newell AJ1, Morgan RM, Griffin LD, Bull PA, Marshall JR, Graham G Automated texture recognition of quartz sand grains for forensic applications. J Forensic Sci. 2012;57:1285–1289.10.1111/j.1556-4029.2012.02126.x
- Bull PA, Morgan RM. Sediment fingerprints: a forensic technique using quartz sand grains. Sci Justice. 2006;46:107–124.10.1016/S1355-0306(06)71581-7
- Pye K. Geological and soil evidence: forensic applications. Boca Raton: CRC Press; 2007.
- Simmons K Soil sampling SESDPROC-300-R3. United States Environmental Protection Agency [ Online], 21 August 2014, [cited 2016 Apr 15]. Available from: https://www.epa.gov/quality/quality-system-and-technical-procedures-sesd-field-branches
- Larson SA Developing a high throughput protocol for using soil molecular biology as trace evidence. University of Nebraska-Lincoln Digital Commons [ Online], 01 May 2012, [cited 2015 Dec 08]. Available from: http://digitalcommons.unl.edu/cgi/viewcontent.cgi?article=1008&context=biochemdiss
- ICH. Validation of Analytical Procedures: Text and Methodology, ICH [Online]. November 2005. [Cited 2016 Apr 15]. Available from: http://www.ich.org/fileadmin/Public_Web_Site/ICH_Products/Guidelines/Quality/Q2_R1/Step4/Q2_R1__Guideline.pdf