
ABSTRACT
Attenuated total reflection Fourier transform infrared (ATR-FTIR) spectroscopy is a relatively fast and inexpensive but reliable method that can be used as a rough screening tool for DNA preservation. Although it is an excellent analytical tool, it only provides relative information on the chemical structure of heterogeneous materials such as bone and its usefulness and accuracy for predicting the preservation of DNA in samples originating from different body regions of minimally altered remains was never tested before. 144 bone samples were collected from different body regions of three individuals discovered in a Second World War mass grave. DNA was extracted and quantified, followed by STR typing. Samples were analysed with ATR-FTIR spectroscopy. Comparing the preservation state of DNA and chemometric indices, the usefulness of the method was tested. Correlations between the DNA preservation and chemometric indices were highly variable, especially when considering different body regions. Best DNA preservation was correlated with a balanced ratio between carbonates and phosphates, and with high collagen quality and quantity. It seems that, when dealing with relatively young and well-preserved remains, more attention should be paid to collagen quality. In addition, the results indicate that DNA quality and DNA quantity correlate differently with chemometric indices.
Introduction
Significant research has been performed on using FTIR spectroscopy as a pre-screening method for evaluating the preservation state of human skeletal remains, some with a specific focus on the preservation of DNA. This is reasonable because DNA can help answer questions on numerous topics, ranging from human evolution to life habits and individual identificationCitation1, but it is associated with the technical difficulties of extraction and analysis, partial destruction of the remains, and high costs. On the other hand, FTIR spectroscopy is a relatively fast and inexpensive but reliable method that can be used as a rough screening tool for DNA preservation Citation2–6, FTIR spectroscopy is based on the absorption of IR radiation and detection of molecular vibrations of chemical bonds between atoms and/or ions in the sample. The frequencies and intensities of the characteristic FTIR peaks are associated with specific vibrational modes of the bonds. The wavenumber of each peak is determined by the intrinsic physiochemical properties of the corresponding molecule, making it possible to ‘fingerprint’ particular functional groupsCitation7–13, Research has shown that, to a certain extent, FTIR characterization of samples can be used to assess the preservation state of skeletal remains, including the preservation of DNA. This is possible because DNA preservation depends on adsorption onto the bioapatite in the boneCitation14–17, and/or by binding to the collagen fibrilsCitation18–25, As seen in the results of these studies, long-term exposure and/or reactions with an ‘aggressive’ environment caused major differences in the preservation state of the remains, and these are detected well with FTIR spectroscopy. Nonetheless, FTIR spectroscopy can only provide relative information on the chemical structure of bone. As such, it raises the question of its usefulness in the case of relatively well-preserved samples that were exposed to the same diagenetic pathway for the same relatively short amount of time. It has been shown that changes in bones’ molecular structure can be observed with FTIR spectroscopy relatively quickly,Citation26–30, which can be enhanced in the case of exposure to diagenesis,Citation31–35, Research has clearly shown that DNA is differently preserved in different skeletal elements Citation36–39, including the remains used in this study Citation40. We thus asked whether ATR-FTIR spectra can reflect the differences seen in DNA preservation Citation40 of samples originating from individuals with roughly the same biological profile (sex and age), from the same macroenvironmental conditions, and from the same, relatively young, period, in which diagenesis lacked the opportunity to significantly alter the samples.
Spectroscopy is increasingly used in various research contexts involving human skeletal remains. Among other things, it is commonly employed as a pre-screening technique to evaluate the preservation state of the remains, including the preservation of DNA Citation3,Citation5,Citation6,Citation41,Citation42. However, little is known on the variability of the spectroscopic results caused by intrinsic factors, extrinsic factors and their combination. Its usefulness and accuracy for predicting the preservation of DNA in samples originating from different body regions of minimally altered remains was never tested before. We thus believe that more research is necessary to understand the results obtained from the samples originating from various contexts, their correlation to the preservation of DNA and most importantly, to prevent misinterpretations.
Means and methods
Individuals
Three completely mummified skeletons discovered in a Second World War mass grave (the Huda Jama Mass Grave) were selected for the analyses. The individuals were selected based on the similarity in their biological profile (all young adult males), taphonomic history (decomposing for the same amount of time under similar gross environmental conditions), and preservation state (with all the representative skeletal elements present). However, it should be mentioned that, at the time of recovery in spring 2009, Individual A had preserved skin, fascia, and tendons, whereas Individuals B and C had completely preserved internal organs and partially other soft tissue. Prior to skeletal sampling, the remains were washed with water and a toothbrush, air dried, and stored at constant room temperature in cardboard boxes for a few months.
Bone samples
Altogether 144 bone samples were collected, 48 from each individual. Samples were taken from the head, torso, arm, hand, leg, and foot, in each case from the right side of the body (SM, Table S1). Using a circular diamond saw, a 5 cm fragment of compact bone was cut from the diaphysis of the long bones. The same size fragment was cut from the same site of the parietals, occipitals, petrous bones, maxillae, and mandibles; from vertebrae, sterna, ribs, scapulae, and clavicles; from ilea, ischia, pubes, and sacra; and from calcanei and taluses. Half of the metacarpals (MC) and metatarsals (MT), patellae, cuneiforms naviculars, and cuboids were used, and whole capitates and phalanges of the hand and foot were used.
Sample preparation
The procedure described in Zupanič Pajnič Citation43 was followed to clean, grind, decalcify, and purify the DNA from the bones; it is presented in detail in Zupanc et al. Citation40. For this research, only the procedure from cleaning to powdering of the samples is explained in greater detail because the powder obtained was used for the ATR-FTIR analysis.
The collected bones were cleaned mechanically and chemically. After the removal of the outer surface by drilling, the bones were washed in detergent, bi-distilled water, and ethanol. A Bead Beater MillMix 20 tissue homogenizer with 25 ml metal grinding vials and metal balls 20 mm in diameter was used to obtain a fine powder Citation43. To avoid overheating during powdering, the metal vials and bones were cooled in liquid nitrogen. The bones were ground for 1 to 2 min at a frequency of 30 Hz. The powder obtained was placed in sterile tubes until the analysis. To avoid cross-contamination between samples, the entire workspace and the reusable tools were cleaned after processing each bone.
A room designed especially for processing old skeletal remains was used to clean and powder the bones. Cutting and drilling took place in an MC 3 (Iskra Pio, Šentjernej, Slovenia, EU) closed microbiological safety cabinet.
DNA extraction, quantification, and STR typing
Details on DNA extraction, quantification, and STR typing are also presented in Zupanc et al. Citation40. 0.5 g of the obtained bone powder was decalcified with EDTA (Promega) and lysed using G2 buffer (Qiagen), proteinase K (Qiagen) and DTT (Sigma-Aldrich). The samples were purified with a Biorobot EZ1 (Qiagen) with the EZ1 DNA Investigator Kit and the EZ1 DNA Investigator card (Qiagen). DNA was eluted in TE buffer (Qiagen) and 50 µl of extract was obtained. A real-time PCR (qPCR) analysis was performed with the PowerQuant System (Promega) using the ABI 7500 Real-Time PCR System (Applied Biosystems) to assess the amount of human DNA in the extracts, the presence of male DNA, possible inhibitors of PCR reaction present, and the degree of DNA degradation. DNA degradation was estimated by amplification of two targets differing in length: the autosomal (Auto = 85 bp) and degradation (Deg = 294 bp) target. The Auto target was used to measure the quantity of total human DNA, and the ratio between the Auto and Deg targets (the Auto/Deg ratio) was used to describe the degree of DNA degradation in each sample. The Investigator ESSplex SE QS kit (Qiagen) was used to obtain autosomal genetic profiles of the bones. Amplification protocols and conditions for thermal cycling were defined following the manufacturer’s instructions Citation44. Nexus Master Cycler (Eppendorf) was used to perform the amplification at 30 cycles. The final volume of PCR reaction was 25 µl. Where possible, up to 1 ng of DNA was used as a template. In 102 samples for which quantification was lower than 0.067 ng per µl, the maximum volume of extracts (15 µl) was used for STR typing. In the case of 42 samples with quantification higher than 0.67 ng per µl, 1 ng of DNA was used. To separate the fluorescent-labelled PCR products, an automatic ABI PRISM™ 3130 Genetic Analyser with a 3130 Performance Optimized Polymer 4 (Applied Biosystems) and DNA size standard of 550 BTO (Qiagen) was used. Data Collection v 4.0 and GeneMapper ID-X v 1.5 (Applied Biosystems) software was used for the identification of the genetic profiles. Peak amplitude thresholds were set to 50 relative fluorescence units (RFU) for all the dyes. Simultaneously, positive and negative controls were amplified, using the maximum volume of extracts for the amplification of extraction-negative controls.
ATR-FTIR analyses
ATR-FTIR analyses were performed on the powder obtained using a Bruker Vertex 70 equipped with a diamond ATR accessory and MCT (D316) detector. The spectrum of each sample was collected as an average of 64 scans. As the powdering method provided a homogenous powder and the noise in the spectra was minimal, no attempt was made to reduce the noise with more scans. Samples were scanned at a resolution of 1 cm−1 in the domain between 400 cm−1 and 4,000 cm−1. The baseline was subtracted, and each spectrum was normalized to the highest peak (v3PO4 at ~1,010 cm−1). To overcome peak overlapping, a Savitzky–Golay second derivative with five points of window was performed on the domain between 500 cm−1 and 1,800 cm−1.
To explore molecular changes in the bones (changes in the organic and mineral components and crystallinity) objectively, chemometric indices were used. Most of the chemometric indices used with FTIR spectroscopy to study human skeletal remains were extrapolated from the normalized spectra and second-derivative spectra. In addition, some relatively new, slightly adapted, or infrequently used indices were added for better understanding of the results ().
Table 1. Chemometric indices extracted from the spectra.
Statistical analyses
DNA indices were represented by the quantities of human DNA (the Auto and Deg targets) and by its degradation index (the Auto/Deg ratio). In bone samples with an undetected Deg target (Supplementary material – Table S1), the Auto/Deg ratio was arbitrarily assumed to be 29.76, one standard deviation (4.15) higher than the maximum value 25.61. For more detailed information about the DNA quality, the percentage of recovered alleles or successfully amplified alleles was calculated for each sample: the number of successfully amplified alleles was divided by the total number of alleles possible for a given skeleton (STR) Citation36.
Statistical analyses were performed using Orange Citation55 and IBM SPSS 26. For the overall assessment of DNA preservation (quality and quantity), samples were separated into clusters based on the quantity of Auto and Deg, and the percentage of recovered alleles or successfully amplified alleles (STR) using the k-means clustering algorithm (). The highest score (0.710) was obtained for three clusters (silhouette scores, contrasting the average distance to elements in the same cluster with the average distance to elements in other clusters).
Table 2. DNA clusters based on k-means clustering algorithm.
Normality of the data was tested using Shapiro-Wilk test. Based on the results, comparisons were made using Independent Sample Kruskal-Wallis tests with Bonferroni correction for multiple tests. Correlations were tested using Spearman`s correlation. Significance was defined with p < 0.05 (Supplementary material – Statistics).
In search of correlation between the DNA preservation and chemical composition of the samples, chemometric indices obtained from the spectra were compared to Auto, Deg, Auto/Deg ratio, STR and DNA clusters. To investigate how the preservation of DNA is correlated to the chemometric indices, comparisons with indices were made between the three individuals, DNA clusters, samples with highest and lowest DNA yield, and each DNA index. To better understand the influence of intrinsic bone characteristics, comparisons between bones from different body regions defined by Zupanc et al. Citation40 were compared.
Results
DNA results
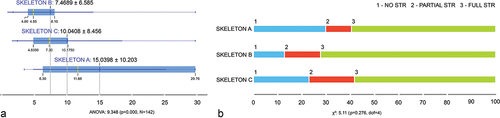
Detailed results of the DNA quantity and quality determined from the samples are presented in Zupanc et al. Citation40 and summarized in Supplementary material, Table S1. In sum, the averaged Auto and STR did not differ significantly between all three skeletons. However, significant differences in the Auto/Deg ratio were observed between Skeletons A and B, and between Skeletons A and C, with highest Auto/Deg ratio in Skeleton A (). Most samples with no profile were from Skeleton A, and most samples with partial or full profile from Skeleton B ().
Figure 1. A – The Auto/Deg ratio of skeletons A, B and C (left); B – Distribution of samples with no (1 – blue), partial (2 – red) or full (3 – green) STR profile from skeletons A, B and C.
More significant differences were observed when comparing body regions. Despite some differences between the three individuals, the average Auto was highest in the hand and foot bones (0.13 ± 0.12), and lowest in the bones from the arm (0.001 ± 0.0006) and upper torso (0.008 ± 0.014). Average STR was highest in the hand and foot bones (> 97%), and lowest in the arm bones (< 0.18%). The Auto/Deg ratio was highest in the head bones (19.5 ± 11.8), the arm bones presented the highest variation in the Auto/Deg ratio (± 12.7), and the lowest Auto/Deg ratio was observed in the hand and foot bones (8 ± 4). Most samples with no profiles originated from the head bones, and most samples with partial or full profiles from the foot.
The 10 highest-ranking skeletal elements considering averaged quantification values were the MC III, MT III, MT IV, MT II, MC IV, MT I, MC V, proximal hand phalanx I, MC II, and petrous portion of the temporal bone, which yielded on average between 10.99 ng and 31.35 ng DNA/g of bone. The lowest-yielding bones (< 0.24 ng DNA/g of bone) were all bones of the head except the temporal bone, all the ribs but the first, all bones from the arm, the scapula, and the clavicle (Supplementary material, Table S2).
Individuals
Significant differences between the three individuals were observed in the Auto/Deg ratio, which was the highest in samples from Skeleton A (15.4 ± 10.3), followed by samples from Skeleton C (10 ± 8.5), and the lowest in samples from Skeleton B (7.7 ± 6.7); and in the Deg target, which was the highest in Skeleton B (0.015 ± 0.021), followed by Skeleton A (0.009 ± 0.014), and the lowest in Skeleton C (0.006 ± 0.011).
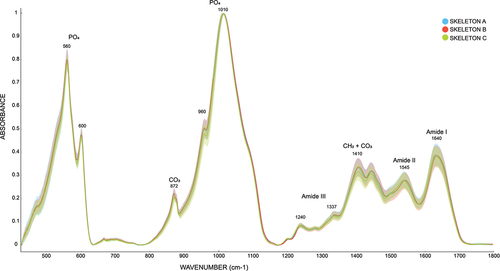
Visual inspection of the spectra () indicated minor differences in the mineral and collagen part of the samples. To quantify the differences and evaluate their significance, indices extracted from the spectra () were investigated.
Figure 2. Normalized spectra of all 48 skeletal elements of the three individuals (blue = Individual A, red = Individual B, green = Individual C).
Comparing the indices, significant differences were seen only when comparing skeleton C with skeletons A and B. Skeleton C had significantly higher R1640/1410, SF, and R1545/1337 while significantly lower H872, H1410, H960, R1660/1630. Although non-significantly, R960/1110 was also highest in Skeleton C ().
Table 3. Chemometric indices with significant differences between skeletons A, B and C.
DNA clusters
DNA clusters differed significantly for the STR, Deg, Auto, and Auto/Deg ratio, with the samples in Cluster 1 having the lowest quantity and quality of DNA, and the samples in Cluster 3 the highest. Spectra of the samples from different DNA clusters are presented in the Supplementary material (Figure S1). Significant differences between the DNA clusters were observed in H872, H960, R1640/1410, R1545/1337 and SF. DNA cluster 2 had lowest H872 and H960, while highest R1640/1410, R1545/1337 and SF was highest in DNA Cluster 2 ().
Table 4. Chemometric indices with significant differences between DNA clusters 1, 2, and 3.
Body regions
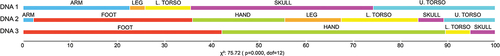
Spectra of different skeletal elements originating from defined body regions are presented in the Supplementary material (Figure S(2 – 9)). A chi-squared test showed significant differences between the distribution of skeletal elements from a defined body region in each DNA cluster. Except for one thoracic vertebra and petrous bones, all the samples in DNA Cluster 3 originated from foot and hand bones, whereas none of the samples from the foot and hand were in DNA Cluster 1. DNA Cluster 1 mainly included bones from the skull, except for the petrous bone, bones from the torso and arm, and one fibula ().
Figure 3. Results of chi-squared analysis with the distribution of samples originating from different body regions in DNA Clusters 1, 2, and 3.
The chemometric indices of different body regions showed significant differences in R1640/1410, SF, H1337, H960, R1095/1110, H1410, H872, and H1545 ().
Table 5. Chemometric indices with significant differences between body regions.
Samples with lowest DNA yields had significantly higher H1337 (0.022 ± 0.004) in comparison to samples with highest DNA yield (0.019 ± 0.003), while lower R1545/1337 (1.47 ± 0.14 vs. 1.59 ± 0.16) and R1640/1410 (1.15 ± 0.07 vs. 1.19 ± 0.07).
DNA quality vs. quantity
The results of statistical analyses on individuals and DNA clusters indicate that there might be a difference in the correlation between DNA quality and chemometric indices, and DNA quantity and chemometric indices. Thus, Auto, Deg, the Auto/Deg ratio, and STR were treated separately to investigate the correlations with chemometric indices.
Auto presented significant differences in H872, H1640, H1545, H960, and H1410, all highest in the samples with the highest Auto (> 0.1) and lowest in the samples with the lowest Auto (≤ 0.1).
Deg presented significant differences in H872 and H960, highest in the samples with the highest Deg (> 0.18) and lowest in the samples with the lowest Deg (< 0.18).
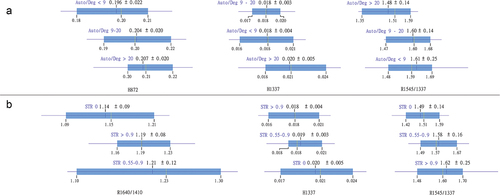
The Auto/Deg ratio presented significant differences in R1545/1337, G1337 and H872. The first was significantly lower, while the latter two were significantly higher in the samples with the highest Auto/Deg ratio (). The percentage of successfully amplified alleles (STR) presented significant differences in R1640/1410, R1545/1337 and H1337. Samples with no STR had lowest R1640/1410 and R1545/1337, while highest H1337 in comparison to samples with STR >0.55 ().
Figure 4. A – Chemometric indices with significant differences between samples with Auto/Deg < 9, Auto/Deg 9–20 and Auto/Deg > 20. B – Chemometric indices with significant differences between samples with no STR, STR 0.55–0.9 and STR > 0.9.
Discussion
Individuals
The results of spectroscopy indicate that Skeleton C differs significantly from the skeletons A and B. The high SF of the samples from Skeleton C indicate larger crystals, more order in the lattice, and higher crystallinity when compared to Skeletons A and B, also seen in the high R960/1110. Carbonate and collagen peaks indicate the lowest relative concentrations of carbonates and poorest collagen quality in Skeleton C. Circling back to the DNA preservation in each skeleton, the degradation index and STR put Skeleton C in the middle, between Skeleton B with the most STR profiles and lowest degradation index, and Skeleton A with the fewest STR profiles and highest degradation index. However, the quantity of DNA (Auto and Deg) was lowest in Skeleton C. When comparing only Skeletons A and B, no significant differences were observed in the ratios, although the degradation index and STR differed significantly. Zupanc et al. Citation40 interpreted the differences between the three individuals as the result of the various burial depth and thus various micro-environmental conditions. Skeleton A was discovered in the most superficial layer, whereas Skeletons B and C were found in the second and third layers of the mass grave. The inconsistency between DNA preservation and ATR-FTIR spectra would indicate that, when averaging values for all the different samples from the same individual and observing the overall DNA preservation, there is no obvious correlation between DNA preservation and chemometric indices. Highest correlation between DNA clusters and chemometric indices was a weak negative correlation (−0.174) between DNA clusters and H1337. However, there are indications that higher DNA quantity can be observed in the samples with a combination of lower crystallinity, lower concentrations of carbonates, and the highest collagen quality. Furthermore, from the perspective of ATR-FTIR spectroscopy, the three individuals, all adult males with an almost identical taphonomic history, presented some significant differences in the mineral and collagen components of the bones. This is in agreement with previously observed intra-site variability Citation33,Citation56.
Body region
A comparison of the spectra and chemometric indices based on body regions shows great variety, likely originating from the bones’ endogenous characteristics and from the degree of changes caused by diagenetic factors. Trueman et al. Citation57 already proposed that the closure of intra-crystalline porosity during diagenesis, which allows bone to survive in the long term, depends on environmental and intra-bone variations. This is understandable because the molecular structure of bones in the human skeleton varies significantly based on specific inter-bone structural and remodelling differences Citation27–30, leading to different preservation states of their components Citation10,Citation31–35.
As established earlier Citation40, DNA was best preserved in the petrous bone and in the bones from the hand and foot, and it was worst preserved in the flat bones of the skull, bones from the arm, and upper torso. Chemometric indices showed extremely complex changes, varying from index to index and from body region to body region, confirming that bone type can significantly impact the results Citation35. Nevertheless, it was relatively obvious that the samples with the best DNA preservation have the highest crystallinity but the lowest relative amounts of carbonates. From the perspective of organic matter, it was not possible to correlate high concentrations of amides with the best DNA preservation because hand bones had significantly lower H1640 and H1545 than foot bones. This was also confirmed by low correlation between DNA cluster 3 with H1640 (0.41) and H1545 (0.36). On the other hand, the collagen denaturation seen in H1337 was lowest in both hand and foot bones. In comparison, samples from the arm and upper torso with the worst DNA preservation showed lower (R960/1110, R1095/1110) or similar (SF) crystallinity indexes, but higher relative concentrations of carbonates. This likely means better-preserved carbonates in the samples, preventing crystallinity from increasing. Organic related chemometric indices show medium relative concentrations of collagen in the arm and upper torso, but high collagen denaturation. Such denaturation is mainly seen in high H1337, and in low R1545/1337 and R1660/1630.
Although some significant differences between different body regions are present in carbonates, phosphates, and collagen in the bone, they are complex and require further investigation. As seen in the findings by Gonçalves et al. Citation35, more focus is needed on bone types, specific skeletal elements, and even intra-bone variation. For now, this complexity has been avoided and only the samples with highest and lowest DNA yield have been investigated.
The most significant difference between the samples with the highest and lowest DNA yield was collagen denaturation, which was lower in the samples with the highest DNA yield. A minor difference was also seen in the carbonate-to-collagen ratio, most likely on account of higher collagen concentrations in the samples with the highest DNA yield. Better-preserved collagen in the samples with highest DNA was expected Citation2–5,Citation58; however, the quantity alone might not be enough in the case of minimally altered bones with good overall collagen preservation, and collagen quality needs to be established. A lack of differences in the mineral part could be a result of not acknowledging skeletal element. In the highest DNA-yielding group, hand and foot bones were pooled together with petrous bones, which are more mineralized and less prone to diagenesis than other skeletal elements Citation5,Citation59–61. Similarly, in the lowest DNA-yielding group, different flat bones with predominantly trabecular bone and thin compact bone were pooled together with more dense and thick compact bone from long bone diaphysis. Another possible explanation for the lack of differences in the mineral part could be the relatively short diagenesis, as research indicates that the early stages of diagenesis affect collagen more severely than minerals Citation58,Citation62,Citation63.
DNA clusters
H872 indicates that DNA Cluster 2 has the lowest relative concentrations of carbonates, also seen in R1640/1410. H1410 further shows that DNA Cluster 2 has the lowest relative concentrations of B-type carbonates (0.320 ± 0.04 vs. 0.338 ± 0.037 in Cluster 3 and 0.336 ± 0.040 in Cluster 1). Low relative concentrations of carbonates are the likely reason for high SF in DNA Cluster 2 because loss of carbonates would allow for crystal growth and more order in the mineral lattice Citation64. Going deeper into the carbonates, R870/880, which was highest in DNA Cluster 2 (1.71 ± 0.25) and DNA Cluster 1 (1.70 ± 0.35), and lowest in DNA Cluster 3 (1.65 ± 0.24), shows that DNA Cluster 3, with the highest concentrations of B-type carbonates, also has the highest concentrations of A-type carbonates relative to B-type carbonates, whereas the opposite is indicated for DNA Cluster 2.
Because H960 alone is hard to interpret, R1095/1110 and R960/1110 were investigated. Although lacking significancy, both ratios were highest in DNA Cluster 3 (1.20 ± 0.20; 4.23 ± 0.46), followed by DNA Cluster 1 (1.10 ± 0.27; 4.06 ± 0.68) and DNA Cluster 2 (1.10 ± 0.27; 4.00 ± 0.76). This would indicate that samples from DNA Cluster 3 have the highest crystallinity on account of the highest peaks representing stoichiometric apatite and the lowest peaks representing non-stoichiometric apatite.
The only significant ratio representing amides was R1545/1337, which increases with collagen denaturation Citation65 as the 1,337 cm−1 peak decreases with collagen denaturation Citation66,Citation67. To understand the ratio better, H1545 and H1337 were investigated. The first, which was highest in DNA Cluster 3 (0.287 ± 0.035), followed by DNA Cluster 2 (0.276 ± 0.035) and DNA Cluster 1 (0.275 ± 0.035), presented almost no difference between the clusters. On the other hand, H1337, which was highest in DNA Cluster 1 (0.020 ± 0.005), followed by DNA Clusters 2 and 3 (0.018 ± 0.004), was barely not significant (p = 0.055). With the peaks combined, the ratio shows that DNA Cluster 3 has the best-preserved amide II with the least-denatured collagen, whereas DNA Clusters 2 and 1 both have slightly lower relative concentrations of amide II, but DNA Cluster 1 has more denatured collagen, indicating the highest degradation. The best collagen quality of DNA Cluster 3 can also be confirmed with R1660/1630, which is highest in DNA Cluster 3 (0.654 ± 0.121) and lowest in DNA Clusters 1 (0.636 ± 0.118) and 2 (0.635 ± 0.107).
The differences between the DNA clusters based solely on the ATR-FTIR results are small, but they are seen in the carbonates, phosphates, and amides. The highest carbonate concentrations of both types, and the highest crystallinity, probably on account of less stable non-stoichiometric apatite, relate to DNA Cluster 3, which also has the highest concentrations and least-degraded collagen. Overall DNA preservation (quality and quantity) is indicated by the highest collagen quantity and quality on the one hand, and a balanced ratio between the carbonates and (non)stoichiometric phosphates on the other hand. This is not a surprising result because collagen and mineral in the bone have an intimate association with mutual protection Citation68, and DNA preservation depends on both Citation4,Citation16,Citation69–71.
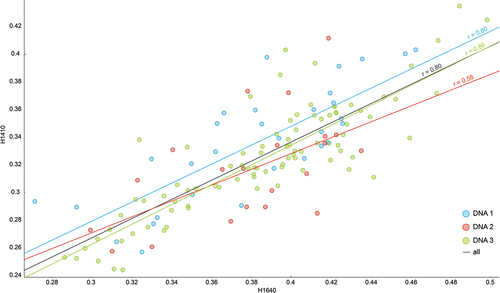
Complicated relationship between ATR-FTIR spectra and DNA preservation was expected because the state of the mineral and collagen in the bone, and thus the molecular composition reflected in the spectra, is highly subjected to the complexity of diagenesis Citation5,Citation57,Citation72–75. Nevertheless, a combination of different ATR-FTIR chemometric indices can serve as a good predictor for DNA preservation in bone samples. Namely, low crystallinity, high carbonate concentrations, and high collagen concentrations (SF, H1410 = C/P, H1640 = Am/P) are usually the key indices associated with good DNA preservation Citation2,Citation3,Citation76. This was partially confirmed by this study. Despite the weak correlation between SF and DNA preservation, and H1410 and DNA preservation (< 0.3), also observed by Kontopoulos et al. Citation3, both indices seem to be correlated because combining them increased the correlation to 0.6. Furthermore, combining H1410 and H1640 showed a correlation of 0.8 (), confirming the collagen–mineral mutual protection Citation68,Citation77,Citation78.
Figure 5. Correlation between H1640 and H1410 for DNA clusters (DNA 1 = blue, DNA 2 = red, DNA 3 = green, all = black).
The only inconsistency regarding previous studies is crystallinity. Usually, crystallinity plays an important role in the assessment of bone preservation, and low crystallinity is correlated with good DNA preservation because high crystallinity, especially in archaeological remains, indicates more diagenetic changes in the bones Citation25. The results presented here indicate that in a relatively young sample set, the state of carbonates, and collagen play a more significant role in DNA preservation than crystallinity. Furthermore, a correlation between higher crystallinity and better DNA preservation was seen. These inconsistencies probably derive from differences in the research design. In comparison to the majority of other studies mentioned, the samples in this study are more homogeneous regarding site conditions and time because they all originate from the same site and period, they are more heterogeneous regarding skeletal elements because 44 different skeletal elements were sampled, and the remains were exposed to diagenesis only for a relatively short period because they date from the 20th century. In addition, although SF was included, different indices were used to determine crystallinity. According to a study by Querido et al. Citation79, R1095/1110 and R960/1110 are more appropriate when using ATR-FTIR spectroscopy on bones than SF. Because they rely on different peaks than SF, they cannot be directly correlated. Second, in this study, the ranges of the chemometric indices are quite narrow. Due to the narrow range and short exposure to diagenesis, increased crystallinity (or any other index) should be interpreted relative to the sample set, where small changes are already significant. For example, SF values range between 3.32 and 4.15. Kontopoulos et al. Citation3 used samples dating as far back as 10,000 BC and report SF values as high as 5.91, a study combining samples from the 16th century BC to the 21st century AD reports SF values as high as 5.5 Citation80, and calcinated bones can have SF values as high as 10.5 Citation64. Thus, in a broader context, the crystallinity assessed using SF in this study is not high at all.
DNA quality vs. quantity
DNA quantity (Auto and Deg) was the highest in the case of high amide I and II relative concentrations, high relative carbonate concentrations, and well-crystalline apatite. However, only Auto showed significant differences in collagen indices. The reason might be that large strands of DNA are not incorporated into mineralized collagen because they would distort the structure of collagen fibrils, whereas short fragments could be trapped in the fibrils Citation81.
DNA quality (STR) was best in the samples with high R1640/1410, which, together with low H1410 and H872, but high H1640 and H1545, indicate the lowest relative concentrations of carbonates, but the highest relative concentrations of collagen. The collagen was also least denatured. It seems that higher DNA quantity is indicated by higher relative concentrations of carbonates, amide I and II, and well-crystalline apatite, whereas better DNA quality by low relative concentrations of carbonates and the least-denatured collagen. The inconsistencies between Auto and STR are interesting because a significant correlation was found between the detection of short Auto and long Deg targets and the success of autosomal STR typing Citation82. From the perspective of collagen, this is reasonable because good collagen quality predicts good DNA quality. In case of carbonates, it might be that some minimal losses of carbonates allowed for the extraction of higher-quality DNA because DNA has a great binding affinity to hydroxyapatite Citation69,Citation83 and is adsorbed or encapsuled in re-precipitating hydroxyapatite when subjected to diagenesis Citation58.
Conclusions
The complexity of the diagenetic pathways makes correlations between DNA preservation and chemometric indices highly variable and difficult to understand. Structural differences in different skeletal elements make this correlation even more complicated. Although there are additional ways to explore the dataset presented here, for now we have focused on the correlation between the differences observed in DNA preservation and ATR-FTIR spectra. Going in the opposite direction, where DNA preservation was known, presented an opportunity to test the accuracy of spectra in minimally altered remains, which are highly variable from the perspective of the skeletal elements sampled but homogeneous in the sense of their taphonomic history. Although only small changes with quite a narrow range in chemometric indices were observed, numerous changes were significant. Most of the changes were understandable when acknowledging previous studies, bone structure, and diagenesis, whereas some require further research.
At the level of individuals, it was not possible to correlate the overall DNA preservation and ATR-FTIR spectra. There were inconsistencies, most likely due to averaging all the results, regardless of the skeletal element and DNA index (all the skeletal elements sampled and both DNA quality and quantity indices were pooled together). Despite the similar biological profile and gross environmental conditions, the three individuals presented some significant differences in the mineral and collagen components of the bones. This clearly confirms the intra-site variability, already seen in the DNA preservation Citation40, and highlights the possible oversimplification when expanding any kind of results obtained from a small set of samples onto the whole site.
Although DNA preservation presented relatively clear patterns in different body regions, it was not possible to reflect them with chemometric indices. Some significant differences between different body regions were observed, but the variability of the chemometric indices was extremely high and needs further investigation oriented towards bone type or even skeletal element. For now, it can only be advised that when interpreting spectra, one should bear in mind that some variation can result from intra- and inter-bone structural differences.
The established DNA clusters, which were based on DNA quality and quantity indices, indicate that best overall DNA preservation can be correlated with a balanced ratio between carbonates and phosphates, and with high collagen quality and quantity. In general, the most significant difference between the samples with the highest and lowest DNA yield was seen in collagen denaturation, and, to a lesser extent, in relative collagen concentrations. Although this might be more important in the case of relatively young and well-preserved remains than in older and/or severely altered remains, collagen quality, and not only quantity, should be acknowledged when using ATR-FTIR spectroscopy as a pre-screening method.
In contrast to research performed on older bones, it seems that crystallinity and relative collagen and carbonate concentrations are not good enough criteria for the assessment of DNA preservation in younger and well-preserved samples, especially when the samples derive from various skeletal elements. The results can be improved with collagen denaturation, but additional research is necessary to determine the impact of different bone structures.
Quite interesting are the inconsistencies between the correlation of DNA quantity with chemometric indices and DNA quality with chemometric indices. Because the first can be used as a predictor for the second, some additional research is necessary. For now, the goal of ATR-FTIR spectroscopy should be strictly defined in order not to misinterpret the results.
Ethics approval
The research project was approved by the Slovenian Medical Ethics Committee (0120-481/2018-11 and 0120-350/2018/6).
SM Statistics
Download PDF (249.1 KB)SM Tables SM 1 to 2
Download MS Excel (51.2 KB)SM Figures 1 to 9
Download PDF (3.1 MB)Acknowledgments
The authors thank the Slovenian Government Commission on Concealed Mass Graves for support in the exhumations of Second World War victims, and Marcel Obal for the help with the DNA extraction.
Disclosure statement
No potential conflict of interest was reported by the author(s).
Supplementary material
Supplemental data for this article can be accessed here.
Additional information
Funding
Related Research Data
References
- Herrmann B, Hummel S. Ancient DNA : recovery and analysis of genetic material from paleontological, archaeological, museum, medical, and forensic specimens. New York (NY): Springer New York; 1994.
- Leskovar T, Zupanič Pajnič I, Geršak ŽM, Jerman I, Črešnar M. ATR-FTIR spectroscopy combined with data manipulation as a pre-screening method to assess DNA preservation in skeletal remains. Forensic Sci Int Genet. 2020;44:102196.
- Kontopoulos I, Penkman K, Mullin VE, Winkelbach L, Unterländer M, Scheu A, Kreutzer S, Hansen HB, Margaryan A, Teasdale MD, et al. Screening archaeological bone for palaeogenetic and palaeoproteomic studies. PLoS One. 2020;15(6):e0235146. doi:10.1371/journal.pone.0235146.
- Sosa C, Vispe E, Núñez C, Baeta M, Casalod Y, Bolea M, Hedges REM, Martinez-Jarreta B. Association between ancient bone preservation and dna yield: a multidisciplinary approach. Am J Phys Anthropol. 2013;151(1):102–109. doi:10.1002/ajpa.22262.
- Kontopoulos I, Penkman K, McAllister GD, Lynnerup N, Damgaard PB, Hansen HB, Allentoft ME, Collins MJ. Petrous bone diagenesis: a multi-analytical approach. Palaeogeogr Palaeoclimatol Palaeoecol. 2019;518:143–154. doi:10.1016/j.palaeo.2019.01.005.
- Schwarz C, Debruyne R, Kuch M, McNally E, Schwarcz H, Aubrey AD, Bada J, Poinar H. New insights from old bones: DNA preservation and degradation in permafrost preserved mammoth remains. Nucleic Acids Res. 2009;37(10):3215–3229. doi:10.1093/nar/gkp159.
- Larkin P. Chapter 1 - introduction: infrared and raman spectroscopy. In: Larkin P, editor. Infrared and raman spectroscopy: principles and spectral interpretation. Oxford: Elsevier; 2011. p. 1–5.
- Figueiredo MM, Gamelas JAF, Martins AG. Characterization of bone and bone-based graft materials using FTIR spectroscopy. In: Theophile T, editor. Infrared spectroscopy - life and biomedical sciences. Rijeka (Croatia): InTech; 2012. p. 315–338.
- Taylor EA, Donnelly E. Raman and fourier transform infrared imaging for characterization of bone material properties. Bone. 2020;139:115490. doi:10.1016/j.bone.2020.115490.
- Sponheimer M, Ryder CM, Fewlass H, Smith EK, Pestle WJ, Talamo S. Saving old bones: a non-destructive method for bone collagen prescreening. Sci Rep. 2019;9(1):13928. doi:10.1038/s41598-019-50443-2.
- Martínez Cortizas A, López-Costas O. Linking structural and compositional changes in archaeological human bone collagen: an FTIR-ATR approach. Sci Rep. 2020;10(1):17888. doi:10.1038/s41598-020-74993-y.
- Pedrosa M, Curate F, Batista de Carvalho LAE, Marques MPM, Ferreira MT. Beyond metrics and morphology: the potential of FTIR-ATR and chemometrics to estimate age-at-death in human bone. Int J Legal Med. 2020;134(5):1905–1914. doi:10.1007/s00414-020-02310-3.
- Pal Chowdhury M, Choudhury KD, Bouchard GP, Riel-Salvatore J, Negrino F, Benazzi S, Slimak L, Frasier B, Szabo V, Harrison R, et al. Machine learning ATR-FTIR spectroscopy data for the screening of collagen for ZooMS analysis and MtDNA in archaeological bone. J Archaeol Sci. 2021;126:105311. doi:10.1016/j.jas.2020.105311.
- Lindahl T. Instability and decay of the primary structure of DNA. Nature. 1993;362(6422):709–715. doi:10.1038/362709a0.
- Allentoft ME, Matthew C, David H, James H, Oskam CL, Hale ML, Campos PF, Samaniego JA, Gilbert TM, Eske W, et al. The half-life of DNA in bone: measuring decay kinetics in 158 dated fossils. Proc R Soc B Biol Sci. 2012;279(1748):4724–4733. doi:10.1098/rspb.2012.1745.
- Götherström A, Collins MJ, Angerbjörn A, Lidén K. Bone preservation and DNA amplification. Archaeometry. 2002;44(3):395–404. doi:10.1111/1475-4754.00072.
- Grunenwald A, Keyser C, Sautereau AM, Crubézy E, Ludes B, Drouet C. Adsorption of DNA on biomimetic apatites: toward the understanding of the role of bone and tooth mineral on the preservation of ancient DNA. Appl Surf Sci. 2014;292:867–875. doi:10.1016/j.apsusc.2013.12.063.
- Kaya M, Toyama Y, Kubota K, Nodasaka Y, Ochiai M, Nomizu M, Nishi N. Effect of DNA structure on the formation of collagen–DNA complex. Int J Biol Macromol. 2005;35(1):39–46. doi:10.1016/j.ijbiomac.2004.11.005.
- Kitamura H, Iwamoto C, Sakairi N, Tokura S, Nishi N. Marked effect of DNA on collagen fibrillogenesis in vitro. Int J Biol Macromol. 1997;20(3):241–244. doi:10.1016/S0141-8130(97)00021-4.
- Patonai Z, Maasz G, Avar P, Schmidt J, Lorand T, Bajnoczky I, Mark L. Novel dating method to distinguish between forensic and archeological human skeletal remains by bone mineralization indexes. Int J Legal Med. 2013;127(2):529–533. doi:10.1007/s00414-012-0785-4.
- Leskovar T, Zupanič Pajnič I, Jerman I, Črešnar M. Separating forensic, WWII, and archaeological human skeletal remains using ATR-FTIR spectra. Int J Legal Med. 2019;134:811–821. doi:10.1007/s00414-019-02079-0.
- Woess C, Unterberger SH, Roider C, Ritsch-Marte M, Pemberger N, Cemper-Kiesslich J, Hatzer-Grubwieser P, Parson W, Pallua JD, Shahid M. Assessing various infrared (IR) microscopic imaging techniques for post-mortem interval evaluation of human skeletal remains. PLoS One. 2017;12(3):e0174552. doi:10.1371/journal.pone.0174552.
- Amadasi A, Cappella A, Cattaneo C, Cofrancesco P, Cucca L, Merli D, Milanese C, Pinto A, Profumo A, Scarpulla V, et al. Determination of the Post mortem interval in skeletal remains by the comparative use of different physico-chemical methods: are they reliable as an alternative to 14C? HOMO- J Comp Hum Biol. 2017;68(3):213–221. doi:10.1016/j.jchb.2017.03.006.
- Longato S, Wöss C, Hatzer-Grubwieser P, Bauer C, Parson W, Unterberger SH, Kuhn V, Pemberger N, Pallua AK, Recheis W, et al. Post-mortem interval estimation of human skeletal remains by micro-computed tomography, mid-infrared microscopic imaging and energy dispersive X-ray mapping. Anal Methods. 2015;7(7):2917–2927. doi:10.1039/C4AY02943G.
- Tătar A, Ponta O, Kelemen BS, Tatar A-S, Oana P, Kelemen BS, Tătar A, Ponta O, Kelemen BS. Bone diagenesis and FTIR indices: a correlation. Stud Univ Babes-Bolyai Biol. 2014;LIX(1):101–114.
- Howes JM, Stuart BH, Thomas PS, Raja S, O’Brien C. An investigation of model forensic bone in soil environments studied using infrared spectroscopy. J Forensic Sci. 2012;57(5):1161–1167. doi:10.1111/j.1556-4029.2012.02236.x.
- Reznikov N, Shahar R, Weiner S. Bone hierarchical structure in three dimensions. Acta Biomater. 2014;10(9):3815–3826. doi:10.1016/j.actbio.2014.05.024.
- Hedges REM, Clement JG, Thomas CDL, O’Connell TC. Collagen turnover in the adult femoral mid-shaft: modeled from anthropogenic radiocarbon tracer measurements. Am J Phys Anthropol. 2007;133(2):808–816. doi:10.1002/ajpa.20598.
- Mulhern DM. Rib remodeling dynamics in a skeletal population from Kulubnarti, Nubia. Am J Phys Anthropol. 2000;111(4):519–530. doi:10.1002/(SICI)1096-8644(200004)111:4<519::AID-AJPA7>3.0.CO;2-7.
- Fahy GE, Deter C, Pitfield R, Miszkiewicz JJ, Mahoney P. Bone deep: variation in stable isotope ratios and histomorphometric measurements of bone remodelling within adult humans. J Archaeol Sci. 2017;87:10–16. doi:10.1016/j.jas.2017.09.009.
- Colson IB, Bailey JF, Vercauteren M, Sykes BC, Hedges REM. The preservation of ancient DNA and bone diagenesis. Anc Biomol. 1997;1(2):109–117.
- Procopio N, Chamberlain AT, Buckley M. Intra- and interskeletal proteome variations in fresh and buried bones. J Proteome Res. 2017;16(5):2016–2029. doi:10.1021/acs.jproteome.6b01070.
- Kontopoulos I, Penkman K, Liritzis I, Collins MJ. Bone diagenesis in a mycenaean secondary burial (Kastrouli, Greece). Archaeol Anthropol Sci. 2019;11(10):5213–5230. doi:10.1007/s12520-019-00853-0.
- Jans MME, Kars H, Nielsen–Marsh CM, Smith CI, Nord AG, Arthur P, Earl N. In situ preservation of archaeological bone: a histological study within a multidisciplinary approach. Archaeometry. 2002;44(3):343–352. doi:10.1111/1475-4754.t01-1-00067.
- Gonçalves D, Vassalo AR, Mamede AP, Makhoul C, Piga G, Cunha E, Marques MPM, Batista de Carvalho LAE. Crystal clear: vibrational spectroscopy reveals intrabone, intraskeleton, and interskeleton variation in human bones. Am J Phys Anthropol. 2018;166(2):296–312. doi:10.1002/ajpa.23430.
- Emmons AL, Davoren J, DeBruyn JM, Mundorff AZ. Inter and intra-individual variation in skeletal DNA preservation in buried remains. Forensic Sci Int Genet. 2020;44:102193. doi:10.1016/j.fsigen.2019.102193.
- Hines DZC, Vennemeyer M, Amory S, Huel RLM, Hanson I, Katzmarzyk C, Parsons TJ. Chapter 13 - prioritized sampling of bone and teeth for DNA Analysis in commingled cases. In: Adams BJ, Byrd JE, editors. Commingled human remains: methods in recovery, analysis, and identification. San Diego: Academic Press; 2014. p. 275–305.
- Mundorff AZ, Bartelink EJ, Mar-Cash E. DNA preservation in skeletal elements from the world trade center disaster: recommendations for mass fatality management*,†. J Forensic Sci. 2009;54(4):739–745. doi:10.1111/j.1556-4029.2009.01045.x.
- Mundorff A, Davoren JM. Examination of DNA Yield rates for different skeletal elements at increasing post mortem intervals. Forensic Sci Int Genet. 2014;8(1):55–63. doi:10.1016/j.fsigen.2013.08.001.
- Zupanc T, Zupanič Pajnič I, Podovšovnik E, Obal M. High DNA yield from metatarsal and metacarpal bones from slovenian second world war skeletal remains. Forensic Sci Int Genet. 2020;51:102426. doi:10.1016/j.fsigen.2020.102426.
- Hollund HI, Teasdale MD, Mattiangeli V, Sverrisdóttir OÓ, Bradley DG, O’Connor T. Pick the right pocket. Sub-sampling of bone sections to investigate diagenesis and DNA preservation. Int J Osteoarchaeol. 2017;27(3):365–374. doi:10.1002/oa.2544.
- Leskovar T, Zupanič Pajnič I, Geršak ŽM, Jerman I, Črešnar M. ATR-FTIR spectroscopy combined with data manipulation as a pre-screening method to assess DNA preservation in skeletal remains. Forensic Sci Int Genet. 2020;44:102196.
- Zupanič Pajnič I. Extraction of DNA from human skeletal material BT - forensic DNA typing protocols. In: Goodwin W, editor. Forensic DNA typing protocols. New York: Springer New York; 2016. p. 89–108.
- Marjanović D, Hadžić Metjahić N, Čakar J, Džehverović M, Dogan S, Ferić E, Džijan S, Škaro V, Projić P, Madžar T, et al. Identification of human remains from the second world war mass graves uncovered in Bosnia and Herzegovina. Croat Med J. 2015;56(3):257–262. doi:10.3325/cmj.2015.56.257.
- Weiner S, Bar-Yosef O. States of preservation of bones from prehistoric sites in the near east: a survey. J Archaeol Sci. 1990;17(2):187–196. doi:10.1016/0305-4403(90)90058-D.
- Olsen J, Heinemeier J, Bennike P, Krause C, Margrethe Hornstrup K, Thrane H. Characterisation and blind testing of radiocarbon dating of cremated bone. J Archaeol Sci. 2008;35(3):791–800. doi:10.1016/j.jas.2007.06.011.
- Thompson TJU, Gauthier M, Islam M. The application of a new method of fourier transform infrared spectroscopy to the analysis of burned bone. J Archaeol Sci. 2009;36(3):910–914. doi:10.1016/j.jas.2008.11.013.
- Bonfield W, Gibson IR. Novel synthesis and characterization of an AB-type carbonate-substituted hydroxyapatite. J Biomed Mater Res. 2002;59(4):697–708. doi:10.1002/jbm.10044.
- Rey C, Shimizu M, Collins B, Glimcher MJ. Resolution-enhanced fourier transform infrared spectroscopy study of the environment of phosphate ion in the early deposits of a solid phase of calcium phosphate in bone and enamel and their evolution with age: 2. Investigations in the Nu3PO4 domain. Calcif Tissue Int. 1991;49(6):383–388. doi:10.1007/BF02555847.
- Madupalli H, Pavan B, Tecklenburg MMJ. Carbonate substitution in the mineral component of bone: discriminating the structural changes, simultaneously imposed by carbonate in A and B sites of apatite. J Solid State Chem. 2017;255:27–35. doi:10.1016/j.jssc.2017.07.025.
- Lebon M, Reiche I, Gallet X, Bellot-Gurlet L, Zazzo A. Rapid quantification of bone collagen content by ATR-FTIR spectroscopy. Radiocarbon. 2016;58(1):131–145. doi:10.1017/RDC.2015.11.
- Trueman CNG, Behrensmeyer AK, Tuross N, Weiner S. Mineralogical and compositional changes in bones exposed on soil surfaces in Amboseli National Park, Kenya: diagenetic Mechanisms and the role of sediment pore fluids. J Archaeol Sci. 2004;31(6):721–739. doi:10.1016/j.jas.2003.11.003.
- Thompson TJU, Islam M, Bonniere M. A new statistical approach for determining the crystallinity of heat-altered bone mineral from FTIR spectra. J Archaeol Sci. 2013;40(1):416–422. doi:10.1016/j.jas.2012.07.008.
- Habermehl J, Skopinska J, Boccafoschi F, Sionkowska A, Kaczmarek H, Laroche G, Mantovani D. Preparation of ready-to-use, stockable and reconstituted collagen. Macromol Biosci. 2005;5(9):821–828. doi:10.1002/mabi.200500102.
- Demšar J, Curk T, Erjavec A, Gorup Č, Hočevar T, Milutinovič M, Možina M, Polajnar M, Toplak M, Starič A. Orange: data mining toolbox in python. J Mach Learn Res. 2013;14(1):2349–2353.
- Nielsen-Marsh CM, Hedges REM. Patterns of diagenesis in bone I: the effects of site environments. J Archaeol Sci. 2000;27(12):1139–1150. doi:10.1006/jasc.1999.0537.
- Trueman CN, Privat K, Field J. Why do crystallinity values fail to predict the extent of diagenetic alteration of bone mineral? Palaeogeogr Palaeoclimatol Palaeoecol. 2008;266(3–4):160–167. doi:10.1016/j.palaeo.2008.03.038.
- Campos PF, Craig OE, Turner-Walker G, Peacock E, Willerslev E, Gilbert MTP. DNA in ancient bone – where is it located and how should we extract it? Ann Anat - Anat Anzeiger. 2012;194(1):7–16. doi:10.1016/j.aanat.2011.07.003.
- Doden E, Halves R. On the functional morphology of the human petrous bone. Am J Anat. 1984;169(4):451–462. doi:10.1002/aja.1001690407.
- Jeffery N, Spoor F. Prenatal growth and development of the modern human labyrinth. J Anat. 2004;204(2):71–92. doi:10.1111/j.1469-7580.2004.00250.x.
- Frisch T, Sorensen MS, Overgaard S, Bretlau P. Estimation of volume referent bone turnover in the otic capsule after sequential point labeling. Ann Otol Rhinol Laryngol. 2000;109(1):33–39. doi:10.1177/000348940010900106.
- Jans MME, Nielsen-Marsh CM, Smith CI, Collins MJ, Kars H. Characterisation of microbial attack on archaeological bone. J Archaeol Sci. 2004;31(1):87–95. doi:10.1016/j.jas.2003.07.007.
- Trueman CN, Martill DM. The long–term survival of bone: the role of bioerosion. Archaeometry. 2002;44(3):371–382. doi:10.1111/1475-4754.t01-1-00070.
- Lebon M, Reiche I, Bahain JJ, Chadefaux C, Moigne AM, Fröhlich F, Sémah F, Schwarcz HP, Falguères C. New parameters for the characterization of diagenetic alterations and heat-induced changes of fossil bone mineral using fourier transform infrared spectrometry. J Archaeol Sci. 2010;37(9):2265–2276. doi:10.1016/j.jas.2010.03.024.
- West PA, Torzilli PA, Chen C, Lin P, Camacho NP. Fourier Transform infrared imaging spectroscopy analysis of collagenase-induced cartilage degradation. J Biomed Opt. 2005;10(1):14015. doi:10.1117/1.1854131.
- Jackson M, Choo LP, Watson PH, Halliday WC, Mantsch HH. Beware of connective tissue proteins: assignment and implications of collagen absorptions in infrared spectra of human tissues. Biochim Biophys Acta. 1995;1270(1):1–6. doi:10.1016/0925-4439(94)00056-V.
- Lazarev YA, Lazareva AV, Shibnev VA, Esipova NG. Infrared spectra and structure of synthetic polytripeptides. Biopolymers. 1978;17(5):1197–1214. doi:10.1002/bip.1978.360170508.
- Nielsen-Marsh C, Gernaey A, Turner-Walker G, Hedges R, Pike A, Collins M. The chemical degradation of bones. In: Cox M, Mays S, editors. Human osteology in archaeology and forensic science. London: Greenwich Medical Media; 2000. p. 439–451.
- Salamon M, Tuross N, Arensburg B, Weiner S. Relatively well preserved DNA is present in the crystal aggregates of fossil bones. Proc Natl Acad Sci U S A. 2005;102(39):13783–13788. doi:10.1073/pnas.0503718102.
- Wadsworth C, Procopio N, Anderung C, Carretero J-M, Iriarte E, Valdiosera C, Elburg R, Penkman K, Buckley M. Comparing ancient DNA survival and proteome content in 69 archaeological cattle tooth and bone samples from multiple European Sites. J Proteomics. 2017;158:1–8. doi:10.1016/j.jprot.2017.01.004.
- Ottoni C, Bekaert B, Decorte R. DNA degradation: current knowledge and progress in DNA analysis. In: Schotsmans EMJ, Márquez-Grant N, Forbes SL, editors. Taphonomy of human remains: forensic analysis of the dead and the depositional environment. Chichester: Wiley; 2017. p. 65–80.
- Monnier GF. A review of infrared spectroscopy in microarchaeology: methods, applications, and recent trends. J Archaeol Sci. 2018 April 1;18:806–823. Elsevier. doi:10.1016/j.jasrep.2017.12.029.
- Lebon M, Zazzo A, Reiche I. Screening in situ bone and teeth preservation by ATR-FTIR mapping. Palaeogeogr Palaeoclimatol Palaeoecol. 2014;416:110–119. doi:10.1016/j.palaeo.2014.08.001.
- Wright LE, Schwarcz HP. Infrared and isotopic evidence for diagenesis of bone apatite at Dos Pilas, Guatemala: palaeodietary implications. J Archaeol Sci. 1996;23(6):933–944. doi:10.1006/jasc.1996.0087.
- Dal Sasso G, Lebon M, Angelini I, Maritan L, Usai D, Artioli G. Bone diagenesis variability among multiple burial phases at Al Khiday (Sudan) investigated by ATR-FTIR spectroscopy. Palaeogeogr Palaeoclimatol Palaeoecol. 2016;463:168–179. doi:10.1016/j.palaeo.2016.10.005.
- Fredericks JD, Bennett P, Williams A, Rogers KD. FTIR spectroscopy: a new diagnostic tool to aid DNA analysis from heated bone. Forensic Sci Int Genet. 2012;6(3):375–380. doi:10.1016/j.fsigen.2011.07.014.
- Collins MJ, Nielsen-Marsh CM, Hiller J, Smith CI, Roberts JP, Prigodich RV, Wess TJ, Csapo J, Millard AR, Turner-Walker G. The Survival of organic matter in bone: a review. Archaeometry. 2002;44(3):383–394. doi:10.1111/1475-4754.t01-1-00071.
- Smith CI, Nielsen-Marsh CM, Jans MME, Collins MJ. Bone diagenesis in the European holocene I: patterns and mechanisms. J Archaeol Sci. 2007;34(9):1485–1493. doi:10.1016/j.jas.2006.11.006.
- Querido W, Ailavajhala R, Padalkar M, Pleshko N. Validated approaches for quantification of bone mineral crystallinity using transmission fourier transform infrared (FT-IR), attenuated total reflection (ATR) FT-IR, and Raman spectroscopy. Appl Spectrosc. 2018;72(11):1581–1593. doi:10.1177/0003702818789165.
- Leskovar T, Zupanič Pajnič I, Jerman I, Črešnar M. Preservation state assessment and post-mortem interval estimation of human skeletal remains using ATR-FTIR spectra. Aust J Forensic Sci. 2020;1–22. doi:10.1080/00450618.2020.1836254.
- Orgel JP, Miller A, Irving TC, Fischetti RF, Hammersley AP, Wess TJ. The in situ supermolecular structure of type I collagen. Structure. 2001;9(11):1061–1069. doi:10.1016/S0969-2126(01)00669-4.
- Zupanic Pajnic I, Zupanc T, Balazic J, Gersak ZM, Stojkovic O, Skadric I, Cresnar M. Prediction of autosomal STR typing success in ancient and second world war bone samples. Forensic Sci Int Genet. 2017;27:17–26. doi:10.1016/j.fsigen.2016.11.004.
- Paget E, Monrozier LJ, Simonet P. Adsorption of DNA on clay minerals: protection against DNaseI and influence on gene transfer. FEMS Microbiol Lett. 1992;97(1–2):31–39. doi:10.1111/j.1574-6968.1992.tb05435.x.