
 ?Mathematical formulae have been encoded as MathML and are displayed in this HTML version using MathJax in order to improve their display. Uncheck the box to turn MathJax off. This feature requires Javascript. Click on a formula to zoom.
Abstract
1. GNA-PEG-NLC and GNA-NLC were prepared by emulsification and low-temperature solidification methods. The optimized GNA-PEG-NLC and GNA-NLC were not only found to have small mean size (146.33 ± 2.11 and 144.07 ± 1.44) nm, high Zeta potential (−25.10 ± 1.35 and −28.03 ± 0.29) mV, but also great entrapment efficiency (79.07 ± 1.11 and 84.65 ± 0.98%). TEM proved that particles were nearly spherical with smooth surface shape. Furthermore, in vitro release revealed a burst release initially, followed by a sustained profiles up to 48 h, and the cumulative drug release of GNA-PEG-NLC and GNA-NLC was 65.90 ± 2.34% and 69.25 ± 1.77%, respectively.
2. In pharmacokinetic, GNA-PEG-NLC exhibited prolonged MRT and higher AUC values compared with GNA-NLC and GNA solution. Moreover, the tissue distribution demonstrated a high uptake of GNA-PEG-NLC in stomach.
3. These results indicated that PEG-NLC is a promising delivery system for GNA, which could prolong drug circulation time in body and thus improved its bioavailability.
Introduction
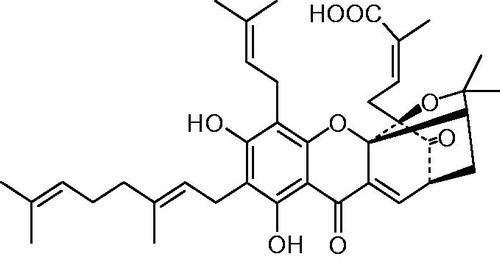
Current cancer therapy seems far away from a successful clinical application mostly due to the drug resistance, renal toxicity, organ failure, and so on. However, traditional medicine has attracted wide interest public attention in the treatment of many of cancers (Fu et al., Citation2012). Gambogenic acid (GNA, C38H47O8, ) is a main active component in Gamboge, which is a popular traditional Chinese medicine. It has been proved that GNA not only have broad spectrum of anti-tumor and strong anti-tumor activity, but also low toxicity to normal cells (Chen et al., Citation2012; Cheng et al., Citation2011; Li et al., Citation2010; Luo et al., Citation2015; Yan et al., Citation2011; Yu et al., Citation2012). Therefore, GNA has been regarded as a potential anticancer agent. However, GNA presents severe clinical side effects, primarily associated with water insoluble, excessive irritation to blood vessel, and poor bioavailability (Wang et al., Citation2012). Based on these observations, there is an urgent need to develop a better strategy for overall improvement of the therapeutic efficacy of GNA.
Figure 1. The structure of GNA.
Now, there is an increasing evidence that drug delivery system (DD) is a rapidly progressing field and is now being applied in the treatment of various cancers, which may have an effective strategy to overcome drawbacks of GNA (Lin et al., Citation2013). We previously reported on the solid lipid nanoparticles (SLNs) for GNA, which could reduce the irritation to blood vessel. The GNA-SLNs, however, suffer from drawbacks such as low encapsulation efficiency and residual organic solvent (Huang et al., Citation2013), which suggest that GNA-SLNs could not meet the demand in clinical. Thus, it is necessary for us to choose novel colloidal particulate carriers for encapsulating GNA. According to the report, nanostructured lipid carriers (NLCs) are considered as a second generation of lipid nanoparticles, which consist of solid lipids and liquid lipids. It can share advantages of SLN and minimize or avoid potential drawbacks of SLN. For example, NLC, containing high-surface area-to-volume ratios, could potentially accommodate greater quantity of drug and reduce risk of drug leakage during storage. Besides, NLC also have a lower glass transition temperature and less tendency of unpredictable gelation (Neupane et al., Citation2014). Hence, NLC may be feasible as carriers for GNA. Additionally, numerous reports have indicated that the PEG has been considered an ideal biocompatible polymer with lower toxicity, higher water solubility as well as less immunogenicity compared with other materials such as synthetic polymers, which were approved by the Food and Drug Administration (FDA). At the same time, PEG gives the surfaces of NLC a “brush” conformation, which changed the chemical properties of the surface of the nanoparticles, resulting in reduced adsorption of lipoproteins and opsonins to surfaces of drug carriers. In addition, PEG-modified nanostructured lipid carriers could prolong mean residence time (MRT) in blood as well as in various tissues and avoid rapid clearance by the reticuloendothelial system (RES) simultaneously (Liu et al., Citation2015; Luan et al., Citation2014). In this work, GNA-NLC and GNA-PEG-NLC were prepared by emulsification and low-temperature solidification methods with a purpose of prolonging drug circulation time in body and enhancing bioavailability. The physicochemical properties of GNA-NLC and GNA-PEG-NLC were studied in detail. And the pharmacokinetic studies and tissue distribution of GNA-NLC and GNA-PEG-NLC were performed in SD rats.
Materials and methods
Materials
GNA (purity: >98.0%) was isolated from gamboge in Prof. Wang Xiaoshan’s Laboratory. Stearic acid (SA) and glyceryl monostearate (GMS) were purchased from Hunan Er-Kang Pharmaceutical (Changsha, China). Polyethylene glycol 2000-stearic acid (PEG-SA) was obtained from Nanjing Well Chemical Co., Ltd. (Nanjing, China). Medium chain triglycerides of caprylic acid (MCT) came from Malaysia (Nanjing, China). Lecithin was donated by Anhui Fengyuan Pharmaceutical Co. Ltd. (Hefei, China). Poloxamer 188 was obtained from BASF (Ludwigshafen, Germany). Tween 80 was purchased from Sinopharm Chemical Reagent Co. Ltd. (Shanghai, China). Sephadex gel G-50 was purchased from Beijing Ruida Henghui Science & Technology Development Co. Ltd. (Beijing, China). Water used was doubly distilled and deionized. All other chemicals were of analytical grade.
Preparation of GNA-PEG-NLC and GNA-NLC
GNA-loaded PEG-NLC was prepared by emulsification and low-temperature solidification methods (Wang et al., Citation2014). The atmospheric pressure was the pressure of our work place. Briefly, GMS, PEG-SA, and MCT (120 mg, 40 mg, and 40 mg) were completely co-dissolved into 5 mL ethanol at 60 °C, and added with lecithin (5 mg) and GNA (10 mg) to obtain the organic phase. The F68 (80 mg) and Tween80 (80 mg) were completely dissolved in water (20 mL), which were heated at the same temperature as the aqueous phase. Then the organic phase was quickly dropped into the aqueous phase and kept stirring (1000 rpm) at 60 °C for 3h. After that, the obtained primary emulsion was quickly dispersed into cold distilled water (0–4 °C) under stirring at 1000 rpm for 2 h, and then GNA-PEG-NLC was collected. To prepare the GNA-NLC, SA was introduced into preparing process to replace PEG-SA.
Analytical method for GNA determination
The concentration of GNA was measured by reversed phase HPLC using Shimadzu LC-15C, SPD-15C system (Shimadzu Corp., Tokyo, Japan). The analytical column was a Cosmosil 5C18-MS-II column (4.6 mm × 250 mm, 5 μm) and the column temperature was set at 30 °C. The mobile phase was methanol/0.1% phosphoric acid solution (90:10, v/v) and delivered at a flow rate of 1.0 mL/min. The injection volume was 20 μL, and the detection of GNA was carried out at 360 nm. The retention time for GNA was 10.7 min and the internal standard (Gamboge acid (GA)) was 16.2 min, which has a structural analog to Gambogenic acid.
Mean particle size, polydispersity index, and Zeta potential
The mean particle size (MS), polydispersity index (PDI), and Zeta potential were assessed by Dynamic Light Scattering (Malvern Instrument, Malvern, UK). Samples were diluted appropriately with deionized water for the measurements, and each sample was measured in triplicate.
Morphological characterization
The morphological evaluation was carried out by TEM (JEM-2100, JEOL, Tokyo, Japan) with a negative-staining method. Prior to analysis, samples were diluted 30 times with double-distilled water. A drop of the sample was applied on a copper grid coated with carbon film and air-dried, and then stained with 2.0% (w/v) phosphotungstic acid. The grid was dried at room temperature and then observed by TEM. Each experiment was carried out in triplicate.
Determination of the encapsulation efficiency
The method is based on Venosa et al. (Citation2008). The unencapsulated GNA was separated from PEG-NLC and NLC using a column of Sephadex G50 (1.5 cm × 20.0 cm, Sigma, Beijing, China). In brief, GNA-PEG-NLC and GNA-NLC were demulsified with methanol and assayed for drug concentration using HPLC. The encapsulation efficiency (EE) % was determined as follows:
(1)
(1)
where WE is the concentration of GNA entrapped in the PEG-NLC and NLC; WS is the total mass of GNA used in the preparation. Each experiment was carried out in triplicate.
Differential scanning calorimetry (DSC)
The crystalline structure of the lipid nanoparticles was determined by DSC analysis using a DSC Q2000 calorimeter (TA Instrument, New Castle, DE). About 4–5 mg of samples were accurately weighed in the aluminum pans and then hermetically sealed, and empty pans were used as a reference for the samples. The thermograms of samples were obtained at a scanning rate of 10 °C/min at different temperature ranges and it was performed under a nitrogen purge (50 mL/min). Each experiment was carried out in triplicate.
Assessment of blood vessel irritation
White New Zealand rabbits weighing (2.5–3.0) kg were selected randomly and divided equally into three groups as subjects. GNA solution (PEG200 and physiological saline, PP), GNA-PEG-NLC, and GNA-NLC were administered to the three groups at 2.0 mg/kg via the right ear vein. Equivalent volume of physiological saline was administered as a reference via each left ear vein. All rabbits were treated once daily for 5 d, animals were examined for signs of irritation each day before administration throughout the administration period.
In vitro release
The release of GNA from the PEG-NLC and NLC was examined by dialysis methods. Briefly, GNA was dissolved in methanol, and then diluted with PBS (pH =7.4) so that the concentration (1 μg/L) was equal to GNA-NLC and GNA-PEG-NLC. Then 1.0 mL GNA-PEG-NLC, 1.0 mL GNA-NLC, and 1.0 mL GNA solution were put into three dialysis bags (21 mm, MWCO: 5000, Invitrogen, Carlsbad, CA) and then it was immersed in 600 mL of release medium, which consisted of phosphate-buffered saline with pH =7.4. The release study was conducted at 37 ± 0.5 °C with a stirring rate of 100 rpm. The dissolution medium of 2.0 mL was withdrawn at predetermined time interval and the same volume of fresh dissolution medium was added to the flask to maintain a constant volume at the same temperature. GNA concentrations in the dissolution medium were determined using the HPLC method in Analytical method for GNA determination section. Kinetic behavior was studied using some kinetic equations. Each releasing experiment was performed in triplicate.
In vivo studies
Sprague–Dawley rats (200–220 g, Laboratory Animal Center of Anhui Medical University, Hefei, Anhui, China) were used for pharmacokinetic and tissue distribution studies. All animal experimental procedures were strictly in accordance with Animal Ethics Committee, Anhui University of Chinese Medicine (China). Before experimentation, they were fed with standard diet with water ad libitum. Animals were kept under fasting overnight prior to experiment. There were 18 rats which were divided randomly into three groups (each group containing equal numbers of males and females in each group). GNA-PEG-NLC, GNA-NLC, and GNA solution were administered to three groups at 1.0 mg/kg via the intravenous injection. GNA was dissolved in methanol, and then diluted with physiological saline. The concentration (1 μg/L) was equal to GNA, GNA-NLC, and GNA-PEG-NLC. Then 0.2 mL blood samples were drawn by retro-orbital venous plexus puncture at predetermined time points (0.25, 0.5, 0.75, 1, 2, 3, 4, 6, 8, 12, and 24 h), and then centrifuged for 10 min at 8000 rpm.
The plasma was removed and stored at 4 °C until HPLC analysis. The pharmacokinetic parameters were calculated by DAS2.0 software (Chinese Pharmacological Society, Beijing, China).
Tissue distribution studies were carried out in SD rats. They were divided into three groups and administered with three types of formulations (GNA-PEG-NLC, GNA-NLC, and GNA solution). At predetermined time points (0.5 h, 4 h, 12 h, and 24 h), and interested tissues (heart, liver, spleen, lung, kidney, brain, small intestine, and stomach) were excised immediately.
Prior to the determination of GNA concentration in blood and tissue samples by HPLC method as mentioned in Analytical method for GNA determination section, each sample was treated as following procedures such as liquid–liquid extraction. Plasma (100 μL) or homogenized tissue (100 μL) was mixed with an internal standard (GA, 10 μL) and 1200 μL of ethylacetate were added to the 1.5 mL centrifuge tube. After vortexed for 3 min, the sample was centrifuged at 12 000 rpm for 10 min, and the supernatant fluid (800 μL) was collected. Subsequently, the supernatant fluid was dried under a stream of nitrogen gas, and the residue was reconstituted in 100 μL methanol. Following filtration, 20 μL of sample solution was injected into the HPLC system.
The tissue targeting efficiency was evaluated using the drug targeting index (Re) described as follows:
(2)
(2)
where (AUCI)F is the AUC of tissue I of NLC formulations group and (AUCI)S is the AUC of tissue I of the solution group, and the value of Re > 1 was considered as the targeting distribution.
Statistical analysis
The statistical analysis of the figures and tables were performed by Student's t-test or ANOVA test. Differences were considered significant when the p value was less than 0.05, although p value less than 0.01 was considered highly significant. Results were expressed as a mean ± SD (n = 3).
Results and discussion
Characteristics of GNA-PEG-NLC and GNA-NLC
In this study, the mean diameter of the optimized GNA-PEG-NLC and GNA-NLC was 146.33 ± 2.11 nm and 134.07 ± 1.44 nm, respectively, which could attribute to the fact that the PEG was grafted onto the surface of NLC as a result of forming a steric hindrance on NLC surface (Kumar et al., Citation2011; Su et al., Citation2012). It is noteworthy to mention that PDI value of GNA-PEG-NLC and GNA-NLC is less than 0.05, which indicated that GNA-PEG-NLC and GNA-NLC possessed an enough homogeneous drug delivery systems.
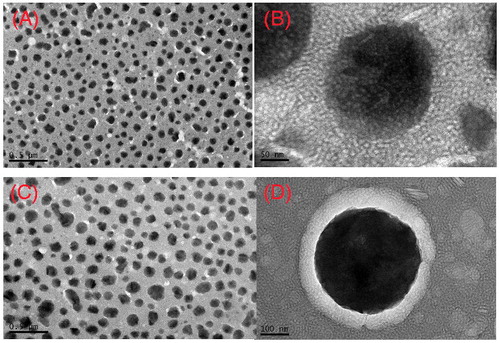
The analysis of Zeta potential is a useful way to predict the physical storage of drug delivery systems. Higher Zeta potential values indicated greater repulsion between the particles and particle, and then the aggression is less likely to occur. In this study, Zeta potential of them was −25.10 ± 1.35 mV and −28.03 ± 0.29 mV. The negative Zeta potential of GNA-PEG-NLC and GNA-NLC could be due the presence of negatively charged phosphate head groups. Furthermore, the lower Zeta potential of GNA-PEG-NLC attributed to the fact that PEG chains located on the surface of the NLC reduced the surface charge. An entrapment efficacy of GNA-PEG-NLC and GNA-NLC was 79.07 ± 1.11% and 84.65 ± 0.98%, respectively. The EE% of GNA-PEG-NLC was lower compared with GNA-NLC; there was no statistically significant difference in the entrapment efficacy of the two NLC formulations with or without PEG. This phenomenon should be interpreted by three reasons. To begin with, polyethylene glycol stearate (PEG-SA), is a solid lipid providing the hydrophilic group, has increased the solubility of GNA in the aqueous phase, and thus obstructed GNA enters into the lipid core of nanoparticles during the formation of GNA-PEG-NLC. Furthermore, the partial substitution of GMS by PEG-SA decreased the amount of GMS which could adsorb more drugs. The last but not the least, this could contribute to the longer PEG chain making GNA-PEG-NLC structure more loose and lead to EE% lower. TEM was carried out to get more information about morphology characteristics of the GNA-PEG-NLC and GNA-NLC. ) shows the images of GNA-PEG-NLC and GNA-NLC with different magnifications. Both images showed that the GNA-PEG-NLC and GNA-NLC particles were nearly spherical or quasi-spherical with smooth surface in shape, and no aggregation was found between the particles. The peripheral microstructures of particles could be clearly visualized under high-power magnification (). There is obvious conformational cloud around the particles, which is different from the rotiform in the previous study (Jia et al., Citation2012). It means that GNA-PEG-NLC constructed more complete “brush” structures. PEG is an uncharged, water-soluble polymer. PEG gives the surface of NLC nanoparticles a “brush” conformation of the chains, which change the chemical properties of the surface of the nanoparticles. TEM size was smaller than those measured by DLS. The reason could be attributed to the shrinking of the hydrophilic backbone during the sample preparation for TEM. It was noted that measurement principle of DLS and TEM was different. TEM was determined the size of dry particles, while DLS was determined the hydrodynamic diameters of particles in water.
Figure 2. Transmission electron microscopy micrographs of NLCs: (A and B) GNA-NLC and (C and D) GNA-PEG–NLC.
Differential scanning calorimetry (DSC)
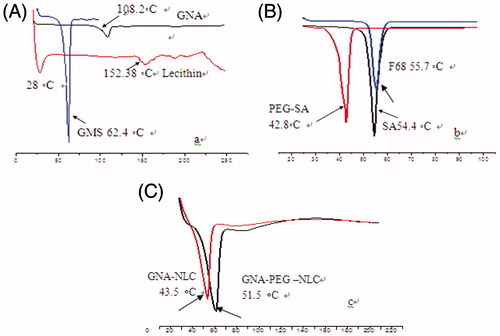
In order to investigate the change of nanoparticles crystalline structure, DSC experiments were performed. ) shows DSC curves of physical mixtures (pure GMS, SA, PEG-SA, F68, lecithin, GNA) and GNA-NLC as well as GNA-PEG-NLC. Thermograms of bulk GMS, SA, PEG-SA, F68, lecithin, and GNA exhibited an endothermic peak at 62.4 °C, 54.4 °C, 42.8 °C, 55.7 °C, 152.38 °C, and 108 °C, respectively, Corresponding to their melting temperatures in ), the thermograms of NLC formulations showed disappearance of the GNA melting endotherm due to the distribution of GNA inside the NLC, and an intense peak shifted toward slower temperature (). The GNA-NLC showed lower main melting transition peak temperature about 8 °C when compared with GNA-PEG-NLC, which suggested that imperfection in the crystal lattice of GNA-NLC may be more than GNA-PEG-NLC. It has been, therefore, assumed that the shift of Tm to higher temperature is a consequence of longer PEG chain.
Figure 3. (A–C) DSC curves of each the components of the formulations and GNA, and NLC formulations.
In vitro release
In general, the release rate of drug is important to drug delivery systems, which could give a correlation with the in vivo performance. gives the releasing profiles of GNA formulations. Obviously, the release of GNA from GNA-PEG-NLC and GNA-NLC was slower than GNA solution. The release of GNA from GNA-NLC followed the Weibull equation and can be expressed by the following equation: ln(1/(1−Q/100)) = 0.5659lnt − 1.9378 (r = 0.9901). The cumulative amount of GNA released was 69.25 ± 1.77% up to 48 h. The release of GNA from GNA-PEG-NLC also followed the Weibull equation and can be expressed by the following equation: ln(1/(1−Q/100)) = 0.5562lnt − 1.8273(r = 0.9884). The cumulative amount of GNA released was 65.90 ± 2.34% up to 48 h. There was no statistically significant difference in the release of the two NLC formulations with or without PEG. Compared with NLC formulations, the release of GNA from GNA solution followed the Higuchi equation and can be expressed by the following equation: Q = 34.232t½+0.9417(r = 0.9704). The release of GNA from GNA solution was fast and absolute, and approximately 97.85%.
Figure 4. Release profiles of GNA from GNA-PEG-NLC and GNA-NLC in PBS pH 7.4 at 37 °C (n = 3).
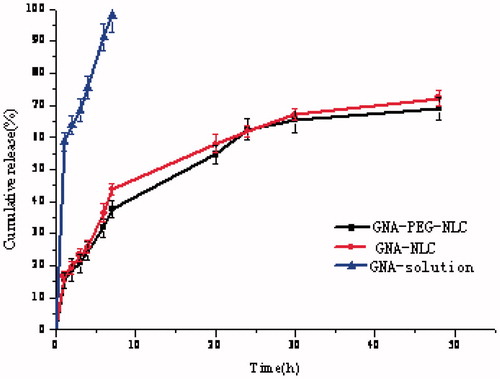
As can be seen in , a biphasic drug release pattern was obvious. The relative fast drug release was observed at the initial 7 h. After then, GNA release displayed sustained profiles, which would help in sustaining the drug available for a longer period of time. According to the previous study, the GNA in the outer shell was possible reason for the burst release while desorption and diffusion of GNA through the lipid bilayer caused the slower release phase (Wang et al., Citation2014). Meanwhile, the release of GNA-loaded PEG-NLC was slower than NLC. This could be explained by the alkaline pH-induced deformation of the core–shell structure of GNA-PEG-NLC.
Assessment of blood vessel irritation
The GNA solution, GNA-NLC, and GNA-PEG-NLC were injected via the right ear vein to evaluate the blood vessel irritation. The morphology of ear vein is shown in ). As could be seen, there was slight swelling and a little inflammatory substances after injection in the GNA-PEG-NLC, Blank-PEG-NLC, GNA-NLC, and Blank NLC. And no significant difference was observed. As shown in , the ear vein was intact after injection with PEG200 and physiological saline.
Figure 5. Representative photomicrographs of vein damage caused by injection GNA-PEG–NLC (A), Blank PEG NLC (B), GNA-NLC (C), Blank NLC (D), GNA-solution (E), and PEG200 + 0.9% NaCl solution (F) (×100).
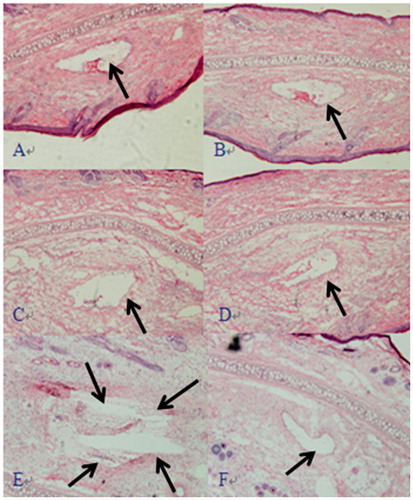
As shown in , the vein was damaged seriously. There was significant congestion, swelling, necrosis, and much thrombosis. In summary, the blood vessel irritation of GNA was reduced greatly by NLC and PEG-NLC. The possible reason was that GNA was loaded in NLC and PEG-NLC, and the direct contact with the vascular endothelium was deduced or avoided.
In vivo studies
The in vivo performance of GNA-PEG-NLC and GNA-NLC was characterized extensively, such as their pharmacokinetics and tissue distributions.
Pharmacokinetics study
In vivo behavior of GNA formulations was investigated in detail by i.v. administration to SD rats. The profiles of plasma concentration versus time after i.v. administration of 1.0 mg/kg GNA-PEG-NLC, GNA-NLC, and GNA solution is shown in . Free GNA was cleared rapidly from the plasma following i.v. administration, while the other two formulations displayed markedly prolonged residence time of GNA in blood circulation. And the main pharmacokinetic parameters are presented in . It was apparent that the area-under-the-plasma concentration–time curve (AUC) of GNA-PEG-NLC (22.192 ± 2.33 mg/L min) was significantly higher about 1.75-folds (p < 0.05) and 10.21-folds (p < 0.01) compared with that of GNA-NLC (12.675 ± 3.47 mg/L min) and GNA solution (2.173 ± 0.71 mg/L min), respectively. The Cmax values of GNA-PEG-NLC were estimated to be 1.59 ± 1.92 μg/L, which was 1.25-folds higher than that of GNA-NLC and 3.05-folds higher than that of free GNA solution. The MRT value of GNA-PEG-NLC and GNA-NLC was 3.983 ± 0.25 h and 3.361 ± 0.31 h (p < 0.05), respectively, which significantly longer than that of free GNA solution (2.08 ± 0.20 h) (p < 0.01). That could contribute to the stealth effect of PEGylation, which prevented rapid clearance of particles by the RES and also prevented the contact of particles with proteolytic enzymes (Abe and Higashi, Citation2015; Jia et al., Citation2012; Jokerst et al., Citation2011). These results deduced that GNA-PEG-NLC is a promising delivery system for GNA, which could prolong drug circulation time in body and thus improved its bioavailability. Meanwhile, the results suggested the idea that PEGylation helped to stabilize the in vivo behavior of the NLC, which is consistent with Kim report (Kim et al., Citation2015).
Figure 6. Mean concentration time profile of GNA in plasma following i.v. administration of a single dose of 1.0 mg/kg GNA-PEG-NLC, GNA-NLC, and GNA-solution to rats (n = 6).
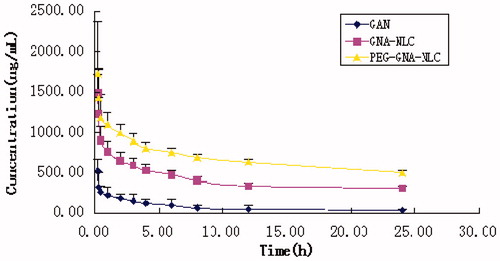
Table 1. The main pharmacokinetic parameters of GNA of plasma following i.v. to rats (n = 6).
Tissue distributions
That has no doubt that targeted delivery of GNA is crucial to improve the therapeutic efficacy. Thus, it is necessary for us to test the targeting efficacy of GNA-PEG-NLC and GNA-NLC in vivo. The SD rats’ organs were collected at predetermined time interval (0.5 h, 4 h, 12 h, and 24 h). Each time, 12 rats were harvested, and four rats for GNA-PEG-NLC, four rats for GNA-NLC, and four rats for GNA-solution. The results showed that the distributions GNA-PEG-NLC, GNA-NLC, and GNA solution were significantly different in all tissues. As can be seen in , in some tissues, the values of AUC0–t for GNA-PEG-NLC are higher than that of GNA-NLC and GNA solution. And in , all Re values (relative uptake efficiency of drug in tissue and considered as the targeting distribution) were greater than 1 except brain of GNA-PEG-NLC. That is to say, the accumulation of GNA in tissues was improved significantly, indicating that rapid metabolism of GNA was avoided due to encapsulation of NLC carriers. The orders of Re value of GNA-PEG-NLC and GNA-NLC were as follows: stomach (10.30) > kidney (4.74) > lung (4.53) > intestine (4.19) > spleen (4.13) > liver (2.86) > heart (2.48) > brain (-), stomach (11.06) > brain (8.10) > spleen (5.68) > liver (5.01) > kidney (3.12) > intestine (3.05) >lung (3.02) > heart (2.59).
Figure 7. The AUC0–t of GNA-solution, GNA-NLC, and GNA-PEG-NLC in tissue following i.v. to rats.
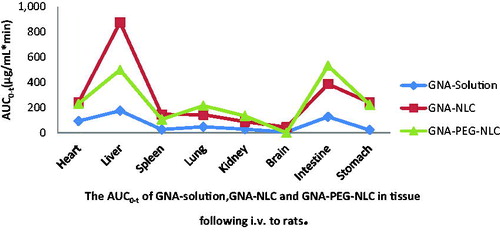
Figure 8. The Re values of GNA-NLC and GNA-PEG-NLC in tissue following i.v. to rats.
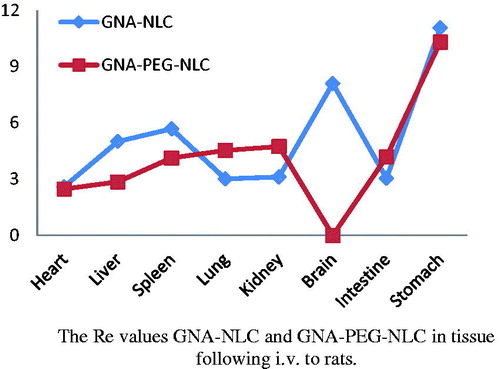
Particularly, four highlights are still to be stressed. (1) In this study, GNA-NLC was found to be taken up to a greater extent by the brain and maintained high levels of drug compared with GNA solution. The AUC0–t for GNA-NLC increased from 5.44 to 44.08 and the value of Re is 8.10, indicating that the GNA-NLC for brain targeting was very good. However, GNA was detected in the brain only at 0.5 h after GNA-PEG-NLC i.v administration, and Cmax was only 0.152 μg/mL (the data were not showed). It indicated that GNA-PEG-NLC which we prepared and passed the blood–brain barrier was scant. (2) The Re value of stomach of GNA-PEG-NLC was greatest in all organs. The possible explanation is that GNA-PEG-NLC is lymphatic targeting and reveals a higher absorption profile into the lymphatic system than that GNA solution by i.v administration. And the previous studies demonstrated that the blank nanoparticles were targeted to lymphatic system, and accumulation of blank-nanoparticles in lymph nodes was significantly higher than free drug (Bajaj et al., Citation2012; Kim et al., Citation2010; Lu et al., Citation2007). (3) GNA content in lung of GNA-PEG-NLC group was marked greater than the GNA-NLC group (p < 0.05), and the value of Re was 4.53, indicating that the target to lung was improved because of PEG modification, which means PEG chain around the shell of NLC improves the hydrophilicity to evade the opsonization. Those results were no different from studies of Magdalena et al. (Citation2015). (4) GNA concentration in liver and spleen of GNA-PEG-NLC was much lower than of GNA-NLC. However, GNA content in kidney increased mildly. The possible reason is that macrophages are also found in the periphery of the kidney addition to the organs of the mononuclear phagocytic system (liver and spleen), so the GNA-PEG-NLC was cumulated in kidney.
Conclusion
In the present work, GNA-PEG-NLC was successfully obtained by emulsification and low-temperature solidification methods, with higher EE%, smaller mean size, and greater Zeta potential. In vitro release revealed that a burst was released initially and followed by a sustained profile up to 48 h. In vivo pharmacokinetics evaluation demonstrated that the prolonged drug circulation time in body and high AUC value in GNA-PEG-NLC, which was attributed to the PEG chain. The tissue distribution demonstrated that GNA-PEG-NLC uptakes into the stomach should be specific. Hence, it is showed that GNA-PEG-NLC is a promising delivery system for GNA, which could to prolong drug circulation time in body and thus improved its bioavailability.
Declaration of interest
The authors declare that there are no conflicts of interest. Tongyuan Lin and Xia Huang contributed equally to this work. This work was financially supported by National Special Science and Technology Major of “Significant New Drugs Innovation and Development” key Projects (2009ZX09103-399), Key University natural science research project of Anhui province (KJ2011A190).
References
- Abe K, Higashi K. (2015). Effects of the PEG molecular weight of a PEG-lipid and cholesterol on PEG chain flexibility on liposomes surfaces. Colloids Surf A: Physicochem Eng Asp 17:1–9
- Bajaj G, Kim MR, Mohammed SI, et al. (2012). Hyaluronic acid-based hydrogel for regional delivery of paclitaxel to intraperitoneal tumors. J Control Release 158:386–92
- Chen HB, Zhou LZ, Mei L, et al. (2012). Gambogenic acid-induced time-and dose-dependent growth inhibition and apoptosis involving Akt pathway inactivation in U251 glioblastoma cells. J Nat Med 66:62–9
- Cheng H, Su JJ, Peng JY, et al. (2011). Gambogenic acid inhibits proliferation of A549 cells through apoptosis inducing through up-regulation of the p38 MAPK cascade. J Asian Nat Prod Res 11:993–1002
- Fu W, Zhang JF, Wang H, et al. (2012). Apoptosis induced by 1,3,6,7-tetrahydroxyxanthone in hepatocellular carcinoma and proteomic analysis. Apoptosis 17:842–51
- Huang X, Chen YJ, Peng DY, et al. (2013). Solid lipid nanoparticles as delivery systems for Gambogenic acid. Colloids Surf B: Biointerfaces 102:391–7
- Jia LJ, Shen JY, Zhang D, et al. (2012). In vitro and in vivo evaluation of oridonin-loaded long circulating nanostructured lipid carriers. Int J Biol Macromol 50:523–9
- Jokerst JV, Lobovkina T, Gambhir SS. (2011). Nanoparticle PEGylation for imaging and therapy. Nanomedicine (Lond) 6:715–28
- Kim B, Han G, Toley BJ, et al. (2010). Tuning payload delivery in tumour cylindroids using gold nanoparticles. Nat Nanotechnol 5:465–72
- Kim JH, Kim Y, Bae KH, et al. (2015). Tumor-targeted delivery of paclitaxel using low density lipoprotein-mimetic solid lipid. Nanopart Mol Pharm 11:33–9
- Kumar MR, Aithal BK, Udupa N, et al. (2011). Formulation of plumbagin loaded long circulating pegylated liposomes: in vivo evaluation in C57BL/6J mice bearing B16F1 melanoma. Drug Deliv 18:511–22
- Lee SB. Fractionated products obtained from Gamboge resin, and medical uses of the same, Patent, United States, US201110305784A1
- Li QL, Cheng H, Zhu G, et al. (2010). Gambogenic acid inhibits proliferation of A549 cells through apoptosis-inducing and cell cycle arresting. Biol Pharm Bull 33:415–20
- Lin TY, Fang Q, Peng DY, et al. (2013). PEGylated nonionic surfactant vesicles as drug delivery systems for Gambogenic acid. Drug Deliv 20:277–84
- Liu X, Zhang Z, Jiang Y, et al. (2015). Novel PEG-grafted nanostructured lipid carrier for systematic delivery of a poorly soluble anti-leukemia agent Tamibarotene: characterization and evaluation. Drug Deliv 22:223–9
- Lu H, Li B, Kang Y, et al. (2007). Paclitaxel nanoparticle inhibits growth of ovarian cancer xenografts and enhances lymphatic targeting. Cancer Chemother Pharmacol 59:175–81
- Luan JJ, Zhang DR, Hao L, et al. (2014). Preparation, characterization and pharmacokinetics of Amoitone B-loaded long circulating nanostructured lipid carries. Colloids Surf B: Biointerfaces 114:255–60
- Luo Q, Lin TY, Zhu T, et al. (2015). A novel glyceryl monoolein-bearing cubosomes for Gambogenic acid: preparation, cytotoxicity and intracellular uptake. Int J Pharm 493:30–9
- Magdalena H-B, Bednarowicz M, Dobosz B, et al. (2015). Doxorubicin loaded PEG-b-poly(4-vinylbenzylphosphonate)coated magnetic iron oxide nanoparticles for targeted drug delivery. J Magn Magn Mater 384:320–7
- Neupane YR, Srivastava M, Ahmad N, et al. (2014). Lipid based nanocarrier system for the potential oral delivery of decitabine: formulation design, characterization, ex vivo, and in vivo assessment. Int J Pharm 477:601–12
- Su W, Wang H, Wang S, et al. (2012). PEG/RGD-modified magnetic polymeric liposomes for controlled drug release and tumor cell targeting. Int J Pharm 426:170–81
- Venosa GD, Hermida L, Batlle A, et al. (2008). Characterisation of liposomes containing aminolevulinic acid and derived esters. J Photochem Photobiol B: Biol 92:1–9
- Wang DL, Zhan R, Tao XH, et al. (2012). Determination of Gambogenic acid and its pharmacokinetics in rat plasma by HPLC. Chin Pharmacol Bull 28:1164–7
- Wang L, Luo Q, Lin TY, et al. (2014). PEGylated nanostructured lipid carriers(PEG-NLC) as a novel drug delivery system for Biochanin A. Drugs Dev Ind Pharm 6:1–9
- Wang Q, Cheng HL, Zhou K, et al. (2014). Nanostructured lipid carriers as a delivery system of biochanin A. Drug Deliv 20:331–7
- Yan F, Wang M, Chen H, et al. (2011). Gambogenic acid mediated apoptosis through the mitochondrial oxidative stress and inactivation of Akt signaling pathway in human nasopharyngeal carcinoma CNE-1 cells. Eur J Pharmacol 652:23–32
- Yu XJ, Han QB, Wen ZS, et al. (2012). Gambogenic acid induces G1 arrest via GSK3β-dependent cyclin D1 degradation and triggers autophagy in lung cancer cells. Cancer Lett 322:185–94