
 ?Mathematical formulae have been encoded as MathML and are displayed in this HTML version using MathJax in order to improve their display. Uncheck the box to turn MathJax off. This feature requires Javascript. Click on a formula to zoom.
Abstract
1. We have applied the concept of using MBIs to produce CYP-Silensomes to quantify the contribution of the major CYPs to drug metabolism (fmCYP).
2. The target CYPs were extensively and selectivity inhibited by the selected MBIs, while non-target CYPs were inhibited by less than 20% of the homologous control activities. Only CYP2D6-Silensomes exhibited a CYP2B6 inhibition that could be easily and efficiently encountered by subtracting the fmCYP2B6 measured using CYP2B6-Silensomes to adjust the fmCYP2D6.
3. To validate the use of a panel of 6 CYP-Silensomes, we showed that the fmCYP values of mono- and multi-CYP metabolised drugs were well predicted, with 70% within ± 15% accuracy. Moreover, the correlation with observed fmCYP values was higher than that for rhCYPs, which were run in parallel using the same drugs (<45% within ±15% accuracy). Moreover, the choice of the RAF substrate in rhCYP predictions was shown to affect the accuracy of the fmCYP measurement.
4. These results support the use of CYP1A2-, CYP2B6-, CYP2C8-, CYP2C9-, CYP2D6 and CYP3A4-Silensomes to accurately predict fmCYP values during the in vitro enzyme phenotyping assays in early, as well as in development, phases of drug development.
Introduction
The pharmacokinetics of a drug can be influenced by many extrinsic and intrinsic factors (Huang & Rowland, Citation2012). These factors can result in an increase in drug exposure above the therapeutic window and lead to potentially life-threatening side-effects or, conversely, in a decrease in drug exposure below the therapeutic window and thus, a lack of therapeutic effect. Extrinsic factors that may impact drug pharmacokinetics include drug–drug interactions (DDIs) (the most well-known and common), as well as interactions caused by food, herb, or pollutant components. Genetic polymorphisms, physiological state e.g. pregnancy, disease e.g. inflammation or hepatic impairment, as well as age, are some of the intrinsic factors that may also contribute to the inter-individual variability of drug pharmacokinetics (PK) (Huang & Rowland, Citation2012). All these factors will have an impact on the major determinants of the PK of a drug i.e. drug transporters and metabolic enzymes. Cytochrome P450s (CYPs) are the major enzymes contributing (90% of the enzymatic reactions) to the metabolism of small molecules currently on the market (Rendic & Guengerich, Citation2015); therefore, in order to manage the impact of intrinsic and extrinsic factors on the PK of new drug candidates (new chemical entities (NCEs)), it is crucial to be able to identify and quantify the contribution of CYP to its metabolism (i.e. the “fmCYP”). To address this, in the last 10 years, the European Medicine Agency (EMA) and Food and Drug Administration (FDA) have proposed guidelines on how to conduct DDI in vitro studies (EMA, Citation2012; FDA, Citation2017) and, in particular CYP reaction phenotyping assays, to estimate the fmCYP of NCEs. The fmCYP is a key parameter used to predict the impact of a co-administered drug (also called the “perpetrator”) or other extrinsic or intrinsic factors on the clearance of the NCE, especially those with a narrow therapeutic window. According to the guidelines, if an enzyme contributes to more than 25% of the elimination of the NCE then a clinical DDI study must be conducted to confirm the risk of a DDI. It is therefore crucial to have an in vitro model robust and accurate enough to be able to quantitatively measure fmCYP.
Currently, several in vitro models are available for in vitro phenotyping assays. The most often used assays include: (1) recombinant CYPs (rhCYPs), (2) hepatocytes or human liver microsomes (HLMs) in the presence or absence of chemical CYP specific inhibitors or antibodies and (3) correlation analysis using multiple batches of HLMs (Ogilvie et al., Citation2008; Parmentier et al., Citation2007; Wienkers & Stevens, Citation2003). Despite the advantages of these models, in particular rhCYPs, they also suffer from many drawbacks that prevent them from being used alone such that more than one model must be conducted in order to derive a definitive fmCYP value. For rhCYPs, these include: the host system being of non-human origin; not being representative of in vivo (Crespi & Penman, Citation1997; Roy et al., Citation1999; Venkatakrishnan et al., Citation2000; Zhang et al., Citation2007), and the requirement for pre-testing for the “relative activity factor” (RAF), to extrapolate individual CYPs to HLM activities (Parmentier et al., Citation2007, Citation2017). Incubations with chemical inhibitors require protocol modifications, depending on the inhibitor turnover, microsomal binding and the concentration of the substrate, and may be less predictive due to a lack of specificity and potency of inhibition. Correlation analysis is a qualitative method and may lack statistical power to identify CYPs when multiple forms are involved in the metabolism of a test compound. Moreover, no single assay can provide a robust and quantitative fm value for different CYPs, therefore, some uncertainty may remain regarding the need for conducting an expensive DDI clinical study.
Our previous studies (Parmentier et al., Citation2017), investigated the suitability of a novel in vitro CYP3A4 phenotyping assay, called CYP3A4-Silensomes™, to address the various drawbacks of the current in vitro CYP phenotyping assays. Silensomes™ are human pooled HLMs irreversibly inactivated for one specific CYP using mechanism-based inhibitors (MBI). The advantages of this method are that it is a human derived in vitro model, representative of the in vivo CYP profile that can directly quantify the fmCYP under standard conditions without the need for pre-tests or a positive control. The use of MBIs means the extensive and selective “silencing” of a CYP is irreversible. We have extended this work to include CYP-Silensomes™ (referred to as “CYP-Silensomes”) for CYP1A2, CYP2B6, CYP2C8, CYP2C9 and CYP2D6 enzymes. We demonstrate that, through ensuring a long-lasting, complete and specific CYP inhibition, CYP-Silensomes constitute a reliable, easy- and ready-to-use model that allows the accurate prediction of the in vivo contribution of the major human CYP to the metabolism of a specific drug or NCE. These data support the use of CYP-Silensomes to accurately predict the risk of drug-drug interaction for a drug as a victim drug.
Materials and methods
Chemicals
Testosterone, 6-beta-hydroxytestosterone, midazolam, 1′-hydroxymidazolam, nifedipine, oxidised nifedipine, phenacetin, paracetamol, omeprazole, paclitaxel, diclofenac, 4′-hydroxydiclofenac, dextromethorphan, dextrorphan, chlorozoxazone, 6-hydroxychlorzoxazone, amodiaquine, desethylamodiaquine, S-mephenytoin, 4′-hydroxymephenytoin, loperamide, mirtazapine, domperidone, tamsulosin, repaglinide, ramelteon, melatonine, propranolol, pioglitazone, furafylline, paroxetine, ammonium formiate, NADPH, MgCl2, trizma base, bovine serum albumin were purchased from Sigma Aldrich (St. Louis, MO, USA); Tasimelteon, gemfibrozyl glucuronide from Toronto Research Chemicals (North York, Canada); hydroxybupropion, 6α-hydroxypaclitaxel, azamulin, tienilic acid from Corning (New York, NY, USA); 5-hydroxyomeprazole from Synfine Research (Richmond Hill, Canada); Sibutramide, carvedidol from National Institutes for Food and Drug Control (Beijing, China); Losartan, glimepiride from TCIchemicals (Shanghai, China); Bupropion from TCIchemicals (Shanghai, China) and Sigma Aldrich (St. Louis, MO, USA); Rasagiline from jkchemical (Beijing, China), celecoxib, ibuprofen, sertraline from jkchemical (Beijing, China) and Sigma Aldrich (St. Louis, MO, USA); ThioTepa from Acros Organics (Geel, Belgium) formic acid, dimethyl sulfoxide and acetonitrile from MERCK (Darmstadt, Germany) and methanol from PROLABO (Fontenay-sous-Bois, France).
Source of Silensomes and rhCYPs
Batches of Silensomes were provided by Biopredic International (Saint-Grégoire, France). Bactosomes heterologously expressing individual human CYPs (rhCYPs) were purchased from Cypex (Dundee, UK). All Silensomes and bactosomes were stored at approximately −80 °C until use.
Preparation of Silensomes and homologous controls
CYP-Silensomes and homologous control-Silensomes were prepared using the method previously described for the preparation of CYP3A4-Silensomes (Parmentier et al., Citation2017). The MBIs used for CYP1A2-, CYP2B6-, CYP2C8-, CYP2C9- and CYP2D6-Silensomes were furafylline, thio-TEPA, gemfibrozil glucuronide, tienilic acid and paroxetine, respectively. The homologous control-Silensomes were prepared under the same conditions, except that the inhibitor was replaced by an equivalent volume of solvent.
CYP inhibition potency and specificity
The CYP specificity and inhibition potency were assessed by incubating CYP-Silensomes and control-Silensomes with selective CYP substrates and measuring the specific activities under initial rate and saturation conditions. To this end, CYP-Silensomes and control-Silensomes were pre-incubated for 5 min in Tris (0.1 M, pH 7.4) or phosphate (0.1 M, pH 7.4 for CYP1A2-Silensomes) buffer, 5 mM MgCl2 with each substrate at 37 °C in a shaking water bath. Reactions were started by adding 1 mM NADPH and were terminated by protein precipitation. The conditions of incubation are given in and . Each sample was then vortex mixed and allowed to stand on ice for 10 min, after which it was centrifuged. The supernatants were analysed using liquid chromatography with tandem mass spectrometry detection (LC–MS/MS).
Table 1. Conditions for CYP-Silensomes incubations.
LC/MS/MS analysis of samples
Supernatants were analysed using liquid chromatography UPLC Acquity, I-Class or H -Class Acquity system (Waters, Milford, MA, USA) or Agilent HP1100 (Agilent Technologie, Santa Clara, CA, USA) with tandem mass spectrometry detection API4000, AB6500 (Sciex, Framingham, MA, USA), Waters Xevo TQ-S (Waters Milford, MA, USA) or Ultima Mass Spectrometer (Waters, Milford, OR, USA) to measure the drug depletion, the CYP-specific metabolite formation or the MBI concentrations.
Intrinsic clearance measurement in CYP-Silensomes and control-Silensomes
Twenty one references drugs (0.1 µM) were incubated at least in triplicate with CYP1A2-, CYP2B6-, CYP2C8-, CYP2C9-, CYP2D6-, and CYP3A4-Silensomes (one or two different batches) and their homologous control-Silensomes at protein concentrations of 0.1–2 mg/ml, allowing optimal measurement of their intrinsic clearance (Clint) (linearity with protein concentration). Drug depletion was determined after 0, 7, 17, 30 and 60 min of incubation. Incubation conditions, treatment of samples and analysis were similar to those described above for Silensomes incubations.
Intrinsic clearance measurement in rhCYPs and determination of relative activity factor
In order to normalise formation rates obtained with rhCYPs, the relative activity factor (RAF) was used (Crespi & Penman, Citation1997; Venkatakrishnan et al., Citation1998) and was calculated with the following equation:
(1)
(1)
rhCYPs were characterised for their CYP metabolic activities (CYP1A2, CYP2B6, CYP2C8, CYP2C9, CYP2C19, CYP2D6 and CYP3A4) using the same conditions as detailed above and the in vitro Clint was determined - except rhCYP2B6 (Clint derived from Vmax/Km determination). RAF values established for each batch of rhCYP (several batches used per CYP) were: 90–101 for CYP1A2, 2.3–4.5 for CYP2B6, 17.4–69 for CYP2C8, 2.8–3.1 for CYP2C9, 75 for CYP2C19, 26–41 for CYP2D6, 7.4–9.8 and 15.3–49 for CYP3A4 determined respectively with testosterone and nifedipine.
The Clint of 21 reference drugs tested (0.1 µM) in CYP-Silensomes were also incubated with rhCYPs. The concentrations of bactosomal protein incubated with drugs were the same as those selected for the CYP-Silensomes and their control (see above) but corrected using the RAF for each CYP isoform (i.e. the selected HLM concentration divided by RAF isoform). The drug depletion was determined after 0, 7, 17, 30 and 60 min of incubation. Treatment of samples and analysis were similar as those described above for Silensomes.
Measurement of total MBI concentration in target CYP-silensomes
To measure the remaining total concentration of each MBI (except for the fraction of MBI irreversibly bound to CYP) after their preparation process, each batch of CYP1A2-, CYP2B6-, CYP2C8-, CYP2C9-, CYP2D6- and CYP3A4-Silensomes was precipitated with methanol. Each sample was vortex mixed and was centrifuged at approximately 1700g for 10 min. The supernatant was retained and samples were analysed using LC–MS/MS to quantify MBIs. This concentration was compared to the initial MBI concentration (expressed as %).
(2)
(2)
Where Cs is the total MBI concentration in the supernatant (µM), Ci is the initial MBI concentration (µM).
Data analysis for estimation of Clint
The in vitro Clint (mL/min. g protein) was determined by substrate depletion (where substrate concentration gave the maximal clearance), using the following equation:
(3)
(3)
where “Slope” is the elimination rate constant (min−1) for exponential substrate loss, “Vol” is the incubation volume (mL), and “prot” is the microsomal protein (mg) in incubation.
Estimation of the in vitro CYP contribution (fmCYP) to drug metabolism
For the Silensomes approach, the fmCYP was estimated by the ratio of Clint values in CYP-Silensomes (Clint SiL, mL/min. g HLM protein) and in homologous control-Silensomes (Clint cSiL, mL/min. g HLM) for CYP1A2, CYP2B6, CYP2C8, CYP2C9, CYP2D6 and CYP3A4.
The fmCYP for each CYP enzyme was estimated using the following equation:
(4)
(4)
The limit of detection for the fmCYP depends on the high selectivity of CYP-silensomes and the experimental uncertainty. In the present work, the experimental variability (from the in vitro incubations and analytical methods) for the measurement of the Clint values was set at 20%. Therefore, at the lowest fmCYP, CYP-Silensomes can be reliably determined to be 20% (i.e. the “limit of detection” for CYP1A2, CYP3A4, CYP2B6, CYP2C8, CYP2C9 and CYP2D6 contribution). CYP inhibition lower than 20% was not considered to be a significant net CYP contribution.
For the rhCYP approach, the fmCYP was calculated using the ratio of Clint values in rhCYP and the sum of all rhCYP tested i.e. CYP1A2+ CYP2B6 + CYP2C8 + CYP2C9 + CYP2C19 + CYP2D6 + CYP3A4, considering that no other oxidative pathway was involved in the drug metabolism. Clint values in rhCYPs were expressed as mL/min. g protein, with the protein concentration being a human liver microsome equivalent protein concentration calculated using the RAF from each isoform (HLM concentration divided by RAF isoform).
(5)
(5)
Estimation of in vivo CYP contribution to drug metabolism
The in vivo CYP contributions (fmCYP for CYP1A2, CYP2B6, CYP2C8, CYP2C9, CYP2C19, CYP2D6 and CYP3A4) to the metabolism of the drugs selected for the validation of Silensomes were calculated using the equation adapted from Rowland & Matin (Citation1973) and Guest et al. (Citation2011):
(6)
(6)
where fmCYPi is the fraction of substrate drug metabolised by the inhibited pathway via a CYP, fhepCYP is the fraction of hepatic CYP-dependent drug metabolism, [I] is the inhibitor concentration available to the enzyme site, KI the constant of inhibition for the inhibitor, and subscript i indicates the presence of the inhibitor. If the non-CYP clearance of the drug was not negligible (renal or phase II metabolism), fhepCYP was estimated by the following equation:
(7)
(7)
where Clptot is the total plasma clearance of the drug after intravenous administration and ClnonCYP is its non-CYP clearance (addition of renal, phase II clearances or other known non-CYP clearances) and fClnonCYP is the fraction of its nonCYP clearance over its total plasma clearance. Assuming that the design of the clinical studies allowed complete inhibition of CYP, the above equation could be simplified as:
(8)
(8)
Therefore
(9)
(9)
The AUC ratios (R) of each drug in the presence vs. absence of a strong CYP inhibitor were obtained from the literature ().
N.B.: The intestinal metabolism of the drug substrate was not taken into account in EquationEquation (6)(6)
(6) .
Statistical analysis
Quantitative data were expressed as mean ± standard error of the mean (SEM). Data were analysed using Student’s t-test. Criteria of significance were: * for p < 0.05; ** for p < 0.01; *** for p < 0.001.
One way Anova followed by a post-test Dunnet was used to assess the significance of inhibition rate to the other CYP inhibition rates (* for p < 0.05; ** for p < 0.01; *** for p < 0.001). All statistical analyses were performed using GraphPad Prism software 5.0 (GraphPad Software, Inc., San Diego, CA, USA). The accuracy of the prediction was assessed and compared from root mean-squared error (RMSE) and average fold error, calculated using the following equations (Obach et al., Citation1997; Sheiner & Beal, Citation1981):
(10)
(10)
(11)
(11)
Results
Preparation of CYP-Silensomes and control-Silensomes and MBIs quantification in the CYP-Silensomes
CYP1A2-, CYP2B6-, CYP2C8-, CYP2C9- and CYP2D6-Silensomes were generated using MBIs. The MBIs used were selected for their high inhibitory potency (low KI), their high inactivation rate (high kinact) and their high specificity for their targeted CYP. Their characteristics are summarised in . Conditions were optimised to result in a batch of HLMs (1) with a final concentration of 20 mg/mL protein (standard protein concentration), (2) devoid of one targeted CYP activity without altering other CYPs, and (3) with a minimum free concentration of MBI, as well as other solvents or co-factors, to avoid any interference. The sequential co-incubation of HLMs (at 2 mg/mL) with the MBI, followed by the filtration/centrifugations and ultracentrifugation steps resulted in the production of CYP-Silensomes at the targeted protein concentration with a good reproducibility for all the batches of CYP-Silensomes and control (CV less than 10%, n = 20) and with a total non-irreversibly MBI concentration accounting for less than 11% of their initial incubation total concentration limiting off-target effects. Only paroxetine concentration could not be markedly decreased despite the washing steps (46% remaining from the initial concentration) because of its high microsomal binding (Hemeryck et al., Citation2001) (). In parallel, control-Silensomes were prepared using the same process, but in the absence of the MBI during the inactivation step.
Table 2. Characteristics of the mechanism-based inhibitors selected.
Table 3. Estimated CYP contribution.
CYP inhibition potency and specificity
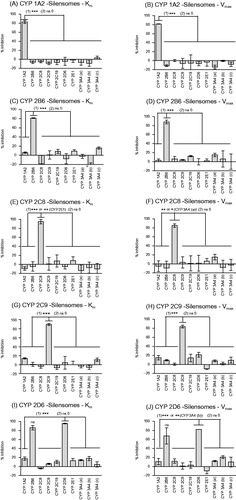
The potency of CYP inactivation and specificity were evaluated by characterising the major CYP activities of individual batches of CYP-Silensomes and control-Silensomes. In order to show that the inactivation was independent of the substrate concentration (one of the MBI properties; Fowler & Zhang, Citation2008) the metabolic rate for each specific reaction was measured at a saturating concentration (above its Km, unless its solubility prevented it, see ) and non-saturating conditions (Km). shows that the targeted CYP activity was inactivated by more than 80% in each of the 5 CYP-Silensome batches compared to its control-Silensomes, with no marked differences observed between the extent of inhibition measured under saturating (Vmax concentrations) and non-saturating conditions (Km concentrations). The selectivity of CYP inhibition was checked by measuring the activities of other major CYP activities in the CYP-Silensomes vs. control-Silensomes i.e. CYP1A2, CYP2B6, CYP2C8, CYP2C9, CYP2C19, CYP2D6, CYP2E1 and CYP3A4 using CYP-selective substrates (detailed in ). In CYP1A2, CYP2B6, CYP2C8, CYP2C9-Silensomes, non-target CYP activities were unaffected (<20% inhibition) by the respective MBI () in both saturating and non-saturating conditions, indicating that the MBIs used were specific for each CYP. In CYP2D6-Silensomes, the CYP2B6-bupropion-hydroxylase activity was significantly inhibited in addition to the CYP2D6 activity, with inhibition of 82% to 65% CYP2B6 at non-saturating and saturating conditions, respectively and consistent with the total paroxetine non-irreversibly bound concentrations measured and its non-covalent microsomal binding ().
Figure 1. Specificity of the inhibition of CYP activities in CYP1A2-, CYP2B6-, CYP2C8-, CYP2C9-, CYP2D6-Silensomes at initial rate (Km) and saturating conditions (Vmax) of substrates. CYP activities at Km and Vmax concentration of substrates in CYP1A2-Silensomes (A, B), CYP2B6-Silensomes (C, D), CYP2C8-Silensomes (E, F), CYP2C9-Silensomes (G, H), CYP2D6-Silensomes (I, J), and corresponding control-Silensomes were compared using the following CYP probe substrates: phenacetin for CYP1A2, bupropion for CYP2B6, paclitaxel or amodiaquine for CYP2C8, diclofenac for CYP2C9, omeprazole or S-mephenytoin for CYP2C19, dextromethorphan for CYP2D6, chlorzoxazone for CYP2E1 and midazolam (a), nifedipine (b) and testosterone (c) for CYP3A4 used at either concentrations close to Km (non-saturating conditions) and Vmax (saturating conditions) (see details in ). Inhibition is expressed as a % activity in control-Silensomes, mean ± SEM of experiments performed in triplicate on two CYP-Silensomes batches (saturating and non-saturating conditions) except CYP1A2 (three batches at non-saturating conditions) and CYP2B6 (one batch at non-saturating conditions), independent CYP-Silensomes batches in triplicate. (1) is the result of Anova tests comparing non-target CYP inhibition to be different from target CYP inhibition; (2) corresponds to statistically significant inhibition different from 0 (ns 0 = non significantly different from 0).
CYP irreversible inhibition is maintained in CYP-Silensomes in storage conditions
In order to determine whether the MBI inhibition was sustained when CYP-Silensomes were stored for long periods, CYP-selective activities were measured in CYP1A2-, CYP2B6-, CYP2C8-, CYP2C9- and CYP2D6-Silensomes and control-Silensomes at saturating conditions after 36 months of storage at −80 °C. Figure S1 shows that the individual targeted CYP inactivation after three years in storage was equivalent to that measured one day after Silensomes preparation confirming the stability of the inactivation that was observed previously in the CYP3A4-Silensomes (Parmentier et al., Citation2017).
Comparison of fmCYP for 21 reference drugs using CYP-Silensomes and rhCYP models
Once characterised, CYP-Silensomes were validated by measuring the CYP contribution to the metabolism of 21 mono- or multi-CYP metabolised marketed drugs. These drugs were selected since they are thoroughly characterised in in vitro and/or clinical studies (with strong CYP inhibitor drugs) and are known to have various CYP contributions to their hepatic metabolism. Ranges of in vivo fmCYP values included: low (fmCYP ≤ 30%) = omeprazole (CYP3A4), mirtazapine (CYP2D6 and CYP3A4), and tasimelteon (CYP3A4); intermediate (30% ≥ fmCYP < 75%) = rasagiline (CYP1A2), sibutramine (CYP2B6), pioglitazone (CYP2C8), celecoxib (CYP2C9), glimepiride (CYP2C9), ibuprofen (CYP2C9), losartan (2C9), carvedilol (CYP2D6), propranolol (CYP2D6), tamsulosin (CYP2D6 and CYP3A4), and loperamide (CYP2C8 and CYP3A4), domperidone (CYP3A4); and high (fmCYP ≥ 75%) = ramelteon (CYP1A2), melatonin (CYP1A2), tasimelteon (CYP1A2), bupropion (CYP2B6), repaglinide (CYP2C8), omeprazole (CYP2C19), dextromethorphan (CYP2D6). The fmCYP3A4 values for tamsulosin, omeprazole, mirtazapine, loperamide and domperidone was previously measured by Parmentier et al. (Citation2017) and the fm for other CYPs were measured in the current studies. As there are few in vivo fmCYP2B6 values reported in the literature, sertraline was also tested as a known CYP2B6 substrate in vitro (Obach et al., Citation2005) ().
The Clint values of each drug (0.1 µM) were measured in CYP1A2-, CYP2B6-, CYP2C8-, CYP2C9-, CYP2D6- and CYP3A4-Silensomes and their concurrent control-Silensomes. A comparison of the fm for each CYP and drug measured in CYP-Silensomes with observed in vivo values is shown in and . Overall, 70% of the fmCYP values measured using CYP-Silensomes were within ±15% of the in vivo fmCYP values estimated from clinical DDI studies (). In addition, the majority (79%) of the fmCYP values were predicted to be in the correct category. Within the low fmCYP categories, the fmCYP3A4 and fmCYP2D6 for mirtazapine metabolism were well predicted; the fmCYP3A4 was slightly overestimated for omeprazole; whereas, CYP3A4-Silensomes incubations indicated no CYP3A4 involvement for tasimelteon metabolism, in comparison to an fmCYP3A4 of 31% reported from in vivo studies. The fmCYP values measured for the metabolism of rasagiline, sibutramine, pioglitazone, losartan, carvedilol, propranolol, tamsulosin (CYP3A4), domperidone and loperamide (CYP3A4 and CYP2C8) were well predicted and were correctly classified in the intermediate fmCYP category. The fmCYP2C9 values for celecoxib, glimepiride and ibuprofen were overestimated compared to the in vivo values; whereas, the fmCYP2D6 for tamsulosin was slightly underestimated (29% versus 39% in vivo). Hence, more than 71% of the intermediate fmCYP values were predicted to be in the correct category. As expected, the highest CYP contribution measured in CYP-Silensomes was observed for ramelteon, melatonin, bupropion, repaglinide and dextromethorphan. The majority of the high fmCYP category drugs were correctly predicted and only the fmCYP1A2 for tasimelteon metabolism was lower than the estimated in vivo value using fluvoxamine as the inhibitor.
Figure 2. Correlation between observed in vivo and predicted contribution to drug metabolism using a direct quantitative method with CYP-Silensomes (A) or indirect rhCYP approach with the relative activity factors (RAFs) using nifedipine (B) and testosterone (C) as substrates for the CYP3A4 activity. All contribution values are shown in . The solid line indicates the line of perfect correlation and the dotted line ± 15% error interval.
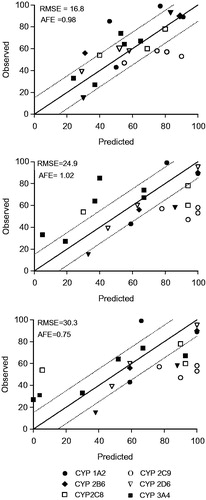
The same 21 drugs were also analysed using conventional rhCYPs and normalising the fmCYP using the RAF approach (Crespi & Penman, Citation1997; Venkatakrishnan et al., Citation1998). A comparison of the fm for each CYP and drug measured in rhCYPs with observed in vivo values is shown in and . The RAF values were compound-specific, with a RAF of 7.4–9.8 for testosterone-6β-hydroxylase and 15.3–49 for nifedipine–oxydase activity. Both values were used for contribution calculations (). Overall, 60% and 40% of the fmCYP values measured using rhCYPs were within ±15% of the in vivo fmCYP values estimated from clinical DDI studies (). In addition, 60% and 44% of the fmCYP values were correctly predicted according to the category using nifedipine and testosterone RAF, respectively. Within the low fmCYP category, 2 of the 4 fmCYP values were predicted within the right category using both RAF values. The fmCYP3A4 for tasimelteon using the testosterone RAF was 3.9%, which was more in line with the result using CYP-Silensomes (in which the fm was 0%), than the in vivo value (31%). When nifedipine was used for the RAF, the fmCYP3A4 for tasimelteon was 0%. The fmCYP3A4 for omeprazole was underestimated using rhCYPs and was only measureable when using nifedipine RAF (the fmCYP3A4 was 0% when testosterone RAF was incorporated). Within the intermediate fm category, only 50% and 36% of the fm values were predicted within the right category using nifedipine and testosterone RAF, respectively. The fmCYP2C9 values for celecoxib, glimeburide, ibuprofen and losartan were overestimated compared to the in vivo fm estimated using fluconazole as CYP2C9 inhibitor. Using the testosterone RAF, the fmCYP3A4 for loperamide was overestimated (93% versus 74% in vivo) and the fm CYP2C8 was underestimated using nifedipine RAF (5.5% versus 54% in vivo). The high category fmCYP values were well predicted using the nifedipine RAF, with 86% of fmCYP values predicted within the correct category. The exception to this was fmCYP1A2 for tasimelteon, which was underestimated (40%) compared to the in vivo fmCYP (85%) estimated using fluvoxamine as CYP1A2 inhibitor. The use of the testosterone RAF resulted in fewer than 57% of predicted fmCYP values to be within the correct category, such that fmCYP values for ramelteon, tasimelteon and omeprazole were all under-predicted.
Discussion
These studies were conducted to address the need for an accurate measurement of the fmCYP for NCEs early on in drug development. If a drug is only metabolised by a single CYP (a mono-CYP substrate), meaning having a high fmCYP of more than 80%, there is a high risk for a DDI. Examples of this are the DDIs between ramelteon and fluvoxamine for CYP1A2 (Iga, Citation2015), and midazolam and ketoconazole for CYP3A4 (Olkkola et al., Citation1994) with substrate systemic exposure increasing by approximately 130- and 16-fold, respectively. If the fmCYP is between 40% and 60%, the risk for a DDI is manageable, unless the drugs have a narrow therapeutic index (e.g. the DDI observed with enzalutamide (Gibbons et al., Citation2015)). The lowest risk of a DDI is linked to an fmCYP of less than 25% (representing a minor pathway), whereby regulatory guidelines recommend that clinical DDI studies are not required for these drugs.
A proof of concept of CYP-Silensomes has been demonstrated using CYP3A4 as the target CYP (Parmentier et al., Citation2017). Since this model offers a number of advantages over conventional phenotyping assays, we aimed to extend the number of CYPs that could be used in these assays. We first characterised these CYP-Silensomes with respect to the specificity of the MBI inhibition and then determined whether the inhibition was retained over longer times in storage (3 years). Under the MBI conditions used, we showed that more than 80% of the target CYP activities were inactivated; whereas, the non-target CYPs in the preparations were inhibited by less than 20% of their control activities in both saturated than non-saturated conditions of substrate. The consistent inhibition of the target CYPs whatever the substrate concentration is one of the advantages of the use of the MBIs (substrate protection, Zhou et al., Citation2004) when compared to competitive inhibitors for which the inhibition will decrease with increasing substrate concentration (competition by the substrate).
While three target CYPs were selectively inhibited at non-saturating conditions by more than 90% (CYP2C8, CYP2C9 and CYP2D6), the maximal inhibition of other target CYPs, including CYP1A2 and CYP2B6 was lower (83% and 81%, respectively). However, regarding CYP2B6-Silensomes, the inactivation of the target-CYP was greater than 90% at saturating conditions, where the inhibition could be expected to be lower. Regarding CYP1A2-Silensomes, this suggests that either the inactivation was not complete or the CYP substrate (namely, phenacetin) used to measure the target CYP activity is not 100% specific and that another enzymatic pathway contributes to their metabolism. This was also observed for CYP3A4-Silensomes and the metabolism of midazolam and nifedipine, such that the residual hydroxylation and oxidation activities (15% and 22% of the control activities, respectively) were related to CYP3A5 and not CYP3A4 activity (Parmentier et al., Citation2017). The residual activities were inhibited by ketoconazole at a concentration known to only inhibit CYP3A4 and CYP3A5. In the current studies, we investigated whether the residual phenacetin-O-dealkylation activity in CYP1A2-Silensomes was due to CYP1A1, since this CYP is known to be unaffected by furafylline (Moody et al., Citation1999). In support of this, co-incubation of CYP1A2-Silensomes with alpha-naphthoflavone, a known inhibitor of both CYP1A1 and 1A2 (Sai et al., Citation2000), almost completely inhibited phenacetin-O-dealkylation activity. We confirmed that furafylline, used in the same conditions as in the CYP1A2-Silensomes, completely inhibited recombinant CYP1A2 and not CYP1A1 (data not shown).
As with any biological model, the functional stability during standard storage conditions should be maintained for a prolonged period so that the same batch can be used over a number of years (Yamazaki et al., Citation1997). We have shown previously that the CYP inactivation in CYP3A4-Silensomes was maintained for up to six years (Parmentier et al., Citation2017). In our current studies, we have shown that the extent of inactivation of the target CYP and the activities of the non-target CYPs was maintained for at least three years of storage.
Having characterised the CYP-Silensomes, we then tested their applicability in predicting the fmCYP of 20 drugs with known in vivo fmCYP values. Overall, there was a good comparison between the fmCYP values measured in CYP-Silensomes and measured values, whereby 70% of the fmCYP values were within 15% of the observed values. Moreover, based on the percentage of fmCYP values that were within the 15% limits of accuracy and RMSE values, CYP-Silensomes were more accurate than the approach using rhCYPs. Another issue with rhCYPs is that they require a separately derived RAF values to normalise the fmCYP calculations, and these differ depending on the substrate used. The consequence of this is a discrepancy between the fmCYP values determined using nifedipine and testosterone RAFs. An example of this was seen for loperamide. The fmCYP3A4 was slightly overestimated (93% versus 74%) and the fmCYP2C8 was greatly underestimated (5.5% versus 54%) using the testosterone RAF. The impact of the RAF value used was also observed for domperidone, for which the fmCYP3A4 was overestimated using testosterone RAF (93% versus 67% in vivo) but not when nifedipine was used to normalise the contribution (67%). By contrast, the fmCYP3A4 for mirtazapine was best predicted using the testosterone RAF (30% compared to 33% in vivo) rather than the nifedipine RAF (for which the fmCYP3A4 was only 5%). The importance of selecting the appropriate substrate RAF was also observed by Parmentier et al. (Citation2017). This “substrate-dependent RAF” was thought to be linked to the model in which multiple substrates or ligands can bind concurrently to the active site of a single CYP3A4 molecule as reported by Wang et al. (Citation2000).
While the in vitro assays aim to predict in vivo values, it should be kept in mind that clinical DDI studies may also not represent the true fmCYP due to a lack of specificity of in vivo inhibitors. For example, fluvoxamine is known to inhibit CYP2C19 in addition to CYP1A2 (Yasui-Furukori et al., Citation2004). This may account for the very high contribution of CYP1A2 (likely overestimated) in the in vivo metabolism of tasimelteon and ramelteon (fmCYP1A2 values in vivo were 85% and 99%, respectively), especially since rhCYP incubations indicated that CYP2C19 was involved in their metabolism (fmCYP2C19 was 46–54% and 8–18%, respectively). Moreover, ramelteon pharmacokinetics was shown to be impacted in the clinic by fluconazole, which is known to be a strong CYP2C19 inhibitor (Kang et al., Citation2002), suggesting a role of CYP2C19 in ramelteon metabolism. However, fluconazole, like fluvoxamine, lacks of specificity since it is known to be a moderate CYP2C9 (recommended by the FDA guidelines; FDA, Citation2012) and CYP3A4 inhibitor in the clinic (Varhe et al., Citation1996), preventing a full conclusion on CYP2C19 role in ramelteon metabolism. These drugs will be tested in CYP2C19-Silensomes to confirm the contribution of CYP2C19 once they become available. In such cases described here, measurement of the formation of metabolites, rather than depletion of the parent compound, may help to better delineate the metabolism of these drugs (which was not possible here due the reference metabolites and radiolabelled drugs being unavailable).
Because of a lack of strong CYP inhibitors, some clinical DDI studies have also to be performed with inhibitors that may not completely inhibit the target CYP. This is the case for fluconazole, which is classified as a moderate CYP2C9 inhibitor by the FDA guidelines (FDA, Citation2017). In addition, Phase 1 and 2 non-CYP XMEs and/or transporters may account for the majority of the clearance of a drug. For example, UGTs are known to be involved in the metabolism of a number of drugs tested in our studies: ibuprofen (Buchheit et al., Citation2011) and losartan (Alonen et al., Citation2008). Since there have been no quantitative fmUGTisoform measurements for these drugs, we could not take them into account for the estimation of the in vivo fmCYP2C9. Partial CYP2C9 inhibition by fluconazole and/or UGTs contribution are likely two reasons that can explain the lower in vivo estimated contribution of CYP2C9 in the oxidative metabolism of celecoxib, glimepiride, ibuprofen, and losartan compared to the two in vitro systems tested in our study.
CYP2B6-Silensomes underestimated the fmCYP2B6 of sibutramide (31% in CYP2B6-Silensomes compared to 56% in vivo). By contrast, rhCYPs predicted fmCYP2B6 for sibutramide to be 59% and 64% (using testosterone and nifedipine RAF, respectively). The reason for this discrepancy is not known, especially since there was a good correlation of the fmCYP2B6 for two other CYP2B6 substrates, bupropion (a sensitive CYP2B6 substrate (FDA, Citation2017)) and sertraline (known in vitro CYP2B6 substrate (Obach et al., Citation2005)).
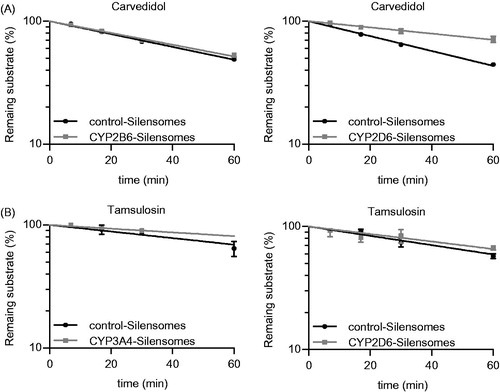
There was a technical complication with CYP2D6-Silensomes, in which CYP2B6 was also markedly inhibited by the MBI selected, paroxetine, which has previously been shown to inhibit this CYP with a high potency (Hesse et al., Citation2000). This non-target residual inhibition is likely to be due to the remaining paroxetine (46% of the initial paroxetine concentration) present in the CYP-Silensomes preparation despite the washing steps. While there are few CYP2B6 substrates (i.e. about 4%) among current marketed drugs (Rendic & Guengerich, Citation2015), due to its small binding pocket (Dong et al., Citation2012; Yang et al., Citation2016), the possibility that this CYP is involved in the metabolism of a drug should be confirmed. One way in which this can be addressed is simply to subtract the fmCYP2B6 (measured using CYP2B6-Silensomes) from the fmCYP2D6 derived using CYP2D6-Silensomes. For example, the observed in vivo fmCYP2D6 values for propranolol, tamsulosin and carvedilol are reported to be 58%, 39% and 60%, which were well predicted using CYP2D6-Silensomes (58%, 29% and 52%, respectively) (). Incubations of the same drugs in CYP2B6-Silensomes show that none were substrates for this CYP; therefore, the fmCYP2D6 values derived from CYP2D6-Silensomes did not require adjustment for the involvement of CYP2B6. Njuguna et al. (Citation2016) proposed the use of a mathematical model based on a coefficient matrix to correct the fmCYP values for each test drug and eliminate prediction inaccuracy resulting from cross-reactivity of the chemical inhibitors. The use of this method with our results did not allow to better estimate the fmCYP values compared to in vivo since only CYP2D6-Silensomes is not fully specific (data not shown).
Figure 3. Determination of the fmCYP2D6 of Carvedidol (A) and both fmCYP2D6 and fmCYP3A4 of tamsulosin (B) using CYP2D6-, CYP2B6- (A, B) and CYP3A4-Silensomes (B) and their respective homologous control-Silensomes. Drugs were incubated at 0.1 µM and the disappearance of the parent compound was measured over 60 min. Percentages of remaining substrates are mean ± SEM of three independent experiments and were linearly fitted to determine clearance.
We envisage that CYP-Silensomes can be used in upstream and downstream drug development i.e. for candidate selection and DDI management (including after-market authorisation). Drugs are classified according to various attributes e.g. mechanism of action, chemical structure, in vitro toxicology, or pharmacokinetics properties including metabolism etc., to provide a way in which they are organised and selected for further development (Winnenburg & Bodenreider, Citation2014). It is therefore of high interest to select in early stage, molecules with a multi-enzyme metabolic profile with relatively balanced contributions to avoid strong DDI and ensure a better druggability. Moreover, a class effect in terms of fmCYP and related DDIs are often observed e.g. benzodiazepines or cardiovascular or anticancer drugs are linked to CYP3A4 DDIs, CNS drugs are linked to CYP2D6 or CYP2C19 DDIs and, melatoninergic drugs are linked to CYP1A2 DDIs. The advantage of an early screen of series of molecules is that the Clint (metabolic stability), identification of CYP involved and its quantitative contribution can be measured in one assay.
One drawback of the use of CYP-Silensomes in early stage is that the measurement of the fmCYP of low clearance drugs is more challenging than rhCYPs (although rhCYPs are still impacted by the appropriate use of the RAF). In our study, a native intrinsic clearance less than 4 mL/min.g protein did not allow to distinguish a CYP inactivation higher than 75% in CYP-Silensomes using the substrate disappearance measured by LC/MS/MS (limit of measurable inactivated intrinsic clearance set at 1 mL/min/g protein). This limit can be further decreased by decreasing the analytical variability and increasing the number of replicates. Based on our results, we fixed a threshold for accurate determination of the fmCYP at 20% when cold compound is used. This is supported by the findings of Parmentier et al. (Citation2017), who showed that CYP3A4-silensomes could accurately predict an fmCYP3A4 of 24% for unlabelled mirtazapine. The LOQs for measurements of unlabelled drugs using rhCYPs was less than 10% in the present study (e.g. ramelteon, tasimelteon, propranol or sertraline); however, there were not verified by in vivo results. The FDA and EMA guidelines fixed a threshold of 25% for the fmCYP, above which clinical DDI study are recommended (FDA, Citation2017). Therefore, there is no absolute requirement for CYP-Silensomes to exhibit a sensitivity of less than 20% for the fmCYP measurement.
Nevertheless, this drawback is less of a problem for drugs that have advanced into the development phase, in which radiolabelled forms of the drug are available. The use of the radiolabelled drug can have various advantages including a decreased analytical variability and uncertainty, since metabolite formation can be monitored as well as substrate disappearance. This also allows for metabolite profiling and full reaction CYP phenotyping, which is particularly useful if some metabolites are of interest for their pharmacological activity or their safety profile.
Other in vitro phenotyping assays have been proposed to tackle the issue of low clearance drugs although they still suffer from some disadvantages compared to CYP-Silensomes. For example, Yang et al. (Citation2016) showed that the use of relay hepatocytes allow to determine the fmCYP value of 5 low-turnover drugs. However, this method is relatively labour intensive and cost consuming (Hutzler et al., Citation2015) and the sequential incubations are not adequate for drugs exhibiting a high non-specific binding. Long-term hepatocyte culture models can also be used but they are again more expensive and the CYP expression levels are not always fully representative to in vivo situation over the course of the incubation (Godoy et al., Citation2013).
Later in the drug development process, quantitative fmCYP measurements using a panel of CYP-Silensomes can be used in static and dynamic models to predict DDI risk, as it is now recommended by the EMA and FDA. Such predictions require robust and accurate in vitro test methods to evaluate fmCYP values.
Conclusions
We have applied the concept of using MBIs to produce CYP-Silensomes for a panel of major CYPs. The target CYPs were extensively and selectivity inactivated by the selected MBI, while non-target CYPs were inhibited by less than 20% of the homologous control activities. The only exception to this was CYP2D6-Silensomes, in which CYP2B6 was also inhibited; however, the fmCYP can be adjusted by subtracting the fmCYP2B6. The extent of inactivation was retained over three years in storage. To validate the use of a panel of 6 CYP-Silensomes, we showed that the fmCYP values of mono- and multi-CYP metabolised drugs were well predicted. Moreover, the correlation with observed fmCYP values was higher than that for rhCYPs which were run in parallel using the same drugs. We also showed that the choice of the RAF substrate in rhCYP predictions can affect the accuracy of the fmCYP measurement. These results support the use of CYP1A2-, CYP2B6-, CYP2C8-, CYP2C9-, CYP2D6 and CYP3A4-Silensomes either individually or as a panel of CYP-Silensomes (soon to be completed by the CYP2C19-Silensomes) to accurately predict fmCYP values during the in vitro enzyme phenotyping assays in early, as well as in development, phases of drug development. This would represent an efficient alternative to the current recommended model.
Declaration of interest
No potential conflict of interest was reported by the authors.
Supplementary material available online
Acknowledgement
The authors thank Perrine Masson for her useful work and advices on biostatistics.
References
- Alonen A, Finel M, Kostiainen R. (2008). The human UDP-glucuronosyltransferase UGT1A3 is highly selective towards N2 in the tetrazole ring of losartan, candesartan, and zolarsartan. Biochem Pharmacol 76:763–72. https://doi.org/10.1016/j.bcp.2008.07.006
- Aquilante CL, Kosmiski LA, Bourne DWA, et al. (2013). Impact of the CYP2C8 *3 polymorphism on the drug-drug interaction between gemfibrozil and pioglitazone. Br J Clin Pharmacol 75:217–26. https://doi.org/10.1111/j.1365-2125.2012.04343.x
- Bae J-W, Jang C-G, Lee S-Y. (2011). Effects of clopidogrel on the pharmacokinetics of sibutramine and its active metabolites. J Clin Pharmacol 51:1704–11. https://doi.org/10.1177/0091270010388651
- Baer BR, DeLisle RK, Allen A. (2009). Benzylic oxidation of gemfibrozil-1-O-beta-glucuronide by P450 2C8 leads to heme alkylation and irreversible inhibition. Chem Res Toxicol 22:1298–309. https://doi.org/10.1021/tx900105n
- Bosilkovska M, Samer CF, Déglon J, et al. (2014). Geneva cocktail for cytochrome p450 and P-glycoprotein activity assessment using dried blood spots. Clin Pharmacol Ther 96:349–59. https://doi.org/10.1038/clpt.2014.83
- Böttiger Y, Tybring G, Götharson E, Bertilsson L. (1997). Inhibition of the sulfoxidation of omeprazole by ketoconazole in poor and extensive metabolizers of S-mephenytoin. Clin Pharmacol Ther 62:384–91. https://doi.org/10.1016/S0009-9236(97)90116-8
- Buchheit D, Dragan C-A, Schmitt EI, Bureik M. (2011). Production of ibuprofen acyl glucosides by human UGT2B7. Drug Metab Dispos Biol Fate Chem 39:2174–81. https://doi.org/10.1124/dmd.111.041640
- Crespi CL, Penman BW. (1997). Use of cDNA-expressed human cytochrome P450 enzymes to study potential drug–drug interactions. Adv Pharmacol San Diego Calif 43:171–88
- Dong D, Wu B, Chow D, Hu M. (2012). Substrate selectivity of drug-metabolizing cytochrome P450s predicted from crystal structures and in silico modeling. Drug Metab Rev 44:192–208
- EMA. (2012). Guideline on the investigation of drug interactions. Available from: http://www.ema.europa.eu/docs/en_GB/document_library/Scientific_guideline/2012/07/WC500129606.pdf
- FDA. (2012). Guidance for industry: drug interaction studies – study design, data analysis, implications for dosing, and labeling recommendations
- FDA. (2017). Guidance for industry. In vitro metabolism and transporter mediated drug-drug interaction studies. Available from: https://www.fda.gov/downloads/drugs/guidancecomplianceregulatoryinformation/guidances/ucm581965.pdf
- Fowler S, Zhang H. (2008). In vitro evaluation of reversible and irreversible cytochrome P450 inhibition: current status on methodologies and their utility for predicting drug-drug interactions. Aaps J 10:410–24. https://doi.org/10.1208/s12248-008-9042-7
- Gibbons JA, de Vries M, Krauwinkel W, et al. (2015). Pharmacokinetic drug interaction studies with Enzalutamide. Clin Pharmacokinet 54:1057–69. https://doi.org/10.1007/s40262-015-0283-1
- Godoy P, Hewitt NJ, Albrecht U, et al. (2013). Recent advances in 2D and 3D in vitro systems using primary hepatocytes, alternative hepatocyte sources and non-parenchymal liver cells and their use in investigating mechanisms of hepatotoxicity, cell signaling and ADME. Arch Toxicol 87:1315–530. https://doi.org/10.1007/s00204-013-1078-5
- Guest EJ, Rowland-Yeo K, Rostami-Hodjegan A, et al. (2011). Assessment of algorithms for predicting drug-drug interactions via inhibition mechanisms: comparison of dynamic and static models. Br J Clin Pharmacol 71:72–87
- Härtter S, Grözinger M, Weigmann H, et al. (2000). Increased bioavailability of oral melatonin after fluvoxamine coadministration. Clin Pharmacol Ther 67:1–6. https://doi.org/10.1067/mcp.2000.104071
- Hemeryck A, De Vriendt CA, Belpaire FM. (2001). Metoprolol-paroxetine interaction in human liver microsomes: stereoselective aspects and prediction of the in vivo interaction. Drug Metab Dispos Biol Fate Chem 29:656–63
- Hesse LM, Venkatakrishnan K, Court MH, et al. (2000). CYP2B6 mediates the in vitro hydroxylation of bupropion: potential drug interactions with other antidepressants. Drug Metab Dispos Biol Fate Chem 28:1176–83
- Honkalammi J, Niemi M, Neuvonen PJ, Backman JT. (2011). Mechanism-based inactivation of CYP2C8 by gemfibrozil occurs rapidly in humans. Clin Pharmacol Ther 89:579–86. https://doi.org/10.1038/clpt.2010.358
- Huang S-M, Rowland M. (2012). The role of physiologically based pharmacokinetic modeling in regulatory review. Clin Pharmacol Ther 91:542–9. https://doi.org/10.1038/clpt.2011.320
- Hutzler JM, Ring BJ, Anderson SR. (2015). Low-turnover drug molecules: a current challenge for drug metabolism scientists. Drug Metab Dispos 43:1917–28
- Hynninen V-V, Olkkola KT, Leino K, et al. (2006). Effects of the antifungals voriconazole and fluconazole on the pharmacokinetics of s-(+)- and R-(-)-Ibuprofen. Antimicrob Agents Chemother 50:1967–72. https://doi.org/10.1128/AAC.01483-05
- Iga K. (2015). Simulation of metabolic drug-drug interactions perpetrated by Fluvoxamine using Hybridized two-compartment Hepatic Drug-Pool-based tube modeling and estimation of in vivo inhibition constants. J Pharm Sci 104:3565–77. https://doi.org/10.1002/jps.24549
- Kang BC, Yang CQ, Cho HK, et al. (2002). Influence of fluconazole on the pharmacokinetics of omeprazole in healthy volunteers. Biopharm Drug Dispos 23:77–81
- Kazierad DJ, Martin DE, Blum RA, et al. (1997). Effect of fluconazole on the pharmacokinetics of eprosartan and losartan in healthy male volunteers. Clin Pharmacol Ther 62:417–25. https://doi.org/10.1016/S0009-9236(97)90120-X
- Moody GC, Griffin SJ, Mather AN, et al. (1999). Fully automated analysis of activities catalysed by the major human liver cytochrome P450 (CYP) enzymes: assessment of human CYP inhibition potential. Xenobiotica Fate Foreign Compd Biol Syst 29:53–75. https://doi.org/10.1080/004982599238812
- Mori K, Hashimoto H, Takatsu H, et al. (2009). Cocktail-substrate assay system for mechanism-based inhibition of CYP2C9, CYP2D6, and CYP3A using human liver microsomes at an early stage of drug development. Xenobiotica Fate Foreign Compd Biol Syst 39:415–22. https://doi.org/10.1080/00498250902822204
- Niemi M, Backman JT, Neuvonen M, et al. (2001). Effects of fluconazole and fluvoxamine on the pharmacokinetics and pharmacodynamics of glimepiride. Clin Pharmacol Ther 69:194–200. https://doi.org/10.1067/mcp.2001.114229
- Niemi M, Tornio A, Pasanen MK, et al. (2006). Itraconazole, gemfibrozil and their combination markedly raise the plasma concentrations of loperamide. Eur J Clin Pharmacol 62:463–72. https://doi.org/10.1007/s00228-006-0133-z
- Njuguna NM, Umehara K-I, Huth F, et al. (2016). Improvement of the chemical inhibition phenotyping assay by cross-reactivity correction. Drug Metab Pers Ther 31:221–8. https://doi.org/10.1515/dmpt-2016-0028
- Obach RS, Baxter JG, Liston TE, et al. (1997). The prediction of human pharmacokinetic parameters from preclinical and in vitro metabolism data. J Pharmacol Exp Ther 283:46–58
- Obach RS, Cox LM, Tremaine LM. (2005). Sertraline is metabolized by multiple cytochrome P450 enzymes, monoamine oxidases, and glucuronyl transferases in human: an in vitro study. Drug Metab Dispos Biol Fate Chem 33:262–70. https://doi.org/10.1124/dmd.104.002428
- Ogilvie BW, Torres R, Dressman MA, et al. (2015). Clinical assessment of drug-drug interactions of tasimelteon, a novel dual melatonin receptor agonist. J Clin Pharmacol 55:1004–11. https://doi.org/10.1002/jcph.507
- Ogilvie BW, Usuki E, Yerino P, Parkinson A. 2008. In Vitro approaches for studying the inhibition of drug-metabolizing enzymes and identifying the drug-metabolizing enzymes responsible for the tabolism of drugs (reaction phenotyping) with emphasis on cytochrome P450. In: Rodrigues AD, ed. Drug–drug interactions, drugs and the pharmaceutical sciences. New York: Informa Healthcare, 231–358
- Olkkola KT, Backman JT, Neuvonen PJ. (1994). Midazolam should be avoided in patients receiving the systemic antimycotics ketoconazole or itraconazole. Clin Pharmacol Ther 55:481–5
- Parmentier Y, Bossant M-J, Bertrand M, Walther B. (2007). In vitro studies of drug metabolism. In: Reedijk J, ed. Chemistry, Molecular sciences and chemical engineering, from comprehensive medicinal chemistry II. Waltham: Elsevier, Volume 5, 231–57
- Parmentier Y, Pothier C, Delmas A, et al. (2017). Direct and quantitative evaluation of the human CYP3A4 contribution (fm) to drug clearance using the in vitro SILENSOMES model. Xenobiotica Fate Foreign Compd Biol Syst 47:562–75. https://doi.org/10.1080/00498254.2016.1208854
- Perloff ES, Mason AK, Dehal SS, et al. (2009). Validation of cytochrome P450 time-dependent inhibition assays: a two-time point IC50 shift approach facilitates kinact assay design. Xenobiotica Fate Foreign Compd Biol Syst 39:99–112. https://doi.org/10.1080/00498250802638155
- Rendic S, Guengerich FP. (2015). Survey of human oxidoreductases and cytochrome P450 enzymes involved in the metabolism of xenobiotic and natural chemicals. Chem Res Toxicol 28:38–42
- Rowland M, Matin SB. (1973). Kinetics of drug-drug interactions. J Pharmacokinet Biopharm 1:553–67
- Richter T, Schwab M, Eichelbaum M, Zanger UM. (2005). Inhibition of human CYP2B6 by N,N',N''-triethylenethiophosphoramide is irreversible and mechanism-based. Biochem Pharmacol 69:517–24. https://doi.org/10.1016/j.bcp.2004.10.008
- Roy P, Yu LJ, Crespi CL, Waxman DJ. (1999). Development of a substrate-activity based approach to identify the major human liver P-450 catalysts of cyclophosphamide and ifosfamide activation based on cDNA-expressed activities and liver microsomal P-450 profiles. Drug Metab Dispos Biol Fate Chem 27:655–66
- Ruwe FJL, Smulders RA, Kleijn HJ, et al. (2001). Mirtazapine and paroxetine: a drug-drug interaction study in healthy subjects. Hum Psychopharmacol 16:449–59. https://doi.org/10.1002/hup.318
- Sai Y, Dai R, Yang TJ, et al. (2000). Assessment of specificity of eight chemical inhibitors using cDNA-expressed cytochromes P450. Xenobiotica Fate Foreign Compd Biol Syst 30:327–43. https://doi.org/10.1080/004982500237541
- Sheiner LB, Beal SL. (1981). Some suggestions for measuring predictive performance. J Pharmacokinet Biopharm 9:503–12
- Stout SM, Nielsen J, Bleske BE, et al. (2010). The impact of paroxetine coadministration on stereospecific carvedilol pharmacokinetics. J Cardiovasc Pharmacol Ther 15:373–9
- Troost J, Tatami S, Tsuda Y, et al. (2011). Effects of strong CYP2D6 and 3A4 inhibitors, paroxetine and ketoconazole, on the pharmacokinetics and cardiovascular safety of tamsulosin. Br J Clin Pharmacol 72:247–56. https://doi.org/10.1111/j.1365-2125.2011.03988.x
- Uttamsingh V, Gallegos R, Liu JF, et al. (2015). Altering metabolic profiles of drugs by precision deuteration: reducing mechanism-based inhibition of CYP2D6 by paroxetine. J Pharmacol Exp Ther 354:43–54. https://doi.org/10.1124/jpet.115.223768
- Varhe A, Olkkola KT, Neuvonen PJ. (1996). Effect of fluconazole dose on the extent of fluconazole-triazolam interaction. Br J Clin Pharmacol 42:465–70
- Venkatakrishnan K, Moltke LLV, Greenblatt DJ. (1998). Human cytochromes P450 mediating phenacetin O-deethylation in vitro: validation of the high affinity component as an index of CYP1A2 activity. J Pharm Sci 87:1502–7. https://doi.org/10.1021/js980255z
- Venkatakrishnan K, von Moltke LL, Harmatz JS, et al. (2000). Comparison between cytochrome P450 (CYP) content and relative activity approaches to scaling from cDNA-expressed CYPs to human liver microsomes: ratios of accessory proteins as sources of discrepancies between the approaches. Drug Metab. Dispos 28:1493–504
- Wang RW, Newton DJ, Liu N, et al. (2000). Human cytochrome P-450 3A4: in vitro drug-drug interaction patterns are substrate-dependent. Drug Metab Dispos Biol Fate Chem 28:360–6
- Wienkers L, Stevens J. 2003. Cytochrome P450 reaction phenotyping. In: Lee J, Obach RS, Fisher MB, eds. Drug metabolizing enzymes: cytochrome P450 and other enzymes in drug discovery and development. New York: FontisMedia SA, 255–310
- Winnenburg R, Bodenreider O. (2014). A framework for assessing the consistency of drug classes across sources. J Biomed Semantics 5:30. https://doi.org/10.1186/2041-1480-5-30
- Yamazaki H, Inoue K, Turvy CG, et al. (1997). Effects of freezing, thawing, and storage of human liver samples on the microsomal contents and activities of cytochrome P450 enzymes. Drug Metab Dispos Biol Fate Chem 25:168–74
- Yang X, Atkinson K, Di L. (2016). Novel cytochrome P450 reaction phenotyping for low-clearance compounds using the hepatocyte relay method. Drug Metab Dispos 44:460–5
- Yasui-Furukori N, Takahata T, Nakagami T, et al. (2004). Different inhibitory effect of fluvoxamine on omeprazole metabolism between CYP2C19 genotypes. Br J Clin Pharmacol 57:487–94. https://doi.org/10.1111/j.1365-2125.2003.02047.x
- Yoshizato T, Kotegawa T, Imai H, et al. (2012). Itraconazole and domperidone: a placebo-controlled drug interaction study. Eur J Clin Pharmacol 68:1287–94. https://doi.org/10.1007/s00228-012-1258-x
- Zhang H, Davis CD, Sinz MW, Rodrigues AD. (2007). Cytochrome P450 reaction-phenotyping: an industrial perspective. Expert Opin Drug Metab Toxicol 3:667–87. https://doi.org/10.1517/17425255.3.5.667
- Zhou HH, Anthony LB, Roden DM, Wood AJ. (1990). Quinidine reduces clearance of (+)-propranolol more than (-)-propranolol through marked reduction in 4-hydroxylation. Clin Pharmacol Ther 47:686–93
- Zhou S, Chan E, Lim LY, et al. (2004). Therapeutic drugs that behave as mechanism-based inhibitors of cytochrome P450 3A4. Curr Drug Metab 5:415–42