
 ?Mathematical formulae have been encoded as MathML and are displayed in this HTML version using MathJax in order to improve their display. Uncheck the box to turn MathJax off. This feature requires Javascript. Click on a formula to zoom.
Abstract
Common marmosets (Callithrix jacchus) are small non-human primates that genetically lack cytochrome P450 2C9 (CYP2C9). Polymorphic marmoset CYP2C19 compensates by mediating oxidations of typical human CYP2C9/19 substrates.
Twenty-four probe substrates were intravenously administered in combinations to marmosets assigned to extensive or poor metaboliser (PM) groups by CYP2C19 genotyping. Eliminations from plasma of cilomilast, phenytoin, repaglinide, tolbutamide, and S-warfarin in the CYP2C19 PM group were significantly slow; these drugs are known substrates of human CYP2C8/9/19.
Human total clearance values and volumes of distribution of the 24 test compounds were extrapolated using single-species allometric scaling with experimental data from marmosets and found to be mostly comparable with the reported values.
Human total clearance values and volumes of distribution of 15 of the 24 test compounds similarly extrapolated using reported data sets from cynomolgus or rhesus monkeys were comparable to the present predicted results, especially to those based on data from PM marmosets.
These results suggest that single-species allometric scaling using marmosets, being small, has advantages over multiple-species-based allometry and could be applicable for pharmacokinetic predictions at the discovery stage of drug development.
Introduction
During new drug development, insight into the pharmacokinetic behaviours of potential drugs in clinical practice is essential. In particular, prediction of the human pharmacokinetics of new medicines can be crucial at the stage of selecting the best candidate compound(s) for first-in-human studies (Di et al. Citation2013). The total clearance (CLt) and the volume of distribution at steady state (Vss) are generally important pharmacokinetic parameters for describing the plasma concentration–time profiles of drugs. Various methodologies for the prediction of these parameters in humans have been reported and evaluated (Jones et al. Citation2011, Ring et al. Citation2011, Zhang et al. Citation2015). Allometric scaling is an empirical method that correlates the mass of experimental animals and humans, i.e. body weights, with the pharmacokinetic parameters using a scaling exponent. Whereas several animal species, such as rats, dogs, and monkeys, are used in multiple-species-based allometry, simple single-species allometric scaling has clear advantages over the former method in terms of reduced animal usage and laboratory workload; this is particularly relevant during the discovery stage of drug development. Taking the elimination half-life (t1/2=ln(2)×Vss/CLt) as the index of predictability, Hosea et al. (Citation2009) used a data set of 50 compounds and reported that the single-species allometric scaling method gave similar or improved accuracy compared to the findings from multiple-species allometric scaling. For the prediction of CLt, single-species allometric scaling using monkeys (by applying a hepatic blood flow rate-based scaling method; Ward and Smith Citation2004a, Lombardo et al. Citation2013a) and rats and dogs (Ring et al. Citation2011) has shown encouraging results. Deguchi et al. (Citation2011) also demonstrated that the single-species allometric scaling method using monkeys gave better predictability of human CLt for 12 UDP-glucuronosyltransferase (UGT) substrates than other animal species tested. For the prediction of Vss, predictions based on monkey data alone have demonstrated the most accurate outcomes (Ward and Smith Citation2004b), whereas dogs have been recommended for single-species allometric scaling when test animals other than non-human primates need to be considered (Lombardo et al. Citation2013b).
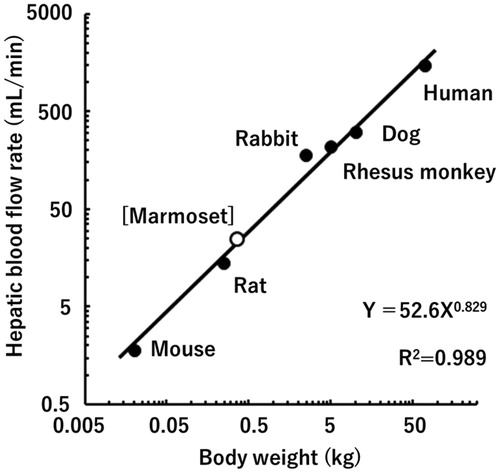
Common marmosets (Callithrix jacchus) (hereafter referred to as marmosets) are a more primitive non-human primate species than cynomolgus and rhesus macaques. This small laboratory animal model (about one-tenth the body weight of a cynomolgus monkey) has been used in pharmacological investigations and safety assessments of pharmaceutical products (Orsi et al. Citation2011, Korte and Everitt Citation2019). Although the application of marmosets for in vivo pharmacokinetic studies of medicines is limited (Eason et al. Citation1988, Schmahl et al. Citation1988, Bird et al. Citation1992, Wiltshire et al. Citation1997, Nelson et al. Citation2010, Uehara et al. Citation2016a), a series of extensive studies on metabolic enzymes (Soars et al. Citation2001, Koehler et al. Citation2006, Uno et al. Citation2016, Citation2020, Uehara et al. Citation2017b, Citation2017c, Citation2019, Citation2020) and membrane transporters (Uehara et al. Citation2018) in marmosets in vitro has drawn attention in this area of research. A plot of the hepatic blood flow rate of marmosets (Gabrielsson and Hjorth Citation2012) and those of some other species (Davies and Morris Citation1993) against their body weights suggests that the pharmacokinetic parameters of drugs would also likely follow allometric scaling models between these species, including between humans and marmosets (). In view of their easy handling and the reduced amounts of drug substances required, marmosets could prove to be a new and useful animal species for prediction of the human pharmacokinetics of medicines by the application of allometric scaling at the early stage of drug development.
Figure 1. Relationship between hepatic blood flow rates and body weights in humans, marmosets, and other experimental animal species.
The cytochrome P450 (P450 or CYP) family contains the major enzymes involved in the metabolic elimination of prescription drugs, mediating ∼75% of all drug metabolism in humans (Guengerich Citation2008). It is well known that human P450 isoforms such as CYP2A6 (Wang et al. Citation2018), CYP2C9 (da Silveira et al. Citation2019), CYP2C19 (Charfi et al. Citation2018), CYP2D6 (Bezerra et al. Citation2018), and CYP2E1 (Court et al. Citation2017) are genetically polymorphic; the corresponding mutated enzymes result in the mild or major inter-individual pharmacokinetic variations of medicines seen in clinical practice. Among laboratory animals, some dog P450 isoforms are reportedly polymorphic (Kamimura Citation2006); a canine CYP1A2 deficiency dramatically increased plasma levels of both a benzodiazepine receptor partial inverse agonist (Mise et al. Citation2004) and a phosphodiesterase type 4 inhibitor (Tenmizu et al. Citation2006) in beagle dogs. In cynomolgus and rhesus monkeys, polymorphic variations in CYP1A1/2 (Uno and Osada Citation2011, Uno et al. Citation2018a), CYP1B1 (Uno et al. Citation2011), CYP2C9 (Uno et al. Citation2015a), CYP2C19 (Uno et al. Citation2014a), CYP2D17/44 (now termed CYP2D6/8, Uno et al. Citation2014b, Citation2015b), and CYP3A4/5 (Uno et al. Citation2018a, Citation2018b) have been reported. In terms of functional polymorphic changes in vivo, significantly higher plasma concentrations of efavirenz, a monkey CYP2C9 substrate (Iwasaki et al. Citation2016), and R-warfarin, a monkey CYP2C19 substrate (Utoh et al. Citation2015), were observed in individual mutant-type cynomolgus monkeys. Although the gene expression levels of various marmoset P450s in the major organs have been clarified (Shimizu et al. Citation2014, Sato et al. Citation2015), the extent of P450 polymorphisms in this species is not known. After extensive genome screening in nearly 80 individual marmosets, no CYP2D6 nonsynonymous mutation has yet been found (Uehara et al. Citation2017a). However, marmoset CYP2C19 polymorphism was evident and resulted in higher plasma concentrations of S-warfarin and R-omeprazole in marmosets classified as belonging to the poor metaboliser (PM) group than in those in the extensive metaboliser (EM) group (Uehara et al. Citation2016b, Kusama et al. Citation2018). As marmosets lack the CYP2C9 gene, marmoset CYP2C19 is responsible for the elimination of a wide range of drugs metabolised by human CYP2C9/19 isoforms (Uehara et al. Citation2015, Citation2019, Citation2020). Consequently, polymorphic variations of marmoset CYP2C19 may affect the prediction accuracy of human CLt for some drugs when this animal species is used without classification of their individual metabolic capabilities. Some effects of aging on CLt and enzyme inducibility by rifampicin were also found in older marmosets (10–14 years old) (Toda et al. Citation2018), and this represents an additional source of individual variability in experimental animal models.
Several years after the above-mentioned pharmacokinetic studies in marmosets (Uehara et al. Citation2016b), we had the opportunity to use two groups of the same individual marmosets; these animals had been previously classified into EM or PM phenotype groups. In the present study, 24 model compounds (18 eliminated through the catalytic activity of P450s and six not dependent on P450 metabolism) were intravenously administered to these marmosets to investigate the effects on their pharmacokinetic profiles of genetic polymorphisms in marmoset CYP2C19. The performance of the single-species allometric scaling method for predicting human CLt and Vss values based on marmoset data obtained from the EM and PM phenotype groups was compared. Furthermore, these predictions were compared with those generated using the same method based on data from ungenotyped cynomolgus or rhesus monkeys for the 15 of our 24 test compounds for which reported pharmacokinetic data in these monkeys were available.
Materials and methods
Chemical materials
The model compounds used in the present study are listed in . Acetaminophen, diclofenac, glyburide, ibuprofen, itraconazole, ketanserin, ketoprofen, lamotrigine, moxifloxacin hydrochloride monohydrate, nicardipine hydrochloride, phenytoin, repaglinide, telmisartan, tolbutamide, and verapamil hydrochloride were purchased from Tokyo Chemical Industry (Tokyo, Japan). Antipyrine, clonazepam, midazolam, and probenecid were from FUJIFILM Wako (Osaka, Japan). Dapsone, pefloxacin mesylate, S-warfarin, and zaleplon were purchased from Toronto Research (Toronto, Canada), MedChem Express (South Brunswick Township, NJ), Cayman Chemical (Pittsfield Charter Township, MI) and Key Organics (London, UK), respectively. Cilomilast was synthesised inhouse according to the method of Christensen et al. (Citation1998) (1H NMR (400 MHz, CDCl3) δ [ppm] 1.58–1.67 (m, 2H), 1.75–2.10 (m, 10H), 2.19–2.31 (m, 4H), 2.37–2.46 (m, 1H), 3.85 (s, 3H), 4.78–4.84 (m, 1H), 6.86 (d, J = 8.6 Hz, 1H), 6.97 (dd, J = 8.6, 2.3 Hz, 1H), 7.01 (d, J = 2.3 Hz, 1H)). These chemicals were chosen because they are mainly eliminated by hepatic metabolism; the exceptions are moxifloxacin and ketoprofen, which have renal excretion ratios of 21.9% and 30.0%, respectively, in humans (Varma et al. Citation2010). Human CYP2C isoforms are fully or partly involved in the metabolism of about half the tested compounds. Other P450 or non-P450 enzymes, such as aldehyde oxidase, ketone reductase, UGT, sulphotransferase, and N-acetyltransferase, are responsible for the metabolic elimination of the other compounds in humans (). The reagents and solvents used were of analytical and HPLC grade.
Table 1. Physicochemical properties, cassette-dose cocktail group numbers, LC–MS/MS conditions, and reported enzymes responsible for metabolism in humans of the 24 model compounds tested in this study.
Marmosets genotyped for CYP2C19
Administration of the test compounds and blood sampling were performed in compliance with protocols approved by the Animal Care and Use Committee of CLEA Japan Inc. (Tokyo, Japan) (application number, 55-012CJ) and Meiji Seika Pharma Co., Ltd. (Yokohama, Japan) (application number, C2018-051). According to our inhouse regulations for handling marmosets, up to seven blood samples per day (<0.3 mL each) and a total sampling volume of 2.0–2.5 mL within 1 week are allowed, and more than a 2-week rest period is required before initiation of the next experiment. Six marmosets (five male, one female, 7.2–9.2 years of age) were kindly supplied by Dr. E. Sasaki of the Central Institute for Experimental Animals (Kawasaki, Japan). Genotyping of these animals was conducted by preparing genomic DNA from ear skin samples followed by the direct sequencing of marmoset CYP2C19 exons as described previously (Uehara et al. Citation2016b). As an in vitro study described in the same report demonstrated that the Ser254Leu variant of recombinant marmoset CYP2C19 significantly altered the activity of S-warfarin 7-hydroxylation (Uehara et al. Citation2016b), this CYP2C19 variant was chosen as the determinant of PMs in this study.
The six marmosets (body weight 320–410 g) were intravenously administered a mixture of six model compounds in combination (cassette dosing; 0.10 or 0.20 mg/kg of each compound in its free form) in saline containing 1% Tween 80 and 10% dimethyl sulphoxide. Administration was through the saphenous vein or tail vein (2.5 mL/kg, within 20 s). Samples of blood (approximately 200 μL) were taken from the femoral vein (contralateral to the site of saphenous vein cassette dose administration) at appropriate time intervals without anaesthesia. Samples were centrifuged at 1200×g for 10 min, and the obtained plasma samples were stored frozen until analysis. The components of each dosing solution (cocktails 1–4) are given in . Some drugs that share the same metabolic enzyme were allocated to the same cocktail. As information on the inhibitory effects of each drug in marmosets is limited, it was assumed that no drug–drug interactions would occur at these low dose levels (Miyamoto et al. Citation2017). Two weeks later, the same animals were administered with the next cocktail of model compounds in the same manner, followed by consecutive dosing of the other cocktails with rest intervals of 2 weeks or more.
Quantification of model compounds in plasma by liquid chromatography–tandem mass spectrometry
Concentrations of the model compounds in plasma samples were determined by liquid chromatography–tandem mass spectrometry (LC–MS/MS). An internal standard solution containing imipramine and valsartan (for positive and negative ionisation modes, respectively) in acetonitrile was added to the analytical and standard samples. The tube was closed and vortex mixed for ∼10 s and subsequently centrifuged. The supernatant was pipetted into a polypropylene vial and an equal volume of Milli-Q-water was added; aliquots of the mixture (5.0 μL) were then injected into the column. LC–MS/MS analysis was performed using a Shimadzu Nexera UHPLC system (Shimadzu, Kyoto, Japan) coupled with an API QTRAP 5500 triple quadrupole mass spectrometer (Thermo Scientific, Waltham, MA).
The HPLC conditions, ionisation modes and monitored ions for each compound are listed in . The columns (CAPCELL CORE ADME, 50 mm × 2.1 mm i.d., 1.7 μm (Osaka Soda, Osaka, Japan); ACQUITY UPLC BEH C18 column, 50 mm × 2.1 mm i.d., 1.7 μm (Waters, Milford, MA); and CAPCELL PAK INERT ADME-HR, 50 mm × 2.0 mm i.d., 3.0 μm (Osaka Soda, Osaka, Japan)) were maintained at 40 °C, and analytes were eluted with a linear gradient (flow rate of 0.4 mL/min) and detected with electrospray ionisation using multiple reaction monitoring. Lower limits of quantification for the 24 compounds in plasma were 0.10–5.0 ng/mL using 4.0-μL aliquots of plasma samples.
Prediction of human pharmacokinetic parameters using single-species allometric scaling
Plasma concentrations of the model compounds in the EM and PM marmoset groups were analysed using Phoenix WinNonlin software (version 6.4) (Certara USA, Princeton, NJ) with non-compartmental methods. The CLt and Vss values were calculated from time zero to infinity for individual marmosets, and the mean values were obtained for each metaboliser group. Reported/observed CLt and Vss values in humans and in rhesus or cynomolgus monkeys were taken from the literature (Lund et al. Citation1974, Abernethy et al. Citation1991, Incecayir and Agabeyoglu Citation2006, Varma et al. Citation2010, Deguchi et al. Citation2011, Lombardo et al. Citation2013a, Citation2013b, Koyanagi et al. Citation2014, Citation2015, Miyamoto et al. Citation2017). All the tested compounds were assumed to exhibit linear pharmacokinetics within the evaluated dose ranges.
The CLt and Vss values in humans (CLt, human and Vss, human) were extrapolated from those in marmosets and rhesus/cynomolgus monkeys by using the following equations:
(1)
(1)
(2)
(2)
where BW represents the standard species body weight (0.35, 3.5, and 70 kg for marmosets, rhesus/cynomolgus monkeys, and humans, respectively). The scaling exponents (exponents ‘a’ and ‘b’ in EquationEquations (1)
(1)
(1) and Equation(2)
(2)
(2) ) for each model compound were calculated from the CLt and Vss values in animals versus the observed CLt and Vss values in humans. The overall mean scaling exponents for all 24 model compounds were then calculated from the scaling exponents of the individual compounds. These overall mean exponents were subsequently applied to predict CLt and Vss values in humans by using them as the scaling exponents in EquationEquations (1)
(1)
(1) and Equation(2)
(2)
(2) (i.e. ‘a’ and ‘b’, respectively). The predictabilities of human CLt and Vss were evaluated by whether the values fell within two- or threefold errors, and the average absolute fold error (AAFE) was calculated as follows (Obach et al. Citation1997):
Moreover, effects of changes in the scaling exponents on AAFE for CLt and Vss were evaluated in ‘Discussion’ section using stepwise increases of tentative scaling exponent from 0.4 to 0.9 and from 0.6 to 1.2, respectively.
Results
Experimental determinations for the 24 test compounds of plasma concentration–time curves in marmosets
Marmosets were allocated to the EM and PM groups according to their genotype information. Two marmosets with homozygous p.[Phe7, Ser254, Thr469] amino acid variants and one marmoset with homozygous p.[Phe7, Ser254, Ile469] amino acid variants were classified as EMs (). In contrast, two marmosets with homozygous p.[Leu7, Leu254, Ile469] amino acid variants and one marmoset with heterozygous p.[Leu7, Leu254/Ser254, Ile469] amino acid variants were classified as PMs. In a colony of younger marmosets (n = 40) in another breeding facility, marmosets with homozygous p.[Phe7, Ser254, Thr469] and p.[Leu7, Leu254, Ile469] amino acid sequences in CYP2C19 were frequently found ().
Table 2. Phenotypes and genotypes of polymorphic CYP2C19 for the six marmosets used in this study and their frequencies in a breeder cohort.
Following intravenous administrations of 24 model compounds (in four separate cocktails, each containing six substances) to marmosets, plasma concentrations of the unchanged drug declined in mono- or bi-phasic patterns with a wide range of elimination rates, as shown in . Based on these plasma concentration data sets, area under the plasma concentration–time curve (AUC) and mean residence time (MRT) values from time 0 to infinity were calculated (AUC and MRT values from time 0 to the last sampling times constituted 92.4 ± 10.1% and 78.7 ± 16.0% (means ± standard deviations) of these values, respectively). Using these pharmacokinetic parameters, observed marmoset CLt (mL/min/kg) and Vss (L/kg) (=(dose/AUC)×MRT) values were calculated for the EM and PM groups and are summarised in . As expected, the calculated marmoset CLt values of cilomilast, phenytoin, repaglinide, tolbutamide, and S-warfarin (typical human CYP2C8/9/19 substrates) were significantly lower in the PM marmoset group than in the EM group (). The eliminations of antipyrine, dapsone, diclofenac, glyburide, ibuprofen, and nicardipine were expected to be partly dependent on the CYP2C19 phenotype. These compounds constitute a second group of chemicals potentially affected by the CYP2C19 phenotype; however, no significant differences in the CLt values of these substances were observed between the two phenotype groups of marmosets. Although polymorphic marmoset CYP2C19 was responsible for eliminations from plasma of the first group of five CYP2C substrates, there were no statistically significant differences in the observed CLt values in the second group of six compounds or in the third group (i.e. the remaining 12 compounds except for lamotrigine) between the EM and PM marmoset groups under the present conditions.
Figure 2. Plasma concentrations of unchanged drug following intravenous administrations of 24 model drugs to extensive (open circles) and poor (solid triangles) metaboliser marmosets. Dosing levels were 0.20 mg/kg for ibuprofen, midazolam, and telmisartan, and 0.10 mg/kg for the other compounds. Asterisks denote compounds whose total clearances were significantly reduced in the poor metaboliser group compared with the extensive metaboliser group at significance levels of *p< 0.05 and **p< 0.01, respectively (unpaired t test). Data points are the means of three marmosets per group and the whiskers show SDs.
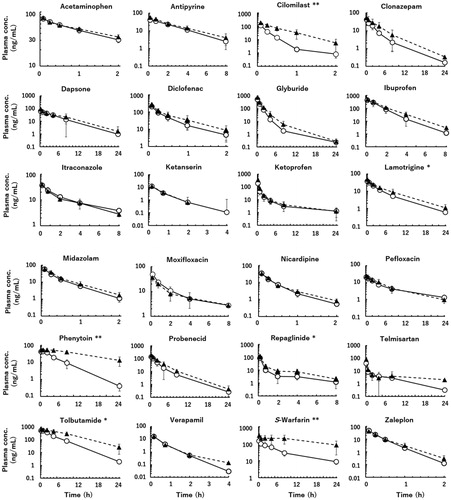
Table 3. Total clearance (CLt) values and distribution volumes at steady state (Vss) observed in marmosets and predicted for humans by single-species allometric scaling based on pharmacokinetic data sets in marmosets.
Prediction of human pharmacokinetic parameters by single-species allometric scaling based on EM and PM marmoset data
Using EquationEquations (1)(1)
(1) and Equation(2)
(2)
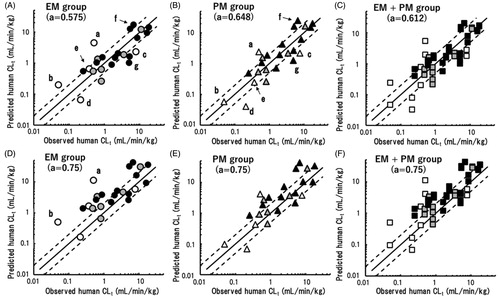
(2) shown in ‘Materials and methods’ section with overall averaged scaling exponents, human CLt and Vss values were extrapolated from the observed CLt and Vss values in the EM and PM marmoset groups; the results are shown in . The reported human plasma CLt values of these model compounds varied from 0.049 (S-warfarin) to 18.0 (verapamil) mL/min/kg. The human CLt values predicted from marmoset data sets were plotted against the observed human CLt values taken from the literature (). Among the first group of five compounds with significantly reduced CLt values in the PM group, the human CLt values of cilomilast and S-warfarin were overpredicted (exceeding twofold errors) using data from the EM marmoset group (). However, the overprediction of cilomilast was ameliorated and the CLt of S-warfarin was on the close correlation line when using data from the PM group (). In contrast, the human CLt values of repaglinide and tolbutamide were underpredicted (i.e. below the twofold error range) based on data from the EM and PM groups. The predicted human CLt of phenytoin from EM group data was higher than that from PM group data. However, both predicted human CLt values were within a twofold error, indicating good predictability. Some outliers were also evident among the predicted values for the remaining 19 of 24 compounds, e.g. ketanserin and acetaminophen. All 48 predicted CLt values, i.e. those for EM + PM marmoset groups combined, were plotted against the observed human CLt values using the overall averaged scaling exponent of 0.612; this plot showed distinct differences in the predicted CLt values of cilomilast, S-warfarin, tolbutamide, and phenytoin from EM and PM marmoset data ().
Figure 3. Relationships between observed human CLt values and those obtained by single-species allometric scaling using data from extensive metaboliser (EM) (A), poor metaboliser (PM) (B), and mixed (C) marmoset groups with corresponding mean scaling factors. (a) Cilomilast; (b) S-warfarin; (c) repaglinide; (d) tolbutamide; (e) phenytoin; (f) ketanserin; and (g) acetaminophen. The same sets of data were scaled using the generally adopted fixed exponent of 0.75 and were plotted against observed human CLt values (D–F). Open, grey, and solid symbols represent compounds with expected significant, minor, and no contributions of CYP2C19 to their metabolism, respectively. The solid and dashed lines represent unity and twofold differences, respectively.
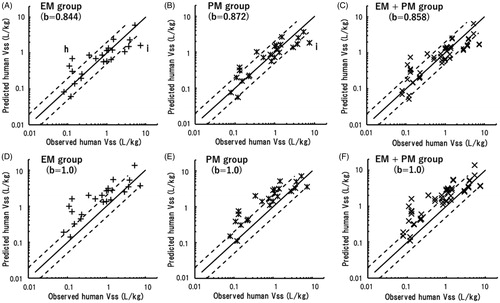
The predicted human Vss values were plotted against observed human Vss values taken from the literature (). The predicted human Vss of ketoprofen was 5.5 times higher than the observed value when using data from the EM marmoset group; moreover, the human Vss of itraconazole was underpredicted using both EM and PM marmoset data.
Figure 4. Relationships between observed human Vss values and those obtained by single-species allometric scaling using data from EM (A), PM (B), and mixed (C) marmoset groups with corresponding mean scaling factors. (h) Ketoprofen; (i) itraconazole. The same sets of data were scaled using a fixed exponent of 1.0 and were plotted against observed human Vss values (D–F). The solid and dotted lines represent unity and twofold differences, respectively.
The predicted human CLt values of the 24 test compounds correlated well with the observed human values. Of the predictions based on data from EM and PM marmosets, respectively, 54.2% and 58.3% were within a twofold error; moreover, the AAFE statistical parameter values were 2.1 and 2.0 (). The overall predictabilities of human Vss values were favourable; 70.8% and 70.8% were within a twofold range of observed human Vss values, and the AAFE values were 1.7 and 1.6 for the EM and PM datasets, respectively ().
Table 4. Average absolute fold errors (AAFEs) and the percentages of CLt and Vss values within two- and threefold errors compared with the observed values in humans for values predicted by single-species allometric scaling in extensive (EM) and poor (PM) metaboliser marmosets.
Discussion
In preclinical studies, various animal species such as mice, rats, rabbits, monkeys, and dogs () have been used for predicting in vivo human pharmacokinetics. In the current study, the applicability of marmosets (which are genetically close to humans and for which breeding systems have been established (Orsi et al. Citation2011)) were evaluated. Although marmoset data have been used for the in silico prediction of human pharmacokinetic profiles of two drugs in combination using simplified physiologically based pharmacokinetic modelling (Utoh et al. Citation2016), to the best of our knowledge, the present study is the first systematic approach using 24 model compounds to set up a general method for the prediction of human CLt and Vss of prescription drugs. EM and PM phenotype groups of marmosets were administered with human CYP2C substrates and other types of drugs in this study. Although humans and macaques both exhibit polymorphisms in some metabolic enzymes, possible variations caused by such genetic polymorphisms are difficult to compare directly with those in polymorphic marmosets; consequently, metabolic enzyme polymorphisms were not taken into account when observed CLt and Vss values were quoted from the literature.
All marmoset mRNAs encoding CYP2C subfamily proteins (i.e. CYP2C8, 2C18, 2C19, 2C58, and 2C76) are predominantly expressed in the liver (Uehara et al. Citation2015). Among these, only CYP2C19 has been found to be polymorphic. Following intravenous administrations of the 24 model compounds, significantly lower CLt values were observed in the PM group only for cilomilast, phenytoin, repaglinide, tolbutamide, S-warfarin, and lamotrigine (). Cilomilast 3-hydroxylation, the major oxidative metabolic route, is reportedly mediated by CYP2C8 in humans (Down et al. Citation2006). Formation of one of the two major human metabolites of repaglinide (resulting from hydroxylation on the piperidine ring) is also reportedly mediated by CYP2C8 (Bidstrup et al. Citation2003). Consequently, it is likely that marmoset CYP2C19 was responsible for the metabolic elimination of these compounds (substrates of human CYP2C8). Phenytoin is reportedly metabolised by p-hydroxylation mediated by human CYP2C9 and CYP2C19 (Yamamoto et al. Citation2015). Tolbutamide is reportedly converted to hydroxymethyl tolbutamide by human CYP2C9 (Lee et al. Citation2003). S-warfarin was mainly metabolised by CYP2C9 (Kaminsky and Zhang Citation1997), and the plasma clearance of S-warfarin, but not that of R-warfarin, decreased in a polymorphic CYP2C9-dependent manner in humans (Flora et al. Citation2017). These results suggest that marmoset CYP2C19 is also responsible for the metabolic elimination of some drugs eliminated by human CYP2C9 and/or CYP2C19, which is consistent with previous results (Uehara et al. Citation2015, Citation2019, Citation2020). In contrast, in humans, diclofenac is reportedly oxidised to 4′-hydroxydiclofenac primarily by CYP2C9 in parallel with direct acyl glucuronidation (Lazarska et al. Citation2018). However, there was no significant difference in the observed CLt values of diclofenac between the EM and PM marmoset groups (). This phenomenon probably occurred because the conjugation process predominated and/or the oxidation route was mainly mediated by marmoset CYP3A4/5, yielding 5-hydroxydiclofenac (Nakanishi et al. Citation2018). On the other hand, lamotrigine is reportedly metabolised mainly by human UGT1A4 and UGT2B7 but not by P450s (Inoue et al. Citation2016); consequently, there were no obvious reasons why the observed CLt of lamotrigine in the PM group of marmosets was significantly lower than that in the EM group.
The human CLt values of the 24 model compounds extrapolated using data sets from the EM and PM marmoset groups were roughly correlated with the reported human pharmacokinetic values. However, some outliers were observed. Overpredictions for cilomilast and S-warfarin based on EM marmoset data suggested that marmoset CYP2C19 had high metabolic activities towards these substances (). Using data from the PM marmosets, although these two overpredictions were diminished, the extrapolated human CLt values of repaglinide and tolbutamide were underpredicted (). In vitro experiments using liver microsome preparations have demonstrated that the metabolic activity of marmoset liver enzymes against tolbutamide (methyl hydroxylation) was consistently lower than that in cynomolgus monkeys and humans (Uehara et al. Citation2019). In contrast to the above-described outliers, the predicted human CLt values of phenytoin were within twofold errors when using either EM or PM marmoset data. These results suggested diverse substrate specificities of marmoset CYP2C19 towards human CYP2C substrates. Nevertheless, analyses of the total predictability demonstrated that more than 50% of the predicted CLt values were within a twofold range, and AAFE values were 2.1 and 2.0 for the EM and PM groups with the average exponents of 0.575 and 0.648, respectively (). It is interesting to note that the mixed group with the same total number of EM and PM marmosets (n = 48) exhibited similar predictability using the overall mean exponent of 0.612 (). These results suggested that any marmoset group would show reasonable prediction performance for CLt provided that the most appropriate exponent for each group was employed.
The human Vss values of the 24 model compounds extrapolated using data from the EM and PM marmoset groups exhibited good correlations with the observed human Vss values (). As Vss is generally governed by physicochemical properties, such as plasma protein bindings, ionisations, and lipophilicities (Jones et al. Citation2011), it is less likely to be affected by different metabolic phenotypes. However, the human Vss of ketoprofen was highly overpredicted when using data from EM marmosets. The reasons for this discrepancy were not clear (the variation was high), and further studies will be necessary. In contrast, the human Vss values of itraconazole were underpredicted using both EM and PM marmoset data. Subsequently, analyses of the total predictability demonstrated that more than 70% of the predicted Vss values were within a twofold range, and AAFE values were 1.7 and 1.6 for the EM and PM groups using the average exponents of 0.844 and 0.872, respectively (). Just as for the extrapolated human CLt values, the mixed marmoset group (EM + PM) also exhibited almost the same predictability for Vss using the mean exponent of 0.858 (). The three average exponents were mostly comparable, suggesting that any group of marmosets, irrespective of their genotypes, would likely show favourable prediction performance for Vss with a single appropriate exponent.
Single-species allometric scaling is based on a power-law relationship with body mass, and therefore, the scaling exponent is the crucial factor for determining the method’s predictive performance. In the present report, we extrapolated human CLt and Vss values using respective averaged scaling exponents obtained for different experimental conditions, as was also done by Sanoh et al. (Citation2015). However, fixed exponents of 0.75 and 1.0 derived from physiological factors as a function of body weight are often used for human CLt and Vss predictions (Hosea et al. Citation2009); moreover, fixed-exponent versus customised-exponent allometric scaling has given rise to controversy (Mahmood Citation2010, Tang et al. Citation2011, Tang and Mayersohn Citation2011). As a basis for comparison, the observed CLt and Vss values in marmosets were scaled to human values using these reported fixed exponents. Human CLt values extrapolated from the observed marmoset CLt values using the fixed exponent of 0.75 tended to be overpredicted (); in particular, those of cilomilast and S-warfarin in the EM marmoset group were major outliers (). Moreover, the AAFE values varied widely, with the worst value of 2.9 for the EM marmoset group (). Human Vss values extrapolated from the observed marmoset Vss values using the fixed exponent of 1.0 were clearly overpredicted in all three marmoset groups (); only 29.2% and 45.8% were within a twofold error, and the AAFE values were increased to 2.5 and 2.1 in the EM and PM groups, respectively ().
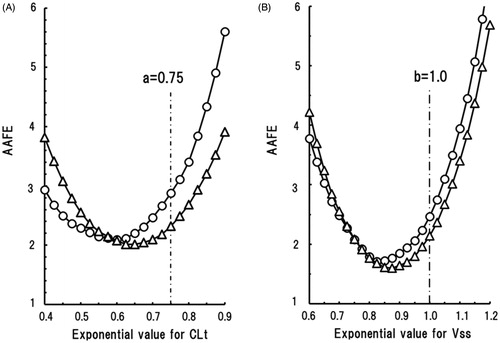
The effect of changes in the scaling exponent on the AAFE of predicted human CLt and Vss values was investigated by plotting AAFE against a range of tentative scaling exponents; the results were U-shaped curves for all the current experimental conditions. For CLt predictions (), the U-shaped curve for the EM marmoset group was shifted towards the lower exponent area compared with that of the PM group; this is explained by the higher metabolic activities towards human CYP2C9 substrates in the EM group. For Vss predictions (), the U-shaped curves of AAFE versus a range of tentative scaling exponents for the EM and PM marmoset groups were close to each other, suggesting that the effects of genetic polymorphism of CYP2C19 on Vss predictions were small. Theoretically, the minimum AAFE values on the U-shaped curves corresponded with the AAFE values calculated using the average scaling exponents. As shown by the vertical lines in , the fixed exponents of 0.75 and 1.0 resulted in non-optimal AAFE values. Consequently, more accurate predictions of CLt and Vss based on marmoset data should be performed with floating scaling exponents that match the species and experimental conditions. The optimum scaling exponents for human CLt prediction were suggested to lie below the fixed exponent of 0.75 and were depended on the marmoset genotype. Those for human Vss prediction were suggested to lie below the fixed exponent of 1.0 and appeared to be independent of the marmoset genotype. However, the outcomes of the present study with 24 model compounds are not sufficiently robust to generalise the optimum scaling exponents in this species. Nonetheless, we tentatively propose exponents of 0.65 and 0.87, respectively, for the prediction of human CLt and Vss values for new chemical substances when PM genotyped marmosets are used.
Figure 5. Shown are the effects of changes to the scaling exponent for human CLt (A) and Vss (B) predictions on the average absolute fold error (AAFE) using data from EM (circles) and PM (triangles) marmoset groups.
In the pharmaceutical industries, rhesus and cynomolgus monkeys are generally used as non-human primates for human pharmacokinetic predictions. Consequently, the predictabilities of human CLt and Vss values based on marmoset data were compared with those based on macaque data for 15 of the 24 model compounds (, ); floating scaling exponents were employed to allow valid comparisons. Using EquationEquation (1)(1)
(1) and reported macaque data, the predicted human CLt values were roughly correlated with the reported human CLt values, with some exceptions. The average exponent for macaques was also far below the fixed value of 0.75 (). Based on macaque data, the extrapolated human CLt values of clonazepam and dapsone were higher than the twofold range, and that of telmisartan was significantly lower than the twofold range (). Clonazepam is reduced to 7-amino-clonazepam in humans (Toth et al. Citation2016) and rhesus monkeys (Lai et al. Citation1979), whereas dapsone is metabolised to its N-hydroxylamine and mono acetyl dapsone in humans (Gill et al. Citation1995). Although the metabolic pathways of these compounds in marmosets are not known, the predicted human CLt values of clonazepam and dapsone based on macaque data were overpredicted, whereas those based on data from the CYP2C19 EM and PM marmoset groups were within a twofold error (). Telmisartan (Yamada et al. Citation2011) and acetaminophen (Court et al. Citation2013, Citation2017) are substrates of human UGT1A. It was interesting that the human CLt value of telmisartan was underpredicted using cynomolgus monkey data, whereas that of acetaminophen based on marmoset data was underestimated, suggesting possible species differences in the substrate specificities of UGTs between macaque and marmosets (Uno et al. Citation2019, Citation2020). Cynomolgus monkey CYP2C19 efficiently metabolised R-warfarin, but not S-warfarin (Uno et al. Citation2014a). This stereo-selectivity in cynomolgus monkeys seemed to be beneficial for prediction of the human CLt of S-warfarin. Furthermore, the PM marmoset group showed better predictability than the EM marmoset group for this compound. Miyamoto et al. (Citation2017) demonstrated that cynomolgus monkeys were a feasible animal species for predicting human CLt values of aldehyde oxidase-mediated compounds. The predictability of CLt for zaleplon, a typical aldehyde oxidase-dependent substrate, using marmoset data was similar to, or even better than, that in cynomolgus monkeys. The predictive performances for the 15 test compounds when using data from the three animal groups were not different: 66.7% of the predicted human CLt values were within a twofold range of observed human CLt values. Moreover, the AAFE values for macaques and EM and PM marmosets were 1.9, 1.8, and 1.8, respectively ().
Figure 6. Relationships between observed human CLt (A–C) and Vss (D–F) values and those extrapolated by single-species allometric scaling using data from cynomolgus or rhesus monkeys (A, D), the EM marmoset group (B, E), and the PM marmoset group (C, F). Shown are data points for the 15 of the 24 test compounds for which suitable macaque data were available. Mean scaling factors averaged over the 15 substances were used (). (1) Clonazepam; (2) dapsone; (3) telmisartan; (4) acetaminophen; (5) S-warfarin; (6) zaleplon; and (7) ketoprofen. The solid and dotted lines represent unity and twofold differences, respectively.
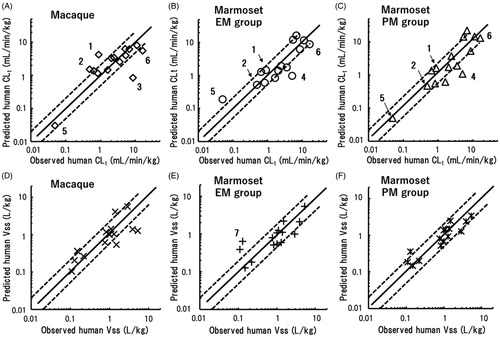
Table 5. Comparison of human total clearance (CLt) values and volumes of distribution (Vss) predicted using single-species allometric scaling from reported data in macaques and observed data in marmosets for 15 of the 24 test compounds.
Table 6. Comparison of predictabilities of human CLt and Vss values for 15 compounds using single-species allometric scaling based on data from macaques and marmosets.
Prediction and plotting of human Vss values of the 15 compounds were conducted in the same manner using EquationEquation (2)(2)
(2) (, ). Relatively good correlations were found between observed and predicted human Vss values when using data from the three animal groups. Among these animal groups, the PM marmoset group was somewhat advantageous compared to the other groups because 100% of Vss predictions were within a threefold error. AAFE values for Vss based on data from macaques, EM marmosets and PM marmosets were 1.7, 1.7, and 1.5, respectively ().
In conclusion, the present study was conducted using the same individual marmosets (now around 8 years old) as those used several years ago in an initial pharmacokinetic study (Uehara et al. Citation2016b and unpublished data); reproducible outcomes for the relevant drugs were evident, thereby demonstrating the feasibility of long-term usage of this animal model. In the single-species allometric scaling method using marmosets, the most appropriate scaling exponent for the relevant CYP2C19 genotype group and a single appropriate exponent for any genotype group were suggested to provide favourable predictabilities for human CLt and Vss, respectively. Although some species differences are inevitable, reasonable predictabilities for human CLt and Vss based on marmoset data (similar to those based on cynomolgus or rhesus monkey data) suggest that phenotyped marmosets could be a small, cost-effective species for such pharmacokinetic studies. Furthermore, for use in combination with the single-species allometric scaling method, marmosets have advantages over multiple-species-based allometry for predicting human pharmacokinetics at the early stage of drug development.
Acknowledgements
The authors thank Drs. Erika Sasaki and Masafumi Yamamoto of the Central Institute for Experimental Animals for providing and genotyping the marmosets. The authors also greatly thank David Smallbones for copyediting a draft of this article.
Disclosure statement
HK, HI, SM, MH, and MN are employees of CLEA Japan, Inc., the contract research organisation and breeder of common marmosets. The other authors have no interests to declare.
Correction Statement
This article has been republished with minor changes. These changes do not impact the academic content of the article.
Additional information
Funding
References
- Abernethy, D.R., Kaminsky, L.S., and Dickinson, T.H., 1991. Selective inhibition of warfarin metabolism by diltiazem in humans. The journal of pharmacology and experimental therapeutics, 257 (1), 411–415.
- Bezerra, L.S., et al., 2018. Impacts of cytochrome P450 2D6 (CYP2D6) genetic polymorphism in tamoxifen therapy for breast cancer. Revista Brasileira de ginecologia e obstetricia, 40 (12), 794–799.
- Bidstrup, T.B., et al., 2003. CYP2C8 and CYP3A4 are the principal enzymes involved in the human in vitro biotransformation of the insulin secretagogue repaglinide. British journal of clinical pharmacology, 56 (3), 305–314.
- Bird, T.G., et al., 1992. Pharmacokinetics of catechol cephalosporins. The effect of incorporating substituents into the catechol moiety on pharmacokinetics in a marmoset model. Journal of medicinal chemistry, 35 (14), 2643–2651.
- Buchheit, D., et al., 2011. Production of ibuprofen acyl glucosides by human UGT2B7. Drug metabolism and disposition, 39 (12), 2174–2181.
- Charfi, R., et al., 2018. Response to clopidogrel and of the cytochrome CYP2C19 gene polymorphism. La Tunisie medicale, 96 (3), 209–218.
- Christensen, S.B., et al., 1998. 1,4-Cyclohexanecarboxylates: potent and selective inhibitors of phosphodiesterase 4 for the treatment of asthma. Journal of medicinal chemistry, 41 (6), 821–835.
- Court, M.H., et al., 2013. The UDP-glucuronosyltransferase (UGT) 1A polymorphism c.2042C>G (rs8330) is associated with increased human liver acetaminophen glucuronidation, increased UGT1A exon 5a/5b splice variant mRNA ratio, and decreased risk of unintentional acetaminophen-induced acute liver failure. The journal of pharmacology and experimental therapeutics, 345 (2), 297–307.
- Court, M.H., et al., 2017. Race, gender, and genetic polymorphism contribute to variability in acetaminophen pharmacokinetics, metabolism, and protein-adduct concentrations in healthy African-American and European-American volunteers. Journal of pharmacology and experimental therapeutics, 362 (3), 431–440.
- da Silveira, M., et al., 2019. Polymorphisms of CYP2C9*2, CYP2C9*3 and VKORC1 genes related to time in therapeutic range in patients with atrial fibrillation using warfarin. The application of clinical genetics, 12, 151–159.
- Davies, B. and Morris, T., 1993. Physiological parameters in laboratory animals and humans. Pharmaceutical research, 10 (7), 1093–1095.
- Deguchi, T., et al., 2011. Human pharmacokinetic prediction of UDP-glucuronosyltransferase substrates with an animal scale-up approach. Drug metabolism and disposition, 39 (5), 820–829.
- Di, L., et al., 2013. A perspective on the prediction of drug pharmacokinetics and disposition in drug research and development. Drug metabolism and disposition, 41 (12), 1975–1993.
- Down, G., et al., 2006. Clinical pharmacology of cilomilast. Clinical pharmacokinetics, 45, 217–233.
- Eason, C.T., et al., 1988. The relationship between the pharmacokinetics of amrinone in the marmoset and platelet effects. European journal of drug metabolism and pharmacokinetics, 13 (2), 129–133.
- Engel, G., et al., 1996. Antipyrine as a probe for human oxidative drug metabolism: identification of the cytochrome P450 enzymes catalyzing 4-hydroxyantipyrine, 3-hydroxymethylantipyrine, and norantipyrine formation. Clinical pharmacology and therapeutics, 59 (6), 613–623.
- Flora, D.R., et al., 2017. CYP2C9 genotype-dependent warfarin pharmacokinetics: impact of CYP2C9 genotype on R- and S-warfarin and their oxidative metabolites. Journal of clinical pharmacology, 57 (3), 382–393.
- Gabrielsson, J. and Hjorth, S., 2012. Chapter 7 – principles of inter-species scaling. In: Quantitative pharmacology: an introduction to integrative pharmacokinetic–pharmacodynamic analysis. Stockholm, Sweden: Apotekarsocieteten-Swedish Academy of Pharmaceutical Sciences, 207–249.
- Gill, H.J., Tingle, M.D., and Park, B.K., 1995. N-Hydroxylation of dapsone by multiple enzymes of cytochrome P450: implications for inhibition of haemotoxicity. British journal of clinical pharmacology, 40 (6), 531–538.
- Guengerich, F.P., 2008. Cytochrome p450 and chemical toxicology. Chemical research in toxicology, 21 (1), 70–83.
- Hosea, N.A., et al., 2009. Prediction of human pharmacokinetics from preclinical information: comparative accuracy of quantitative prediction approaches. Journal of clinical pharmacology, 49 (5), 513–533.
- Incecayir, T. and Agabeyoglu, I., 2006. Bioavailability file: lamotrigine. FABAD journal of pharmaceutical sciences, 31, 163–179.
- Inoue, K., et al., 2016. Factors that influence the pharmacokinetics of lamotrigine in Japanese patients with epilepsy. European journal of clinical pharmacology, 72 (5), 555–562.
- Iwasaki, K., et al., 2016. In vivo individual variations in pharmacokinetics of efavirenz in cynomolgus monkeys genotyped for cytochrome P450 2C9. Biopharmaceutics & drug disposition, 37 (6), 379–383.
- Jones, R.D., et al., 2011. PhRMA CPCDC initiative on predictive models of human pharmacokinetics, part 2: comparative assessment of prediction methods of human volume of distribution. Journal of pharmaceutical sciences, 100 (10), 4074–4089.
- Kamimura, H., 2006. Genetic polymorphism of cytochrome P450s in beagles: possible influence of CYP1A2 deficiency on toxicological evaluations. Archives of toxicology, 80 (11), 732–738.
- Kaminsky, L.S. and Zhang, Z.Y., 1997. Human P450 metabolism of warfarin. Pharmacology & therapeutics, 73 (1), 67–74.
- Karaźniewicz-Łada, M., Luczak, M., and Główka, F., 2009. Pharmacokinetic studies of enantiomers of ibuprofen and its chiral metabolites in humans with different variants of genes coding CYP2C8 and CYP2C9 isoenzymes. Xenobiotica, 39 (6), 476–485.
- Kinzig-Schippers, M., et al., 1999. Interaction of pefloxacin and enoxacin with the human cytochrome P450 enzyme CYP1A2. Clinical pharmacology and therapeutics, 65 (3), 262–274.
- Koehler, S.C., et al., 2006. Marmoset CYP3A21, a model for human CYP3A4: protein expression and functional characterization of the promoter. Xenobiotica, 36 (12), 1210–1226.
- Korte, S. and Everitt, J., 2019. Chapter 27 – the use of the marmoset in toxicity testing and nonclinical safety assessment studies. In: R. Marini, et al., eds. The common marmoset in captivity and biomedical research. Academic Press, 493–513.
- Koyanagi, T., et al., 2014. Age-related pharmacokinetic changes of acetaminophen, antipyrine, diazepam, diphenhydramine, and ofloxacin in male cynomolgus monkeys and beagle dogs. Xenobiotica, 44 (10), 893–901.
- Koyanagi, T., et al., 2015. Age-related changes of hepatic clearances of cytochrome P450 probes, midazolam and R-/S-warfarin in combination with caffeine, omeprazole and metoprolol in cynomolgus monkeys using in vitro–in vivo correlation. Xenobiotica, 45 (4), 312–321.
- Kroemer, H.K., et al., 1993. Identification of P450 enzymes involved in metabolism of verapamil in humans. Naunyn-Schmiedeberg's archives of pharmacology, 348, 332–337.
- Kusama, T., et al., 2018. Association with polymorphic marmoset cytochrome P450 2C19 of in vivo hepatic clearances of chirally separated R-omeprazole and S-warfarin using individual marmoset physiologically based pharmacokinetic models. Xenobiotica, 48 (10), 1072–1077.
- Lai, A.A., et al., 1979. Kinetics of biotransformation of clonazepam to its 7-amino metabolite in the monkey. Journal of pharmacokinetics and biopharmaceutics, 7 (1), 87–95.
- Lazarska, K.E., et al., 2018. Effect of UGT2B7*2 and CYP2C8*4 polymorphisms on diclofenac metabolism. Toxicology letters, 284, 70–78.
- Lee, C.R., et al., 2003. Tolbutamide, flurbiprofen, and losartan as probes of CYP2C9 activity in humans. Journal of clinical pharmacology, 43 (1), 84–91.
- Lombardo, F., et al., 2013a. Comprehensive assessment of human pharmacokinetic prediction based on in vivo animal pharmacokinetic data, part 2: clearance. Journal of clinical pharmacology, 53 (2), 178–191.
- Lombardo, F., et al., 2013b. Comprehensive assessment of human pharmacokinetic prediction based on in vivo animal pharmacokinetic data, part 1: volume of distribution at steady state. The journal of clinical pharmacology, 53 (2), 167–177.
- Lund, L., et al., 1974. Pharmacokinetics of single and multiple doses of phenytoin in man. European journal of clinical pharmacology, 7 (2), 81–86.
- Mahmood, I., 2010. Theoretical versus empirical allometry: facts behind theories and application to pharmacokinetics. Journal of pharmaceutical sciences, 99 (7), 2927–2933.
- Mise, M., et al., 2004. Polymorphic expression of CYP1A2 leading to interindividual variability in metabolism of a novel benzodiazepine receptor partial inverse agonist in dogs. Drug metabolism and disposition, 32 (2), 240–245.
- Miyamoto, M., et al., 2017. Comparison of predictability for human pharmacokinetics parameters among monkeys, rats, and chimeric mice with humanised liver. Xenobiotica, 47 (12), 1052–1063.
- Moise, P.A., Birmingham, M.C., and Schentag, J.J., 2000. Pharmacokinetics and metabolism of moxifloxacin. Drugs of today (Barcelona, Spain: 1998), 36 (4), 229–244.
- Nakamura, K., et al., 2005. Inhibitory effects of nicardipine to cytochrome P450 (CYP) in human liver microsomes. Biological & pharmaceutical bulletin, 28 (5), 882–885.
- Nakanishi, K., et al., 2018. In vivo and in vitro diclofenac 5-hydroxylation mediated primarily by cytochrome P450 3A enzymes in common marmoset livers genotyped for P450 2C19 variants. Biochemical pharmacology, 152, 272–278.
- Nelson, M., et al., 2010. Bioavailability and efficacy of levofloxacin against Francisella tularensis in the common marmoset (Callithrix jacchus). Antimicrobial agents and chemotherapy, 54 (9), 3922–3926.
- Obach, R.S., et al., 1997. The prediction of human pharmacokinetic parameters from preclinical and in vitro metabolism data. The journal of pharmacology and experimental therapeutics, 283 (1), 46–58.
- Orsi, A., et al., 2011. Overview of the marmoset as a model in nonclinical development of pharmaceutical products. Regulatory toxicology and pharmacology, 59 (1), 19–27.
- Peng, C.C., et al., 2012. Stereospecific metabolism of itraconazole by CYP3A4: dioxolane ring scission of azole antifungals. Drug metabolism and disposition, 40 (3), 426–435.
- Perel, J.M., et al., 1970. Identification and renal excretion of probenecid metabolites in man. Life sciences. Pt. 1: physiology and pharmacology, 9 (23), 1337–1343.
- Persson, B., Heykants, J., and Hedner, T., 1991. Clinical pharmacokinetics of ketanserin. Clinical pharmacokinetics, 20 (4), 263–279.
- Renwick, A.B., et al., 1998. Metabolism of zaleplon by human hepatic microsomal cytochrome P450 isoforms. Xenobiotica, 28 (4), 337–348.
- Ring, B.J., et al., 2011. PhRMA CPCDC initiative on predictive models of human pharmacokinetics, part 3: comparative assessment of prediction methods of human clearance. Journal of pharmaceutical sciences, 100 (10), 4090–4110.
- Sabolovic, N., et al., 2000. Nonsteroidal anti-inflammatory drugs and phenols glucuronidation in Caco-2 cells: identification of the UDP-glucuronosyltransferases UGT1A6, 1A3 and 2B7. Life sciences, 67 (2), 185–196.
- Sanoh, S., et al., 2015. Predictability of plasma concentration–time curves in humans using single-species allometric scaling of chimeric mice with humanized liver. Xenobiotica, 45 (7), 605–614.
- Sato, K., et al., 2015. Resequencing of the common marmoset genome improves genome assemblies and gene-coding sequence analysis. Scientific reports, 5, 16894.
- Schmahl, H.J., Nau, H., and Neubert, D., 1988. The enantiomers of the teratogenic thalidomide analogue EM 12: 1. Chiral inversion and plasma pharmacokinetics in the marmoset monkey. Archives of toxicology, 62 (2–3), 200–204.
- Shimizu, M., et al., 2014. Qualitative de novo analysis of full length cDNA and quantitative analysis of gene expression for common marmoset (Callithrix jacchus) transcriptomes using parallel long-read technology and short-read sequencing. PLoS One, 9 (6), e100936.
- Shin, K.H., et al., 2013. Evaluation of endogenous metabolic markers of hepatic CYP3A activity using metabolic profiling and midazolam clearance. Clinical pharmacology & therapeutics, 94 (5), 601–609.
- Soars, M.G., Riley, R.J., and Burchell, B., 2001. Evaluation of the marmoset as a model species for drug glucuronidation. Xenobiotica, 31 (12), 849–860.
- Tang, H., et al., 2011. Controversy in the allometric application of fixed- versus varying-exponent models: a statistical and mathematical perspective. Journal of pharmaceutical sciences, 100 (2), 402–410.
- Tang, H. and Mayersohn, M., 2011. Controversies in allometric scaling for predicting human drug clearance: an historical problem and reflections on what works and what does not. Current topics in medicinal chemistry, 11 (4), 340–350.
- Tenmizu, D., et al., 2006. The canine CYP1A2 deficiency polymorphism dramatically affects the pharmacokinetics of 4-cyclohexyl-1-ethyl-7-methylpyrido[2,3-D]-pyrimidine-2-(1H)-one (YM-64227), a phosphodiesterase type 4 inhibitor. Drug metabolism and disposition, 34 (5), 800–806.
- Toda, A., et al., 2018. Effects of aging and rifampicin pretreatment on the pharmacokinetics of human cytochrome P450 probes caffeine, warfarin, omeprazole, metoprolol and midazolam in common marmosets genotyped for cytochrome P450 2C19. Xenobiotica, 48 (7), 720–726.
- Toth, K., et al., 2016. Optimization of clonazepam therapy adjusted to patient's CYP3A status and NAT2 genotype. International journal of neuropsychopharmacology, 19 (12), pyw083.
- Uehara, S., et al., 2015. Novel marmoset cytochrome P450 2C19 in livers efficiently metabolizes human P450 2C9 and 2C19 substrates, S-warfarin, tolbutamide, flurbiprofen, and omeprazole. Drug metabolism and disposition, 43 (10), 1408–1416.
- Uehara, S., et al., 2016a. Simultaneous pharmacokinetics evaluation of human cytochrome P450 probes, caffeine, warfarin, omeprazole, metoprolol and midazolam, in common marmosets (Callithrix jacchus). Xenobiotica, 46 (2), 163–168.
- Uehara, S., et al., 2016b. Individual differences in metabolic clearance of S-warfarin efficiently mediated by polymorphic marmoset cytochrome P450 2C19 in livers. Drug metabolism and disposition, 44 (7), 911–915.
- Uehara, S., et al., 2017a. Regio- and stereo-selective oxidation of a cardiovascular drug, metoprolol, mediated by cytochrome P450 2D and 3A enzymes in marmoset livers. Drug metabolism and disposition, 45 (8), 896–899.
- Uehara, S., et al., 2017b. Marmoset cytochrome P450 3A4 ortholog expressed in liver and small-intestine tissues efficiently metabolizes midazolam, alprazolam, nifedipine, and testosterone. Drug metabolism and disposition, 45 (5), 457–467.
- Uehara, S., et al., 2017c. Functional characterization and tissue expression of marmoset cytochrome P450 2E1. Biopharmaceutics & drug disposition, 38 (6), 394–397.
- Uehara, S., et al., 2018. Molecular cloning and tissue distribution of a novel marmoset ABC transporter. Biopharmaceutics & drug disposition, 39 (1), 59–63.
- Uehara, S., et al., 2019. Survey of drug oxidation activities in hepatic and intestinal microsomes of individual common marmosets, a new nonhuman primate animal model. Current drug metabolism, 20 (2), 103–113.
- Uehara, S., Uno, Y., and Yamazaki, H., 2020. The marmoset cytochrome P450 superfamily: sequence/phylogenetic analyses, genomic structure, and catalytic function. Biochemical pharmacology, 171, 113721.
- Ueshima, Y., et al., 1996. Acetaminophen metabolism in patients with different cytochrome P-4502E1 genotypes. Alcoholism: clinical and experimental research, 20 (1 Suppl.), 25A–28A.
- Uno, Y., et al., 2014a. CYP2C19 polymorphisms account for inter-individual variability of drug metabolism in cynomolgus macaques. Biochemical pharmacology, 91 (2), 242–248.
- Uno, Y., et al., 2014b. Polymorphisms of CYP2D17 in cynomolgus and rhesus macaques: an evidence of the genetic basis for the variability of CYP2D-dependent drug metabolism. Drug metabolism and disposition, 42 (9), 1407–1410.
- Uno, Y., et al., 2015a. Genetic polymorphism of cynomolgus and rhesus macaque CYP2C9. Drug metabolism and pharmacokinetics, 30 (1), 130–132.
- Uno, Y., et al., 2015b. CYP2D44 polymorphisms in cynomolgus and rhesus macaques. Molecular biology reports, 42 (7), 1149–1155.
- Uno, Y., et al., 2018a. Cytochrome P450 1A1, 2C9, 2C19, and 3A4 polymorphisms account for interindividual variability of toxicological drug metabolism in cynomolgus macaques. Chemical research in toxicology, 31 (12), 1373–1381.
- Uno, Y., et al., 2019. Functional and molecular characterization of UDP-glucuronosyltransferase 2 family in cynomolgus macaques. Biochemical pharmacology, 163, 335–344.
- Uno, Y., et al., 2020. Molecular characterization of functional UDP-glucuronosyltransferases 1A and 2B in common marmosets. Biochemical pharmacology, 172, 113748.
- Uno, Y., Matsushita, A., and Yamazaki, H., 2011. CYP1B1 is polymorphic in cynomolgus and rhesus macaques. The journal of veterinary medical science, 73 (9), 1229–1231.
- Uno, Y. and Osada, N., 2011. CpG site degeneration triggered by the loss of functional constraint created a highly polymorphic macaque drug-metabolizing gene, CYP1A2. BMC evolutionary biology, 11, 283.
- Uno, Y., Uehara, S., and Yamazaki, H., 2016. Utility of non-human primates in drug development: comparison of non-human primate and human drug-metabolizing cytochrome P450 enzymes. Biochemical pharmacology, 121, 1–7.
- Uno, Y., Uehara, S., and Yamazaki, H., 2018b. Genetic polymorphisms of drug-metabolizing cytochrome P450 enzymes in cynomolgus and rhesus monkeys and common marmosets in preclinical studies for humans. Biochemical pharmacology, 153, 184–195.
- Utoh, M., et al., 2015. Slow R-warfarin 7-hydroxylation mediated by P450 2C19 genetic variants in cynomolgus monkeys in vivo. Biochemical pharmacology, 95 (2), 110–114.
- Utoh, M., et al., 2016. Human plasma concentrations of cytochrome P450 probe cocktails extrapolated from pharmacokinetics in mice transplanted with human hepatocytes and from pharmacokinetics in common marmosets using physiologically based pharmacokinetic modeling. Xenobiotica, 46 (12), 1049–1055.
- Varma, M.V., et al., 2010. Physicochemical space for optimum oral bioavailability: contribution of human intestinal absorption and first-pass elimination. Journal of medicinal chemistry, 53 (3), 1098–1108.
- Wang, L., et al., 2018. Impact of CYP2A6 gene polymorphism on the pharmacokinetics of dexmedetomidine for premedication. Expert review of clinical pharmacology, 11 (9), 917–922.
- Ward, K.W. and Smith, B.R., 2004a. A comprehensive quantitative and qualitative evaluation of extrapolation of intravenous pharmacokinetic parameters from rat, dog, and monkey to humans. I. Clearance. Drug metabolism and disposition, 32 (6), 603–611.
- Ward, K.W. and Smith, B.R., 2004b. A comprehensive quantitative and qualitative evaluation of extrapolation of intravenous pharmacokinetic parameters from rat, dog, and monkey to humans. II. Volume of distribution and mean residence time. Drug metabolism and disposition, 32 (6), 612–619.
- Wiltshire, H.R., et al., 1997. Metabolism of the calcium antagonist, mibefradil (POSICOR, Ro 40-5967). Part III. Comparative pharmacokinetics of mibefradil and its major metabolites in rat, marmoset, cynomolgus monkey and man. Xenobiotica, 27 (6), 557–571.
- Yamada, A., et al., 2011. The impact of pharmacogenetics of metabolic enzymes and transporters on the pharmacokinetics of telmisartan in healthy volunteers. Pharmacogenetics and genomics, 21 (9), 523–530.
- Yamamoto, Y., et al., 2015. Individualized phenytoin therapy for Japanese pediatric patients with epilepsy based on CYP2C9 and CYP2C19 genotypes. Therapeutic drug monitoring, 37 (2), 229–235.
- Zhang, T., et al., 2015. Prospective predictions of human pharmacokinetics for eighteen compounds. Journal of pharmaceutical sciences, 104 (9), 2795–2806.
- Zharikova, O.L., et al., 2009. Identification of the major human hepatic and placental enzymes responsible for the biotransformation of glyburide. Biochemical pharmacology, 78 (12), 1483–1490.