
Abstract
Understanding cytochrome P450 (CYP) enzymes in the canine intestine is vital for predicting drug metabolism and developing safer oral medications. This study evaluates canine colonoids as a model to assess the expression and induction of essential intestinal CYP enzymes.
Canine colonoids were cultured in expansion medium (EM) with Wnt-3A and in differentiation medium (DM) without Wnt-3A. We assessed the mRNA expression of CYP2B11, CYP2C21, CYP3A12, and CYP3A98 using qPCR and examined the effects of rifampicin and phenobarbital as inducers.
Our findings show that DM significantly increased the mRNA expression of CYP3A98 and CYP2B11, but not CYP3A12, compared to EM. CYP2C21, not typically expressed in the intestine, remained unexpressed in colonoids. Rifampicin induced CYP3A98, aligning with pregnane x receptor (PXR) regulation, while phenobarbital did not, suggesting no constitutive androstane receptor (CAR) involvement. CYP2B11 did not respond to either inducer, suggesting alternative regulatory pathways in canine colonoids.
This study is a pioneering effort to establish conditions for studying P450 expression in canine colonoids, confirming significant CYP3A98 expression in the canine intestine. It demonstrated colonoids can induce CYP activity post drug treatments. Further research is needed to enhance species-specific drug metabolism understanding and validate this model for broader applications.
Introduction
Cytochrome P450 (CYP) enzymes are essential in the detoxification (or bioactivation) and elimination of a vast range of chemicals (Martinez et al. Citation2013; Court Citation2013b) These enzymes are highly expressed in the liver, which is considered the primary site for metabolism of drugs (Court Citation2013a). However, their role in the intestine, especially concerning orally administered drugs, is also crucial to drug metabolism (Dressman and Thelen Citation2009). The CYP3A subfamily, within the broader CYP enzyme family, is particularly significant because they are highly expressed in the liver and intestines, and metabolise a large number of drugs (Court Citation2013a). Recent research has identified distinct enzymes within this subfamily, such as the liver-specific CYP3A12 and intestine-specific CYP3A98 in dogs (Uno et al. Citation2023).
The expression and activity of CYP enzymes are influenced by various factors including genetic polymorphisms (Kamimura Citation2006), physiological conditions (age, gender, hormone levels) (Zanger and Schwab Citation2013), exposure to dietary, pharmaceutical, and other exogenous chemicals (enzyme inducers and inhibitors; Zhao et al. Citation2021), and pathological states (neoplasia, inflammation; Stipp and Acco Citation2021). These variables can lead to altered drug efficacy (increased or decreased) with the potential for unexpected adverse drug reactions. Predicting adverse reactions involving existing drugs and pharmaceuticals in development is a challenge. Studies of drug toxicity in live animals are limited by cost and ethical concerns. Consequently, alternative methods using in vitro models that fully recapitulate physiology are needed. Tissue fractions (liver and intestinal microsomes) and recombinant P450 enzymes can provide some information regarding the involvement of specific P450s, effect of genetic polymorphisms, and likelihood of inhibitory drug-drug interactions. However, past research has struggled with the precise differentiation between the CYP3A12 and CYP3A98 isoforms in the canine intestine, resulting in inconsistent conclusions regarding CYP3A enzyme activity in various studies (Myers et al. Citation2001; Kawalek et al. Citation2003).
Canine intestinal organoids, derived from intestinal adult stem cells, mature into differentiated canine intestinal epithelial cells (Powell and Behnke Citation2017; Chandra et al. Citation2019; Gabriel et al. Citation2022). These organoids offer a physiologically relevant model compared to traditional in vitro models like Caco-2 cells and Madin–Darby canine kidney (MDCK) cells (Gabriel et al. Citation2022; Sahoo et al. Citation2023). While these cell lines are recognised in the pharmaceutical industry for predicting canine intestinal drug metabolism, their extrapolation to actual canine physiology must be approached with caution. For instance, Caco-2 cells, which represent only a single cell type from the small intestine’s epithelial layer and lack goblet cells essential for mucus production (Fogh, Wright, and Loveless Citation1977), fail to facilitate the assessment of mucus-drug interactions (Sigurdsson, Kirch, and Lehr Citation2013; Corfield Citation2015). Additionally, these cells lack several nuclear transcription factors found in the intestine, limiting their ability to mimic drug-induced enzyme expression (Brück et al. Citation2017).
A recent comparative study between Caco-2-derived monolayers and monolayers from canine colonic organoids focused on the expression of P450 enzyme genes (Sahoo et al. Citation2023). However, the ideal conditions to assess P450 expression and induction in these canine intestinal organoids remain to be thoroughly investigated. The development of more physiologically accurate in vitro models not only offers ethical and financial advantages over live animal experiments but also aligns with the 3 R principles of ‘Replacement, Reduction, and Refinement’, especially considering the reuse potential of stored organoids.
In our study, we developed canine colonoids from the intestines of healthy dogs to investigate the expression of key P450 genes, notably the newly identified intestine-specific CYP3A98, under different media conditions. Additionally, we assessed the induction of P450 genes in response to phenobarbital and rifampicin on day 8 of the culture process. This study aims to validate the use of canine intestinal organoids as an effective method for predicting drug metabolism in dogs. Such advancements could significantly contribute to the field of personalised veterinary medicine by tailoring drug treatments to individual canine patients.
Materials and methods
Generation and maintenance of normal canine colonoids
For our study, intestinal biopsies were sourced from three clinically healthy dogs undergoing dental procedures at the Washington State University Veterinary Teaching Hospital Community Service. These dogs, aged between 1 and 12 years, were selected based on comprehensive physical examinations, blood work, and no history of chronic diseases affecting the heart, kidneys, liver, or intestines. Only those dogs deemed fit for elective anaesthesia were included in the study. This study was conducted with the approval of the Washington State University Institutional Animal Care and Use Committee (IACUC Approval: ASAF#6993), with details on the dogs provided in Supplementary Table 1. Colonic stem cells were isolated from the biopsies using a protocol described in a previous study (Ambrosini et al. Citation2020). The process involved thoroughly washing the colonic biopsies in ice-cold Dulbecco’s phosphate-buffered saline (PBS, Gibco) with 1x Penicillin/Streptomycin (Gibco), repeating this step five times. The biopsies were then cut into small pieces and treated with a 30 mM EDTA solution (Invitrogen) for 60 min at 4 °C to extract crypts containing intestinal stem cells. These crypts were then embedded in Matrigel (Corning) and seeded into 48-well plates (Thermo Scientific), with 30 µl of the mixture per well. The Matrigel domes were solidified in a 37 °C incubator before adding 500 µl of organoid expansion medium (EM) to each well. For composition of EM, we followed the previous study; DMEM/F12 (Gibco) supplemented with 2 mM GlutaMAX (Gibco), 10 mM HEPES (Gibco), 1× Penicillin/Streptomycin (Gibco), 10% (vol/vol) conditioned medium of Noggin (Heijmans et al. Citation2013), 20% (vol/vol) conditioned medium of R-spondin, 100 ng/ml recombinant murine Wnt-3a (PeproTech), 50 ng/ml murine Epidermal Growth Factor (EGF) (PeproTech), 10 nM gastrin (Sigma–Aldrich), 500 nM A-83-01 (Sigma–Aldrich), 10 µM SB202190 (Sigma–Aldrich), 1 mM n-acetyl-L-cysteine (MP Biomedicals), 10 mM nicotinamide (Sigma–Aldrich), 1× B27 supplement (Gibco), 1× N2 MAX media supplement (R&D Systems), 100 µg/ml Pimocin (Invitrogen). For the initial 2 days following crypt isolation, 10 µM Y-27632 (Stem Cell Technologies) and 2.5 µM CHIR 99021 (Stem Cell Technologies) were added to the culture medium. The medium was refreshed every other day. Once the colonoids reached maturity, the Matrigel dome was dissolved using Cell Recovery Solution (Corning), and the colonoids were processed with TrypLE Express (Gibco), centrifuged, resuspended in Matrigel, and reseeded into a 48-well plate.
Differentiation of canine colonoids
In this study, P450 gene expression levels were compared in colonoids incubated in EM versus those in organoid differentiation medium (DM). The protocol involved initially incubating the organoids in EM for 4 days until they reached maturity. Subsequently, the EM was completely removed, and the organoids were washed twice with PBS before the addition of DM. DM composition was adapted from a previous study (Sato et al. Citation2011), essentially comprising EM without the inclusion of Wnt-3a, nicotinamide, and SB202190. The medium was refreshed every two days. After a 4-day cultivation period in DM, the colonoids were harvested using Cell Recovery Solution. For comparative purposes, another set of colonoids were continuously cultured in EM for a total of 8 days and then collected for analysis.
Drug induction of P450 using canine colonoids
To determine whether the expression levels of CYP2B11 and CYP3A98, which are the two major drug metabolising P450 enzymes in intestines (Court Citation2013a; Uno et al. Citation2023), increase due to specific inducers, we conducted a drug induction assay using canine colonoids. Following previous reports, we used phenobarbital as a CYP2B11 inducer and rifampicin as a CYP3A subfamily inducer (Graham et al. Citation2002). After 4 days of culture in EM, the colonoids were cultured for 4 days in DM containing 250 µM of phenobarbital or 50 µM of rifampicin. For the control, DM containing 0.1% Dimethyl Sulfoxide (DMSO), the solvent for phenobarbital and rifampicin, was used. After the culture, the colonoids were collected using a Cell Recovery Solution.
Total RNA extraction and quantitative reverse transcription polymerase chain reaction analysis
After collection, the colonoids were washed twice using PBS and centrifuged (200 g, 5 min, at 4 °C). Total RNA was then extracted from these samples using the RNeasy Mini Kit (Qiagen). Dog duodenum and colon total RNA derived from single health beagle dog (DR-307 and DR-311, Zyagen) were served as the template for reverse transcription. These RNAs served as the template for reverse transcription, performed using the High-Capacity cDNA Reverse Transcription Kit (Applied Biosystems). Based on prior research (Heikkinen et al. Citation2012; Uno et al. Citation2023), we investigated key intestinal-specific CYP genes, CYP3A98 (initially identified as CYP3A12) and CYP2B11, as positive controls, and genes not typically expressed in the intestinal tract, CYP2C21, as a negative control. Additionally, key transcription factors for CYP2B11 and CYP3A98 of the constitutive androstane receptor (CAR) and the pregnane X receptor (PXR) were included in the panel. To evaluate the differentiation status within the colonoids, we explored a variety of multilineage marker genes, such as LGR5, MUC2, Chromogranin A, Lysozyme based on previous studies (Sato et al. Citation2011). For the quantification of gene expression, we employed quantitative PCR (qPCR), utilising PowerUp SYBR Green Master Mix (Applied Biosystems) and the CFX96 Touch Real-time PCR Detection System (Bio-Rad, Hercules, CA). To normalise gene expression, we used succinate dehydrogenase complex subunit A (SDHA), hydroxymethyl-bilane synthase (HMBS), and hypoxanthine phosphoribosyl-transferase 1 (HPRT1), stably expressed in duodenum and colon as an internal control gene as previously established (Peters et al. Citation2007). Details of all primers used are provided in Supplementary Table 2. To assess the size specificity of the qPCR products, we employed agarose gel electrophoresis. Following electrophoresis using a 3.0% agarose gel, the gel was stained using SYBR Safe DNA Gel Stain (Invitrogen) to visualise the DNA markers.
Immunocytochemistry
Colonoids after a 4-day culture period in DM and after a total of 8 days culture period in EM were fixed using 4% paraformaldehyde (Thermo Scientific) for 15 min at room temperature. This was followed by permeabilization with 0.3% Triton X-100 (Thermo Scientific) for 15 min and blocking with 2% bovine serum albumin (BSA) (Cytiva) for an hour. The colonoids were then incubated with anti-chromogranin A (CgA) antibody (ab45179, dilution 1:50, Abcam) and Sambucus nigra lectin (SNA, EBL), fluorescein (FL-1301, dilution 1:100, Vector Laboratories) overnight at 4 °C. Afterward, they were treated with Alexa Fluor 555-conjugated Goat Anti-Rabbit IgG H&L secondary antibody (dilution 1:1000, Abcam) for one hour at room temperature, post-PBS wash. Nuclei was stained using DAPI (dilution 1:1000, Thermo Scientific) and F-actin was stained using Alexa Fluor 647 phalloidin (A22287, dilution 1:250, Invitrogen). Following another PBS wash, the colonoids were suspended in Prolong Gold Antifade reagent (Invitrogen) and mounted on a glass bottom dish (Matsunami). Fluorescence imaging was conducted using a white light point scanning confocal microscope (SP8-X, Leica), and image processing was done using LAS X software (Leica). For quantitative analysis of CgA and SNA, we randomly selected 15 random fields of view. ImageJ software was used for fluorescence image analysis (Schneider, Rasband, and Eliceiri Citation2012), and SNA mean intensity was normalised by the total numbers of nuclei.
CYP3A enzyme activity assay
The activity of CYP3A and its induction by rifampicin were assessed by quantifying the concentration of 1′-hydroxymidazolam in the culture medium. This methodology was adapted from the protocols described previously (Janssen et al. Citation2021; Stresser, Sun, and Wilson Citation2021). Initially, colonoids were cultivated for four days in EM. Subsequently, they were exposed to DM supplemented with 50 μM rifampicin for three days to induce CYP3A activity. As a control, colonoids were treated with DM containing 0.1% DMSO. Following a wash with PBS twice, the medium was replaced with 250 μl, be consistent throughout the text) of DM enriched with 50 μM midazolam (Sigma-Aldrich). Samples of the medium were collected at three time points (0, 12, and 24 h post midazolam administration) to measure the concentration of 1′-hydroxymidazolam by high-performance liquid chromatography-tandem mass spectrometry (HPLC-MS/MS). Briefly, 300 μl of acetonitrile containing 20 ng of 1′-hydroxymidazolam-d4 (Cerilliant) was added to 100 μl of medium (pooled from 3 separate wells), vortex mixed, and centrifuged at 15,000 rcf for 10 min. The supernatant was then diluted with an equal volume of ultrapure water and 20 μl injected into the HPLC-MS/MS instrument. Instrumentation consisted of an Agilent 1100 HPLC coupled with an ABI Sciex 4000 triple quadrupole mass detector. Separation was achieved using a Phenomenex Synergi Fusion RP 150 × 2 mm column with mobile phase consisting of a mixture of acetonitrile and 2 mM ammonium formate in water run with a gradient method. Positive ion (m/z+) transitions monitored included 342 → 203, 342 → 297, and 342 → 324 for 1′-hydroxymidazolam and 346 → 301 for 1′-hydroxymidazolam-d4. Calibration samples consisted of 100 µl of blank medium spiked with 0.1 to 2 ng of 1′-hydroxymidazolam (Cerilliant), which were assayed using the same method as test samples. Standard curves were linear (R > 0.99) over the calibration concentration range (1 to 20 ng/ml) with an LLOQ of 1 ng/ml Intra-assay and inter-assay coefficients of variation (CV%) averaged 4% and 7%, respectively. Results are presented as the mean and standard deviation of duplicate samples (with each sample pooled from three separate wells; six wells total).
Statistical analysis
Statistical analyses in this study were carried out using R Studio version 1.4.1717 (RStudio), while the figures were generated with GraphPad Prism version 10.1.1 (Dotmatics). Initially, the Shapiro–Wilk test was applied to each dataset to assess normality. We then employed the Student t-test to compare the levels of gene expression of differentiation markers and P450 enzymes between the groups treated with expansion medium and differentiation medium. For analysing the gene expression levels of P450 under various drug induction conditions, we utilised the Kruskal–Wallis test followed by Dunnett’s post hoc test. The results of these analyses are presented as mean ± standard error of the mean (SEM). In our study, a p-value of less than .05 was considered to indicate statistical significance.
Results
Initiating colonoid differentiation using organoid differentiation medium
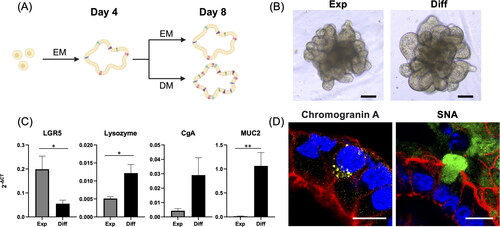
We compared two groups of culture conditions of colonoids: one group was cultured for 8 days exclusively in EM, while the other group was cultured for 4 days in expansion medium and then an additional 4 days in DM. Upon observation using a phase-contrast microscope, both EM-treated and DM-treated colonoids appeared remarkably similar, showing no evident differences in their structural appearance (). Despite these similarities in appearance, we further investigated whether DM effectively induced cellular differentiation in the colonoids by analysing the expression of specific cellular marker genes and performing immunofluorescence staining. These markers included LGR5 (a stem cell marker), MUC2 (a goblet cell marker), chromogranin A (an enteroendocrine cell marker), and lysozyme (a Paneth cell marker). Our findings revealed a notable decrease in LGR5 expression in the DM-cultured colonoids (p = .04) compared to the EM-cultured colonoids, implying a decrease in stem cell populations during differentiation. In contrast, markers indicative of cellular differentiation showed significant changes. Specifically, MUC2 and lysozyme expression levels increased significantly (MUC2: p < .01, lysozyme: p = .02) in colonoids cultured in DM compared to those in EM, suggesting enhanced differentiation. Additionally, Chromogranin A expression also increased in DM-cultured colonoids compared to EM-cultured ones, although this increase did not reach statistical significance (p = .09) (), indicating a trend towards enteroendocrine cell differentiation. Immunofluorescence staining revealed distinct expression patterns in colonoids cultured under different conditions (). Specifically, CgA staining was positive exclusively in colonoids cultured in DM, with no positive staining observed in those cultured in EM, mirroring the CgA expression results (©). Similarly, SNA staining was present in colonoids cultured in both EM and DM; however, it was significantly (p = .037) more pronounced in the DM (Supplementary Figure 1), aligning with the observed MUC2 expression results ().
Figure 1. Expansion and differentiation medium on canine colonoids. (A) A schematic representation of the canine colonoids cultured in expansion medium (EM) and differentiation medium (DM). The protocol involved initially incubating the organoids in EM for 4 days until they reached maturity. Then, the colonoids were cultured for 4 days in EM or DM. This schematic was created with BioRender.com. (B) Representative phase-contrast microscopy images displaying canine colonoids at Day 8 following EM (Exp) or DM (Diff) culture. Scale bar = 100 µm. (C) Differentiation marker genes including LGR5 (a stem cell marker), MUC2 (a goblet cell marker), Chromogranin A (an enteroendocrine cell marker), and Lysozyme (a Paneth cell marker) were compared between canine colonoids cultured in EM (Exp) or DM (Diff). The error bars represent the standard error of the mean (SEM). (D) Confocal microscopy images demonstrating presence of enteroendocrine cells (Chromogranin A, yellow), goblet cells (SNA, green), apical brush border (F-actin, cyan) and basal nuclei (DAPI, blue) in colonoids grown in DM. Scale bar = 100 µm.
Enhanced expression of key intestinal P450 genes in organoids using differentiation medium
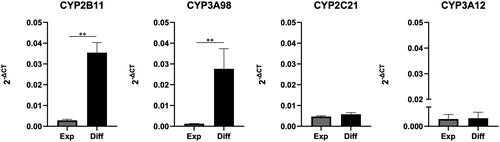
Next, we focused on evaluating the gene expression levels of CYP2B11 and CYP3A98, which are recognised as the primary drug metabolising P450 enzymes expressed in canine intestine (Heikkinen et al. Citation2012; Uno et al. Citation2023). Additionally, CYP3A12 and CYP2C21 were used as negative controls, given that they are typically absent from intestinal expression (Heikkinen et al. Citation2012). Canine colonoids cultured in DM for 4 days revealed a significant increase in the expression of CYP2B11 and CYP3A98, by 12.4-fold and 22.8-fold, respectively, in comparison to the expression levels of those colonoids cultured with EM (). In contrast, the expression levels of CYP2C21 and CYP3A12 did not exhibit such an increase. The agarose gel electrophoresis results confirmed the amplification of the target qPCR product, which matched the anticipated size (Supplementary Figure 3).
Figure 2. Major P450 gene expression level in canine colonoids. Gene expression levels of CYP2B11, CYP3A98, CYP2C21, and CYP3A12 were assessed using quantitative reverse transcription polymerase chain reaction (qPCR). This analysis compared canine colonoids cultured solely in EM for 8 days (Exp) with those initially cultured in EM for 4 days and then in DM for another 4 days (Diff). The error bars represent the standard error of the mean (SEM).
In a comparative analysis of the expression levels of critical CYP genes across duodenal tissue, colonic tissue, and colonic organoids cultured in DM for 4 days, distinct patterns emerged (Supplementary Figure 2). Notably, duodenal tissue exhibited significantly higher expression of CYP2B11 than both colonic tissue and colonic organoids. Similarly, CYP3A98 expression was markedly elevated in duodenal tissue, with only modest levels observed in colonic tissue and colonic organoids. In contrast, the expression levels of CYP2C21 and CYP3A12 remained consistently low across all samples.
Expression level of CYP3A98 was induced by rifampicin in canine colonoids
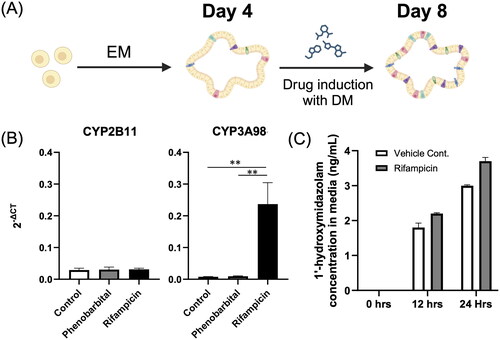
To determine if the expression levels of P450 enzymes could be enhanced, we employed specific inducers for these enzymes. Phenobarbital was used to potentially stimulate the expression of CYP2B11, and rifampicin was chosen as a potential inducer of CYP3A98. After undergoing a 4-day maturation period in EM, the canine colonoids were then treated with either of these inducers or with the carrier control, DMSO, in DM for an additional four days. Upon analysing the effects of these inducers, it was observed that the addition of phenobarbital to DM did not lead to an increase in the gene expression level of CYP2B11 or CYP3A98 when compared to the control group. In contrast, when rifampicin was added to DM, there was a substantial increase in the gene expression level of CYP3A98 (by over 25-fold) but not CYP2B11 (). A time-dependent increase in CYP3A enzyme activity was observed; however, no significant difference was noted when compared to the vehicle control (). The qPCR of CAR and PXR, which are key transcription factors for CYP2B11 and CYP3A98, was performed and revealed a pattern of relatively low PXR expression compared with high CAR expression, similar to a previous study (Greger et al. Citation2006) (Supplementary Figure 4).
Figure 3. P450 induction and activity assay in canine colonoids. (A) A schematic representation of the drug induction of the canine colonoids. The protocol involved initially incubating the organoids in expansion medium for 4 days until they reached maturity. Then, the colonoids were cultured for 4 days in DM or DM containing 250µM of phenobarbital or 50µM of rifampicin. This schematic was created with BioRender.com. (B) Gene expression levels of CYP2B11 and CYP3A98 were assessed using qPCR following phenobarbital and rifampicin induction assays. The error bars represent the standard error of the mean (SEM). (C) Canine colonoids were cultured for four days in EM before being exposed to DM enriched with 50 μM rifampicin for three days to induce CYP3A enzyme activity. To quantify this activity, the medium was sampled at three time points (0, 12, and 24 hours) following the administration of midazolam. These samples were analysed to measure the concentration of a principal metabolite, 1’-hydroxymidazolam, using HPLC-MS/MS. The error bars represent the standard deviation (SD).
Discussion
In this study, we have successfully demonstrated the use of canine colonoids as a reliable physiologically intact model for assessing the expression and induction of canine P450 enzymes. We were able to demonstrate enhanced expression of key intestinal CYP enzymes involved in xenobiotic metabolism after colonoid cell expansion and differentiation. Two different media were used in this study, an expansion medium containing the stem cell-promoting growth factor Wnt-3A and a differentiation medium that was identical to the expansion medium, but lacked Wnt-3A. Notably, significant amounts of the key drug metabolising intestinal CYP enzymes (CYP2B11 and CYP3A98) were not detected until after withdrawal of Wnt-3A. This observation aligns with prior studies utilising a differentiated in vitro system to assess more physiological function of mature enterocytes in a variety of assays including P450 enzymes (Janssen et al. Citation2021; Takahashi et al. Citation2022). This study highlights the importance of using differentiation medium for studies that focus on intestinal metabolism or chemical toxicity in canines. Employing this medium ensures more accurate and biologically relevant results, reflecting the in vivo intestinal environment more closely. It is important to note that CYP3A12 and CYP2C21, which are generally not expressed in the intestine, showed no expression in our canine colonoids. The expression of CYP3A12 and CYP2C21 did not increase even after culturing in differentiation medium. This outcome highlights the effectiveness of our model in accurately reflecting the in vivo conditions in dogs.
Until recently, CYP3A12 was considered the predominant drug metabolising P450 enzyme in canine intestine, based primarily on a study that quantified P450 protein by mass spectrometry using canine intestinal microsomes (Heikkinen et al. Citation2012, Citation2013). At that time, only two canine CYP3A enzymes had been identified, CYP3A12 and CYP3A26, and the proteomics assay was designed to discriminate between CYP3A12 and CYP3A26 as well as with other known P450 enzymes (Heikkinen et al. Citation2012). However, a recent study demonstrated the existence of two additional canine CYP3A enzymes, CYP3A98 and CYP3A99, which have high sequence homology with CYP3A12 and CYP3A26 (Uno et al. Citation2023). Using PCR primers that differentiated the mRNA sequences of all 4 enzymes, it was shown that CYP3A98 was the only CYP3A isoform expressed in canine intestine, while CYP3A12 (and to a much smaller extent CYP3A26) were the only CYP3A isoforms expressed in canine liver. Furthermore, the study showed that the peptide sequences used to quantitate CYP3A12 protein by mass spectrometry (Heikkinen et al. Citation2012) were identical to those found in CYP3A98. This indicates that the proteomic assay was unable to distinguish between CYP3A12 and CYP3A98 protein, thereby providing an explanation for the discrepancy. Uno et al. (Citation2023) also demonstrated that recombinant CYP3A98 was highly catalytically active, with a substrate preference that was similar to CYP3A12 and CYP3A26 (Uno et al. Citation2023). Conversely, CYP3A99 was not catalytically active for common CYP3A substrates, and was not expressed in liver, intestines, lung, or kidney. Taken together, these new findings indicate that canine hepatic CYP3A12 and intestinal CYP3A98 are key to the metabolic clearance of orally administered drugs. This differs significantly from the human scenario, where CYP3A4 and CYP3A5 are highly expressed in both the liver and intestine (Shimada et al. Citation1994; Paine et al. Citation2006). These insights underscore the critical need for species-specific screening tools in the early phases of oral medication research and development. Such tools are vital for accurate assessment and understanding of drug metabolism across different species, ensuring more effective and safer drug development.
Rifampicin, a known activator of the pregnane x receptor (PXR; NR1I2), substantially increased the expression of CYP3A98 but not CYP2B11 in our study. This aligns with PXR’s established role in modulating the expression of a subset of P450 family genes, including the CYP3A enzymes in humans (Stresser, Sun, and Wilson Citation2021). This induction suggests that CYP3A98 in the canine intestine is likely under PXR regulatory control, a mechanism consistent with findings in human intestines (Brueck et al. Citation2019). Although rifampicin treatment has been shown to induce expression of CYP3A12 (but not CYP2B11) in canine liver (ex vivo) and primary hepatocytes (in vitro), the effect of rifampicin on intestinal CYP3A98 or CYP2B11 (or any other P450) expression has not been reported. Our results predict that rifampicin and other PXR ligands should induce expression of CYP3A98 (but not CYP2B11) in canine intestines.
Conversely, phenobarbital, which induces P450 enzymes through a constitutive androstane receptor (CAR; NR1I3) dependent mechanism, did not induce CYP2B11 or CYP3A98 expression in this canine intestine model. Interestingly, a study of human stem-cell derived intestinal organoids showed no enhancement of human CYP2B6 or CYP3A4 expression after treatment with the CAR activators phenytoin and CITCO (Stresser, Sun, and Wilson Citation2021). This was despite showing induction of human CYP3A4 (but not CYP2B6) by rifampicin in the same study. This lack of effect of CAR inducers was attributed to a relatively low level of expression of CAR (relative to PXR) in the human organoids. They also demonstrated much lower CAR expression (relative to PXR) in human intestines, but similar expression of CAR and PXR in human liver. Consequently, our study of canine colonoids showed remarkable similarities to those of human intestinal organoids, indicating a role for PXR, but not CAR, in the regulation of P450 expression in canine intestines.
Our qPCR results revealed a pattern of low PXR expression coupled with high CAR expression (Supplementary Figure 4). This expression profile of CAR being more prominent than PXR in canines is in line with the findings reported in previous in vivo study (Greger et al. Citation2006). This consistency with previous research adds a layer of validation to our observations, despite the initial technical hurdles in standard curve development. On the human front, previous findings present an interesting contrast. Studies observed a relatively high expression of PXR and a low expression of CAR in the human intestinal tract. This pattern, where CAR expression is less dominant than PXR, echoes the results reported in human in vivo studies (Wenzel et al. Citation2022) and aligns with findings from previous research on human intestinal organoids (Stresser, Sun, and Wilson Citation2021). The distinct expression patterns between species underline the importance of species-specific studies in understanding the role of these receptors in intestinal physiology and pathology.
A prior study has also reported the effect of chronic dosing of beagle dogs with phenobarbital on CYP2B and CYP3A protein content in intestinal microsomes measured by semiquantitative immunoblotting (Myers et al. Citation2001; Kawalek et al. Citation2003). Consistent with the results of this study, no changes in CYP2B protein content were observed. In contrast with this study, a 10-fold increase in intestinal CYP3A protein content was observed. The reason for this disparity may be related to the use of an anti-rat CYP3A1/2 polyclonal antibody for Western blotting with unclear specificity for canine CYP3A isoforms. Furthermore, those data were not supported by additional CYP3A mRNA or enzyme activity assays.
Intestinal organoids possess the capacity to differentiate into multi-lineage intestinal epithelial cells, offering an inexhaustible supply of intestinal epithelial cells for use in in vitro toxicology assays (Sato et al. Citation2011; Kopper et al. Citation2021; Takahashi et al. Citation2022). Intestinal organoids’ unique capacity to replicate native physiological conditions and preserve adult intestinal stem cells’ epigenetic traits (Sato et al. Citation2011) positions them as a cutting-edge, widely recognised technology for drug screening and developing personalised medicine strategies (Nantasanti et al. Citation2016; Park et al. Citation2019). Furthermore, it is crucial to emphasise that organoid models enable the assessment not only of genetic variations but also of functional differences in drug metabolism. This study demonstrates the organoid’s utility in evaluating both genetic and metabolic responses to drugs, underscoring its potential to revolutionise pharmacological testing and treatment personalisation.
These results highlight the importance of further research into the regulatory mechanisms governing drug-metabolising enzymes such as CYP3A98 and CYP2B11 in canine intestinal organoids. While gene identification through qPCR offers a highly sensitive method for detecting enzyme induction, future studies could benefit from integrating CYP enzyme activity assays within our canine colonoid system. This approach is vital for progressing in veterinary pharmacology and enhancing the application of canine models in the realms of drug development and safety evaluation.
It is important to point out that the expression of CYP enzymes in the canine intestine is known to be generally lower than in the liver, and within the intestinal tract itself, the colon exhibits lower CYP expression compared to the upper segments (Heikkinen et al. Citation2012; Citation2015). In canine research, there has been only one study that performed drug induction to evaluate intestinal CYP levels, and this study focused on the upper intestine (Kawalek et al. Citation2003). While there are studies in humans and mice that investigate CYP expression in the upper intestine, research specifically targeting the colon, particularly in vivo induction studies, has not yet been reported.
This research marks a pioneering effort in assessing media conditions conducive to studying P450 gene expression in canine colonoids. A key finding of our study is the predominant role of CYP3A98 in the canine intestine, distinct from the liver-specific CYP3A12, corroborating recent reports (Uno et al. Citation2023). The study successfully has shown that colon-derived organoids are capable of inducing CYP activity in response to specific drug treatments. Nevertheless, further investigations are required to enhance our understanding of species-specific drug metabolism and to validate the effectiveness of this model for wider applications. Developing such models is crucial for a more accurate evaluation of drug metabolism, which in turn, could improve the efficacy and safety of drug development.
Animal welfare and ethics
All procedures on client-owned dogs in this study were approved by the Washington State University Institutional Animal Care and Use Committee (IACUC protocol: ASAF #6993). All clients who owned the dogs participated in this study were informed and signed the informed consent forms approved by the IACUC.
Authors’ contributions
I.N., T.G., and Y.M.A. were instrumental in designing the experiments. The majority of the experimental work was conducted by I.N. with M.H.C. specifically handling the enzyme activity assays. The manuscript, along with its tables and figures, were written and refined by I.N., M.N., and Y.M.A.
Supplemental Material
Download Zip (759.4 KB)Acknowledgement
Authors would like to thank WSU Small Animal Internal Medicine service (Dr. Jillian Haines, Dr. Sarah Guess, Shelley Ensign LVT, Sybil Fiedler VTA), WSU Community Practices service (Dr. Jessica Bell, Dr. Cassidy Cordon, Dr. Matt Mason, Dr. Jenna Waltzek, Mrs. Melody Gerber, Ms. Maggie deSouza, Ms. Becky Brodie), and WSU VTH Clinical Studies Coordinator Valorie Wiss for their support in case recruitment and sample collection from citizen scientists (patient donors).
Disclosure statement
The authors report no declarations of interest.
Data availability statement
All relevant data are within the paper and its Supporting Information files.
Additional information
Funding
References
- Ambrosini YM, Park Y, Jergens AE, Shin W, Min S, Atherly T, Borcherding DC, Jang J, Allenspach K, Mochel JP, et al. 2020. Recapitulation of the accessible interface of biopsy-derived canine intestinal organoids to study epithelial-luminal interactions. PLoS One. 15 (4):e0231423. doi: 10.1371/journal.pone.0231423.
- Brück S, Strohmeier J, Busch D, Drozdzik M, Oswald S. 2017. Caco-2 cells – expression, regulation and function of drug transporters compared with human jejunal tissue. Biopharm Drug Dispos. 38 (2):115–126. doi: 10.1002/bdd.2025.
- Brueck S, Bruckmueller H, Wegner D, Busch D, Martin P, Oswald S, Cascorbi I, Siegmund W. 2019. Transcriptional and post-transcriptional regulation of duodenal P-glycoprotein and MRP2 in healthy human subjects after chronic treatment with rifampin and carbamazepine. Mol Pharm. 16 (9):3823–3830. doi: 10.1021/acs.molpharmaceut.9b00458.
- Chandra L, Borcherding DC, Kingsbury D, Atherly T, Ambrosini YM, Bourgois-Mochel A, Yuan W, Kimber M, Qi Y, Wang Q, et al. 2019. Derivation of adult canine intestinal organoids for translational research in gastroenterology. BMC Biol. 17 (1):33. doi: 10.1186/s12915-019-0652-6.
- Corfield AP. 2015. Mucins: a biologically relevant glycan barrier in mucosal protection. Biochim Biophys Acta. 1850 (1):236–252. doi: 10.1016/j.bbagen.2014.05.003.
- Court MH. 2013a. Canine cytochrome P450 (CYP) pharmacogenetics.” Veterinary Clinics of North America. Vet Clin North Am Small Anim Pract. 43 (5):1027–1038. doi: 10.1016/j.cvsm.2013.05.001.Canine.
- Court MH. 2013b. Canine cytochrome P-450 pharmacogenetics. Vet Clin North Am Small Anim Pract. 43 (5):1027–1038. doi: 10.1016/j.cvsm.2013.05.001.
- Dressman JB, Thelen K. 2009. Cytochrome P450-mediated metabolism in the human gut wall. J Pharm Pharmacol. 61 (5):541–558. doi: 10.1211/jpp/61.05.0002.
- Fogh J, Wright WC, Loveless JD. 1977. Absence of HeLa cell contamination in 169 cell lines derived from human tumors. J Natl Cancer Inst. 58 (2):209–214. doi: 10.1093/jnci/58.2.209.
- Gabriel V, Zdyrski C, Sahoo DK, Dao K, Bourgois-Mochel A, Atherly T, Martinez MN, Volpe DA, Kopper J, Allenspach K, Mochel JP. 2022. Canine intestinal organoids in a dual-chamber permeable support system. J Vis Exp. March 2 (181). doi: 10.3791/63612.
- Graham RA, Downey A, Mudra D, Krueger L, Carroll K, Chengelis C, Madan A, Parkinson A. 2002. In vivo and in vitro induction of cytochrome P450 enzymes in beagle dogs. Drug Metab Dispos. 30 (11):1206–1213. doi: 10.1124/dmd.30.11.1206.
- Greger DL, Gropp F, Morel C, Sauter S, Blum JW. 2006. Nuclear receptor and target gene MRNA abundance in duodenum and colon of dogs with chronic enteropathies. Domest Anim Endocrinol. 31 (4):327–339. doi: 10.1016/j.domaniend.2005.12.002.
- Heijmans J, van Lidth de Jeude JF, Koo B-K, Rosekrans SL, Wielenga MCB, van de Wetering M, Ferrante M, Lee AS, Onderwater JJM, Paton JC, et al. 2013. ER stress causes rapid loss of intestinal epithelial stemness through activation of the unfolded protein response. Cell Rep. 3 (4): 1128–1139. doi: 10.1016/j.celrep.2013.02.031.
- Heikkinen AT, Fowler S, Gray L, Li J, Peng Y, Yadava P, Railkar A, Parrott N. 2013. In vitro to in vivo extrapolation and physiologically based modeling of cytochrome P450 mediated metabolism in beagle dog gut wall and liver. Mol Pharm. 10 (4):1388–1399. doi: 10.1021/mp300692k.
- Heikkinen AT, Friedlein A, Lamerz J, Jakob P, Cutler P, Fowler S, Williamson T, Tolando R, Lave T, Parrott N. 2012. Mass spectrometry-based quantification of CYP enzymes to establish in vitro/in vivo scaling factors for intestinal and hepatic metabolism in beagle dog. Pharm Res. 29 (7):1832–1842. doi: 10.1007/s11095-012-0707-7.
- Heikkinen AT, Friedlein A, Matondo M, Hatley OJD, Petsalo A, Juvonen R, Galetin A, Rostami-Hodjegan A, Aebersold R, Lamerz J, et al. 2015. Quantitative ADME proteomics - CYP and UGT enzymes in the beagle dog liver and intestine. Pharm Res. 32 (1):74–90. doi: 10.1007/s11095-014-1446-8.
- Janssen AWF, Duivenvoorde LPM, Rijkers D, Nijssen R, Peijnenburg AACM, van der Zande M, Louisse J. 2021. Cytochrome P450 expression, induction and activity in human induced pluripotent stem cell-derived intestinal organoids and comparison with primary human intestinal epithelial cells and Caco-2 cells. Arch Toxicol. 95 (3):907–922. doi: 10.1007/s00204-020-02953-6.
- Kamimura H. 2006. Genetic polymorphism of cytochrome P450s in beagles: possible influence of CYP1A2 deficiency on toxicological evaluations. Arch Toxicol. 80 (11):732–738. doi: 10.1007/s00204-006-0100-6.
- Kawalek JC, Howard KD, Farrell DE, Derr J, Cope CV, Jackson JD, Myers MJ. 2003. Effect of oral administration of low doses of pentobarbital on the induction of cytochrome P450 isoforms and cytochrome P450-mediated reactions in immature beagles. Am J Vet Res. 64 (9):1167–1175. doi: 10.2460/ajvr.2003.64.1167.
- Kopper JJ, Iennarella-Servantez C, Jergens AE, Sahoo DK, Guillot E, Bourgois-Mochel A, Martinez MN, Allenspach K, Mochel JP. 2021. Harnessing the biology of canine intestinal organoids to heighten understanding of inflammatory bowel disease pathogenesis and accelerate drug discovery: a one health approach. Front Toxicol. 3 (November):773953. doi: 10.3389/ftox.2021.773953.
- Martinez MN, Antonovic L, Court M, Dacasto M, Fink-Gremmels J, Kukanich B, Locuson C, Mealey K, Myers MJ, Trepanier L. 2013. Challenges in exploring the cytochrome P450 system as a source of variation in canine drug pharmacokinetics. Drug Metab Rev. 45 (2):218–230. doi: 10.3109/03602532.2013.765445.
- Myers MJ, Farrell DE, Howard KD, Kawalek JC. 2001. Identification of multiple constitutive and inducible hepatic cytochrome P450 enzymes in market weight swine. Drug Metab Dispos Biol Fate Chem. 29 (6):908–915.
- Nantasanti S, de Bruin A, Rothuizen J, Penning LC, Schotanus BA. 2016. Concise review: organoids are a powerful tool for the study of liver disease and personalized treatment design in humans and animals. Stem Cells Transl Med. 5 (3):325–330. doi: 10.5966/sctm.2015-0152.
- Paine MF, Hart HL, Ludington SS, Haining RL, Rettie AE, Zeldin DC. 2006. The human intestinal cytochrome P450 ‘Pie. Drug Metab Dispos. 34 (5):880–886. doi: 10.1124/dmd.105.008672.
- Park E, Kim HK, Jee J, Hahn S, Jeong S, Yoo J. 2019. Development of organoid-based drug metabolism model. Toxicol Appl Pharmacol. 385 (December):114790. doi: 10.1016/j.taap.2019.114790.
- Peters IR, Peeters D, Helps CR, Day MJ. 2007. Development and application of multiple internal reference (housekeeper) gene assays for accurate normalisation of canine gene expression studies. Vet Immunol Immunopathol. 117 (1–2):55–66. doi: 10.1016/j.vetimm.2007.01.011.
- Powell RH, Behnke MS. 2017. WRN conditioned media is sufficient for in vitro propagation of intestinal organoids from large farm and small companion animals. Biol Open. 6 (5):698–705. doi: 10.1242/bio.021717.
- Sahoo DK, Martinez MN, Dao K, Gabriel V, Zdyrski C, Jergens AE, Atherly T, Iennarella-Servantez CA, Burns LE, Schrunk D, et al. 2023. Canine intestinal organoids as a novel in vitro model of intestinal drug permeability: a proof-of-concept study. Cells. 12 (9):1269. doi: 10.3390/CELLS12091269/S1.
- Sato T, Stange DE, Ferrante M, Vries RGJ, Van Es JH, Van den Brink S, Van Houdt WJ, Pronk A, Van Gorp J, Siersema PD, et al. 2011. Long-term expansion of epithelial rganoids from human colon, adenoma, adenocarcinoma, and Barrett’s epithelium. Gastroenterology. 141 (5) :1762–1772. doi: 10.1053/j.gastro.2011.07.050.
- Schneider CA, Rasband WS, Eliceiri KW. 2012. NIH Image to ImageJ: 25 years of image analysis. Nat Methods. 9 (7):671–675. doi: 10.1038/nmeth.2089.
- Shimada T, Yamazaki H, Mimura M, Inui Y, Guengerich FP. 1994. Interindividual variations in human liver cytochrome P-450 enzymes involved in the oxidation of drugs, carcinogens and toxic chemicals: studies with liver microsomes of 30 Japanese and 30 Caucasians. J Pharmacol Exp Ther. 270 (1):414–423.
- Sigurdsson HH, Kirch J, Lehr CM. 2013. Mucus as a barrier to lipophilic drugs. Int J Pharm. 453 (1):56–64. doi: 10.1016/j.ijpharm.2013.05.040.
- Stipp MC, Acco A. 2021. Involvement of cytochrome P450 enzymes in inflammation and cancer: a review. Cancer Chemother Pharmacol. 87 (3):295–309. doi: 10.1007/s00280-020-04181-2.
- Stresser DM, Sun J, Wilson SS. 2021. Evaluation of tissue stem cell-derived human intestinal organoids, a physiologically relevant model to evaluate cytochrome P450 induction in gut. Drug Metab Dispos. 49 (3):245–253. doi: 10.1124/DMD.120.000281.
- Takahashi Y, Noguchi M, Inoue Y, Sato S, Shimizu M, Kojima H, Okabe T, Kiyono H, Yamauchi Y, Sato R. 2022. Organoid-derived intestinal epithelial cells are a suitable model for preclinical toxicology and pharmacokinetic studies. IScience. 25 (7):104542. doi: 10.1016/j.isci.2022.104542.
- Uno Y, Jikuya S, Noda Y, Murayama N, Yamazaki H. 2023. A comprehensive investigation of dog cytochrome P450 3A (CYP3A) reveals a functional role of newly identified CYP3A98 in small intestine. Drug Metab Dispos. 51 (1):38–45. doi: 10.1124/dmd.121.000749.
- Wenzel C, Gödtke L, Reichstein A, Keiser M, Busch D, Drozdzik M, Oswald S. 2022. Gene expression and protein abundance of nuclear receptors in human intestine and liver: a new application for mass spectrometry-based targeted proteomics. Molecules. 27 (14):4629. doi: 10.3390/molecules27144629.
- Zanger UM, Schwab M. 2013. Cytochrome P450 enzymes in drug metabolism: regulation of gene expression, enzyme activities, and impact of genetic variation. Pharmacol Ther. 138 (1): 103–141. doi: 10.1016/j.pharmthera.2012.12.007.
- Zhao M, Ma J, Li M, Zhang Y, Jiang B, Zhao X, Huai C, et al. 2021. Cytochrome P450 enzymes and drug metabolism in humans. Int J Mol Sci. 22(23):1–16. doi: 10.3390/ijms222312808.