
Abstract
Computational advertising (CA) is a rapidly growing field, but there are numerous challenges related to measuring its effectiveness. Some of these are classic challenges where CA offers a new aspect to the challenge (e.g., multi-touch attribution, bias), and some are brand-new challenges created by CA (e.g., fake data and ad fraud, creeping out customers). In this article, we present a measurement system framework for CA to provide a common starting point for advertising researchers to begin addressing these challenges, and we also discuss future research questions and directions for advertising researchers. We identify a larger role for measurement: It is no longer something that happens at the end of the advertising process; instead, measurements of consumer behaviors become integral throughout the process of creating, executing, and evaluating advertising programs.
Computational advertising (CA) presents an unprecedented opportunity for measuring the short- and long-term effectiveness of advertising. Simply defined, CA is personalized communication that uses computational power to match the right ads and advertisers with the right consumers at the right time in the right place with the right frequency to elicit the right response. Computational advertising—and the myriad digital media through which it is delivered—offers an explosion in the volume, variety, and velocity of data available; therefore, it provides new fuel for today’s more powerful machine learning and analytical techniques. At the same time, CA is being deployed in environments where highly increased personal identification and tracking across touch points, formats, and media create an opportunity to measure effectiveness at a personal level across disparate elements of a campaign and over time. The nature of these touch points presents new types of data and presentation opportunities, from geotemporal data, search histories, and voice interaction to personalized placement opportunities embedded in other media. Together, these changes allow us to incorporate the diverse metrics from fields such as social media (e.g., Peters et al. Citation2013), recommender systems (e.g., Herlocker et al. Citation2004), and mobile advertising (e.g., Narang and Shankar Citation2019) to augment more traditional advertising and marketing metrics (e.g., as surveyed by Farris et al. Citation2010) and further extend these metrics to look at the broader context and scope of the full campaign, full brand, and full consumer.
Indeed, the entire nature of metrics is changing. No longer simply used to evaluate past performances, metrics today are an integral part of the algorithmic apparatus through which advertisements are targeted and delivered and are the basis for optimizing the performance of the advertisements generated and delivered by these algorithms. In 2018 eMarketer reported that more than 80% of digital desktop and mobile ads were sold and delivered through programmatic algorithms and auctions (eMarketer Citation2018). These platforms succeed or fail based on the data they incorporate to make these placement decisions. Yet as enterprises spend increasing amounts on advertising, marketing, and their technologies (AdTech/Martech), the reality is an increasing lack of trust in marketing effectiveness (Odden Citation2018). That lack of trust has led to challenges to the dominant players in CA, the duopoly of Google and Facebook. Behind their walled gardens, they deliver measurement and reporting, but their metrics have been strongly questioned, such as in one case being fined for misrepresentation (Spangler Citation2019). The wisdom of enterprises investing $273 billion annually in online advertising has also been questioned, alongside challenges to the rigor of measurement and whether online advertising is effective at all (Frederik and Martijn Citation2019). Thus, in this article, we necessarily look at metrics from both perspectives: measurement to facilitate better performance and measurement to evaluate that performance to make business decisions (and to support research on advertising itself).
Our vision is not new. When Claude Hopkins first published Scientific Advertising in 1923, he outlined a vision where advertising investments could be more predictable and accountable, insights more strategic and actionable, and experimentation more accessible and affordable. Today’s CA systems bring us close to the vision he stated nearly a century ago: “The time has come when advertising has, in some hands, reached the status of a science. It is based on fixed principles and is reasonably exact. The causes and effects have been analyzed until they are well understood” (Hopkins Citation1968, p. 6). But our goal is more ambitious yet: to bring this power not just to “some hands” but to advertisers and marketers in general.
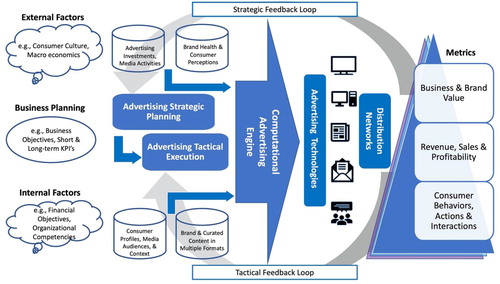
To achieve these goals, we start with a framework of the CA process and its context (see ). Through this framework, we see the relationship between the CA system as a whole and its constituent parts, revealing the opportunities for measuring effectiveness at both computational and human points in the system. The figure shows a CA engine at the center of the system, and in turn highlights the dual optimization struggle of all such machine learning systems: They seek to exploit the data they have to deliver better performance today (i.e., delivering the right advertisements to the right people at the right time and location), while also seeking to explore the data they receive to be better able to improve performance tomorrow (i.e., delivering advertisements specifically to learn how recipients react rather than with confidence about their effectiveness). After we discuss this framework, we address the challenges for CA measurement.
Figure 1. Computational advertising measurement system.
A Computational Advertising Measurement System
Measurement of Strategic and Tactical Effectiveness in Computational Advertising
As with traditional advertising, marketers should begin with their business objectives (financial and business planning; see ), which will guide strategic and tactical choices. Moreover, agreeing on objectives is necessary to evaluate the success of a campaign. After establishing objectives, the marketer develops strategies (i.e., how to achieve the objective), and the strategies give rise to tactics (i.e., how to execute the strategy) to identify customers with a high return on investment (targeting) across media (touch points) and through communications. The strategy itself is increasingly informed by the data, algorithms, and models, leveraging data on consumer attitudes and brand perceptions. Today, as makes clear, digital data provide rich sources of information on consumer attitudes, in particular from social media and review sites (Maslowska et al. Citation2019). CA is, therefore, playing an increasing role in strategic planning and tactical executions. In addition, data-intensive CA generates feedback loops, with continuous feedback from tactics to improve both strategy and tactics, from the signals in the marketplace that inform the enterprise about consumer response to their advertising.
Advertising tactical execution of advertising comprises several dimensions: targeting, messaging, consumer journey planning, channel delivery, and sales distribution (see ). Tracking the customer journey through the purchase funnel can further help to determine the optimal combination and sequence of content and touch points (see Van Noort et al. Citation2020). As stated by Perlich et al. (Citation2012), “We want to address the right browser with the right message at the right moment and preferably at the right price” (p. 805). Although purchase paths are less linear nowadays, it can be argued that customers still go through different stages (e.g., awareness, consideration, purchase, postpurchase) and have different communication needs at each stage (Batra and Keller Citation2016). The algorithms and models of CA were initially focused on targeting the right messages to the right consumers. With developments of new consumer interfaces, the role of computation has expanded to embrace planning of the “end-to-end” consumer journey through the purchase funnel and the measurement of “omnichannel” marketing campaigns across digital touch points. The tactical delivery of messages and content is increasingly driven by computation. Advertising messages that were once delivered with mass media are now personalized to individual consumers, regional markets, and social communities. While personalization has been possible for many years, it is increasingly done in real time with better data that have been collected or purchased about the target customer (Segijn and van Ooijen Citation2020). In addition, the decisions about whom to target, when, and with what message are made more quickly in CA compared to traditional advertising (Malthouse, Maslowska, and Franks Citation2018).
Data for the Computational Advertising Measurement System
A main difference of the CA framework compared to a framework for traditional advertising is the multiple information sources and data types that feed into the computational engine at the heart of CA (). We classify four data types. First, there are advertising investments and media activities, which include all investments and resources at the command of advertising—in other words, ad spend (paid, owned, and earned media), activity/volume, campaigns, and promotions. Second, there is brand and curated content in multiple formats, which include all investments and resources at the command of marketing to improve the brand—in other words, communication themes and topics, messaging, and customer experience (CX), including service. Third, we have brand health and consumer perceptions, which include measures of brand and corporate attitudes which have historically come from surveys and qualitative research but are now often computed from social media. Finally, there are consumer profiles, media audiences, and context. These consumer 1:1 data consist of first-, second-, and third-party data (for an overview, see Malthouse, Maslowska, and Franks Citation2018) about customers. A newer category of data is “zero-party” data, which are data that an organization gathers directly from consumers, for example, through questionnaires or quizzes.
In addition to different types of data, advertisers and marketers need to take the context of data into account. Context refers to the current circumstances of the consumer receiving the ad message, such as time of day, location, or device. Malthouse, Maslowska, and Franks (Citation2018) discuss context as who is with the consumer at the time of exposure, what the person is currently doing, what time of day it is (when), where the consumer is physically, how the consumer is experiencing the touch point (e.g., type of device), and why the consumer is doing what he or she is currently doing. Note that this definition of context is broader than that of contextual targeting, where advertisers match their ads to the surrounding media context, for example, placing car ads next to articles about cars. Adomavicius and Tuzhilin (Citation2011) provide a thorough literature review of contextual personalization, discuss context-aware recommender systems, and identify three different algorithmic approaches to handling context. Herlocker and Konstan (Citation2001) hypothesized that the inclusion of knowledge about the user’s task into the recommendation algorithm in certain applications can lead to better recommendations.
Computational Advertising Measurement and Stakeholders
Within CA, various pieces of the aforementioned data are used in the processes of business and planning, advertising strategy, and tactical execution. In we set out CA metrics that are outputted when these processes, combined with CA data, make their way through the CA measurement system.
Table 1. Data inputs and outputs in computational advertising.
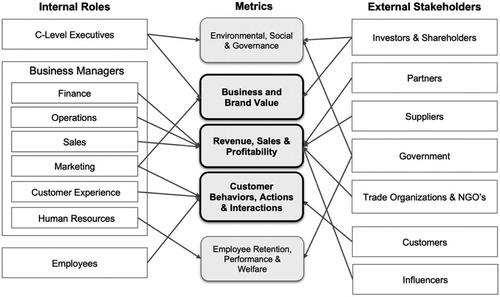
As shown in , we classify metrics into three levels: business and brand value; revenue, sales, and profitability; and consumer behaviors, actions, and interactions. This classification enables us to focus on the needs of multiple stakeholders internal or external to an enterprise. Different stakeholders have different objectives for the enterprise’s investment in advertising and therefore require different metrics to be measured to evaluate CA’s effectiveness. These metrics are typically related to the effects of advertising over time. As a reference, a spokesperson for a leading CA platform has similarly proposed an impact matrix (Kaushik Citation2019), in which different metrics are calculated and reported for different intervals: real time/weekly, monthly/quarterly, and biannually.
The roles of different stakeholders in an enterprise, the decisions they will take, and the time scale in which success or otherwise is determined are all factors that govern the metrics important to them. Researchers have studied the shorter-term effects of advertising versus the longer-term effects of offers and promotions (Blattberg, Briesch, and Fox Citation1995). Practitioners have also studied the balance between (longer-term) brand building and (shorter-term) demand generation (Binet and Field Citation2013). The growth of CA means that advertising managers have immediate access to short-term metrics of customer interactions, which may or may not always result in revenue, margin, and profitability for the enterprise. External stakeholders also have specific goals and metrics for the measurement of an enterprise’s advertising. lists some exemplary metrics for internal and external stakeholders.
Figure 2. Metrics important to different stakeholders. Order of boxes do not reflect importance.
The Computational Advertising Engine
Part of the CA process is the use of various analytical methods in the “computational engine” to optimize strategy and tactics (). In strategy development, computational methods are being used to analyze the topics of conversation in a marketplace and define future opportunities of brands to compete (e.g., Fan and Gordon Citation2014). In tactical executions, computational methods are used to place a bid to expose some user, recommend certain items to a user (Ekstrand, Riedl, and Konstan Citation2011), or predict how likely the user is to churn or convert (Burez and Van den Poel Citation2009; Li and Guan Citation2014). There are many different methods depending on the stakeholders and their objectives. These methods frequently involve the use of computational algorithms (for an overview, see the editorial of this Special Issue).
The computational engine in leverages algorithms and applies models based on these algorithms to solve problems in general, measure the contributions of data inputs, and evaluate the effects of multiple variables in the CA system. The next step in the CA process is to deliver messages to consumers through their connected devices. Devices become channels around which proliferating advertising and marketing technology solutions have been created to deliver the message, manage and analyze the data, and report the metrics (see the media group paper in this special issue for more details). Every channel results in specific consumer responses and generates different metrics. Web analytics is based on clicks, while social analytics is based on likes and shares. However, a like on one social media platform may not have the same impact as on another platform, or as a retweet on Twitter.
The measurement challenges start here. Further, while the measures that come from digital channels tend to be behavioral, not all objectives map directly onto behaviors that can be easily observed, and behavioral measures may have to be supplemented by other research designs, analytical methods, and models. For example, attitudinal measures will be necessary to understand the user’s cognitions, emotions, and beliefs about touch points and the brand. In the next section, we further elaborate on measurement challenges in CA.
Computational Advertising’s Measurement Challenges
A key question for all organizations is what they should be measuring. Before answering this question, an organization should consider why it should measure something. As mentioned in the introduction, two main reasons for measuring variables are (1) to evaluate the performance of advertising and manage ad decisions, which is the more traditional reason for measurement, and (2) to improve or optimize the performance of advertising systems. As an example of the latter, a retailer may choose to measure customers’ behaviors on its website so that it can personalize future interactions with customers, which will make the website more likely to be effective. The measures that are tracked often become the things that employees will optimize through their decisions and actions, especially if the measures are tied to their compensation. Thus, it is important to be measuring the “right” things. This section discusses considerations in deciding what to measure. The first part focuses on evaluation of performance with an emphasis on how CA affects these classic challenges with new complexity, data, and/or opportunities. Our list is not exhaustive, and we recognize that there are many other difficult classic challenges in advertising measurement, such as measuring the duration and cumulative effects of ads, but we focus the discussion here on what is new because of CA. The second part details challenges for measuring variables to optimize performance.
Challenges in Evaluating Ad Performance Where CA Offers Something New
Short- versus Long-Term Measures
Strategic business objectives are longer term, but in CA campaigns the measurement starts immediately, in real time. Yet many factors in advertising, in particular the measurement of creativity in shifting consumer perceptions, affect long-term metrics and outcomes. A common remedy for these problems is to decompose the long-term goal into shorter-term activities that lead up to the long-term goal, such as the purchase funnel or hierarchy of effects. The decision on what to measure depends on how to decompose long-term goals into short-term goals and confirming their relationship with the long-term goal.
As an example, consider a business-to-business (B2B) consulting firm that ultimately wants to sell services to clients (a longer-term goal). However, its sales cycles can last months or even years, and sales are affected by multiple touch points and content over time. Thus, the longer-term objectives need to be achieved through development of shorter-term activities. These activities may use short-term metrics, but they must also be evaluated for their contributions to the longer-term objectives. It may start with making clients aware of the firm, which is likely to require mass-advertising approaches, such as TV ads (Bronner and Neijens Citation2006; Dijkstra, Buijtels, and Van Raaij Citation2005). A later goal might be to have a client subscribe to the company newsletter so that the consulting firm has permission to market directly to the client. This phase likely involves more branded content in the form of white papers, podcasts, and in-person events, such as conferences or lunch presentations (Wang et al. Citation2019). A next step might be having a sales call, then submitting a bid or request for proposal (RFP), and so on. There are many steps along the way to a sale. There may be even longer-term objectives, such as repeat purchases and customer lifetime value (CLV) ().
Just as long-term goals must be decomposed into short-term ones, CLV, which is the discounted sum of future cash flows due to the relationship, must also be decomposed because it is a forecast rather than a metric. Enterprises can (and should) measure factors that indicate CLV, including retention rates, average order amounts, purchase rates, and costs to serve the customer, but they cannot measure CLV itself. Furthermore, they should identify and measure leading indicators of these CLV determinants. In the B2B consulting firm example, engaging with the firm’s digital content marketing is such a leading indicator of purchase (Wang et al. Citation2019).
There are several challenges. The first is confirming that the short-term metrics have predictive validity in that they are leading indicators of the long-term goal. For example, Comscore and Pretarget ran an industry study that looked at metrics such as ad clicks to see if they were truly correlated with conversions to online sales (Lipsman Citation2012). After analyzing 263 million impressions over nine months across 18 advertisers in numerous verticals, they found, surprisingly, that ad clicks had no significant correlation to sales conversions. Maximizing the short-term goal of clicks may not lead to the long-term goal of conversions. CA exacerbates this problem because so many things are now easy to measure. The fact that something like clicks is easy to measure does not mean that it is a leading indicator of long-term goals, and the firm should evaluate predictive validity when selecting measures.
A second challenge is to avoid the trap of optimizing against short-term objectives having a negative impact on the long-term goal. For example, a service provider (for example, a car mechanic) may have a short-term goal of cross-selling other services, but the service provider may realize that those buying these other services are less likely to return in the future. Optimizing against a short-term objective (cross-sales) could harm longer-term objectives (e.g., repeat purchase, CLV). Binet and Field (Citation2013) have studied long- and short-term marketing strategies and question whether long-term objectives can be achieved by a series of short-term activities measured by short-term metrics.
Multitouch Attribution
CA offers the ability to track exposures over time in more detail than ever before, but another challenge is multitouch attribution: There can be many touch points (e.g., ad exposures) over time, and the problem is determining which ones contribute to the outcome. For example, a common practice is to attribute a sale to the most recent touch point, where the last click “wins.” The problem with this is that the last click may not have happened if the consumer had not been exposed to many other brand messages prior to seeing the most recent message. Previous messages could have made the consumer aware of the brand and changed brand associations, which was necessary before the consumer would buy the product. How much credit should be given to the last contact versus the previous ones?
A similar problem is that there is often a high correlation between spending in different advertising channels; for example, if there is an increase in the overall ad budget, then a firm might allocate it proportionally across channels, in which case channel effects would be confounded. Naik and Peters (Citation2009) do not attempt to estimate individual channel effects and instead use the principal component of offline spend in different channels (TV, radio, magazines, etc.) to handle multicollinearity. Using such an aggregated measure may be the most defensible modeling strategy for multiple channels unless it is possible to run experiments with orthogonal designs.
Causation versus Correlation and Endogeneity in Measuring the Effectiveness of CA
There are two broad categories of research designs for assessing the causal effects of advertising: randomized controlled trials (RCTs) and observational studies. Observational studies include those with quasi-experimental methods, such as difference-in-differences and regression discontinuity designs, and those with statistical/econometric models, such as regression and choice models using time-series, cross-sectional, or panel data. (e.g., Assmus, Farley, and Lehmann Citation1984; Liu and Shankar Citation2015).
While RCTs are often held up as the gold standard for testing causality because of their strong internal validity, they are often expensive to execute. Firms often have systems that are designed and optimized to do one thing well, while RCTs require systems to track and randomly assign customers to condition groups over time and across multiple touch points. In addition to the costs of executing RCTs, management is often reluctant to risk losing additional revenue by setting aside a control group. Furthermore, RCTs may not be feasible in many situations because it may not be possible to randomly assign advertising treatments across a target audience. Given these issues, it is easy to understand the appeal of observational studies.
The debate over the internal validity of observational approaches dates back to at least the 1950s (e.g., studies on whether smoking causes lung cancer). Endogeneity of advertising is a key concern that precludes the conclusivity on the causality of advertising for nonrandomized studies. In observational studies, endogeneity is typically controlled through instrumental variable approach, propensity scoring models, control function method, and copula techniques (e.g., Liu, Shankar, and Yun Citation2017; Liu-Thompkins and Malthouse Citation2017). DeKimpe and Hanssens (Citation2000) show the potential for time-series models to quantify short- and long-term marketing effects. The increased availability of customer behavior measures over time in digital advertising environments enables more widespread use of such models. While these approaches can mitigate endogeneity concerns to a considerable extent, they cannot substitute for RCTs. Indeed, Gordon et al. (Citation2019) compare RCTs with different methods in CA and find that observational studies often fail to accurately measure the true effects of advertising. Many of the critiques of current CA measurement systems arise from a confusion between correlation and causation.
However, the rate of adoption of such models by mainstream practitioners has been slow. Kireyev, Pauwels, and Gupta (Citation2016) studied the influence of display ads on search behavior, applying Granger causality tests to separate correlation from causality and measuring the spillover effects over time across media to reach a true measure of the contribution of two media. Their analysis reveals the challenges of CA measurement as well as indicates a path forward for future researchers. It is often easier to execute RCTs with high internal and external validity in digital environments than in the nondigital environments of the past. The challenge for academic scholars is getting access to and manipulating stimuli in these digital environments, which tend to be controlled by companies and other organizations.
Incrementality
Another measurement issue is whether advertising increases a criterion like sales. There are many situations where this is an issue. An older example comes from retailing (e.g., Hansotia and Rukstales Citation2002). Suppose that a retailer sends coupons to its customers. It is easy to measure how many coupons are redeemed and how much those redeeming them spend, but would the customers have come into the store anyway? If so, the effect of the coupon is only to reduce margins on a sale that would have happened without the coupon. As a trivial example, coupons given to customers who are entering a restaurant will almost certainly be redeemed, but the customers would have dined there anyway and paid full price. More modern examples include paid search. For example, a retailer might buy its brand name as a search term, but a customer who searches for the brand name online may find the brand without the retailer having to pay for the search term. See the work of Lewis and Reiley (Citation2014); Johnson, Lewis, and Nubbemeyer (Citation2017); and Olaya, Coussement, and Verbeke (Citation2020) for recent surveys and benchmarking studies.
Challenges around Optimizing Advertising Contact Points
One answer to the question of what to measure is to measure first-party variables that improve the effectiveness of some marketing contact, often through improved relevance (personalization) or targeting. The behavioral and contextual factors discussed in the previous section are prime candidates. Another reason to measure something is if it has value to other actors (second-party data); a firm may be able to charge other firms for the information it has on its customers (Line et al. Citation2020). There are many research areas that arise because of such data.
Multiple Objectives and Metrics
Advertising has often focused on a small set of objectives, such as changing an attitude or increasing awareness. Designing digital CA environments that create user experiences usually involves managing trade-offs between many competing objectives, which often arise because of multiple stakeholders. Firms need to consider the different stakeholders and design measures to reflect their needs. For example, a retailer recommending items to consumers on its website must consider the users’ utility for different items, as well as whether the manufacturer will pay to be a sponsored recommendation, the item’s profit margin, and perhaps strategic considerations such as expanding its presence in some category. Likewise, a media website recommending news stories must consider the user’s utility for stories, but also the needs of its advertisers. For example, if automotive stories are never recommended, then there will be lower traffic to such stories, and auto advertisers may not obtain the exposures they seek from the website. It may have other objectives around not creating filter bubbles or expanding the interests of the user.
Fake Data and Ad Fraud
Malthouse and Li (Citation2017) discuss fraud in CA via automated computational bots or low-paid click-farm workers that generate fake clicks on online ads, especially if those ads are using a pay-per-click pricing system. Encountering fake data generated in an effort to boost pay-per-click ad revenue has been a challenge for CA measurement systems. Fulgoni (Citation2016) also discusses advertising fraud. More recently, a Pew study found that 66% of tweets are from “automated accounts” (Wojcik et al. Citation2018), and there are similar concerns around fake reviews. A free browser extension called AdNauseam was released (Howe and Nissenbaum Citation2017) that blocks ads and trackers. However, it also stores ads that users have been sent so that they can review their history of ads; in addition, it floods online ads with fake clicks. The creators suggest that their open-source project is driven not by a desire for financial gain but rather by a desire for greater societal privacy. Their reasoning for including a fake click function on top of an ad blocker was their attempts at both technologically protesting the current state of CA as well as technically upending CA. Although technical solutions are likely to be built to counteract fake data (e.g., machine-learned detection of fake click patterns), one stream of solutions would be opt-in ads (e.g., permission marketing, zero-party data collection), as AdNauseam shows how society is pushing back on privacy issues.
Expanded Set of Data Measured
Current CA approaches profile customers through numerous means such as website cookies, data mined from social media profiles, or data purchased from third-party sources. Technological advancement will continue to bring new avenues of customer data collection and allow for measurement of CA effectiveness. For example, wearable technologies such as virtual reality headsets, augmented reality glasses, and even Elon Musk’s investment into a brain implant technology called Neuralink (Scaturro Citation2019) should enable new ways to collect customer data, behavioral metrics, and even psychological metrics to measure CA effectiveness. Voice-enabled smart speakers, such as Google Home and Amazon’s Alexa-enabled Echo products, can also open up new avenues of CA measurement and metrics. Amazon started testing audio ads via its Alexa products this year (Sloane Citation2019), thus opening up the opportunity to connect an audio ad “impression” to a sales conversion on whatever e-commerce site is being advertised. In addition, bringing together previous research on vocal tone and emotions (Devillers, Vidrascu, and Layachi Citation2010) and response latency’s correlation with attitude strength (Bassili Citation1993), voice-enabled smart speakers can open up even more opportunities for CA behavioral (e.g., audio ad impression to sales conversion) and psychological measurement (e.g., vocally detected emotion and/or attitude strength).
At the same time, Google recently announced that they would phase out all third-party cookie tracking on their Chrome browser for advertising (Graham Citation2019); social media platforms are tightening privacy controls of people’s profile data; and recent research has shown that customer profiles built from purchased third-party data may not be worth the cost, due to the black-box nature of how profiles are created (Neumann, Tucker, and Whitfield Citation2019) and ethical concerns (Strycharz et al. Citation2019). Future data access research questions need to consider the ethics behind all of this.
Creeping Out Consumers
Technological advancements will create more sophisticated techniques that can be used to collect customers’ personal data and to more accurately distribute messages to customers (Malthouse, Maslowska, and Franks Citation2018; Segijn and van Ooijen Citation2020). As mentioned, CA is assumed to further improve the effectiveness of a message because it will be personalized. However, at the same time personalization may be perceived as invasive to a customer’s privacy, may create discomfort, and may increase feelings of being watched (McDonald and Cranor Citation2010; Segijn and van Ooijen Citation2020; Smit, Van Noort, and Voorveld Citation2014). In turn, how customers feel toward messages that are personalized can influence the effectiveness of those messages (Aguirre et al. Citation2015). Therefore, marketers have to balance between accurately matching the message with the consumers’ needs without creeping them out by being accurate all the time—also known as the accuracy trade-off (Segijn Citation2019). Eventually, technological advancements may become so sophisticated that, at a certain point, machines can learn when to make a random “mistake” on purpose to appear to not know too much on a personal level and avoid creeping out customers, which will result in the most effective strategy. However, this would work only when input about the effectiveness of the campaign accurately reflects reality. Thus, optimizing the measurement of metrics is important because it will serve as input to optimize the effectiveness of the CA-driven campaign.
Behavioral versus Psychological Data
Another challenge is related to the distinction between behavioral and psychological metrics Hofacker, Malthouse, and Sultan (Citation2016, p. 93). By behavioral metrics, we mean records of the customer’s actions. By psychological metrics, we mean measures of the customer’s thoughts, feelings, or beliefs. The goals of advertising, especially in the upper funnel, are often psychological in nature, such as changing an attitude or making consumers aware of something. There are problems in measuring such psychological phenomena with behavioral metrics. Psychological metrics are typically gathered with self-reported surveys on a sample of customers and possibly noncustomers, although neuro measures and machine-learned detection (e.g., Yun, Pamuksuz, and Duff Citation2019) are being explored. The digital environment in which CA takes place generates an abundance of behavioral data for all customers who interact in the environment. Behavioral measures could be called a convenience census of customers, in that measures are known for all customers who visit but are usually not observed for noncustomers. There are additional challenges in that observed actions may come from different time periods and have different levels of completeness, in that less is known about customers who rarely visit. While previous behaviors are often a good indicator of future ones, thoughts, emotions, and beliefs are more malleable in that they can be altered with persuasive messages. Therefore, it is desirable to have a complete understanding of both the cognitions and behaviors of customers.
Bias in Data and Algorithms
Sampling and measurement biases have long been a challenge in advertising measurement. The biases, however, are somewhat different in CA compared to non-CA, but they do exist. In the past, advertising scholars were concerned about the validity of self-reports and the representativeness of different panels. In contrast, CA scholars worry about issues including convenience censuses, algorithmic biases, and the effects of nonhuman (i.e., bot) traffic. There has been a recent movement in the computational creation of advertisements through which social media profiles and behaviors (Dragoni Citation2018) or browsing behaviors (Deng et al. Citation2019) are used to generate creative content using artificial intelligence (AI). Although such a practice may provide benefits (e.g., less stress for humans to create millions of different advertisements for real-time bidding (RTB) marketplaces, Deng et al. Citation2019), relying on AI for automatic content creation and recommendation can have detrimental effects from underrepresentation and bias standpoints. Bias is a major concern in the design of AI systems (e.g., Abdollahpouri et al. Citation2019; Shankar et al. Citation2017). Previous research in underrepresentation within advertising shows that certain ethnicities, such as Latinos (Taylor and Bang Citation1997), and age groups, such as the 50-and-older group (Carrigan and Szmigin Citation1998), were highly underrepresented in advertising. This bias poses a problem with the movement toward AI and computational content creation and content recommendation. For example, Google received negative reactions when its AI algorithms within its Google Photos product mislabeled Black people as gorillas, but this was a result of underrepresentation of people of color within their image collections, as well as a lack of racial diversity within Silicon Valley as a whole (Guynn Citation2015). Most of the images of people used to train Google’s AI were White, thus the algorithm learned that “people” are best recognized by “white” skin tone. If CA algorithms are being trained by data from previous advertisements that largely show young, non-Latino people, the majority of AI-generated creative content will contain young, non-Latino models. Some potential research questions for the challenge of biased data include the following: What are some ways that CA data representativeness can be measured? How does the concept of biased data change or remain the same when CA is highly customized to an individual? How can CA bias be measured and addressed?
Future Research and Conclusions
We now discuss some future research topics that ad scholars should consider. These research topics will inevitably affect CA measurement. One question we can consider: How can data-driven decisions be blended with human expertise? As a rough rule of thumb, machine learning tends to excel when there are ample historical data and the business environment is stable, while humans tend to have an advantage in handling ambiguous or quickly evolving situations without much data. Designing hybrid ad systems that leverage the strengths of each will be a new frontier in ad research. A related topic is designing ad programs to accomplish long-term goals when data are scarce for training models. For example, what actions should an advertiser take each month/quarter/over the next three years to achieve some strategic goal, especially when historical data have limited relevance? This situation likely requires a parsimonious model with a small set of ad decision variables and theoretical understanding of the ad effects. The advertising literature is replete with theories that would be useful in developing such systems, but developing such systems also requires skills from machine learning and management/marketing science.
Another area for future research is improving advertising by using information about the consumer’s context, as availability of contextual information will continue to increase as more digital devices are invented and consumers adopt them. Devices will increasingly come with microphones, cameras, heart-rate and body-temperature monitors, eye trackers, and other new ways of monitoring sensory variables. Likewise, there will be methodological improvements for inferring individual consumer attitudes, emotions, and beliefs. How will the availability of such measures change advertising? How do organizations create trust and avoid consumer backlash? As such data proliferate, there will be a need to develop ethical guidelines, modes of consent, codes of practice, data-selling/ownership laws, and other standards. There will be a need for research on how to earn the trust of consumers and not unnerve them with overly personalized contact points. As a consequence of the SARS-CoV-2 pandemic that began in early 2020, the effects of which cause the disease known as COVID-19, this area is especially dynamic and therefore in need of research. Consumer attitudes toward data collection and monitoring will likely evolve when it is used to create benefits for consumers, such as contact tracing and predicting where the next outbreaks will happen. We see a natural experiment occurring across Europe, the United States, and China, with the governments implementing different monitoring practices.
Advertising scholars are not the only people working on these issues. Other fields studying similar issues include recommender systems (Harper et al. Citation2005), persuasive computing (human–computer interaction and computer-mediated communication), marketing science, data mining, and machine learning. This is an opportunity for advertising scholars to come together with people working on the same problems but with different methods and approaches. Beyond answering specific questions about the effects of advertising, CA scholars can learn from other research communities that are steeped in data, such as computational biology, genetics, and epidemiology. We also note that other business functions, such as manufacturing, supply-chain management, financial and insurance management, and firm valuation, have been transformed by data. Consumer behaviors in other areas such as traffic patterns and medicine have also been subject to intense data analytics. Researchers can test whether CA meets the same rigor and standards as these other communities and explore methods and practices that they can adopt and adapt from these disciplines.
There is an argument that advertising is “special” because it is a discipline that is both behavioral and psychological. Yet the fact that we are still discussing the same age-old questions (e.g., “Is half my advertising is wasted?”) in an age of big data and computation suggests challenge areas for researchers that are of vital importance: What metrics exist today? Are they of value? What metrics are missing? What methodologies to assess advertising effectiveness are used today? Are they appropriate for the goals of firms and needs of a consumer-led marketplace? Why is there not more experimentation? Why is there a divide between survey-based metrics and behavioral metrics?
Finally, there is a risk that CA is “failing” because of manipulation by bad actors that results in consumer disaffection and fraud. While this issue is not the focus of this article, we believe adoption of the right metrics and methodologies can be mitigating factors. If digital advertising is annoying, we can measure opt-outs and ad blocking at the same time as we measure clicks and sales. Machine learning optimizes a user-specified objective. If the wrong objective (e.g., maximizing clicks) is pursued, machine learning will be very good at optimizing it, but it might do more harm than good. The current advertising landscape holds many well-defined challenges for researchers.
We conclude by reiterating the importance of measurement and methodology for CA. CA is the basis for the success of several of the most valuable firms today. CA has also contributed to Schumpeter’s creative destruction of enterprises at a scale and pace never seen before. As we move forward, CA will likely assume greater importance. The measurement, metrics, methods, and models, including experimentation, of CA will continue to evolve in ways not experienced before. Measurement is not just the final box on the side of an advertising flow diagram; it is an integral component of the systems themselves.
Additional information
Notes on contributors
Joseph T. Yun
Joseph T. Yun (PhD, University of Illinois at Urbana–Champaign) is a research assistant professor of accountancy and director of data science research services, Gies College of Business, and a research assistant professor of advertising, Charles H. Sandage Department of Advertising, University of Illinois at Urbana–Champaign, Champaign, Illinois, USA.
Claire M. Segijn
Claire M. Segijn (PhD, University of Amsterdam) is an assistant professor of advertising, Hubbard School of Journalism and Mass Communication, University of Minnesota Twin Cities, Minneapolis, Minnesota, USA.
Stewart Pearson
Stewart Pearson (MSc, Birkbeck College, University of London) is the chief executive officer, Consilient Group LLC, Washington, USA.
Edward C. Malthouse
Edward C. Malthouse (PhD, Northwestern University) is the Erastus Otis Haven professor of integrated marketing communication, Medill School of Journalism, Media, Integrated Marketing Communications, and a professor of industrial engineering and management science, McCormick School of Engineering, Northwestern University, Evanston, Illinois, USA.
Joseph A. Konstan
Joseph A. Konstan (PhD, University of California, Berkeley) is the distinguished McKnight university professor and associate dean for research, Department of Computer Science and Engineering, University of Minnesota, Minneapolis, Minnesota, USA.
Venkatesh Shankar
Venkatesh Shankar (PhD, Northwestern University) is the Coleman chair professor of marketing and director of research, Center for Retailing Studies, Mays Business School, Texas A&M University, College Station, Texas, USA.
References
- Abdollahpouri, H., M. Mansoury, R. Burke, and B. Mobasher. 2019. The impact of popularity bias on fairness and calibration in recommendation. arXiv Preprint. arXiv:1910.05755.
- Adomavicius, G., and A. Tuzhilin. 2011. Context-aware recommender systems. In Recommender systems handbook, 217–53. New York: Springer.
- Aguirre, E., D. Mahr, D. Grewal, K. de Ruyter, and M. Wetzels. 2015. Unraveling the personalization paradox: The effect of information collection and trust-building strategies on online advertisement effectiveness. Journal of Retailing 91 (1):34–49. doi:10.1016/j.jretai.2014.09.005
- Assmus, G., J. U. Farley, and D. R. Lehmann. 1984. How advertising affects sales: Meta-analysis of econometric results. Journal of Marketing Research 21 (1):65–74. doi:10.2307/3151793
- Bassili, J. N. 1993. Response latency versus certainty as indexes of the strength of voting intentions in a cati survey. Public Opinion Quarterly 57 (1):54. doi:10.1086/269354
- Batra, R., and K. L. Keller. 2016. Integrating marketing communications: New findings, new lessons, and new ideas. Journal of Marketing 80 (6):122–45. doi:10.1509/jm.15.0419
- Binet, L., and P. Field. 2013. The long and the short of it: Balancing short and long-term marketing strategies. London: Institute of Practitioners in Advertising.
- Blattberg, R. C., R. Briesch, and E. J. Fox. 1995. How promotions work. Marketing Science 14 (3 Suppl):G122–G132. doi:10.1287/mksc.14.3.G122
- Bronner, F., and P. Neijens. 2006. Audience experiences of media context and embedded advertising: A comparison of eight media. International Journal of Market Research 48 (1):81–100. doi:10.1177/147078530604800106
- Burez, J., and D. Van den Poel. 2009. Handling class imbalance in customer churn prediction. Expert Systems with Applications 36 (3):4626–36. doi:10.1016/j.eswa.2008.05.027
- Carrigan, M., and I. Szmigin. 1998. The usage and portrayal of older models in contemporary consumer advertising. Journal of Marketing Practice: Applied Marketing Science 4 (8):231–48. doi:10.1108/EUM0000000004544
- DeKimpe, M. G., and D. M. Hanssens. 2000. Time-series models in marketing: Past, present and future. International Journal of Research in Marketing 17 (2–3):183–93. doi:10.1016/S0167-8116(00)00014-8
- Deng, S., C.-W. Tan, W. Wang, and Y. Pan. 2019. Smart generation system of personalized advertising copy and its application to advertising practice and research. Journal of Advertising 48 (4):356–65. doi:10.1080/00913367.2019.1652121
- Devillers, L., L. Vidrascu, and O. Layachi. 2010. Automatic detection of emotion from vocal expression. In A blueprint for affective computing: a sourcebook and manual, ed. Klaus R. Scherer, Tanja Bänziger, and Etienne Roesch, 232–44. Oxford: Oxford University Press.
- Dijkstra, M., H. E. Buijtels, and W. F. Van Raaij. 2005. Separate and joint effects of medium type on consumer responses: A comparison of television, print, and the internet. Journal of Business Research 58 (3):377–86. doi:10.1016/S0148-2963(03)00105-X
- Dragoni, M. 2018. Computational advertising in social networks: An opinion mining-based approach. In Proceedings of the 33rd Annual ACM Symposium on Applied Computing, 1798–1804. New York: ACM.
- Ekstrand, M. D., J. T. Riedl, and J. A. Konstan. 2011. Collaborative filtering recommender systems. Foundations and Trends® in Human–Computer Interaction 4 (2):81–173. doi:10.1561/1100000009
- eMarketer. 2018. More than 80% of digital display ads will be bought programmatically in 2018. eMarketer. https://www.emarketer.com/content/more-than-80-of-digital-display-ads-will-be-bought-programmatically-in-2018.
- Fan, W., and M. D. Gordon. 2014. The power of social media analytics. Communications of the ACM 57 (6):26–74. doi:10.1145/2602574
- Farris, P. W., N. Bendle, P. Pfeifer, and D. Reibstein. 2010. Marketing metrics: The definitive guide to measuring marketing performance. Upper Saddle River, NJ: Pearson Education.
- Frederik, J., and M. Martijn. 2019. The new dot com bubble is here: It’s called online advertising. The Correspondent. https://thecorrespondent.com/100/the-new-dot-com-bubble-is-here-its-called-online-advertising/13228924500-22d5fd24.
- Fulgoni, G. M. 2016. Fraud in digital advertising: A multibillion-dollar black hole: How marketers can minimize losses caused by bogus web traffic. Journal of Advertising Research 56 (2):122. doi:10.2501/JAR-2016-024
- Gordon, B. R., F. Zettelmeyer, N. Bhargava, and D. Chapsky. 2019. A comparison of approaches to advertising measurement: Evidence from big field experiments at Facebook. Marketing Science 38 (2):193–225. doi:10.1287/mksc.2018.1135
- Graham, M. 2019. Google cracks down on ads tracking you across the web, and advertisers are preparing for the worst. CNBC. https://www.cnbc.com/2019/05/08/google-to-limit-cookies-for-ad-tracking-in-chrome-browser.html.
- Guynn, J. 2015. Google photos labeled black people ‘gorillas’. USA Today. https://www.usatoday.com/story/tech/2015/07/01/google-apologizes-after-photos-identify-black-people-as-gorillas/29567465/.
- Hansotia, B., and B. Rukstales. 2002. Incremental value modeling. Journal of Interactive Marketing 16 (3):35–46. doi:10.1002/dir.10035
- Harper, F. M., X. Li, Y. Chen, and J. A. Konstan. 2005. An economic model of user rating in an online recommender system. In International Conference on User Modeling, 307–316. New York: Springer.
- Herlocker, J. L., and J. A. Konstan. 2001. Content-independent task-focused recommendation. IEEE Internet Computing 5 (6):40–7. doi:10.1109/4236.968830
- Herlocker, J. L., J. A. Konstan, L. G. Terveen, and J. T. Riedl. 2004. Evaluating collaborative filtering recommender systems. ACM Transactions on Information Systems (TOIS) 22 (1):5–53. doi:10.1145/963770.963772
- Hofacker, C. F., E. C. Malthouse, and F. Sultan. 2016. Big data and consumer behavior: Imminent opportunities. Journal of Consumer Marketing 33 (2):89–97. " doi:10.1108/JCM-04-2015-1399
- Hopkins, C. C. 1968. Scientific advertising. Phoenix, AZ: New Line Publishing.
- Howe, D. C., and H. Nissenbaum. 2017. Engineering privacy and protest: A case study of Adnauseam. Iwpe@ SP, 57–64. https://nyuscholars.nyu.edu/en/publications/engineering-privacy-and-protest-a-case-study-of-adnauseam.
- Johnson, G. A., R. A. Lewis, and E. I. Nubbemeyer. 2017. Ghost ads: Improving the economics of measuring online ad effectiveness. Journal of Marketing Research 54 (6):867–84. doi:10.1509/jmr.15.0297
- Kaushik, A. 2019. Inside google marketing: How we measure the bottom-line impact of our advertising campaigns. https://www.thinkwithgoogle.com/marketing-resources/data-measurement/business-advertising-metrics/.
- Kireyev, P., K. Pauwels, and S. Gupta. 2016. Do display ads influence search? Attribution and dynamics in online advertising. International Journal of Research in Marketing 33 (3):475–90. doi:10.1016/j.ijresmar.2015.09.007
- Lewis, R. A., and D. H. Reiley. 2014. Online ads and offline sales: Measuring the effect of retail advertising via a controlled experiment on Yahoo! Quantitative Marketing and Economics 12 (3):235–66. doi:10.1007/s11129-014-9146-6
- Li, X., and D. Guan. 2014. Programmatic buying bidding strategies with win rate and winning price estimation in real time mobile advertising. In Pacific-Asia Conference on Knowledge Discovery and Data Mining, 447–460. New York: Springer.
- Line, N. D., T. Dogru, D. El-Manstrly, A. Buoye, E. Malthouse, and J. Kandampully. 2020. Control, use and ownership of big data: A reciprocal view of customer big data value in the hospitality and tourism industry. Tourism Management 80:104106. doi:10.1016/j.tourman.2020.104106
- Lipsman, A. 2012. For display ads, being seen matters more than being clicked. In New research from pretarget and comscore suggests that buyer conversion is more highly correlated with ad viewability and hover than with clicks or gross impressions. San Francisco: ComScore.
- Liu, Y., and V. Shankar. 2015. The dynamic impact of product-harm crises on brand preference and advertising effectiveness: An empirical analysis of the automobile industry. Management Science 61 (10):2514–35. doi:10.1287/mnsc.2014.2095
- Liu, Y., V. Shankar, and W. Yun. 2017. Crisis management strategies and the long-term effects of product recalls on firm value. Journal of Marketing 81 (5):30–48. doi:10.1509/jm.15.0535
- Liu-Thompkins, Y., and E. C. Malthouse. 2017. A primer on using behavioral data for testing theories in advertising research. Journal of Advertising 46 (1):213–25. doi:10.1080/00913367.2016.1252289
- Malthouse, E. C., and H. Li. 2017. Opportunities for and pitfalls of using big data in advertising research. Journal of Advertising 46 (2):227–35. doi:10.1080/00913367.2017.1299653
- Malthouse, E. C., E. Maslowska, and J. U. Franks. 2018. Understanding programmatic TV advertising. International Journal of Advertising 37 (5):769–84. doi:10.1080/02650487.2018.1461733
- Maslowska, E., S. J. Kim, E. C. Malthouse, and V. Viswanathan. 2019. Online reviews as customers’ dialogues with and about brands. In Handbook of Research on Customer Engagement. Northampton, MA: Edward Elgar Publishing.
- McDonald, A. M., and L. F. Cranor. 2010. Americans' attitudes about internet behavioral advertising practices. In Proceedings of the 9th Annual ACM Workshop on Privacy in the Electronic Society, 63–72. Chicago, IL: WPES.
- Naik, P. A., and K. Peters. 2009. A hierarchical marketing communications model of online and offline media synergies. Journal of Interactive Marketing 23 (4):288–99. doi:10.1016/j.intmar.2009.07.005
- Narang, U., and V. Shankar. 2019. Mobile app introduction and online and offline purchases and product returns. Marketing Science 38 (5):756–72. doi:10.1287/mksc.2019.1169
- Neumann, N., C. E. Tucker, and T. Whitfield. 2019. Frontiers: How effective is third-party consumer profiling? Evidence from field studies. Marketing Science 38 (6): 918–26.
- Odden, L. 2018. Trust in marketing is at risk. These Cmos and marketing influencers share how to fix. TopRank Marketing, https://www.toprankblog.com/2018/07/trust-in-marketing/.
- Olaya, D., K. Coussement, and W. Verbeke. 2020. A survey and benchmarking study of multitreatment uplift modeling. Data Mining and Knowledge Discovery 34 (2):273–36. doi:10.1007/s10618-019-00670-y
- Perlich, C., B. Dalessandro, R. Hook, O. Stitelman, T. Raeder, and F. Provost. 2012. Bid optimizing and inventory scoring in targeted online advertising. In Proceedings of the 18th ACM SIGKDD International Conference on Knowledge Discovery and Data Mining, 804–812. New York: ACM.
- Peters, K., Y. Chen, A. M. Kaplan, B. Ognibeni, and K. Pauwels. 2013. Social Media Metrics: A Framework and Guidelines for Managing Social Media. Journal of Interactive Marketing 27 (4):281–98. doi:10.1016/j.intmar.2013.09.007
- Scaturro, M. 2019. Elon Musk is making implants to link the brain with a smartphone. CNN Business. https://edition.cnn.com/2019/07/17/tech/elon-musk-neuralink-brain-implant/index.html.
- Segijn, C. M. 2019. A new mobile data driven message strategy called synced advertising: Conceptualization, implications, and future directions. Annals of the International Communication Association 43 (1):58–77. doi:10.1080/23808985.2019.1576020
- Segijn, C. M., and I. van Ooijen. 2020. Perceptions of techniques used to personalize messages across media in real time. Cyberpsychology, Behavior and Social Networking 23 (5):329–37. doi:10.1089/cyber.2019.0682
- Shankar, S., Y. Halpern, E. Breck, J. Atwood, J. Wilson, and D. Sculley. 2017. No classification without representation: Assessing geodiversity issues in open data sets for the developing world. arXiv Preprint. arXiv:1711.08536.
- Sloane, G. 2019. Amazon tests audio ads on Alexa music - and here’s a look at its pitch deck. AdAge. https://adage.com/article/digital/amazon-tests-audio-ads-alexa-music-and-heres-look-its-pitch-deck/2185811.
- Smit, E. G., G. Van Noort, and H. A. Voorveld. 2014. Understanding online behavioural advertising: User knowledge, privacy concerns and online coping behaviour in Europe. Computers in Human Behavior 32:15–22. doi:10.1016/j.chb.2013.11.008
- Spangler, T. 2019. Facebook target of antitrust probe by state attorneys general. Variety. https://variety.com/2019/digital/news/facebook-antitrust-probe-us-state-attorneys-general-1203325931/.
- Strycharz, J., G. van Noort, N. Helberger, and E. Smit. 2019. Contrasting perspectives–Practitioner’s viewpoint on personalised marketing communication. European Journal of Marketing 53 (4):635–60. doi:10.1108/EJM-11-2017-0896
- Taylor, C. R., and H.-K. Bang. 1997. Portrayals of Latinos in magazine advertising. Journalism & Mass Communication Quarterly 74 (2):285–303. doi:10.1177/107769909707400204
- Van Noort, G., I. Himelboim, J. Martin, and T. Collinger. 2020. Introducing a model of automated brand-generated content in an era of computational advertising. Journal of Advertising 49 (4). doi:10.1080/00913367.2020.1795954
- Wang, W.-L., E. Carl Malthouse, B. Calder, and E. Uzunoglu. 2019. B2b content marketing for professional services: In-person versus digital contacts. Industrial Marketing Management 81:160–8. doi:10.1016/j.indmarman.2017.11.006
- Wojcik, S., S. Messing, A. Smith, L. Rainie, and P. Hitlin. 2018. Bots in the Twittersphere: An estimated two-thirds of tweeted links to popular websites are posted by automated accounts-not human beings. Washington, DC: Pew Research Center.
- Yun, J. T., U. Pamuksuz, and B. R. L. Duff. 2019. Are we who we follow? Computationally analyzing human personality and brand following on twitter. International Journal of Advertising 38 (5):776–95. doi:10.1080/02650487.2019.1575106