
Abstract
Purpose
Idea density has been shown to influence comprehension time for text in various populations. This study aims to explore the influence of spoken idea density on attainment in young, healthy subjects using demographic characteristics.
Methods
Students watched two online lectures and answered 10 multiple choice questions on them. Students received one more idea dense (MID) and one less idea dense (LID) lecture on two different subjects.
Results
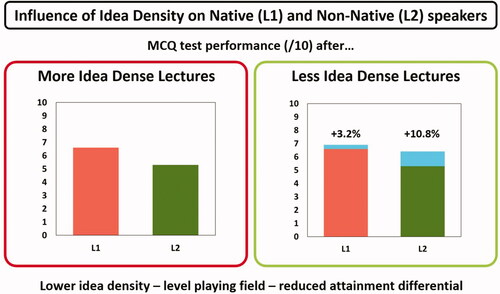
Seventy-five students completed the study achieving a higher median score after a less idea-dense lecture (LID = 7(3), MID = 6(3), p = 0.04). Artificial neural network models revealed the first language as the main predictor of exam performance. The odds ratio (OR) of obtaining ≥70% after a more idea-dense lecture was six-time higher for the first language versus second language English speakers (OR = 5.963, 95% CI 1.080–32.911, p = 0.041). The odds ratio was not significant when receiving a less dense lecture (OR = 2.298, 95% CI 0.635–8.315, p = 0.205). Second-language speakers benefited from receiving a lower idea density, achieving a 10.8% score increase from high to low density, versus a 3.2% increase obtained by first language speakers.
Conclusions
The propositional idea density of lectures directly influences students’ comprehension, and disproportionately for second language speakers; revealing the possibility of reduced spoken idea density in levelling the attainment differential between first and second language speakers.
Graphical Abstract
Introduction
Idea density (ID) as a concept was first defined in 1973 by Kintsch and Keenan (Kintsch and Keenan Citation1973) as the number of concepts in a text divided by the total number of words used. For example, the two following sentences have the same number of ideas (underlined) but have different idea densities:
Practice points
Idea or concept density is a linguistic measure dividing concepts presented by words used.
Reducing lecture idea density was shown to improve comprehension and test performance.
Second language students generally have an attainment gap.
Second language students were shown to improve more, reducing the attainment gap.
Idea density is an easily measurable metric to help improve performance.
‘The black cat sat on the mat’ Idea density = 5 ideas ÷ 7 words = 0.71
‘There is a cat, which is black, and it is sitting on the mat’ Idea density = 5 ideas ÷ 14 words = 0.36
Idea density may be measured in two ways, Propositional Idea Density or Semantic Idea Density. Propositional idea density counts the number of propositional words used and then divides them by the total number of words used. Semantic idea density counts the number of separate concepts and assertions within a sentence, divided by the total number of words used. Whilst different linguistically, the two measures are comparable to each other statistically (Brown et al. Citation2008; Sirts et al. Citation2017).
When first explored by Kintsch and Keenan, idea density was used as a metric to explore comprehension from written text (Kintsch and Keenan Citation1973). This and other studies showed the density of a text to be directly linked to the time needed to comprehend and successfully recall information from the text (Kintsch et al. Citation1975; Kintsch and Van Dijk Citation1978; Miller and Kintsch Citation1980; Defrancesco and Perkins Citation2013). Idea density in this sense can be thought of as having direct parallels to the complexity of a sentence. However, its use in pedagogy has been limited since it was originally studied in 1973. In particular, the idea density of methods of teaching that rely on aural or spoken words, as opposed to texts that are read, may require further exploration. The impact of idea density on changing demographics of people accessing information also remains underexplored. This is important as idea density is reported as influencing comprehension in second language learners (Chaudron et al. Citation1994; Bloomfield et al. Citation2011). Bloomfield et al. suggested content with a higher density may disadvantage second-language speakers, who potentially could not keep up with the information. Conversely, evidence also suggests an increase in redundant words or information in less idea-dense language may introduce more complexity, making it harder for second language learners to distinguish important information from redundant information (Bloomfield et al. Citation2010).
Idea density has also been explored in the spoken and written language of patients with dementia; the seminal study in this area being the ongoing Nun study, which made its first publication in 1996 (Snowdon et al. Citation1996). This study determined the written idea density of 107 nuns as young women (usually in their 20s) who were required to write an autobiography upon entering the convent. Later, medical records were obtained determining any diagnosis of Alzheimer’s disease. When compared, it was shown that written idea density as a young adult was a predictor of who would later develop dementia, with a lower written density increasing the probability of developing dementia, a link that has been further established (Riley et al. Citation2005; Farias et al. Citation2012; Aluísio et al. Citation2016).
The work in patients with dementia provides an insight that people can change both their spoken and written idea density, which can be translated to pedagogic research. Students with varying physical and mental health and social demographic contexts may be influenced by idea density in different ways, particularly attainment. Exploring idea density in relation to attainment is important, as recent work has demonstrated an attainment differential in students from different social backgrounds (Woolf Citation2020).
This study aims to explore the influence of spoken idea density on attainment (as test score) in young, healthy subjects.
Key research question
What is the impact of spoken idea density in lectures on student comprehension?
Objectives
To identify:
Differences in students’ score after receiving a Less Idea Dense (LID) or More Idea Dense (MID) lecture.
Predictors (independent variables) influencing the students’ total score (LID and MID combined).
The odds ratio for the first language (L1) English-speaking students to achieve 70% (representing a first-class degree) versus the second language (L2) English-speaking students upon testing after receiving an MID lecture.
The odds ratio for L1 English-speaking students to achieve 70% versus L2 English-speaking students upon testing after receiving an LID lecture.
The average difference in score achieved after MID and LID lectures change between first and second language English speakers.
Methods
Study design
Multicentre observational cohort study.
Setting
This study was led by the Pedagogic Interest Group (Lunn and Manfrin Citation2021) at the University of Central Lancashire (UCLan) and involved four UK universities: Liverpool John Moores University, Newcastle University, Ulster University, and UCLan.
Population
Undergraduate degree students are classed as first or second language English speakers, with international students holding a grade of at least 6 in the International English Language Test (IELTS), or equivalent.
Recruitment
Students in each university were invited to take part in the study via email from the respective tutors in each institution. A reminder email was sent two weeks after the first email. This created a power imbalance, that the students were being recruited by their tutors, however, it was made clear that participation was completely voluntary and had no impact on their academic studies. This was set out in the study ethics approval and participation information sheet.
Inclusion criteria
Volunteers studying towards an undergraduate degree in pharmacy and pharmaceutical biosciences were invited to participate in this study.
Exclusion criteria
Volunteers studying undergraduate degrees in non-pharmacy or pharmaceutical-bioscience subjects in the four participating universities.
Participant randomisation
Participants were randomly assigned into two groups, A and B, using random numbers generated on Microsoft Excel (even numbers in group A, odd numbers in group B). Group sizes were then matched by generating further random numbers to reassign participants.
Research instrument
As summarised in , participants were asked to watch pre-recorded 3–4 min lectures on two subjects with pre-determined idea densities and then answer 10 multiple-choice questions (MCQs) to test their comprehension and factual recall. Participants were invited via email to watch a lecture on materials science. Group A to watch a More Idea Dense lecture (ID = 0.54) and group B to watch a Less Idea Dense lecture (ID = 0.42). Participants from both groups then answered 10 identical 5-item MCQs testing comprehension and factual recall of lecture material. Whilst the study was run asynchronously, each lecture was only available to watch by each participant once, and tests were taken immediately after watching. After two weeks, the same participants were invited to watch a second lecture on polymer chemistry, with group A viewing a less dense lecture (ID = 0.46) and Group B a more dense lecture (ID = 0.58). Participants from both groups then answered ten identical 5-item MCQs on the lecture material. Lectures were designed to control as many other linguistic factors than idea density as possible, summarised in . All lectures contained a comparable number of ideas as measured by propositions. Idea density was reduced by using shorter words (indicated by syllables per word) in the less dense lecture, allowing for a comparable speech rate and length between the more and less idea-dense lectures. Lecture topics were chosen as students on these programmes were unlikely to cover this material and were assumed not to have prior knowledge of the content. All lectures were written by a subject expert and independently assessed by a third party to contain the same information. Idea density was determined using Computerised Propositional Idea Density Rater (CPIDR 3.0) (Brown et al. Citation2008). Lectures and questions were completed by participants using the online software Qualtrics©.
Figure 1. Overview of the research methodological flow.
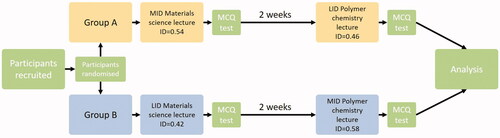
Table 1. Linguistic metrics of lectures used in the study.
Sample size
The sample size was calculated post-hoc using the Wilcoxon signed-rank test for matched pairs comparing two continuous variables, MID and LID scores. A sample size of 74 students provided an 80% power, with one tail, alpha = 0.05, effect size d = 0.3, degree of freedom of 69.7, critical t = 1.67, and a centrality parameter δ = 2.5.
Statistical analysis
Missing data
The missing data analysis was performed looking for data missing completely at random (MCAR), missing at random (MAR) and missing not at random (MNAR).
Normality
Data normality was assessed for continuous variables using the Shapiro–Wilk and the Kolmogorov–Smirnov tests. The difference between paired samples was evaluated using the Wilcoxon Sign Rank test for non-normally distributed data.
Data binning
Age was dichotomised as 18–21 and >21; scores as achieving under or over and above 70%. The difference between scores after fewer and more idea-dense lectures was divided into three categories: positive difference (LID > MID), no difference (LID = MID), and negative difference (LID < MID).
Pearson’s chi-square
Pearson’s chi-square (χ2) for the goodness of fit was used for assessing the difference between three categories of LID and MID scores.
Artificial neural network
Artificial neural networks (ANNs) are algorithms used in machine learning to simulate the human brain, performing predictive analytics that analyse data, learns, and subsequently make classifications and predictions, previously being used for knowledge extraction (Khan and Kulkarni Citation2013; Srividya et al. Citation2018). ANNs then, represent the artificial equivalents of biological neurons using multiple connections to process information in a connectionist approach (Cross et al. Citation1995; Tang et al. Citation2013). ANNs mimic the brain’s activity in two ways: (1) acquiring knowledge through a learning process; (2) interneuron connection strengths (synapsis weights) storing knowledge (Simon Citation1999).
In our analysis, we used and compared two ANN models: multilayer perceptron (MLP) and radial basis function (RBF). These models work under supervised learning conditions where the learning is performed by presenting a pattern with the target. During the learning, the produced output is compared with the desired output, and the difference between these is used to adapt learning weights.
MLP is a commonly used ANN method for prediction studies. MPL is a standard feed-forward approach with three layers: (1) input layer, containing the three predictors (age, language, and gender); (2) hidden layer, representing the function of the predictors and was determined through trial and error; (3) output layer, representing the responses (achieving <70% or ≥70%). In the MPL-ANN model, each neuron received the input data from other neurons and passed through the hidden layers to an output layer. The partition was split as 70% training and 30% test, using batch training. Our model had one hidden layer, and the activation function was the hyperbolic tangent. The output layer contained the target variable (response), and the activation function was the softmax, which was used because the target variable was dichotomous, therefore, categorical.
RBF is also a feed-forward network typically composed of three layers (input, single hidden, and output layer) whose structure is like the MPL. The main difference is that RBF has a hidden layer with nodes called RBF units measuring the distances between an input data vector and the centre of its RBF (de Pauli et al. Citation2020). In our RBF model, the input and output layer variables, and partition (70:30) were the same as the MPL model. The activation function for the hidden layer was softmax, and identity for the output layer.
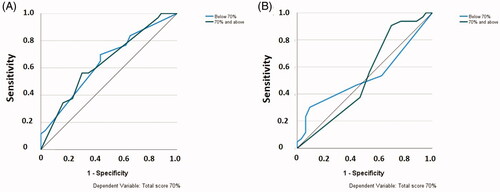
The MPL and RBF models were compared using the receiver operating characteristic curve (ROC), assessing the values of the area under the curve (AUC). The combination of AUC and ROC is called the area under the receiver operating characteristic curve (AUROC) (Thomas et al. Citation2017). The ROC curve is a graphical representation of the trade-off between sensitivity (y-axis) and specificity (x-axis). The ROC curve plots the false positive rate (x-axis) and the true positive rate (y-axis) for several points between 0.0 and 1.0. The closer the curve is to the top left corner, the better the test’s performance; the closer the curve to the 45° diagonal of the ROC space, the worse the test is. As a general rule, an AUC of 0.5 suggests no discrimination, 0.7–0.8 acceptable, 0.8–0.9 excellent, >0.9 outstanding (Bradley Citation1997). summarises other differences between MPL and RFB.
Table 2. Main differences between MPL and RFB.
Binary logistic regression
Logistic regression is a statistical technique used to determine the relationship between predictors, represented by independent variables, and predicted variables (dependent variables). The logistic regression aims to predict the odds (Exp (B)) of success (occurred) or failure (not occurred), representing the ratio of the probability (p) [odds = p/(1 − p)]. Its basic function is the logistic model (logit). Thus, the logarithm of the odds is represented by the logit function [logit p = In (p/1 − p)] for 0 < p < 1. In our study, we were dealing with dichotomous variables, therefore two binary logistic regression models were used. The independent dichotomous variables were the same for the two models, age, gender, and language. The dependent variables in the models were: LID score dichotomised and MID score dichotomised (<70% and ≥70% and above).
Analysis was conducted using IBM SPSS 27 and Microsoft Excel 2016. Statistical significance was set at p ≤ 0.05 for all analyses.
Ethics
The study was conducted in accordance with the Helsinki Declaration of 1975 as revised in 2008 receiving ethical approval from all universities (UCLan: Health 0029, LJMU: 20/PBS/001, Ulster: FCBMS-20-041-A and Newcastle: 2573/2020). Informed consent was obtained from all individual participants included in the study. All data were treated following the requirements of the Data Protection Act (2018) and/or General Data Protection Regulation (GDPR) 2016.
Results
Missing data
The data set did not present missing data.
Response
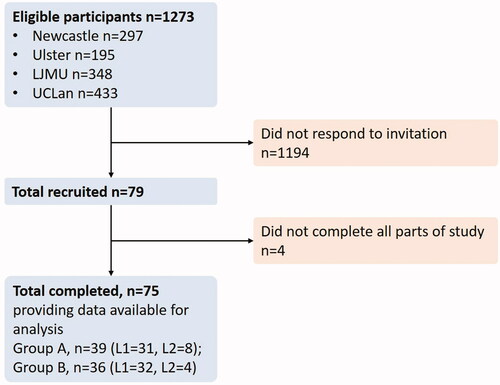
A total of 1273 undergraduate students across four universities were invited to take part in the study. From this a total of 75 students fully completed all parts of the study, giving a response rate of 6%, which is very low. This is however was likely to be influenced by students only being contacted twice by email and compounded by the study being sent out at the start of 2020, just as the coronavirus pandemic hit diverting students’ attention and stopping face to face interaction with soft reminders of the study ().
Figure 2. STROBE flow diagram showing study participation numbers.
Score differences achieved by students receiving more and less idea dense lectures
The median score students achieved after receiving a more idea-dense lecture was 6 out of 10, and the median score achieved after receiving a less idea-dense lecture was 7 out of 10 (). The increase in score observed after receiving an LID lecture was shown to be significant (p = 0.049), suggesting that students retained more information and performed better after receiving an LID lecture.
Table 3. Overall average scores achieved.
Pearson’s chi-square: LID versus MID
The differences between LID scores versus MID scores were divided into three groups: (1) LID < MID (32%), LID = MID (17.3%) and LID > MID (50.7%). The difference between the three groups was statistically significant (χ2 = 12.560, df = 2, p = 0.002), and LID > MID represented the largest group. This further suggests that students performed better after receiving an LID lecture.
Predictors influencing students’ total score (MID and LID combined)
Artificial neural network
The number of training and testing sessions was the same. During the models’ training session, the incorrect prediction percentage was 43.4% for both models. During the testing phase, these values dropped to 22.7% in the MPL and 40.9% in the RBF. Thus, 77.3% was the overall percentage of correct predictions in the MPL and 59.1% in the RBF models. The independent variable’s importance ranges from zero (no importance) to one (maximum importance). Both models identified and ranked the importance of the independent variables in the same order, language > age > gender (, Appendix A - ). Each variable’s importance is also illustrated by the relative size of its corresponding blue box in . The RBF model allocated a higher value to each variable compared to the MPL. The MPL model showed a better AUROC value (0.641) than the RBF (0.527) (); neither of the AUROCs reached the 0.7 thresholds for acceptable discrimination. However, the artificial neural network models were in agreement, showing language as the most important variable influencing scoring.
Figure 3. (A) MLP architecture with output layer neuron, (B) RBF architecture with output layer neurons. Legend: Independent variables: Gender (female, male); Language (first/second language English speaker, Age (<21, 21 and above). Dependent variables: Total score (1 = <70%, 2 = 70% and above).
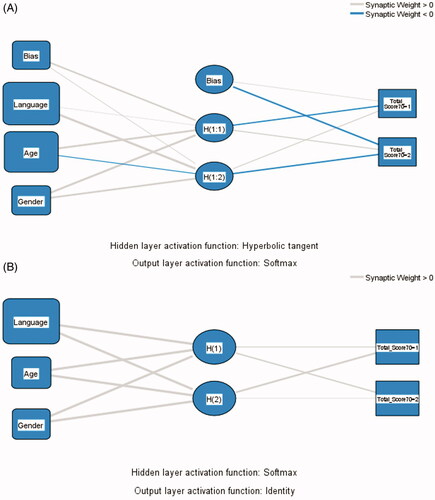
Figure 4. (A) MPL’s AUROC (0.641), (B) RBF’s AUROC (0.527).
Odds ratio for first language students to achieve 70% or above versus second language students after MID and LID lectures using binary logistics
Model one – More idea dense lectures
The first model investigating the difference in achievement between first (L1) and second (L2) language English speakers when receiving more idea-dense lectures was statistically significant, showing an χ2 = 9.626, df = 3, p = 0.022. The Nagelkerke R2 coefficient explained 16.2% of the variance of the model. The odds ratio (OR) that L1 speaking students achieved a score of 70% upon testing after an MID lecture was six times higher (OR = 5.963, 95% CI 1.080–32.911; p = 0.041) than L2 speakers. Age influenced performance in the tests; older students (>21) had almost three times the chances to achieve ≥70% in the MID test (OR = 2.782, 95 CI 0.999–7.747; p = 0.050). Gender did not have a statistically significant effect (OR = 2.079, 95% CI 0.635–6.800; p = 0.226).
Model two – Less idea dense lectures
When receiving less idea-dense lectures, the difference in achievement between L1 and L2 English speakers was not statistically significant χ2 = 1.788, df = 3, p = 0.618. The Nagelkerke R2 coefficient explained 3.2% of the variance of the model. The odds ratio (OR) that L1 students achieved a score of ≥70% after an LID lecture was two-time higher (OR = 2.298, 95% CI 0.635–8.315; p = 0.205) than L2 speakers; but this result was not significant. The influence of age and gender were not significant (OR = 1.020, 95 CI 0.385–2.689; p = 0.969) and (OR = 1.412, 95% CI 0.459–4.346; p = 0.547), respectively.
Average score difference after MID and LID lectures between L1 and L2 speakers
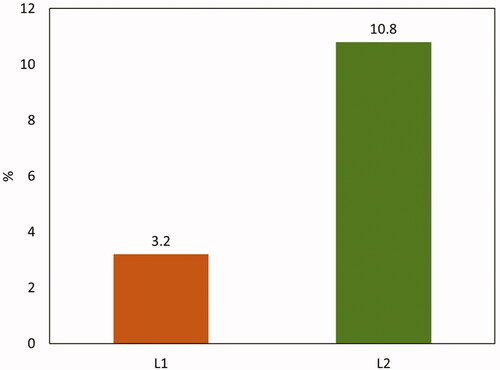
Individual students’ scores were then analysed to determine the average change after receiving an LID lecture compared to an MID lecture, . The mean score change (out of 10) from L1 speakers after receiving an LID lecture was 0.32 (+3.2%) and for L2 speakers was 1.08 (+10.8%).
Figure 5. Average MCQ test score difference after MID and LID lectures from L1 and L2 English speakers.
Discussion
The results of this study suggest that knowledge retention after lectures, as measured by MCQs, is improved by a reduced spoken idea density, with the mean average score increasing from 6.4 to 6.8 out of 10 when receiving a less idea dense lecture (p = 0.049). Further evidence confirming the observed increase in achievement after receiving a less dense lecture was shown when individual test scores were categorised as: LID < MID, LID = MID, and LID > MID and analysed by means of Pearson’s Chi-square test. Most students were shown to achieve a higher mark after receiving a less dense lecture (LID > MID = 50.7%, p = 0.002), broadly matching what has been demonstrated previously by Stine and Wingfield (Stine et al. Citation1986), who studied the immediate memory recall in adults when varying multiple linguistic factors. They found that as spoken propositional density increased, detailed factual recall decreased, and therefore that a reduced density increased recall. Such an increase in knowledge retention could also feasibly be attributed to other factors than idea density that we were careful to control, including lecture length, speech pace, and change in content presented. Lectures lasted 3–4 min, allowing full concentration being shorter than the average attention span, reported as short as 6 min (Bradbury Citation2016). The pace of speech was kept between 91 and 98 words per minute, below what is considered a normal speech rate of 130–220 words per minute (Tauroza and Allison Citation1990). Whilst the speech rate as words per minute appears slightly higher in the less dense lectures, this is an artefact of them containing more words and is negated when speech rate is determined by the number of syllables per minute. The content of each lecture was also reviewed by a subject expert to ensure that the same information and depth of knowledge were presented in all lectures. Idea density was changed in these lectures by using more shorter words in less idea-dense lectures, and fewer longer words in more dense lectures, conveying the same theory. The observed increase in knowledge retention then may be attributed to a cognitive overload when listening to more idea-dense speech, with more ideas being introduced with fewer words. We would further suggest that the use of familiar, ‘simple’ and short language in less dense lectures, rather than longer, technical language in more dense lectures, also contributed to improved recall.
We further explored subjective factors and their impact on the influence of changing idea density on performance. Perhaps unsurprisingly (given the established link between ID and dementia) age has previously been explored as an influencing factor, with various studies suggesting that as age increases so does the impact of varying idea density (Stine et al. Citation1986; Kemper et al. Citation1993; Stine and Hindman Citation1994). Other factors remain less explored, so we sought to determine the individual factors that predicted test performance overall and when varying idea density. To do this we used two artificial neural network (ANN) models as conventional statistical evaluations are limited in providing good predictions of university education quality, as suggested by Lau et al. (Citation2019). Additionally, ANNs can identify non-linear relationships between independent and dependent variables. To be considered an acceptable level of discrimination, an ANN typically needs to have an AUROC of over 0.7. The two models we used showed values of 0.641 and 0.527 for MPL and RBF, respectively. Neither of these reached the threshold for discrimination; this is most likely due to the relatively small sample not providing the network enough repeats to learn from to give more reliable outcomes. Another major factor in not reaching this threshold may well have been the uneven distribution of characteristics amongst the population, for example, the number of L1 (n = 63) and L2 (n = 12) speakers. This is important, as the specificity of ANNs relies on a reasonable proportion of subjects both with and without a certain characteristic (Tokan et al. Citation2006).
Despite not reaching the AUROC threshold, both ANN models confirmed that the largest influencing factor in predicting overall test performance was language, with participants declaring as either L1 or L2 English speakers. This predictive characteristic was investigated using binary logistic regression, dichotomising scores as <70% and ≥70%. This analysis showed that L2 speakers were significantly less likely to achieve over 70% when receiving more idea-dense lectures (OR = 5.963, 95% CI 1.080–32.911; p = 0.041). This trend was maintained after a less dense lecture; however, the difference became non-significant (OR = 2.298, 95% CI 0.635–8.315; p = 0.205). Importantly, the reduced attainment differential was not due to L1 speakers performing worse, but L2 speakers performing better. Furthermore, whilst the split of L2 speakers was not even between groups A and B (A = 8, B = 4), there was no significant attainment difference between groups A and B. These results then, suggest that the ability of an L2 speaker to achieve top marks was greatly improved by receiving a less idea dense lecture.
An increased score was observed in all populations after receiving less idea-dense lectures, with L1 speakers increasing on average by 3.2% and L2 speakers by 10.8%. This again shows that all students benefit from a decreased idea density, but L2 speakers benefit more. When taken together with the significant results obtained from the BLR’s, a reduced idea density can be seen to facilitate L2 speakers to perform as well as L1 speakers, reducing the attainment differential between the two. It is intuitive that L2 students will find it harder to listen and comprehend, as they are not working in their first language, this area has been reviewed in detail by Bloomfield (Bloomfield et al. Citation2010). The conclusions from this review and other primary studies, such as that by Rupp et al. are in agreement with the results presented here; showing reducing idea density can help to increase comprehension in L2 speakers (Rupp et al. Citation2001).
Practical recommendations for reducing idea density
This evidence suggests that reducing idea density in both verbal and written teaching materials can lead to improved knowledge retention and factual recall for first and especially second language English-speaking students. How then might such a reduced idea density be achieved without greatly expending the time taken to teach and course length? In producing this work, we found the following suggestions useful
Only allow one concept per sentence. The subject must first be reduced to its basic concepts, and each of these should be presented separately.
Use short, basic, and widely understood words before introducing longer subject-specific words. This naturally reduces idea density by using shorter words, however, teachers should avoid talking faster to fit in the extra words.
The session time and idea density must be sensibly balanced and taken into the context of your specific teaching.
Use software such as CPIDR to track and reduce idea density as far as is practical for written resources (rather than trying to reach a specific target).
This approach can also be used retrospectively for verbal teaching, as recorded and virtual lectures produce automatic lecture transcripts which can be exported into the analysis software.
Limitations and generalizability
Whilst meeting the minimum number of participants required for a suitable statistical power, the low number of 75 participants represents a limitation of this study. A larger sample would be required for more firm conclusions to be drawn. The uneven distribution of L1 and L2 English speakers also reduces the predictive models’ power. The effect size is also potentially quite small, with the lectures used being stand-alone subject introductions under five minutes in length, we assume that any effect size would be increased if longer lectures were used with an equivalent variation in idea density. As the population used in the sample was taken from across the UK these results are generalisable to UK undergraduate students. For broader generalizability, a larger number of participants with a wider demographic spread would be required.
Conclusion
Spoken propositional idea density in recorded lectures of similar length has been shown to influence comprehension as tested by multiple-choice questions. Students’ median scores and achievement of high marks (≥70%) increased when receiving a less idea-dense lecture. Analysis with an artificial neural network revealed the first language as the biggest predictor of student performance in tests, with L2 speakers performing significantly worse overall and when receiving a more idea-dense lecture. When L1 and L2 speaking students received less idea-dense lectures the attainment differential was still present but made insignificant. This shows the potential for lower idea density to help reduce the attainment differential between L1 and L2 students and presents the possibility of an easily measurable metric by which teaching materials can be made more inclusive.
Disclosure statement
The authors report no conflicts of interest. The authors alone are responsible for the content and writing of the article.
Additional information
Notes on contributors
Andrew M. Lunn
Andrew M. Lunn, PhD, is a Pharmacy lecturer, UCLan.
Daniel Matthias Bürkle
Daniel Matthias Bürkle, PhD, is Psycholinguistics lecturer, UCLan.
Rebecca Ward
Rebecca Ward is a Pharmacy student, UCLan.
Alice P. McCloskey
Alice P. McCloskey, PhD, is an undergraduate Pharmacy lecturer, LJMU.
Adam Rathbone
Adam Rathbone, PhD, is a Pharmacy lecturer, Newcastle University.
Aaron Courtenay
Aaron Courtenay, PhD, is a Clinical Pharmacy lecturer, Ulster University.
Rachel Mullen
Rachel Mullen, PhD, is a senior Clinical Pharmacy lecturer, LJMU.
Andrea Manfrin
Andrea Manfrin, PhD, Professor, is the Faculty Director of Research for Clinical and Biomedical Sciences, UCLan.
References
- Aluísio S, Cunha A, Scarton C. 2016. Evaluating progression of Alzheimer’s disease by regression and classification methods in a narrative language test in Portuguese. Paper presented at the 12th International Conference on Computational Processing of the Portuguese Language, July 13–15, Tomar, Portugal.
- Bloomfield A, Wayland SC, Rhoades E, Blodgett A, Linck J, Ross S. 2010. What makes listening difficult? Factors affecting second language listening comprehension. College Park (MD): University of Maryland.
- Bloomfield A, Wayland S, Blodgett A, Linck J. 2011. Factors related to passage length: implications for second language listening comprehension. Paper presented at the 33rd Annual Meeting of the Cognitive Science Society; July 20–23; Boston, MA.
- Bradbury NA. 2016. Attention span during lectures: 8 seconds, 10 minutes, or more? Adv Physiol Educ. 40(4):509–513.
- Bradley AP. 1997. The use of the area under the ROC curve in the evaluation of machine learning algorithms. Pattern Recognit. 30(7):1145–1159.
- Brown C, Snodgrass T, Kemper SJ, Herman R, Covington MA. 2008. Automatic measurement of propositional idea density from part-of-speech tagging. Behav Res Methods. 40(2):540–545.
- Chaudron C, Loschky L, Cook J. 1994. Second language listening comprehension and lecture note-taking. In: Flowerdew J, editor. Academic listening: Research perspectives. Cambridge (UK): Cambridge University Press; p. 75–92.
- Cross SS, Harrison RF, Kennedy RL. 1995. Introduction to neural networks. The Lancet. 346(8982):1075–1079.
- de Pauli STZ, Kleina M, Bonat WH. 2020. Comparing artificial neural network architectures for Brazilian stock market prediction. Ann Data Sci. 7(4):613–628.
- DeFrancesco C, Perkins K. 2012. An analysis of the proposition density, sentence and clause types, and non-finite verbal usage in two college textbooks. In: Plakhotnik MS, Nielsen SM, Pane DM, editors. Proceedings of the 11th annual college of education & GSN research conference. Miami: Florida International University; p. 20–25.
- Farias ST, Chand V, Bonnici L, Baynes K, Harvey D, Mungas D, Simon C, Reed B. 2012. Idea density measured in late life predicts subsequent cognitive trajectories: implications for the measurement of cognitive reserve. J Gerontol Series B Psychol Sci Social Sci. 67(6):677–686.
- Kemper S, Jackson JD, Cheung H, Anagnopoulos CA. 1993. Enhancing older adults’ reading comprehension. Discourse Proc. 16(4):405–428.
- Khan I, Kulkarni A. 2013. Knowledge extraction from survey data using neural networks. Procedia Comput Sci. 20:433–438.
- Kintsch W, Keenan J. 1973. Reading rate and retention as a function of the number of propositions in the base structure of sentences. Cogn Psychol. 5(3):257–274.
- Kintsch W, Van Dijk TA. 1978. Toward a model of text comprehension and production. Psychol Rev. 85(5):363–394.
- Kintsch W, Kozminsky E, Streby WJ, Mckoon G, Keenan JM. 1975. Comprehension and recall of text as a function of content variables. J Verbal Learn Verbal Behav. 14(2):196–214.
- Lau E, Sun L, Yang Q. 2019. Modelling, prediction and classification of student academic performance using artificial neural networks. SN Appl Sci. 1(9):1–10.
- Lunn AM, Manfrin A. 2021. Pedagogic Interest Group: a novel and proven collaborative, adhocracy research group structure. MedEdPublish. 10:182.
- Miller JR, Kintsch W. 1980. Readability and recall of short prose passages: a theoretical analysis. J Exper Psychol. 6:335.
- Riley KP, Snowdon DA, Desrosiers MF, Markesbery WR. 2005. Early life linguistic ability, late life cognitive function, and neuropathology: findings from the Nun Study. Neurobiol Aging. 26(3):341–347.
- Rupp AA, Garcia P, Jamieson J. 2001. Combining multiple regression and CART to understand difficulty in second language reading and listening comprehension test items. Int J Testing. 1(3):185–216.
- Simon H. 1999. Neural networks: a comprehensive foundation. Upper Saddle River, NJ: Prentice Hall.
- Sirts K, Piguet O, Johnson M. 2017. Idea density for predicting Alzheimer’s disease from transcribed speech. arXiv preprint arXiv:1706.04473.
- Snowdon DA, Kemper SJ, Mortimer JA, Greiner LH, Wekstein DR, Markesbery WR. 1996. Linguistic ability in early life and cognitive function and Alzheimer’s disease in late life: findings from the Nun Study. JAMA. 275(7):528–532.
- Srividya M, Mohanavalli S, Bhalaji N. 2018. Behavioral modeling for mental health using machine learning algorithms. J Med Syst. 42(5):88–12.
- Stine EA, Hindman J. 1994. Age differences in reading time allocation for propositionally dense sentences. Aging Cogn. 1:2–16.
- Stine EL, Wingfield A, Poon LW. 1986. How much and how fast: rapid processing of spoken language in later adulthood. Psychol Aging. 1(4):303–311.
- Tang Z-H, Liu J, Zeng F, Li Z, Yu X, Zhou L. 2013. Comparison of prediction model for cardiovascular autonomic dysfunction using artificial neural network and logistic regression analysis. PLoS One. 8(8):e70571.
- Tauroza S, Allison D. 1990. Speech rates in British English. Appl Ling. 11(1):90–105.
- Thomas G, Kenny LC, Baker PN, Tuytten R. 2017. A novel method for interrogating receiver operating characteristic curves for assessing prognostic tests. Diagn Progn Res. 1(1):1–9.
- Tokan F, Türker N, Yıldırım T. 2006. ROC analysis as a useful tool for performance evaluation of artificial neural networks. Paper presented at the 16th International Conference on Artificial Neural Networks; September 10–14; Athens, Greece.
- Woolf K. 2020. Differential attainment in medical education and training. BMJ. 368:m339.
Appendix A
Table A1. MPL and RBF artificial neural network outputs.