
Abstract
Introduction
Ensuring equivalence in high-stakes performance exams is important for patient safety and candidate fairness. We compared inter-school examiner differences within a shared OSCE and resulting impact on students’ pass/fail categorisation.
Methods
The same 6 station formative OSCE ran asynchronously in 4 medical schools, with 2 parallel circuits/school. We compared examiners’ judgements using Video-based Examiner Score Comparison and Adjustment (VESCA): examiners scored station-specific comparator videos in addition to ‘live’ student performances, enabling 1/controlled score comparisons by a/examiner-cohorts and b/schools and 2/data linkage to adjust for the influence of examiner-cohorts. We calculated score impact and change in pass/fail categorisation by school.
Results
On controlled video-based comparisons, inter-school variations in examiners’ scoring (16.3%) were nearly double within-school variations (8.8%). Students’ scores received a median adjustment of 5.26% (IQR 2.87–7.17%). The impact of adjusting for examiner differences on students’ pass/fail categorisation varied by school, with adjustment reducing failure rate from 39.13% to 8.70% (school 2) whilst increasing failure from 0.00% to 21.74% (school 4).
Discussion
Whilst the formative context may partly account for differences, these findings query whether variations may exist between medical schools in examiners’ judgements. This may benefit from systematic appraisal to safeguard equivalence. VESCA provided a viable method for comparisons.
Practice points
Equivalence is important to the validity and fairness of OSCEs but is challenging to study.
We shared an OSCE between 4 UK medical schools to compare examiners’ scoring.
Differences between schools were nearly double differences within schools; adjusting for these differences would have changed pass/fail rates by school.
Systematic comparison of inter-school differences may help to safeguard equivalence.
Introduction
Assessment equivalence, or the ‘tendency for the same assessment to yield equivalent scores or decisions when administered across different institutions or cycles of testing’ is a critical component of the chain of validity when assessments are used to inform graduation or licensing decisions [Citation1]. Poor equivalence may unfairly advantage or disadvantage particular candidates, but also threatens patient safety, as unwarranted variation in assessment contributes to variable educational outcomes, which can in turn lead to suboptimal patient care [Citation2, Citation3]. Consequently, establishing the equivalence of assessments used by different institutions to graduate or award licenses to practice should be a priority.
Inter-institutional variations in assessment practices are well described internationally [Citation4, Citation5], as well as inter-institutional variations in standard setting practices [Citation6–8]. These variations can be related to variations in students’ performances on the same test with students’ average performance varying by up to 15% between different institutions [Citation9]. Given that graduates exam scores are known to predict the subsequent outcomes of their patients [Citation10], such variations clearly raise the potential for concern.
Despite the growth of the competency-based medical education (CBME) movement [Citation11, Citation12], objective structured clinical exams (OSCEs) [Citation13] continue to significantly inform decisions to graduate or award licenses to practice within assessment programmes globally [Citation14]. Given this, it is perhaps surprising that there has been comparatively little published research into the equivalence of OSCEs, whether comparing standards between different institutions within the same country or within large-scale distributed OSCEs such as those run by major testing organisations. Some prior research has examined site-related variations in distributed OSCE, indicating mixed results. Sebok et al. [Citation15] found site related variation ranging from 2 to 17% in Canadian International Medical Graduate exams and [Citation16] found that site-related variance ranged from 0.0% to 15.3% of total variance for different competencies within a medical student graduation-level OSCE. In a controlled (video-based) comparison of simulated patient raters at different sites, Tamblyn et al. found that whilst raters within each site were fairly consistent, there was a 6.7% average difference in ratings between the study’s two sites [Citation17] found that whilst raters within each site were fairly consistent, there was a 6.7% average difference in ratings between the study’s two sites.
Perhaps one of the reasons why this topic has received comparatively limited investigation is because examiners and students in different locations are typically ‘fully-nested’ (there is no cross-over between the students seen by examiners from different sites), which limits the capacity to make comparisons even when the same OSCE stations are used at different sites. Over recent years [Citation18], have developed a method called Video-based Examiner Score Comparison and Adjustment (VESCA) which seeks to overcome this problem. VESCA involves: 1/filming a small volunteer subset of students on all stations in the OSCE; 2/asking all examiners to score a common pool of videos (examiners only score the videos specific to the station they examined); and 3/using the linkage provided by the video scores to compare (and potentially adjust) for examiner effects within statistical analyses. Yeates et al. [Citation18, Citation19] have reported on use of the technique twice from a single centre and once comparing two sites within the same institution [Citation20]. Parallel work has developed approaches to using video within OSCEs [Citation21], estimated the impact of operational parameters on the stability of resulting score adjustments [Citation22], and examined the likely contribution of potentially biasing influences due to order or sequence effects [Citation23]. Further (not yet published) work has used statistical simulation to estimate the likely accuracy of the adjusted scores which VESCA produces [Citation24]. Consequently, the technique has a growing evidence base which supports its use under defined conditions.
Given both the importance of equivalence within graduation-level assessment and the available evidence which hints at the potential for sizeable variations in examiner scoring between locations, we aimed within this study to compare the scoring of multiple groups of examiners from widely distributed UK medical schools within the same OSCE. In so doing, we aimed to both explore any apparent differences within our sample, whilst also determining ‘proof-of-concept’ of VESCA’s ability to compare examiners’ across multiple institutions and therefore its potential for use within fully representative national comparisons.
Specifically, within this current study we used VESCA to compare the scoring of otherwise unlinked (or non-overlapping) groups of examiners (examiner-cohorts; Citation25] within and between four participating medical schools, and the impact of adjusting for any apparent differences on students’ scores or pass/fail categorisation within the exam. Data were gathered from the AD-Equiv study, which was a multi-centre complex intervention trial, which aimed to enhance the authenticity, diagnosticity and equivalence of assessment within a distributed OSCE run at four locations across the United Kingdom [Citation26].
Research questions:
How does the standard of examiners’ judgements compare between:
examiner-cohorts within schools?
examiner-cohorts between medical schools?
How much influence does adjusting for examiner-cohort effects have on students’:
Overall scores?
Pass/fail/pass categorisation?
Materials and methods
Overview
Data was collected within the AD-Equiv trial [Citation26]. We ran the same 6-station OSCE in each of four medical schools, with two parallel circuits in each school. The OSCE was voluntary, formative, and additional to usual assessments. We used VESCA [Citation19] to compare examiners’ scoring between schools. We then adjusted students’ scores for examiner differences to illustrate the potential impact of examiner-variations.
Population, sampling and recruitment
The study population was final and penultimate years medical students and their examiners. Our sample included one school from each of the four UK nations (England, Northern Ireland, Scotland, and Wales) including a mix of old and new medical schools. Recruitment was performed by schools, with each aiming to recruit 24 students and 12 examiners to enable detection of a 5% scoring difference between schools.
OSCE conduct
Students and examiners were allocated to one of the two parallel circuits in their school. The OSCE comprised 6 × 13.5-min stations, with reading time between stations of between 90 s and 4 min based on each school’s usual procedures. Station content was based on the typical work of new doctors (see Citation27] and blueprinted to the UK GMC CPSA requirements. Performances were scored by examiners using the GeCoS domain-based rating scale [Citation28] which gives each station a rating between 6 and 27 points. Examiners received online training prior to the OSCE, which included scoring a (generic) practice video and comparing their scores with expert benchmarks. Station and scoring formats, blueprinting, examiner and SP training are described in detail in Appendix 1.
We administered the OSCEs sequentially at the four participating medical schools, with the lead site going first in December 2021 and then subsequent schools in January, February, and March of 2022. Students, examiners, and simulated patients participated in their usual school without any crossover between schools.
VESCA procedures
We videoed 8 volunteer students from the lead institution on all stations in the OSCE, using the filming principles established by [Citation21]. This involved placing two cameras in each station at positions and heights selected by the research team to capture the detail of the station. Where a single camera view was sufficient, this was selected; otherwise, pictures from both cameras were merged to provide examiners with the required views to judge performances. For each station, we selected the first three videos with adequate sound and picture for use in the remainder of the study.
All examiners were asked to score the 3 specific videos for their station via a secure web survey within 4 weeks of the OSCE (as per prior uses of VESCA; Citation19]. The website provided examiners with the same examiner information and scoring rubric as the live OSCE.
Analyses
Analysis had two broad components: firstly, we compared examiners scoring within and between schools; and secondly, we adjusted students’ scores based on examiner differences to illustrate the potential impact of examiner variations.
Research Question 1: Controlled comparison of examiners’ scores by examiner-cohorts and schools.
For this research question, we examined the scores which groups of examiners (‘examiner-cohorts’) gave to videos of students’ performances because this enabled a controlled comparison of the scores which different groups of examiners gave to the same performances. We used Generalized Linear Modelling in SPSS [Citation29]. In the first analysis we used a dependent variable of score and (fixed) main effects of 1/video, 2/station, and 3/examiner-cohort. To address the second part of the question, we then substituted ‘school’ for ‘examiner-cohort’ in the second analysis. Reported mean values and ninety-five percent confidence intervals were supplied by the respective models.
Research Question 2: Modelling the impact of adjusting for examiner variability on students’ scores.
For this research question, we used all score data from the live OSCE in each school and the scores examiners gave to videos, merged into one dataset. As the examiners from all schools had scored the same videos, data were partially crossed. This enabled the model to extrapolate from the crossed portion of data to adjust all students’ scores for the influence of the examiner-cohort they encountered. Data was structured so that scores allocated to videos by examiners were used to model examiner-cohort effects but did not feed directly into the adjusted scores of the students in the videos. This ensured that videoed students’ scores were adjusted in the same way as non-videoed students, based on the influence of the examiner-cohort they had encountered. Data was structured so that scores allocated to videos by examiners were used to model examiner-cohort effects but did not feed directly into the adjusted scores of the students in the videos. This ensured that videoed students’ scores were adjusted in the same way as non-videoed students, based on the influence of the examiner-cohort they had encountered. We did this using Linear Mixed Modelling (LMM), in the LME4 package [Citation30] in R [Citation31]. We again used a dependent variable of score and independent variables of student (random), station (fixed) and examiner-cohort (fixed). This produced an adjusted average score for each student (i.e. a score which represented their average performance across all stations). We visually examined the distribution of model residuals using a normal QQ-plot [Citation32] and we found a close correspondence with normality.
To summarise the potential impact of examiner variations on students’ scores, we calculated the difference between each student’s adjusted average score and their raw (unadjusted) average score. As some values were positive and some were negative, we converted these to mean absolute differences (MAD) and termed these values the ‘score adjustment’ and ‘absolute score adjustment’ respectively. We then calculated descriptive statistics.
To illustrate the potential impact of examiner variations on students’ pass/fail categorisation, we determined a cut score for the test by calculating a borderline regression [Citation33] for each station, combining these and then adding one standard error of measurement (SEM) [Citation34]. This was done using the unadjusted scores from all schools, rather than on a school-by-school basis. To ensure consistent comparisons, we used the same cut score (calculated from unadjusted scores) to categorise both raw (unadjusted) and adjusted scores. To enable alignment with students adjusted average scores, we expressed this as an average score and then compared each student’s raw (unadjusted) score and adjusted average score with the cut score. For both score adjustments and pass/fail categorisation, we calculated descriptive statistics, and compared the results by school.
Additional analyses
These analyses provided a number of additional observations which, whilst not directly relevant to the research questions, aid contextualization of the results and therefore may be of interest to some readers. These are presented along with relevant methods in appendices 2 & 3. They include comparison of performance of student cohorts in the raw (unadjusted) and adjusted data and estimates of examiner-cohort influences from the whole (linked) dataset rather than the controlled comparisons provided by the video scores.
Ethics
All participants (students, simulated patients and examiners) participated voluntarily, provided consent and had the right to withdraw without consequences. All data were treated as confidential. The study received approval from Keele University research ethics committee (ref: MH-210209)
Results
Eighty-seven students completed the OSCE. Student participation rates varied by school, ranging from 17 students (1 school) to 23 students (2 schools) to 24 students (1 school). Students raw (unadjusted) average scores were normally distributed, with a mean of 18.86 out of max 27 (61.24%)Footnote1∗ and SD of 2.18 (10.38%), ranging from 12.50 (30.95%) to 23.33 out of 27 (82.52%).
In three of the schools, twelve examiners participated. In the remaining school, one examiner had to leave the OSCE and was replaced, meaning that 13 examiners participated. Both the original and replacement examiners completed video scoring and were included in the analysis.
Eighteen videos were selected for use in video scoring (3 for each of the 6 stations). Six different students featured in the videos which were selected and had overall average scores ranging from 14.80 (41.90%) to 21.87 (75.57%), with an average of 18.00 (57.14%) and SD of 2.48 (11.81%). As a result, students in the videos spanned 65.3% of the total range of student ability. Scores given to individual video performances ranged from 7 out of 27 (4.76%) to 27 out of 27 (100%), with a mean of 18.14 (57.81%) and a standard deviation of 4.81 (22.9%), thereby comprising a representative range of performances. One examiner from one school did not score their videos; all other examiners completed video scoring.
Comparing video scores by examiner-cohorts and by schools
Scores allocated to video performances varied by examiner-cohort, ranging from 16.16 (95% CIs 14.37–17.95) for examiner-cohort 3 (in school 2), to 20.24 (18.56–21.93) for examiner-cohort 8 (School 4), Wald ChiSq = 21.48(df = 7), p = 0.003. The observed differences between the two examiner-cohorts within the same school ranged from 0.59 marks (2.8%) in School 2 to 1.86 marks (8.8%) in School 1, although none of these differences achieved statistical significance. Notably, as examiners from all examiner cohorts scored the same pool of videos, these represent controlled comparisons of the relative influence of examiners’ stringency between these examiner-cohorts. These data are illustrated in .
Figure 1. Mean scores (+95% confidence intervals) allocated to video performances by different examiner-cohorts within each school.
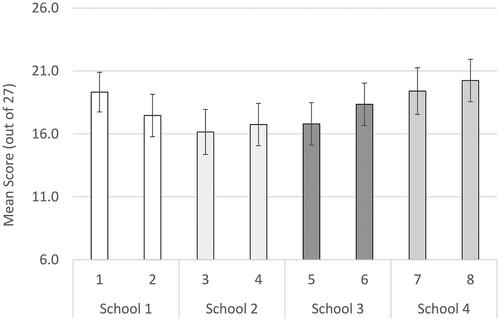
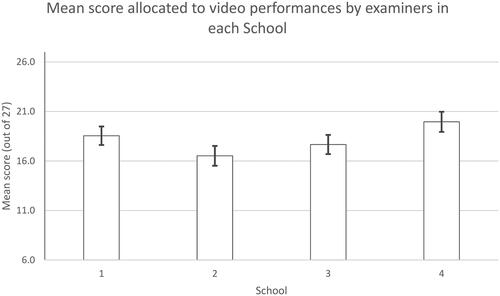
Scores allocated to videos by examiners also varied between schools: School 1, 18.55 (95% CIs 17.62–19.48); School 2, 16.52 (15.52–17.52); School 3: 17.67 (16.70–18.64); School 4: 19.96 (18.94–20.97), Wald Chi Sq 23.87(df 3), p < 0.001. Consequently, there was a difference of 19.96–16.52 = 3.44 marks (16.3%) between the video scores in the highest and lowest scoring schools. As a result, differences between schools were approaching double the magnitude of the observed (insignificant) differences between examiner-cohorts within schools. These data are illustrated in .
Figure 2. Mean scores (+95% confidence intervals) allocated to video performances by examiners within each school.
Linking video and live data to compare examiner effects and adjust students’ scores
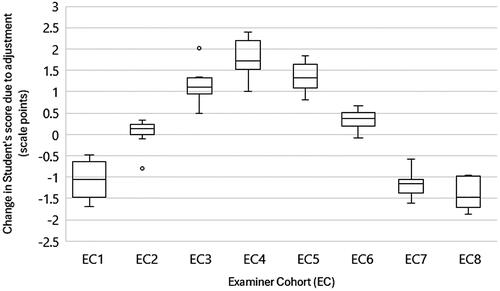
Details of examiner-cohort estimates can be found in Appendix 2. The pooled standard error for examiner-cohorts was 0.59 scale points (2.81%), giving 95% confidence intervals for the adjusted scores of ±1.16 scale points (±5.51%). Adjustments to students’ scores (i.e. the adjusted average score minus the raw (unadjusted) average value for each student) ranged from −1.86 marks (-8.86%) to +2.40 (11.42%%). The median absolute score adjustment (i.e. ignoring whether score increased or decreased) was 1.10 marks (5.26%), with an interquartile range of 0.90 (4.30%) from a 1st quartile of 0.60 marks (2.87%) to a 3rd quartile of 1.50 marks (7.17%). A boxplot of score adjustments by examiner cohorts is depicted in . Consistent with the observed variation in examiners’ scoring by school, score adjustments also varied by school: School 1 had a median score adjustment of −0.53 marks (-2.55%), IQR: −0.98 (-4.65%) to +0.12 marks (+0.59%); School 2 median adjustment +1.49 marks (+7.08%), IQR: +1.09 marks (+5.19%) to +1.76 marks (+8.38%); School 3 median adjustment +0.67 marks (+3.19%), IQR 0.36 marks (1.74%) to +1.27 marks (+6.06%); School 4 median −1.15 marks (-5.48%), IQR −1.52 marks (-7.24%) to −1.05 marks (-5.00%).
Figure 3. Boxplot of students’ score adjustments by examiner-cohort (EC), depicting minimum, 1st quartile, median, 3rd quartile, maximum.
Impact of score adjustment on students’ pass/fail
The standard setting procedure produced a cut score of 16.62 marks out of 27 (50.58%). The total student failure rate in raw (unadjusted) scores was 13 out of 87 students (14.94%), rising to 14 out of 87 (16.09%) for students’ adjusted scores. Eight students (9.20%) changed their classification from a fail to a pass, whereas nine students (10.34%) changed their categorisation from a pass to a fail (see ). The impact of these changes in students’ categorisation varied between schools. Percentage failure rates by school for unadjusted (raw) and adjusted scores were: school 1 unadjusted (raw) score failure rate 1 student (4.16%), adjusted score failure rate 5 students (20.83%); school 2 unadjusted (raw) score failure rate 9 students (39.13%), adjusted score failure rate 2 students (8.70%); school 3 unadjusted (raw) score failure rate 3 students (17.65%) failure rate, adjusted score failure rate 2 students (11.76%); school 4 unadjusted (raw) score failure rate 0 students (0.00%), adjusted score failure rate 5 students (21.74%). See for these data.
Figure 4. Relationship between students’ mean unadjusted and adjusted scores to the OSCE pass mark.
Solid black lines indicate cut score.
EC indicates examiner cohort.
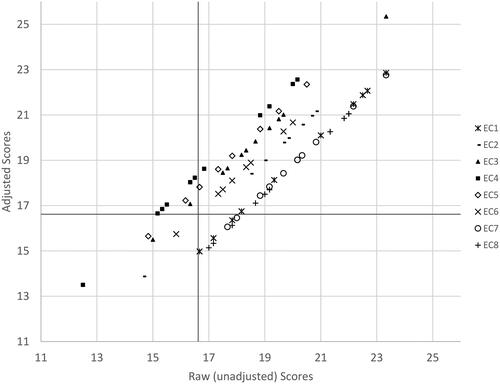
Table 1. Influence of score adjustment on students’ categorisation (pass vs. fail) and rank position in the OSCE.
Discussion
Summary of results
In controlled comparisons of video-based scores, examiners’ scoring varied between schools by up to 16.3% of the scale. Variations between schools were nearly double those within schools (8.8%). Adjusting students’ scores to indicate the potential impact of these examiner variations produced a median change in students’ score of ±5.39%, ranging from adjustments of −8.86% to +11.42%. Score adjustment substantially altered the pass/fail categorisation rate by school, ranging from a raw (unadjusted) score failure rate of 39.1% of students to an adjusted score failure rate of 8.70% in school 2, to a raw (unadjusted) score student failure rate of 0.0% to an adjusted score failure rate of 21.73% in school 4.
Theoretical implications
Interpretation of these results depends on both the extent to which they are indicative of wider variations in examiners’ judgements between medical schools in the UK (or not) and assumptions about the implications of any such variations. Our data were collected in a formative setting from volunteer students and examiners who performed an additional OSCE for research and may therefore not implicitly generalise to judgements in mandatory summative assessments. As a result, our findings may not reflect the wider examiner population in each school. Nonetheless, larger variations (up to 25%) have previously been observed between UK medical schools in their standard setting for knowledge testing items [Citation6]. Moreover, examiner variability in OSCEs has previously been shown to be capable of influencing pass-fail outcomes in a similar manner to that which we have observed [Citation35]. Consequently, whilst further research will be required to determine whether this finding replicates in summative contexts, we suggest that the 16.3% difference observed here is enough to at least indicate the potential for important differences between examiners’ judgements in different UK medical schools which therefore warrants further investigation.
Next is whether if such variations do occur, they present a meaningful challenge to assessment validity. Medical schools set their own curricula and assessment strategies so students from different schools may plausibly have some differences in ability depending on the emphasis of their curriculum. Equally, elite schools may consider it their prerogative to set standards which are more stringent than are strictly required. Notably, prior work comparing the interaction of student performance and standard setting has suggested that applying the standards of elite schools to lower attaining schools could dramatically alter the failure rate in knowledge tests [Citation9]. Nonetheless, the UK’s regulatory framework (the GMC’s Clinical and Professionals Skills Assessment (CPSA) [Citation36] exists to ensure that all new medical graduates meet a common threshold prior to entering practice. As the stations used in this OSCE were all based on tasks which are typical of the work of new doctors, our findings may potentially indicate that examiners in different medical schools hold different expectations of new medical graduates. If confirmed, this might then challenge whether a common threshold is being applied.
Theoretically, it is interesting to consider how differences in conceptions of competence might arise between medical schools. Competence is a social construct, which emerges from the shared expectations of a community [Citation37]. Ideas of professionalism have been shown to vary between regions [Citation38] and so it is plausible that conceptions of competence could show similar variation. Recent research has estimated large differences (Cohen’s d = 0.94–1.92) in the skills and abilities of newly graduated doctors between the most and least popular training regions of the UK [Citation39], apparently through the differential influence of selection. Students in UK schools differ in their performance both on knowledge tests [Citation9], and long-term outcomes such as postgraduate examination pass rates [Citation40]. This is important as prior research has suggested that assessors’ expectations of competence are influenced by the typical performance of the cohort of junior doctors with whom they work [Citation8]. Consequently, if examiners conceptions of competence align to the normative performance of new doctors with whom they work, this could plausibly lead to variations in graduation-level expectations between examiners in different regions.
Practical implications
In practical terms, if replicated through further research, these findings could potentially pose some challenge to the equivalence of assessments. As the UK’s regulatory framework values equivalence, it would be desirable to reduce inter-institutional examiner variation. In broad terms, this could be achieved through examiner calibration/faculty development prior to OSCEs or through post hoc score adjustment after OSCEs. Generally, faculty development is considered preferable [Citation41] as part of a general focus on OSCE quality. Despite this, prior research has generally found limited benefits to examiner training [Citation42], although more recently [Citation43], have shown moderate benefit from faculty development. Conversely, less research has considered the potential for score adjustment. Our recent (submitted, unpublished) research has shown that when the average standard of examiners in different locations varies by 10–20%, score adjustment using VESCA is likely to make 80—90% of students’ scores more accurate, although the remainder of students’ scores (10–20%) may become less accurate [Citation24]. This work suggested that whilst score adjustments in similar scenarios will reduce overall error in the assessment considerably, not all students’ scores will be made more accurate. Consequently, the preferred approach may be to focus on faculty development, monitor variation between locations as part of quality assurance, whilst reserving the right to adjust scores if sufficient variation between sites or locations occurs. Alternatively, in view of the limitations of adjusted scores, assessment committees may prefer to use them as a means to illustrate the impact of examiner variability even if they don’t wish to adopt them as the basis for assessment decisions. Whilst this position may seem prudent, it ignores the degree of error which is inherent in raw (unadjusted) scores such as we have demonstrated. VESCA appears to offer a useful method of comparing examiners judgements between locations, but (within the UK context) would require alignment of some or all stations between schools in order to be viable in practice.
Limitations
Our study has some limitations. Firstly, it was conducted in a formative setting. This may have affected both the level of preparation and effort students exerted, so their performances may have been submaximal. The study recruited a comparatively small volunteer sample of students and examiners in each school, who may therefore not have fully represented the wider populations from which they were drawn. The OSCE used a novel station format, which may have affected both students’ performances and examiners’ judgements. The marking format (GeCos) was not previously familiar to examiners in all schools prior to the study. This limitation was mitigated through video-based training for examiners (including practice scoring using the GeCos marking format) and on-line orientation for students. Whilst these limitations reduce the degree to which our findings implicitly generalise to the wider population, they are not expected to reduce the internal validity of our observations. We performed video-based training to align simulated patients in different schools, and whilst most aspects of the OSCE conduct were stipulated, we allowed small local variations to align with the context in each school. We can’t definitively exclude the possibility that these differences could have produced some degree of confounding, however, the observation that examiners scoring differed between schools on the controlled video-based comparisons makes this unlikely. The linear mixed model which we used to make score adjustments accounted for differences in the stringency of examiner-cohorts, but not differences in the spread of scores, which may have further enhanced the accuracy of modelling. Whilst recent work by [Citation35] has modelled similar effects in other contexts, we note that this required a much larger dataset than we collected in order to produce reliable estimates and that these effects accounted for a smaller proportion of variance than examiner stringency. Nonetheless, future work could seek to model such effects between examiner-cohorts using either linear mixed modelling or three parameter item response theory.
Future research
Given the potential implications of our findings, we recommend that larger scale comparisons of examiners’ scoring of graduation level performances in a summative context should seek to determine the replicability of our findings.
Conclusion
Within this formative, voluntary multi-school OSCE, examiners’ scoring of the same OSCE performances varied between different schools by up to 16.3%. Whilst these findings warrant replication in larger summative contexts, they could have significant implications for the equivalence of graduation-level performance assessment within the UK. VESCA offered a useful method to compare examiners’ judgements between schools, which could either inform quality assurance and faculty development or potentially be used to adjust students’ scores.
Supplemental Material
Download MS Word (83.2 KB)Acknowledgements
We would like to thank all of the students, examiners and simulated patients who took part in the study; the assessment and clinical skills staff in each of the four participating schools for their work in the pragmatics of delivering the shared OSCE; and the IT and AV teams at the lead site for their work in facilitating the video filming and preparation for use in the study.
Disclosure statement
No potential conflict of interest was reported by the author(s).
Data availability statement
Anonymous score data are available from the authors based on reasonable request.
Additional information
Funding
Notes on contributors
Peter Yeates
Peter Yeates, Keele University, School of Medicine, [email protected]
Adriano Maluf
Adriano Maluf, de Montford University, [email protected]
Gareth McCray
Gareth McCray, Keele University, School of Medicine. [email protected]
Ruth Kinston
Ruth Kinston, Keele University, School of Medicine. [email protected]
Natalie Cope
Natalie Cope, Keele University, School of Medicine [email protected]
Kathy Cullen
Kathy Cullen, Queens University Belfast, School of Medicine, Dentistry and Biomedical Sciences [email protected]
Vikki O’Neill
Vikki O’Neill, Queens University Belfast, School of Medicine, Dentistry and Biomedical Sciences Vikki [email protected]
Aidan Cole
Aidan Cole, Queens University Belfast, School of Medicine, Dentistry and Biomedical Sciences [email protected]
Ching-wa Chung
Ching-wa Chung, University of Aberdeen, School of Medicine, Medical Sciences and Nutrition [email protected]
Rhian Goodfellow
Rhian Goodfellow, Cardiff University, School of Medicine [email protected]
Rebecca Vallender
Rebecca Vallender, Cardiff University, School of Medicine [email protected]
Sue Ensaff
Sue Ensaff, Cardiff University, School of Medicine [email protected]
Rikki Goddard-Fuller
Rikki Goddard-Fuller, Christie Education, Christie Hospitals NHS Foundation Trust [email protected]
Robert McKinley
Robert McKinley, Keele University, School of Medicine [email protected]
Notes
1 As the assessment scale ranged from a minimum of 6 to a maximum of 27 points (range = 27 – 6 = 21 points), percentages of absolute scores were calculated by subtracting 6 points, then dividing by 21, before multiplying the result by 100 (Percentage score = (score-6)/21 x 100). Percentage differences between numbers were calculated by simply dividing the difference between the two scores by 21 and multiplying by 100 (relative percentage = (score A – score B)/21 x 100).
References
- Norcini J, Anderson MB, Bollela V, et al. 2018 Consensus framework for good assessment. Med Teach. 2018;40(11):1102–1109. doi: 10.1080/0142159X.2018.1500016
- Holmboe ES, Kogan JR. Will any road get you there? Examining warranted and unwarranted variation in medical education. Acad Med. 2022;97(8):1128–1136. doi: 10.1097/ACM.0000000000004667
- Kogan JR, Conforti LN, Iobst WF, et al. Reconceptualizing variable rater assessments as both an educational and clinical care problem. Acad Med. 2014;89(5):721–727. doi: 10.1097/ACM.0000000000000221
- Hernandez CA, Daroowalla F, Larochelle JS, et al. Determining grades in the internal medicine clerkship: results of a national survey of clerkship directors. Acad Med. 2021;96(2):249–255. doi: 10.1097/ACM.0000000000003815
- MacDougall M. Variation in assessment and standard setting practices across UK undergraduate medicine and the need for a benchmark. Int J Med Educ. 2015;6:125–135. doi: 10.5116/ijme.560e.c964
- Taylor CA, Gurnell M, Melville CR, et al. Variation in passing standards for graduation-level knowledge items at UK medical schools. Med Educ. 2017;51(6):612–620. doi: 10.1111/medu.13240
- Ward H, Chiavaroli N, Fraser J, et al. Standard setting in Australian medical schools. BMC Med Educ. 2018;18(1):80. doi: 10.1186/s12909-018-1190-6
- Yeates P, Cope N, Luksaite E, et al. Exploring differences in individual and group judgements in standard setting. Med Educ. 2019;53(9):941–952. doi: 10.1111/medu.13915
- Hope D, Kluth D, Homer M, et al. Variation in performance on common content items at UK medical schools. BMC Med Educ. 2021;21(1):323. doi: 10.1186/s12909-021-02761-1
- Norcini JJ, Boulet JR, Opalek A, et al. The relationship between licensing examination performance and the outcomes of care by international medical school graduates. Acad Med. 2014;89(8):1157–1162. doi: 10.1097/ACM.0000000000000310
- Frank JR, Snell LS, Cate O. T, et al. Competency-based medical education: theory to practice. Med Teach. 2010;32(8):638–645. doi: 10.3109/0142159X.2010.501190
- Hawkins RE, Welcher CM, Holmboe ES, et al. Implementation of competency-based medical education: are we addressing the concerns and challenges? Med Educ. 2015;49(11):1086–1102. (doi: 10.1111/medu.12831
- Newble D. Techniques for measuring clinical competence: objective structured clinical examinations. Med Educ. 2004;38(2):199–203. doi: 10.1046/j.1365-2923.2004.01755.x
- Boursicot K, Kemp S, Wilkinson T, et al. Performance assessment: consensus statement and recommendations from the 2020 Ottawa Conference. Med Teach. 2021;43(1):58–67. doi: 10.1080/0142159X.2020.1830052
- Sebok SS, Roy M, Klinger D. A, et al. Examiners and content and site: Oh My! A national organization’s investigation of score variation in large-scale performance assessments. Adv Health Sci Educ Theory Pract. 2015;20(3):581–594. doi: 10.1007/s10459-014-9547-z
- Floreck LM, Champlain AF. Assessing sources of score variability in a multi-site medical performance assessment: an application of hierarchical linear modeling. Acad Med. 2001;76(10 Suppl):S93–S95. doi: 10.1097/00001888-200110001-00031
- Tamblyn RM, Klass DJ, Schnabl GK, et al. Sources of unreliability and bias in standardized‐patient rating. Teach Learn Med. 1991;3(2):74–85. doi: 10.1080/10401339109539486
- Yeates P, Cope N, Hawarden A, et al. Developing a video-based method to compare and adjust examiner effects in fully nested OSCEs. Med Educ. 2019;53(3):250–263. doi: 10.1111/medu.13783
- Yeates P, Moult A, Cope N, et al. Measuring the effect of examiner variability in a multiple-circuit objective structured clinical examination (OSCE). Acad Med. 2021;96(8):1189–1196. doi: 10.1097/ACM.0000000000004028
- Yeates P, Maluf A, Cope N, et al. Using video-based examiner score comparison and adjustment (VESCA) to compare the influence of examiners at different sites in a distributed objective structured clinical exam (OSCE). BMC Med Educ. 2023;23(1):803. doi: 10.1186/s12909-023-04774-4
- Yeates P, Moult A, Lefroy J, et al. Understanding and developing procedures for video-based assessment in medical education. Med Teach. 2020;42(11):1250–1260. doi: 10.1080/0142159X.2020.1801997
- Yeates P, McCray G, Moult A, et al. Determining the influence of different linking patterns on the stability of students’ score adjustments produced using Video-based Examiner Score Comparison and Adjustment (VESCA). BMC Med Educ. 2022;22(1):41. doi: 10.1186/s12909-022-03115-1
- Yeates P, Moult A, Cope N, et al. Determining influence, interaction and causality of contrast and sequence effects in objective structured clinical exams. Med Educ. 2022;56(3):292–302. doi: 10.1111/medu.14713
- Yeates P, McCray G. n.d. Investigating the accuracy of adjusting for examiner differences in multi-centre Objective Structured Clinical Exams (OSCEs). A simulation study of Video-based Examiner Score Comparison and Adjustment (VESCA). In submission with BMC Medical Education – pre-print available at: https://www.researchsquare.com/article/rs-4151118/v1.
- Yeates P, Sebok-Syer SS. Hawks, Doves and Rasch decisions: understanding the influence of different cycles of an OSCE on students’ scores using Many Facet Rasch Modeling. Med Teach. 2017;39(1):92–99. doi: 10.1080/0142159X.2017.1248916
- Yeates P, Maluf A, Kinston R, et al. Enhancing Authenticity, Diagnosticity and Equivalence (AD-Equiv) in multi-centre OSCE exams in Health Professionals Education. Protocol for a Complex Intervention Study. BMJ Open. 2022;12(12):e064387. doi: 10.1136/bmjopen-2022-064387
- Yeates P, Maluf A, Kinston R, et al. A realist evaluation of how, why and when objective structured clinical exams (OSCEs) are experienced as an authentic assessment of clinical preparedness. Med Teach. 2024:1–9. doi: 10.1080/0142159X.2024.2339413
- Lefroy J, Gay SP, Gibson S, et al. Development and face validation of an instrument to assess and improve clinical consultation skills. Int J Clin Skills. 2011;5(2):115–125.
- IBM Corporation. 2019. IBM SPSS Statistics for Windows (26).
- Bates D, Mächler M, Bolker B, et al. Fitting linear mixed-effects models using lme4. J Stat Soft. 2015;67(1):1–48. doi: 10.18637/jss.v067.i01
- Core Team R. 2021. R: A language and environment for statistical computing. R Foundation for Statistical Computing. https://www.r-project.org/.
- Fox J. 2015. Applied regression analysis and generalized linear models. 3rd Edition. SAGE Publications, Inc.
- Downing SM, Tekian A, Yudkowsky R. Procedures for establishing defensible absolute passing scores on performance examinations in health professions education procedures for establishing defensible absolute passing scores on performan. Teach Learn Med. 2006;18(1):50–57. doi: 10.1207/s15328015tlm1801
- Tighe J, McManus IC, Dewhurst NG, et al. The standard error of measurement is a more appropriate measure of quality for postgraduate medical assessments than is reliability: an analysis of MRCP(UK) examinations. BMC Med Educ. 2010;10(1):40. doi: 10.1186/1472-6920-10-40
- Homer M. Towards a more nuanced conceptualisation of differential examiner stringency in OSCEs. Adv in Health Sci Educ. 2023; doi: 10.1007/s10459-023-10289-w
- GMC. n.d. Requirements for the MLA clinical and professional skills assessment. [accessed 2023 December 20]. https://www.gmc-uk.org/education/medical-licensing-assessment/uk-medical-schools-guide-to-the-mla/clinical-and-professional-skills-assessment-cpsa.
- Bleakley A. Broadening conceptions of learning in medical education: the message from teamworking. Med Educ. 2006;40(2):150–157. doi: 10.1111/j.1365-2929.2005.02371.x
- Chandratilake M, Mcaleer S, Gibson J. Cultural similarities and differences in medical professionalism: a multi-region study. Med Educ. 2012;46(3):257–266. doi: 10.1111/j.1365-2923.2011.04153.x
- Beck C, Brown C. Could the UK Foundation Programme training post allocation process result in regional variations in the knowledge and skills of Foundation doctors? A cross-sectional study. Health Sci Rep. 2020;3(4):e201. doi: 10.1002/hsr2.201
- McManus IC, Harborne AC, Horsfall HL, et al. Exploring UK medical school differences: the MedDifs study of selection, teaching, student and F1 perceptions, postgraduate outcomes and fitness to practise. BMC Med. 2020;18(1):136. doi: 10.1186/s12916-020-01572-3
- Holmboe ES, Ward DS, Reznick RK, et al. Faculty development in assessment : the missing link in competency-based medical education. Acad Med. 2011;86(4):460–467. doi: 10.1097/ACM.0b013e31820cb2a7
- Cook D. A, Dupras DM, Beckman TJ, et al. Effect of rater training on reliability and accuracy of mini-CEX scores: a randomized, controlled trial. J Gen Intern Med. 2009;24(1):74–79. doi: 10.1007/s11606-008-0842-3
- Kogan JR, Dine CJ, Conforti LN, et al. Can rater training improve the quality and accuracy of workplace-based assessment narrative comments and entrustment ratings? A randomized controlled trial. Acad Med. 2023;98(2):237–247. doi: 10.1097/ACM.0000000000004819